Stock Market Performance and Pension Fund Investment ... · Stock Market Performance and Pension...
27
Stock Market Performance and Pension Fund Investment Policy: Rebalancing, Free Float, or Market Timing? ∗ Jacob A. Bikker, a,b Dirk W.G.A. Broeders, a and Jan de Dreu c a Supervisory Policy Division, De Nederlandsche Bank b School of Economics, University of Utrecht c Global Banking & Markets, Royal Bank of Scotland This article examines the impact of stock market perfor- mance on the investment policy of pension funds. We find that stock market performance affects the asset allocation of Dutch pension funds in two ways. In the short term, outperformance of equities over bonds and other investment categories auto- matically results in a higher actual equity allocation (and vice versa), as pension funds do not continuously rebalance their investment portfolios. Each quarter, pension funds rebalance, on average, around 39 percent of excess equity returns, leav- ing 61 percent for free floating. In the medium term, outper- formance of equities induces pension funds to increase their strategic equity allocation (and vice versa). These findings sug- gest that the investment policies of pension funds are partially driven by the cyclical performance of the stock market. We also find that rebalancing is much stronger after negative equity ∗ The authors are grateful to an anonymous referee, Guus Boender, Aerdt Houben, Theo Nijman, and seminar participants at the DNB research seminar of February 19, 2008, the Rotman International Centre for Pension Manage- ment 2008 (Toronto), the Midwest Finance Association 2008 (San Antonio), and the SUERF Colloquium “New Trends in Asset Management” 2008 (Munich) for valuable comments and suggestions, and to Jack Bekooij for excellent support in constructing the data set. The views expressed in this article are personal and do not necessarily reflect those of DNB or RBS. Author contact: Bikker and Broeders: De Nederlandsche Bank, Supervisory Policy Division, Strategy Depart- ment, P.O. Box 98, NL-1000 AB Amsterdam, The Netherlands; Tel: + 31 20 524 2352; E-mails: [email protected], [email protected]. De Dreu: Royal Bank of Scotland, Global Banking & Markets, 135 Bishopsgate, London, EC2M 3UR, United Kingdom; Tel: +44 20 3361 1050; E-mail: [email protected]. 53
Transcript of Stock Market Performance and Pension Fund Investment ... · Stock Market Performance and Pension...

Stock Market Performance and Pension FundInvestment Policy: Rebalancing, Free Float, or
Market Timing?∗
Jacob A. Bikker,a,b Dirk W.G.A. Broeders,a and Jan de Dreuc
aSupervisory Policy Division, De Nederlandsche BankbSchool of Economics, University of Utrecht
cGlobal Banking & Markets, Royal Bank of Scotland
This article examines the impact of stock market perfor-mance on the investment policy of pension funds. We find thatstock market performance affects the asset allocation of Dutchpension funds in two ways. In the short term, outperformanceof equities over bonds and other investment categories auto-matically results in a higher actual equity allocation (and viceversa), as pension funds do not continuously rebalance theirinvestment portfolios. Each quarter, pension funds rebalance,on average, around 39 percent of excess equity returns, leav-ing 61 percent for free floating. In the medium term, outper-formance of equities induces pension funds to increase theirstrategic equity allocation (and vice versa). These findings sug-gest that the investment policies of pension funds are partiallydriven by the cyclical performance of the stock market. We alsofind that rebalancing is much stronger after negative equity
∗The authors are grateful to an anonymous referee, Guus Boender, AerdtHouben, Theo Nijman, and seminar participants at the DNB research seminarof February 19, 2008, the Rotman International Centre for Pension Manage-ment 2008 (Toronto), the Midwest Finance Association 2008 (San Antonio), andthe SUERF Colloquium “New Trends in Asset Management” 2008 (Munich) forvaluable comments and suggestions, and to Jack Bekooij for excellent supportin constructing the data set. The views expressed in this article are personaland do not necessarily reflect those of DNB or RBS. Author contact: Bikker andBroeders: De Nederlandsche Bank, Supervisory Policy Division, Strategy Depart-ment, P.O. Box 98, NL-1000 AB Amsterdam, The Netherlands; Tel: + 31 20 5242352; E-mails: [email protected], [email protected]. De Dreu: Royal Bankof Scotland, Global Banking & Markets, 135 Bishopsgate, London, EC2M 3UR,United Kingdom; Tel: +44 20 3361 1050; E-mail: [email protected].
53
54 International Journal of Central Banking June 2010
returns, indicating that pension funds respond asymmetri-cally to stock market shocks. Furthermore, investment poli-cies of large funds deviate from those of small funds: largefunds hold more equity and their equity allocation is morestrongly affected by actual equity returns, reflecting less rebal-ancing. The largest funds react highly asymmetrically to equityreturns. Their positive excess equity returns lead to adjust-ments in equity portfolios of more than 100 percent, reflecting“overshooting” of free floating, or positive-feedback trading.Apparently, managers of large funds have greater risk toler-ance, particularly in bull markets.
JEL Codes: G11, G23.
1. Introduction
The optimal equity allocation of pension funds is subject to consid-erable debate. A high percentage of assets invested in equities resultsin significant exposure of pension wealth to fluctuations in stock mar-ket prices. While nominal defined-benefit pension liabilities can behedged by investing in the replicating portfolio of fixed-income secu-rities, considerable equity holdings may be optimal when indexationof benefits is contingent on the funding ratio of the pension fund.1
During the 1990s abundant equity returns led to premium reductionsand even contribution holidays for pension plan sponsors. However,the risks of equity holdings surfaced after the collapse of the stockmarket in 2000–02, which resulted in large losses for pension funds.In reaction, pension benefits were curtailed and contributions steeplyincreased. This episode raised a debate on the investment strategiesof Dutch pension funds and, particularly, on their exposure to equitymarkets.
1Nominal defined-benefit pension liabilities can be hedged by investing in thereplicating portfolio of fixed-income securities such as nominal government bondsand interest rate swaps. In contrast, defined-benefit pension liabilities that arefully indexed to prices can be replicated by investing in inflation-linked bonds. Inmany Dutch defined-benefit pension deals, indexation is contingent on the fund-ing ratio of the pension fund. The market value of this contingent indexation canbe derived using option-pricing theory. In this case it might be optimal to haveconsiderable equity exposure; see, e.g., Broeders (2006).

Vol. 6 No. 2 Stock Market Performance 55
Table 1. Pension Fund Strategic and Actual AssetAllocation (1999:Q1–2006:Q4; in %)
Average AverageAsset Strategic Asset Standard Actual Asset Standard
Classes Allocation Deviation Allocation Deviation
Equities 42 15 41 15Bonds 39 20 45 19Real Estate 10 6 10 6Cash 1 11 1 10Other 8 11 3 11Total 100 100
Note: The asset shares are averages over Dutch pension funds, weighted by totalinvestments.Source: De Nederlandsche Bank.
The investment strategy of Dutch pension funds is of key impor-tance to society, as it involves more than €600 billion in assets,or over €37,500 per inhabitant. The way in which these assets areinvested has a significant influence on the level of required premiumsor final benefits. A 1 percent lower annual return over the life cycleof a typical worker translates into 27 percent lower accumulatedpension assets.2 Consequently, one of the most important responsi-bilities of pension funds’ trustees is to maximize the expected returnon assets at an acceptable level of risk, e.g., measured in terms ofthe probability of underfunding.
This study investigates whether stock market performance influ-ences pension funds’ investment policies. In particular, we examinetwo ways in which stock market performance impacts the equityallocation of pension funds: (i) in the short term, as a result of mar-ket timing or imperfect rebalancing, and (ii) in the medium term,as a result of adjustments to the strategic asset allocation.
Table 1 presents the asset allocation of Dutch pension funds overthe following five broad classes: equities, bonds, real estate, cash, andother assets. Pension fund investment policy includes the strategic
2The three main components determining the costs of pensions are the qualityof the pension scheme, the rate of return on investments, and administrative andinvestment costs (see also Bikker and De Dreu 2009).

56 International Journal of Central Banking June 2010
asset allocation decision, which refers to choosing the investmentpercentages in each asset class. Of the aforementioned asset classes,equities have the highest expected return but also the highest volatil-ity. For most pension funds, equities are the largest asset category.Consequently, equity allocation is one of the key policy variablesdetermining the risk-return profile of a given pension fund.
Pension funds generally determine their strategic asset allocationpolicies using asset and liability management studies, in which theyconsider long-term expected returns, return variances, and covari-ances of broad asset classes, given the size and characteristics oftheir pension liabilities; see, e.g., Campbell and Viceira (2002).3
The strategic asset allocation is typically set on a three- to five-year horizon. For many pension funds, the strategic asset allocationincludes bandwidths for the actual asset allocation to drift. For thispurpose a tactical risk budget can be made available. These band-widths are chosen in such a way that the maximum ex ante trackingerror does not exceed a given threshold. This tracking error (TE)is usually defined as TE = w′Σw, where w is the vector of actualportfolio weights minus the vector of strategic portfolio allocationand Σ is the variance-covariance matrix. In this article, rebalancingis interpreted as a return to the midpoint of these bandwidths.
As investment opportunities change over time, deviations inexpected returns from their long-term averages may warrant changesin the investment mix.4 Choosing actual portfolio weights that devi-ate from the strategic asset allocation is known as “tactical assetallocation” or “market timing.” Market timing refers to taking short-term (informed) bets on the relative asset class returns. It can beimplemented through actually buying and selling the underlyingsecurities, although in practice, derivatives are also commonly usedas an efficient way to change a fund’s asset allocation. However, thepotential extra return through market timing is limited, as indicated
3Shefrin and Statman (2000) use behavioral finance theory to explain the assetallocation of pension funds. They argue that investors build portfolios as pyra-mids of assets, layer by layer. In contrast to mean-variance theory, covariancebetween asset classes is generally ignored, resulting in suboptimal portfolios.
4Predictability in expected asset returns may affect the optimal portfoliochoice of investors with long horizons (see, e.g., Barberis 2000; Pastor and Stam-baugh 2001).

Vol. 6 No. 2 Stock Market Performance 57
Figure 1. The Impact of Stock Market Performance onEquity Allocation
also by the so-called fundamental law of active management; seeGrinold and Kahn (1999).5
This study examines the impact that higher or lower returns onstocks compared with the other asset categories have on the equityallocation of pension funds. To the best of our knowledge, this is thefirst study that examines this relationship. Figure 1 shows the var-ious factors that influence the equity allocation of pension funds.Over the long term, equity allocation is determined by a fund’sstrategic asset allocation. However, several factors influence assetallocation in the short to medium term. We distinguish the follow-ing three equity investment strategies that pension funds may use to
5This law states that the information ratio equals the information coefficienttimes the square root of the number of independent investment decisions. Theinformation ratio is the risk-adjusted excess return over a passive investmentstrategy. An information ratio of 0.5, which is considered high, requires that assetmanagers earn a 50-basis-points excess return (“alpha”) per 1 percent of residualrisk on a yearly basis. The information coefficient measures the skill of the assetmanager and is defined as the correlation between his forecasts on investmentreturns and the actual outcomes. The number of independent investment deci-sions is four, if the pension fund makes quarterly market-timing decisions. Togenerate a market-timing information ratio of 0.5 requires, in that case, an infor-mation coefficient of 0.25, which is considered extremely high. It would requirethe asset manager to forecast the direction of the stock market correctly 63 out of100 times and adjust his portfolio likewise. Therefore, the potential added value ofmarket timing is limited. In addition, such a strategy would involve (substantial)transaction costs.
58 International Journal of Central Banking June 2010
respond to positive or negative stock market returns: rebalancing,free float, and market timing.
Rebalancing refers to the investment process applied to ensurethat a fund’s actual equity allocation continuously equals its strate-gic equity allocation, which implies selling equities after relativelyhigh stock market returns and buying after relatively low equityreturns. This might also be indicated as a form of negative-feedbacktrading, referring to buying past losers and selling past winners; see,e.g., Lakonishok, Schleifer, and Vishny (1992). This form of trad-ing is commonly a part of the argument that institutional investorsstabilize asset prices. By contrast, we use free float to indicate a pas-sive investment strategy, in which pension funds allow their equityallocation to drift with market developments.6 Finally, as mentionedabove, market timing refers to a temporary higher or lower weight-ing of equities (or other asset classes) relative to the pension fund’sstrategic asset allocation, motivated by short-term return expec-tations. Note that where no equity trades are made, it is difficultto distinguish between free float (passive management) and markettiming (active management), as allowing the asset allocation to driftcould be seen as an active investment decision.
A number of studies show that strategic asset allocation domi-nates portfolio performance. In particular, strategic asset allocationis shown to explain more than 90 percent of the variability in pensionfund returns over time, while the additional variation explained bymarket timing is less than 5 percent (Blake, Lehmann, and Timmer-mann 1999; Brinson, Hood, and Beebower 1986; Brinson, Singer, andBeebower 1991; Ibbotson and Kaplan 2000). Moreover, in line withthe efficient-market theory, evidence shows that pension funds areunsuccessful in exploiting market timing to generate excess returns.In particular, market timing is shown to cause an average loss of 20–66 basis points per year (Blake, Lehmann, and Timmermann 1999;
6Pension funds can rebalance continuously, thereby ensuring that their assetallocation always matches their strategic asset allocation. However, pension fundsare known to use rebalancing strategies, which have some free-float component.Examples include calendar rebalancing, whereby pension funds rebalance theirportfolio back to its strategic weights at regular intervals, and band rebalancing,whereby pension funds create bands around each asset class and rebalance theirportfolio as soon as one asset class breaches its band.

Vol. 6 No. 2 Stock Market Performance 59
Brinson, Hood, and Beebower 1986; Brinson, Singer, and Beebower1991; Daniel et al. 1997).
While a number of empirical studies examine the impact of invest-ment policy on returns,7 very few papers investigate the impact ofmarket developments on investment policy. Blake, Lehmann, andTimmermann (1999) and Kakes (2006) report a negative correla-tion between asset class returns and net cash flows to the corre-sponding asset class, which points to rebalancing. However, Blake,Lehmann, and Timmermann (1999) also find that the asset allocationfor UK pension funds drifts toward asset classes that performed rela-tively well, in line with a free-float strategy. Apparently, UK pensionfunds only partly rebalanced their investments in response to differentreturns across asset categories.Hence, the degree of rebalancing versusfree float in pension fund asset allocation remains an open question.
This article uses quarterly data from Dutch pension funds over1999:Q1–2006:Q4. Although this period is relatively short, it con-tains a significant stock market bubble as well as a burst. Figure 2presents a preview of the empirical results, depicting the strategicand the actual equity allocation for Dutch pension funds, as well asthe MSCI World Index. Three patterns stand out from this figure.First, the actual equity allocation tends to have a pattern similarto the MSCI World Index but with some reversion to the strategicasset allocation. Generally, actual equity allocation increases whenthe stock market goes up, and vice versa. The main explanation forthis pattern is that pension funds tend to rebalance their asset allo-cation only partly in response to changes in the value of their equityportfolio.
Second, figure 2 points to interaction between stock marketperformance and strategic asset allocation. The strategic equityallocation appears to follow the performance of the equity market,
7The literature investigating the effectiveness of stock picking and market tim-ing in improving investment performance is extensive. Most studies focus on U.S.mutual funds and find that fund managers are not able to exploit selectivity andtiming to generate excess returns (e.g., Fama 1972, Henriksson and Merton 1981,Kon 1983, and Kon and Jen 1979). Agnew, Balduzzi, and Sunden (2003) reportthat equity allocations of participants in 401(k) plans are positively related to theprevious day’s equity return (feedback trading). However, no significant correla-tion is found between changes in equity allocations and returns over the followingthree days, suggesting the absence of market-timing abilities.

60 International Journal of Central Banking June 2010
Figure 2. Stock Market Returns and Equity Investments(1999:Q1–2006:Q4)
although only gradually and with a time lag. Following the stockmarket boom in the second half of the 1990s, the strategic equityallocation increased until the end of 2001 but decreased from 2002to 2003 in response to the fall of the stock market that startedin 2000. A possible explanation is that pension funds adjust theirinvestment policies based on recent stock market performance. Pos-itive excess returns increase the pension fund’s buffer so that, as aconsequence, regulatory rules also allow for a higher proportion ofthe more risky equity investments. Apparently, pension funds makeuse of this opportunity and adjust their strategic asset allocationaccordingly.
Third, the figure suggests that pension funds may have lostmoney from market timing over the business cycle. They seem tohave gradually increased their equity allocation until the downturnof the stock market was well under way, confronting them with rel-atively large losses. Conversely, pension funds did not significantlyincrease their equity allocation portfolio investments to reap the fullbenefit of the subsequent upward stock market trend.

Vol. 6 No. 2 Stock Market Performance 61
The structure of this article is as follows. Section 2 presents thedata used in the analyses. Section 3 investigates the influence ofmarket movements on asset allocation, whereas rebalancing is moreclosely examined in section 4. The next section analyzes the rela-tionship between stock market returns and strategic asset allocation.Finally, the last section summarizes and concludes.
2. Description of the Data
We use a detailed data set with quarterly information on all Dutchpension funds for the 1999:Q1–2006:Q4 period. The data is from DeNederlandsche Bank, responsible for the prudential supervision ofthe pension funds and their regulatory compliance. For each pensionfund, data is available on strategic asset allocation, asset sales andpurchases, the market value of investments in different asset classes,and their time-weighted returns. We use self-reported returns, aswell as the MSCI World total return index denominated in euros,to assess the impact of equity returns on actual and strategic equityallocation. The sample is an unbalanced panel, as not all pensionfunds reported data for the entire sample period due to new entrants,mergers, terminations, and reporting failures. Since our aim is tostudy asset allocation over time, we exclude pension funds with lessthan two years of data. Finally, we exclude inconsistent observationsand observations with clear reporting errors.
Our final sample includes data on 748 pension funds from1999:Q1–2006:Q4, representing around 85 percent of total pensionfund assets in the Netherlands. Table 2 presents summary statisticson the investment portfolios of pension funds in our sample. Thesize of pension funds in the sample is hugely divergent: the small-est pension funds have assets worth less than €1 million, while thelargest fund has assets of more than €200 billion. The average andmedian sizes of pension fund assets equal €799 million and €53 mil-lion, respectively. We distinguish between size classes and types ofpension funds and between types of pension plans. Small funds tendto invest relatively less in equity compared with larger funds, andmore in bonds, reflecting lower risk appetite. Although large in num-ber (70 percent of the sample), small funds administer only a minorshare (less than 3 percent) of all pension fund investments.

Tab
le2.
Inve
stm
ents
acro
ssSiz
eC
lass
esan
dPen
sion
Fund
Types
(199
9:Q
1–20
06:Q
4)
Max
–M
inM
ax–M
inA
ver
age
Aver
age
Act
ual
Str
ateg
icN
um
ber
Aver
age
Bond
Equity
Equity
Equity
of
Tota
lIn
ves
t-In
ves
t-In
ves
tmen
tsA
lloca
tion
Siz
eC
lass
esB
ased
Pen
sion
Inves
tmen
tsm
ents
men
tsov
erT
ime
over
Tim
eIn
ves
tmen
ton
Tota
lIn
ves
tmen
tsFunds
(Mln
.Euro
)(%
)(%
)(%
)(%
)G
ap(%
)a
(Mln
.Euro
)(1
)(2
)(3
)(4
)(5
)(6
)(7
)
0–10
0(S
mal
l)52
429
6229
1812
0.4
100–
1,00
0(M
ediu
m)
177
320
5137
1813
0.2
>1,
000
(Lar
ge)
478,
276
3743
1613
0.8
Tot
al/A
vera
ge74
879
939
4216
130.
8
Type
ofPen
sion
Fundb
,c
Indu
stry
(All)
953,
798
3541
1412
1.1
Com
puls
ory
764,
412
3641
1412
1.1
Non
-Com
puls
ory
191,
099
3545
1615
1.7
Com
pany
631
280
4543
2013
0.1
Pro
fess
iona
lG
roup
102,
292
5142
1812
0.5
Pla
nT
ypec
Defi
ned
Ben
efit
592
926
3942
1613
0.8
Defi
ned
Con
trib
utio
n56
7851
3719
140.
3
Note
:A
llst
atis
tics
are
aver
ages
wei
ghte
dby
tota
lin
vest
men
tsex
cept
for
the
firs
ttw
oco
lum
ns
(Num
ber
ofPen
sion
Funds
and
Ave
rage
Tot
alIn
vest
-m
ents
).aIn
vest
men
tga
pis
the
abso
lute
diff
eren
cebet
wee
nth
est
rate
gic
equity
allo
cati
onan
dth
eac
tual
per
cent
age
ofeq
uity
por
tfol
ioin
vest
men
ts.
bTen
pen
sion
funds
bel
ong
toot
her
cate
gori
es.
cFor
som
epen
sion
funds,
type
ofpen
sion
fund
ordom
inan
tpla
nty
pe
are
unkn
own.

Vol. 6 No. 2 Stock Market Performance 63
Our sample includes 631 company funds, 95 industry-wide funds,and 10 professional group funds.8 Compulsory industry funds arelargest in terms of investments. All pension fund categories investbetween 41 and 45 percent in equity. Company funds and pro-fessional group funds invest relatively more in bonds than othertypes of funds, reflecting their stronger risk aversion. Industryfunds invest substantially more in real estate. On average, defined-benefit funds have higher equity and lower bond investments thandefined-contribution funds, suggesting that defined-benefit fundsmay take higher risks since they can benefit from intergenerationalrisk sharing.
Columns 5 and 6 indicate how, respectively, the actual andstrategic equity allocation vary over time. For the average pensionfund, the range of the actual equity allocation is 16 percent and thatof the strategic equity allocation is 13 percent. Thus, both actual andstrategic equity allocation move significantly over time. The last col-umn shows that the difference between strategic and actual equityallocation is, on average, 0.8 percentage point.
Table 3 shows that the strategic and actual equity allocationdiffer significantly across pension funds. A small majority of fundsinvest 20–40 percent of their assets in equities. A quarter of the fundsinvest more than 40 percent in equities, while around one-fifth of thefunds invest less than 20 percent in equities.
3. Relative Stock Market Returns and Short-TermChanges in Equity Allocation
To start our empirical analysis, this section examines the short-termimpact of stock market performance on equity allocation. Over time,actual equity allocation may change either (i) due to excess returnson equities compared with other asset classes (free floating) or (ii)due to net purchases or net sales of equities (rebalancing and market
8Company funds provide pension plans to the employees of their sponsor com-pany. They are separate legal entities but are run by the sponsor company andemployee representatives. Industry funds provide pension plans for employeesworking in an industry. Such pension plans are based on a collective labor agree-ment between an industry’s companies and the labor unions, representing theemployees in this industry. Finally, professional group funds offer pension schemesto specific professional groups (e.g., general practitioners, public notaries).

64 International Journal of Central Banking June 2010
Table 3. Frequency Distribution of Equity Allocationacross Pension Funds (1999:Q1–2006:Q4; in %)
Frequency Distribution of PensionFunds, Based on Their:
Investment-in-Equity Equity Allocation Actual EquityClasses Strategy Allocation
0–20 15.2 20.420–40 55.6 53.640–60 26.3 23.860–80 2.4 1.980–100 0.4 0.3Total 100.0 100.0
timing). To investigate the impact of relative stock market returns onpension funds’ equity allocation, we estimate the following equation:
wi,t = α1 + Σkj=0βj
(rEt−j − rT
i,t−j
)+ γ1Policyi,t−1
+ δ1Sizei,t−1 + λ1Fundingi,t−1 + εi,t. (1)
The dependent variable wi,t is the actual percentage of the port-folio invested in equities of pension fund i (i = 1, . . . , N) at quartert (t = 1, . . . , T ). The variable (rE − rT ) is used to measure excessstock market returns compared with other investment categories ona quarterly basis. For stock market return (rE) we use either thereturn on the MSCI World equity index or the pension funds’ self-reported equity performance. For the average return on the pensionfund portfolio’s other asset categories (rT ), we multiply the strate-gic asset allocation of four key asset classes by representative broadmarket indexes.9 Again, the alternative is to use the pension funds’
9We consider five investment categories: equities, bonds, real estate, moneymarket instruments, and other assets. For bonds we use the JP Morgan EMUbond index, for real estate we use the FTSE EPRA Netherlands real estateindex, and for money market investments we use the three-month Euriborinterest rate. We assume that the fifth category, “other assets,” is propor-tionally invested in the previous four investment categories (or has a sim-ilar return). We calculate excess returns as follows: excess return = returnMSCI − [(return on bonds * bond investments + return on real estate * realestate investments + three-months Euribor * money market investments)/(bondinvestments + real estate investments + money market investments)].

Vol. 6 No. 2 Stock Market Performance 65
self-reported performance on the respective asset classes. We con-sider two variants of equation (1). The base model is without laggedstock market returns (k = 0), whereas alternatively, we includeexcess stock market returns with time lags (k = 5) to investigate theinfluence of past returns on pension funds’ equity investments. Thestrategic equity allocation (Policy), also expressed as a percentage, isincluded to control for pension fund investment policy. Size, which ismeasured as the logarithm of the total investment portfolio, controlsfor the tendency of larger funds to invest relatively more in equities.Funding, calculated as total investments/discounted pension liabil-ities, is included because funds with a higher buffer are allowed toinvest more in equities. Policy, Size, and Funding are included withone time lag to avoid endogeneity problems and since it may takesome time before changes in these variables lead to changes in theequity portfolio investment. As stated before, the panel is unbal-anced, which implies that the number of observations varies acrosspension funds.
3.1 Empirical Results of the Impact of Stock Returns onActual Equity Allocation
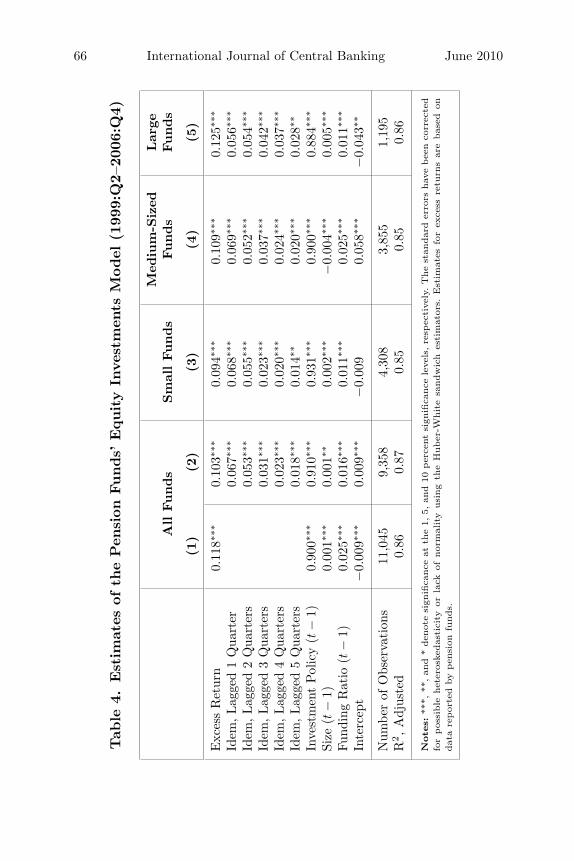
Table 4 presents estimates of the impact of short-term excessstock returns on the percentage of equity portfolio investments,using equation (1). The measure of excess stock returns in thistable is based on the pension funds’ self-reported asset returns.A 1-percentage-point outperformance of the pension funds’ equitiesleads to a significant increase in equity allocation of 0.12 percent-age point in the subsequent quarter (first column). The second col-umn shows that excess equity returns also have a (highly) significantimpact on the equity allocation up to five quarters later. The impactdecreases over time, indicating that pension funds rebalance gradu-ally or infrequently. If a pension fund invests 40 percent in equity, a1 percent rise of stock prices would imply an increase of the weight ofstocks by 0.24 percentage point (being 40.4/100.4 minus 40/100)—that is, as long as no adjustments are made. In this example, theobserved 0.12-percentage-point effect of excess returns on pensionfunds’ equity implies that only half the excess is rebalanced and thatthe other half of the equity weight moves in tandem with stock prices.
Table 4 reveals also that a 1-percentage-point increase inthe strategic equity allocation causes a significant rise of around
66 International Journal of Central Banking June 2010
Tab
le4.
Est
imat
esof
the
Pen
sion
Funds’
Equity
Inve
stm
ents
Model
(199
9:Q
2–20
06:Q
4)
Med
ium
-Siz
edLar
geA
llFunds
Sm
allFunds
Funds
Funds
(1)
(2)
(3)
(4)
(5)
Exc
ess
Ret
urn
0.11
8∗∗∗
0.10
3∗∗∗
0.09
4∗∗∗
0.10
9∗∗∗
0.12
5∗∗∗
Idem
,Lag
ged
1Q
uart
er0.
067∗
∗∗0.
068∗
∗∗0.
069∗
∗∗0.
056∗
∗∗
Idem
,Lag
ged
2Q
uart
ers
0.05
3∗∗∗
0.05
5∗∗∗
0.05
2∗∗∗
0.05
4∗∗∗
Idem
,Lag
ged
3Q
uart
ers
0.03
1∗∗∗
0.02
3∗∗∗
0.03
7∗∗∗
0.04
2∗∗∗
Idem
,Lag
ged
4Q
uart
ers
0.02
3∗∗∗
0.02
0∗∗∗
0.02
4∗∗∗
0.03
7∗∗∗
Idem
,Lag
ged
5Q
uart
ers
0.01
8∗∗∗
0.01
4∗∗
0.02
0∗∗∗
0.02
8∗∗
Inve
stm
ent
Pol
icy
(t−
1)0.
900∗
∗∗0.
910∗
∗∗0.
931∗
∗∗0.
900∗
∗∗0.
884∗
∗∗
Size
(t−
1)0.
001∗
∗∗0.
001∗
∗0.
002∗
∗∗−
0.00
4∗∗∗
0.00
5∗∗∗
Fund
ing
Rat
io(t
−1)
0.02
5∗∗∗
0.01
6∗∗∗
0.01
1∗∗∗
0.02
5∗∗∗
0.01
1∗∗∗
Inte
rcep
t−
0.00
9∗∗∗
0.00
9∗∗∗
−0.
009
0.05
8∗∗∗
−0.
043∗
∗
Num
ber
ofO
bser
vati
ons
11,0
459,
358
4,30
83,
855
1,19
5R
2,A
djus
ted
0.86
0.87
0.85
0.85
0.86
Note
s:**
*,**
,an
d*
den
ote
sign
ifica
nce
atth
e1,
5,an
d10
per
cent
sign
ifica
nce
leve
ls,re
spec
tive
ly.T
he
stan
dar
der
rors
hav
ebee
nco
rrec
ted
for
pos
sible
het
eros
kedas
tici
tyor
lack
ofnor
mal
ity
usi
ng
the
Huber
-Whit
esa
ndw
ich
esti
mat
ors.
Est
imat
esfo
rex
cess
retu
rns
are
bas
edon
dat
are
por
ted
bypen
sion
funds.

Vol. 6 No. 2 Stock Market Performance 67
0.90 percentage point in actual equity portfolio investments in thenext period. As one would expect, pension fund investment managersadjust their equity portfolio investments almost fully in responseto changes in the strategic equity allocation. The positive sign forthe size of investments affirms that larger funds invest relativelymore in equities (see also table 1), except within the medium-sizedfunds class, where the sign becomes negative. A possible explana-tion is that large pension funds tend to be less risk averse thansmall pension funds, which also holds within the classes of small andlarge funds. Finally, in line with expectations, the funding ratio hasa highly significant positive coefficient, indicating that funds withlarger buffers invest more in equities. As equities are more risky,regulation requires larger buffers for this asset class.
If we consider the investment behavior across size classes (lastthree columns), where size classes are defined as in table 2, weobserve that the impact of excess stock market returns on equityallocation increases with the pension fund size, both immediatelyand in the long run. Apparently, large funds allow more free float-ing, whereas smaller funds rebalance more. In line with this result,larger funds react less to changes in the investment policy, comparedwith smaller funds.
4. Excess Stock Market Returns and Rebalancing
The positive impact of excess equity returns on equity allocation inthe previous section may be (partly) due to imperfect rebalancing bypension funds. Excess equity performance will automatically lead tochanges in equity allocation if pension funds do not actively rebal-ance their investment portfolios fully. This section presents an empir-ical rebalancing model, which is used to estimate to what extentpension funds rebalance—that is, readjust—their asset allocation inresponse to excess equity returns.10 This model is derived as follows,starting from the definition of the actual equity allocation:
wi,t = Ei,t/TAi,t, (2)
10An alternative approach to measure rebalancing based on pension’ fundsequity sales and purchases is presented in the appendix.

68 International Journal of Central Banking June 2010
where Ei,t represents the equity investments of pension fund i attime t, and TA stands for total assets. Taking first differences ofequation (2), we obtain
wi,t − wi,t−1
=Ei,t
TAi,t− Ei,t−1
TAi,t−1=
Ei,t−1(1 + rE
i,t + NCFEi,t
)TAi,t−1
(1 + rT
i,t + NCFTi,t
) − Ei,t−1
TAi,t−1
= wi,t−1
(1 + rE
i,t + NCFEi,t
)(1 + rT
i,t + NCFTi,t
) − wi,t−1
(1 + rT
i,t + NCFTi,t
)(1 + rT
i,t + NCFTi,t
)= wi,t−1
(rEi,t − rT
i,t + NCFEi,t − NCFT
i,t
)(1 + rT
i,t + NCFTi,t
) , (3)
where NCFT is short for Net Cash Flows converted into new invest-ments as a fraction of total investments, NCFE for new equity invest-ments also as a fraction of equity investments, rE for the return onequities over the last quarter, and rT for the return on total assets(all for fund i and quarter t). Dividing both sides by wi,t−1 results in
wi,t − wi,t−1
wi,t−1=
rEi,t − rT
i,t
1 + rTi,t + NCFT
i,t
+NCFE
i,t − NCFTi,t
1 + rTi,t + NCFT
i,t
. (4)
This equation explains the percentage change in equity alloca-tion by (i) excess equity returns and (ii) net cash flows to equities,where both variables are scaled by the change in the total portfo-lio size. The first right-hand term is exogenous, since excess returnsare determined by market developments and net cash flows into thepension fund are based on (previously made) decisions by employersand employees rather than on equity allocation. Given the small sizeof pension fund investments relative to total stock market capitaliza-tion, we can safely assume that changes in equity allocation do notaffect stock market returns. The second right-hand term, however,is endogenous. While net cash flows to equity investments directlyinfluence the equity allocation of pension funds, the reverse can alsobe true: changes in the equity allocation may sway pension fundsto adjust their net cash flows to equity investments. Thus, thereis mutual causality between changes in equity allocation and netcash flows to equity investments. To estimate the impact of excess

Vol. 6 No. 2 Stock Market Performance 69
equity returns on equity allocation, we apply the above decomposi-tion, ignoring the endogenous second right-hand term. This resultsin the following empirical regression model:
wi,t − wi,t−1
wi,t−1= α2 + β2
(rEi,t − rT
i,t
1 + rTi,t + NCFT
i,t
)
+ γ2
(ΔPolicyi,t−1
Policyi,t−2
)+ εi,t. (5)
The percentage change or growth in the strategic equity alloca-tion (Policy) is included to control for changes in investment policy.This variable is included with a time lag of one quarter, since it maytake some time before changes in policy lead to adjustments in theactual equity portfolio investments. In equation (5), β2 estimatesthe degree of free float or market timing so that 1 – β2 assesses therebalancing percentage. As an alternative model, we split the excessequity return variable into positive and negative equity returns.This allows us to observe possible asymmetric effects in responseto changes in excess equity returns.
4.1 Empirical Results of Rebalancing
Table 5 presents the estimated impact of excess equity returns onequity allocation. The results show that pension funds rebalance,on average, around 39 percent of excess equity returns, leaving 61percent for free floating. Thus 61 percent of excess equity returnstranslate into increases of the equity allocation in the next period.This is roughly in line with what we have observed in table 4. Col-umn 2 shows that pension funds rebalance differently in responseto positive and negative equity returns. Only 13 percent of positiveequity returns are rebalanced, against 49 percent of negative equityreturns. Apparently, whereas pension funds do not automatically sellequities in bull markets, they do tend to buy additional equities inbear markets. In line with expectations, changes in policy affect theactual allocation positively (significant at the 1 percent significancelevel), with a lag of one quarter.
Columns 3–8 present the model estimates for the various sizeclasses. In line with the results of section 3.1, we observe that, inthe symmetric model variant, large funds, at 32 percent, rebalance

70 International Journal of Central Banking June 2010
Tab
le5.
Est
imat
esof
the
Equity
Alloca
tion
Model
:R
ebal
anci
ng
vers
us
Fre
eFlo
at(1
999:
Q2–
2006
:Q4)
Med
ium
-Siz
edA
llFunds
Sm
allFunds
Funds
Lar
geFunds
(1)
(2)
(3)
(4)
(5)
(6)
(7)
(8)
Exc
ess
Equ
ity
Ret
urns
0.61
30.
621
0.58
60.
680
Pos
itiv
eE
xces
sE
quity
Ret
urns
0.87
20.
839
0.84
21.
209
Neg
ativ
eE
xces
sE
quity
Ret
urns
0.50
80.
532
0.48
20.
483
Cha
nge
inPol
icy
(t−
1)0.
075
0.07
60.
109
0.10
90.
020
0.02
2−
0.01
8−
0.01
5In
terc
ept
0.01
20.
003
0.01
40.
007
0.01
00.
001
0.00
7−
0.00
8
Num
ber
ofO
bser
vati
ons
12,0
1012
,010
5,88
95,
889
4,70
54,
705
1,41
61,
416
R2,A
djus
ted
0.19
0.20
0.17
0.18
0.22
0.23
0.29
0.32
Note
s:A
llsy
mm
etri
can
das
ymm
etri
cex
cess
equity
retu
rns
effec
tsar
esi
gnifi
cant
atth
e1
per
cent
sign
ifica
nce
leve
l.T
he
stan
dar
der
rors
hav
ebee
nco
rrec
ted
for
pos
sible
het
eros
kedas
tici
tyor
lack
ofnor
mal
ity
usi
ng
the
Huber
-Whit
esa
ndw
ich
esti
mat
ors.
Est
imat
esfo
rex
cess
retu
rns
are
bas
edon
dat
are
por
ted
bypen
sion
funds.

Vol. 6 No. 2 Stock Market Performance 71
less than the small and medium-sized funds (around 40 percent).Consequently, large funds leave 68 percent for free floating. Changesin the one-quarter-lagged strategic equity allocation (Policy) affectactual allocation significantly (at the 1 percent significance level) forthe small funds only. If we turn to the asymmetric effects on excessequity returns, we observe that the positive effects increase signifi-cantly with pension fund size, while the negative effects are similaracross the size classes. The positive-returns coefficient for the largestfunds is, at 1.21, even above 1, indicating that large funds investadditional funds in equities in response to positive excess returnsin the last month. This suggests that excess equity returns are per-ceived by large pension funds to provide a positive signal for futurereturns, leading pension funds to increase their stakes. This is inline with results in table 4, which indicate that large funds respondmore strongly to excess equity returns than small ones. A possibleexplanation is that managers of large funds have more freedom touse market-timing strategies in response to market developments.Quite remarkable, we observe that the strategic equity allocation(although increasing for small and medium-sized pension funds) isnot increasing for large pension funds; e.g., compare 1999 with 2006.This holds also for the actual equity allocation. Hence, the overshoot-ing for large funds, as we have estimated in our paper, is apparentlynot due to an increase in the strategic asset allocation over time.
Figure 3 presents the asymmetric relation between excess equityreturns and rebalancing discussed above.11 If pension funds used afree-float strategy and did not rebalance at all, excess equity returnswould go in full to proportionate increases in equity allocation. Thisis represented by the diagonal line. Instead, with full rebalancing,excess equity returns would have no impact on equity allocation,marked off on the x-axis. The curvature dividing the free-float andrebalancing areas reflects the actual rebalancing behavior of Dutchpension funds. Strikingly, rebalancing by pension funds depends onboth the sign and size of excess equity returns. Small positive equityreturns (of around 0 to 5 percent) are not rebalanced at all, butthe degree of rebalancing increases with the size of excess equity
11To estimate this figure we adjusted equation (5) by adding three additionalterms: squared excess equity returns and excess and squared equity returns mul-tiplied with 0–1 dummies indicating positive and negative returns.

72 International Journal of Central Banking June 2010
Figure 3. Reaction of Pension Funds to Excess EquityReturns: Rebalancing and Free Float
returns. Instead, small negative returns (of around 0 to −10 percent)are rebalanced for the largest part, but the degree of rebalancingdecreases with the size of negative excess returns.
5. Excess Stock Market Returns and Medium-TermChanges in Strategic Equity Allocation
The previous two sections described the effects of excess equityreturns on actual equity allocation. This section investigates theimpact of (annual) stock market performance (arE−arT ) on pensionfunds’ strategic equity allocation (Policy). Therefore, we estimatethe following equation:
Policyi,t = α3 + β3(arE
i,t − arTi,t
)+ γ3Policyi,t−1 + δ3Sizei,t−1 + εi,t.
(6)
The excess stock market performance has been taken on anannual basis, indicated by (arE −arT ), where a refers to annual. Weassume that the pension fund trustees base their policy on longer-term measures of performance, as also reflected by the empiricalresults. As above, Size controls for the tendency of larger funds to

Vol. 6 No. 2 Stock Market Performance 73
invest relatively more in equity portfolios. We also include a lag ofthe dependent variable Policy, as we expect only gradual changesin policy over time. Hence, the equation describes the quarterlyadjustments in policy.12
5.1 Empirical Results of the Impact of Stock Market Returnson Strategic Equity Allocation
Table 6 shows the impact of excess stock market returns on strate-gic equity allocation. The investment policy is adjusted significantlyin response to changes in equity returns, irrespective of whetherthey are measured by the MSCI or by the actual investment returnsearned by pension funds. This shows that investment policy is notconstant over time but, to some extent, follows market developments.The coefficient of the lagged dependent variable, 0.97, indicates thatslowly the strategic equity allocation reacts only to a small extentto changes in the quarterly returns. On average, 97 percent of theequity investment policy is determined by the previous quarter’sinvestment policy, whereas market developments account for theremaining 3 percent. These market developments, captured by theyearly excess return, have a small but very significant impact, bothbased on the MSCI and on the actual equity return of the pensionfund. Their final impact on equity investment policy over time is0.25(= 0.007/(1 − 0.972)).
The size effect is also small but significant. While this equationshows how investment policy is influenced by market developments,it does not provide a model of the underlying investment policydecisions, which are generally based on asset liability managementstudies. The results across pension fund size classes are quite similar.
We used three alternative approaches to check the robustness ofour results.13 First, we estimated all equations employing the alter-native measure of excess equity returns based on market indices.Results were very close to the reported estimates based on self-reported returns, indicating that, on average, actual asset returns
12An alternative model, with first differences of Policy as the dependent vari-able, instead of gradual adjustment, leads to similar estimation results (notreported here).
13The tables of alternative estimates have not been reported here but areavailable upon request by the authors.

74 International Journal of Central Banking June 2010
Tab
le6.
Est
imat
esof
the
Str
ateg
icEquity
Alloca
tion
Model
(199
9:Q
2–20
06:Q
4)
Sm
all
Med
ium
-Lar
geA
llFunds
Funds
Siz
edFunds
Funds
(1)
(2)
(3)
(4)
(5)
Equ
ity
Inve
stm
ent
Pol
icy
(t−
1)0.
972∗
∗∗0.
972∗
∗∗0.
970∗
∗∗0.
971∗
∗∗0.
978∗
∗∗
Yea
rly
Exc
ess
Ret
urn
MSC
I0.
007∗
∗∗
Yea
rly
Exc
ess
Pen
sion
Fund
s’E
quity
Ret
urn
0.00
5∗∗∗
0.00
5∗∗∗
0.00
4∗∗∗
0.00
5∗
Size
(t−
1)0.
001∗
∗∗0.
001∗
∗∗0.
001
0.00
10.
001
Inte
rcep
t0.
001∗
∗∗0.
003∗
∗∗0.
002
0.00
4−
0.00
1
Num
ber
ofO
bser
vati
ons
16,1
5611
,273
5,42
54,
488
1,36
0R
2,A
djus
ted
0.95
00.
954
0.94
10.
952
0.95
5
Note
s:**
*,**
,an
d*
den
ote
sign
ifica
nce
atth
e1,
5,an
d10
per
cent
sign
ifica
nce
leve
ls,re
spec
tive
ly.T
he
stan
dar
der
rors
hav
ebee
nco
rrec
ted
for
het
eros
kedas
tici
tyusi
ng
the
Huber
-Whit
esa
ndw
ich
esti
mat
ors.
Est
imat
esfo
rex
cess
retu
rns
are
bas
edon
dat
are
por
ted
bypen
sion
funds.

Vol. 6 No. 2 Stock Market Performance 75
followed the same pattern as index returns. Second, we also ranregressions for a balanced sample of a subset of 382 pension fundsthat reported at least seven years of data. The regression resultswere similar to those reported in tables 4–7 (table 7 appears in theappendix), suggesting that survivorship bias is not a significant issue.Third, we reestimated all regressions using fixed effects for pensionfunds and years. The Hausman test rejected random effects. Theresults are again fairly similar, except for table 6.14 Overall, theseresults confirm that our outcomes are robust.
6. Conclusions
This article finds that stock market performance influences the assetallocation of pension funds in two ways. In the short term, the out-performance of equities over bonds and other investment categoriesautomatically results in higher equity allocation (and vice versa),as pension funds do not continuously rebalance their asset alloca-tion. Each quarter, pension funds rebalance, on average, around 39percent of excess equity returns. The remaining 61 percent leadsto higher or lower equity allocation as a result of free floating;these remaining excess equity returns are rebalanced in subsequentquarters. In the medium term, outperformance of equities inducespension funds to increase their strategic equity allocation (and viceversa). Overall, our estimates indicate that the investment policy ofpension funds is partially driven by the (cyclical) performance of thestock market. Apparently, pension funds suffer from myopic invest-ment behavior: they tend to base investment decisions on recentstock market performance rather than on long-term trends.
We also find that pension funds react asymmetrically to stockmarket shocks. Equity reallocation is higher after underperformanceof equity investments than after outperformance. In particular, only13 percent of positive excess equity returns is rebalanced, while 49percent of negative shocks results in rebalancing. The former canbe indicated as a “buy on the dip” strategy and the latter as a“the trend is your friend” approach. Thus, pension funds limit any
14In table 6, the coefficients’ levels of significance are substantially lower.Apparently, the pension funds’ fixed effects picked up a part of the variationin the explanatory variables.

76 International Journal of Central Banking June 2010
decline in equity allocation in response to underperformance, butthey allow higher exposures to equities when these outperform otherinvestments. Apparently, equity portfolio managers are able to con-vince pension funds both to replenish their funds in bear markets(to profit from low asset prices) and to increase the equity allocationin bull markets (to take advantage of rising markets).
Large funds’ investment behavior is different from that of smallfunds. They invest more in equity, and their equity allocation isaffected much more strongly by actual equity returns. The latterimplies that large funds rebalance less, possibly because managersenjoy more freedom in implementing market-timing strategies. Wefind asymmetric effects on excess equity returns, where the positiveeffects increase significantly with pension fund size. The coefficient ofpositive returns of the largest funds is, in fact, significantly above 1,reflecting “overshooting” of free floating, or “positive-feedback trad-ing.” A possible explanation is that managers of large funds havemore freedom to respond to market developments and, particularlyin bull markets, demonstrate great risk tolerance.
Appendix. Pension Funds’ Equity Purchases and Sales
An alternative procedure to estimate rebalancing is to use the pur-chases and sales of equity investments as the dependent variable.Equation (7) estimates the impact of excess equity returns on netequity purchases or sales.
Equity purchasesi,t = α4 + β4(rEi,t − rT
i,t
)+ γ4ΔPolicyi,t−1
+ δ4(Policyi,t−1 − wi,t−1) + λ4Fundingi,t−1 + εi,t (7)
Equity purchasesi,t is defined as net equity purchases (+) or sales(−) of fund i at quarter t as a percentage of total equity. Theexplanatory variables are the same as before: (rE − rT ) measuresexcess stock market returns compared with other investment cat-egories, wi,t is the percentage of pension fund equity investments,Policy is the strategic equity allocation, and Funding is the ratio oftotal investments and discounted pension liabilities. Additionally, weconsider asymmetric effects of excess equity returns on equity trans-actions. We control for changes in the strategic equity allocation

Vol. 6 No. 2 Stock Market Performance 77
Tab
le7.
Est
imat
esof
the
Equity
Purc
has
esan
dSal
esM
odel
(199
9:Q
2–20
06:Q
4)
Sm
all
Med
ium
-Lar
geA
llFunds
Funds
Siz
edFunds
Funds
(1)
(2)
(3)
(3)
(4)
(5)
Exc
ess
Equ
ity
Ret
urns
−0.
19∗∗
∗−
0.19
∗∗∗
−0.
21∗∗
∗−
0.20
∗∗∗
−0.
13∗∗
∗
Pos
itiv
eE
xces
sE
quity
Ret
urns
−0.
07∗∗
Neg
ativ
eE
xces
sE
quity
Ret
urns
−0.
23∗∗
∗
Cha
nge
inSt
rate
gic
Equ
ity
Allo
cati
on(t
−1)
0.10
∗∗0.
10∗∗
∗0.
100.
11∗∗
−0.
03In
vest
men
tG
ap(t
−1)
0.34
∗∗∗
0.33
∗∗∗
0.40
∗∗∗
0.32
∗∗∗
0.24
∗∗∗
Fund
ing
Rat
io(t
−1)
−0.
03∗∗
∗−
0.02
∗∗∗
−0.
02∗∗
∗−
0.02
∗∗∗
−0.
02∗∗
∗−
0.01
Inte
rcep
t0.
05∗∗
∗0.
04∗∗
∗0.
04∗∗
∗0.
05∗∗
∗0.
04∗∗
∗0.
02∗∗
∗
Num
ber
ofO
bser
vati
ons
10,8
9510
,652
10,6
525,
044
4,30
41,
304
R2,A
djus
ted
0.04
0.07
0.07
0.06
0.08
0.06
Note
s:**
*,**
,an
d*
den
ote
sign
ifica
nce
atth
e1,
5,an
d10
per
cent
sign
ifica
nce
leve
ls,re
spec
tive
ly.T
he
stan
dar
der
rors
hav
ebee
nco
rrec
ted
for
het
eros
kedas
tici
ty,usi
ng
the
Huber
-Whit
esa
ndw
ich
esti
mat
ors.
Est
imat
esfo
rex
cess
retu
rns
are
bas
edon
dat
are
por
ted
bypen
sion
funds.

78 International Journal of Central Banking June 2010
(ΔPolicy), for differences between the strategic equity allocation(Policy −w) and actual equity investments (the “investment gap”),and for the funding ratio, all lagged one quarter.
Table 7 presents evidence on rebalancing, as the percentage ofequity portfolio purchases and sales is significantly affected by excessequity returns. Negative equity returns are the main force behindthis phenomenon (see column 3). The investment gap is also a sig-nificant driver of equity portfolio sales and purchases. Although therebalancing and investment-gap effects are significant, only a tinyportion of the variation in equity portfolio sales and purchases isexplained by our model (see adjusted R2).
Turning to the size class estimates, we find less rebalancingbehavior of the larger funds compared with small funds. This isfurther emphasized by the observation that larger funds also reactless than small funds to changes in the policy and investment gap.
References
Agnew, J., P. Balduzzi, and A. Sunden. 2003. “Portfolio Choice andTrading in a Large 401(k) Plan.” American Economic Review93 (1): 193–215.
Barberis, N. 2000. “Investing for the Long Run when Returns ArePredictable.” Journal of Finance 55 (1): 225–64.
Bikker, J. A., and J. de Dreu. 2009. “Operating Costs of PensionFunds: The Impact of Scale, Governance and Plan Design.” Jour-nal of Pension Economics and Finance 8 (1): 63–89.
Blake, D., B. N. Lehmann, and A. Timmermann. 1999. “Asset Allo-cation Dynamics and Pension Fund Performance.” Journal ofBusiness 72 (4): 429–61.
Brinson, G. P., L. R. Hood, and G. L. Beebower. 1986. “Deter-minants of Portfolio Performance.” Financial Analysts Journal42 (4): 39–48.
Brinson, G. P., B. D. Singer, and G. L. Beebower. 1991. “Determi-nants of Portfolio Performance II: An Update.” Financial Ana-lysts Journal 47 (3): 40–48.
Broeders, D. W.G.A. 2006. “The Valuation of Conditional PensionLiabilities and Guarantees under Sponsor Vulnerabilities.” DNBWorking Paper No. 82.
Vol. 6 No. 2 Stock Market Performance 79
Campbell, J. Y., and L. M. Viceira. 2002. Strategic Asset Alloca-tion: Portfolio Choice for Long-Term Investors. Oxford Univer-sity Press.
Daniel, K., M. Grinblatt, S. Titman, and R. Wermers. 1997.“Measuring Mutual Fund Performance with Characteristic-Based Benchmarks.” Journal of Finance 52 (3): 1035–58.
Fama, E. F. 1972. “Components of Investment Performance.” Jour-nal of Finance 27 (3): 551–67.
Grinold, R. C., and R. N. Kahn. 1999. Active Portfolio Management.New York: McGraw-Hill.
Henriksson, R. D., and R. C. Merton. 1981. “On Market Timing andInvestment Performance. II. Statistical Procedures for Evaluat-ing Forecasting Skills.” Journal of Business 54 (4): 513–33.
Ibbotson, R. G., and P. D. Kaplan. 2000. “Does Asset AllocationPolicy Explain 40, 90, or 100 Percent of Performance?” FinancialAnalysts Journal 56 (1): 26–33.
Kakes, J. 2006. “Financial Behaviour of Dutch Pension Funds: ADisaggregated Approach.” DNB Working Paper No. 108.
Kon, S. J. 1983. “The Market-Timing Performance of Mutual FundManagers.” Journal of Business 56 (3): 323–47.
Kon, S. J., and F. C. Jen. 1979. “The Investment Performance ofMutual Funds: An Empirical Investigation of Timing, Selectivity,and Market Efficiency.” Journal of Business 52 (2): 263–89.
Lakonishok, J., A. Schleifer, and R. W. Vishny. 1992. “The Impactof Institutional Trading on Stock Prices.” Journal of FinancialEconomics 32 (1): 23–43.
Pastor, L., and R. F. Stambaugh. 2001. “The Equity Premium andStructural Breaks.” Journal of Finance 56 (4): 1207–39.
Shefrin, H., and M. Statman. 2000. “Behavioral Portfolio Theory.”Journal of Financial and Quantitative Analysis 35 (2): 127–51.