
Stock Analysis: Proven Investments Limited (PIL)vmwealth.vmbs.com/documents/Proven-Aug2012.pdfStock...
8
1 VMWM Research Department, August 21, 2012 Stock Analysis: Proven Investments Limited (PIL) Ordinary Shares Fundamental Value: US$0.11+/-10% Market Price: US$0.09 1 52 Week Range: US$0.09 to US$0.14 Recommendation: SELL Preference shares: Market Price: J$4.99 52 Week Range: J$4.51 to J$5.10 Recommendation: BUY Symbol: PROVEN Shares Outstanding: 294,951,884 units Market Value of Shares Outstanding: $26,545,669.56 Financial Year End: March 31, 2012 Executive Summary: PIL is an investment holding company that derives most of its income from its wealth management subsidiary, Proven Wealth Ltd. (PWL). PWL’s income earning strategy involves income spreading and portfolio positioning. In addition, PIL earns income from private equity transactions through its real estate subsidiary, Proven REIT Ltd. (PREIT). To date, PIL has acquired two existing companies and is currently seeking to acquire additional companies as part of its growth strategy. PIL is registered in St Lucia where it enjoys a 1% corporate income tax rate and is the first company to be listed on the US Market of the JSE (ordinary shares). Additionally it has preference shares listed on the Main Market (J$) on the JSE with a coupon of 8%. Company Overview : PIL is an investment holding company that is registered in St Lucia. The company listed by introduction on the US Market on the Jamaica Stock Exchange (JSE) on July 14 2011 with ordinary shares. 99.7% of equity is attributable to shareholders while 0.3% is attributable to non-controlling interests. In December 2011 PIL listed preference shares in J$ on the JSE. PIL itself does not manage client funds as an investment management company. Instead, assets are managed by a subsidiary, Proven Wealth Ltd (PWL), which is registered in Jamaica. All employees are employed by an affiliate company, Proven Management Ltd (PML). The company’s strategy encompasses three main revenue drivers (i) carry-trade 2 or spread income (ii) portfolio positioning 3 and (iii) private equity transactions 4 . To date, the company has purchased 2 existing companies: Guardian Asset Management (GAM), which was renamed Proven Wealth Ltd, and Asset Management Company Ltd (AMCL), which is a hire purchase financing company. PIL has also formed an international business company, PREIT, for real estate related investments. Proven is currently exploring potential private equity transactions and is targeting companies in industries such as tourism, education, healthcare, security, real estate and financial services. The company raised J$2 billion from the issuance of preference shares in Dec 2011, some of which it has indicated will be used to fund private equity transactions in Jamaica, Cayman, Barbados and Trinidad over a five year period. This should assist Proven in meeting its return objectives. Financial Performance Snapshot 12 months ended Mar 31 Mar 2012 Mar 2011 % ∆ 5 Assets (US$M) 139.0 141.0 -1.4 Net Income (US$M) 3.3 6.4 -93.9 Net Income (excluding gain from GAM acquisition) (US$M) 3.29 2.85 15.4 EPS (US$) 1.12 2.81 -60.0 P/E (x) 0.08 N/A N/A ROE (%) 9.8 18.7 -47.6 Dividend Yield (%) 10.0% N/A N/A Outlook Proven’s previous acquisitions have been profitable and the current global and economic conditions provide an excellent opportunity to capitalize on the depressed nature of the markets and to acquire attractive long-term, under-valued assets. However, the funding raised from the issuance of preference shares may not be sufficient to make the investments the company needs to boost profits over the next 5 years. The company has already purchased AMCL and formed a real estate subsidiary, PREIT from the J$2 billion it raised. Investors seemingly have low confidence in this stock as indicated by low demand. Technical factors show very few buyers for the stock that trades, on average, three days per week. The recent depreciation of the J$ in relation to US$ could be uninspiring for potential ordinary shareholders who will be required to pay more (in J$) for the stock. On the other hand, this could be advantageous for current shareholders since their shares are worth more in J$. However, if the J$ appreciates, those investors may be reluctant to sell. Valuation and Projections : Using the Dividend Discount Model the stock has a current fair market value of US$0.10. It is expected that this stock could trade as high as US$0.12 or as low as US$0.08. However, it is currently trading at US$0.09 and, given low investor confidence and little information/understanding about the company and its business model, the stock is not expected to trade towards its intrinsic value. Instead it could fall further, in a worst case scenario, but more likely trade around its current price. 1 As at August 13 2012 2 A strategy in which an investor sells a certain currency with a relatively low interest rate and uses the funds to purchase a different currency yielding a higher interest rate. 3 The process of aligning strategic investments with corporate goals. 4 A transaction that involves a firm buying an existing or mature firm. To date PIL has bought 2 firms, Asset Management Co. Ltd. and Guardian Asset Management. 5 Percentage Change
Transcript of Stock Analysis: Proven Investments Limited (PIL)vmwealth.vmbs.com/documents/Proven-Aug2012.pdfStock...
1
VMWM Research Department, August 21, 2012
Stock Analysis: Proven Investments Limited (PIL) Ordinary Shares Fundamental Value:
US$0.11+/-10%
Market Price: US$0.091 52 Week Range: US$0.09 to US$0.14 Recommendation: SELL
Preference shares: Market Price: J$4.99 52 Week Range: J$4.51 to J$5.10 Recommendation: BUY
Symbol: PROVEN
Shares Outstanding: 294,951,884 units
Market Value of Shares Outstanding: $26,545,669.56
Financial Year End: March 31, 2012
Executive Summary: PIL is an investment holding company that
derives most of its income from its wealth management subsidiary,
Proven Wealth Ltd. (PWL). PWL’s income earning strategy involves
income spreading and portfolio positioning. In addition, PIL earns
income from private equity transactions through its real estate
subsidiary, Proven REIT Ltd. (PREIT). To date, PIL has acquired two
existing companies and is currently seeking to acquire additional
companies as part of its growth strategy. PIL is registered in St
Lucia where it enjoys a 1% corporate income tax rate and is the
first company to be listed on the US Market of the JSE (ordinary
shares). Additionally it has preference shares listed on the Main
Market (J$) on the JSE with a coupon of 8%.
Company Overview: PIL is an investment holding company that is
registered in St Lucia. The company listed by introduction on the
US Market on the Jamaica Stock Exchange (JSE) on July 14 2011
with ordinary shares. 99.7% of equity is attributable to
shareholders while 0.3% is attributable to non-controlling
interests. In December 2011 PIL listed preference shares in J$ on
the JSE.
PIL itself does not manage client funds as an investment
management company. Instead, assets are managed by a
subsidiary, Proven Wealth Ltd (PWL), which is registered in
Jamaica. All employees are employed by an affiliate company,
Proven Management Ltd (PML).
The company’s strategy encompasses three main revenue drivers
(i) carry-trade2 or spread income (ii) portfolio positioning
3 and (iii)
private equity transactions4. To date, the company has purchased 2
existing companies: Guardian Asset Management (GAM), which
was renamed Proven Wealth Ltd, and Asset Management
Company Ltd (AMCL), which is a hire purchase financing company.
PIL has also formed an international business company, PREIT, for
real estate related investments. Proven is currently exploring
potential private equity transactions and is targeting companies in
industries such as tourism, education, healthcare, security, real
estate and financial services. The company raised J$2 billion from
the issuance of preference shares in Dec 2011, some of which it
has indicated will be used to fund private equity transactions in Jamaica,
Cayman, Barbados and Trinidad over a five year period. This should assist
Proven in meeting its return objectives.
Financial Performance Snapshot
12 months ended Mar 31
Mar 2012 Mar 2011 % ∆5
Assets (US$M) 139.0 141.0 -1.4
Net Income (US$M) 3.3 6.4 -93.9
Net Income (excluding gain
from GAM acquisition) (US$M)
3.29 2.85 15.4
EPS (US$) 1.12 2.81 -60.0
P/E (x) 0.08 N/A N/A
ROE (%) 9.8 18.7 -47.6
Dividend Yield (%) 10.0% N/A N/A
Outlook Proven’s previous acquisitions have been profitable and the
current global and economic conditions provide an excellent opportunity
to capitalize on the depressed nature of the markets and to acquire
attractive long-term, under-valued assets. However, the funding raised
from the issuance of preference shares may not be sufficient to make
the investments the company needs to boost profits over the next 5
years. The company has already purchased AMCL and formed a real
estate subsidiary, PREIT from the J$2 billion it raised.
Investors seemingly have low confidence in this stock as indicated by low
demand. Technical factors show very few buyers for the stock that
trades, on average, three days per week. The recent depreciation of the
J$ in relation to US$ could be uninspiring for potential ordinary
shareholders who will be required to pay more (in J$) for the stock. On
the other hand, this could be advantageous for current shareholders
since their shares are worth more in J$. However, if the J$ appreciates,
those investors may be reluctant to sell.
Valuation and Projections :
Using the Dividend Discount Model the stock has a current fair market
value of US$0.10. It is expected that this stock could trade as high as
US$0.12 or as low as US$0.08. However, it is currently trading at US$0.09
and, given low investor confidence and little information/understanding
about the company and its business model, the stock is not expected to
trade towards its intrinsic value. Instead it could fall further, in a worst
case scenario, but more likely trade around its current price.
1 As at August 13 2012
2 A strategy in which an investor sells a certain currency with a relatively low interest rate and uses the funds to purchase a different currency yielding a higher
interest rate. 3 The process of aligning strategic investments with corporate goals.
4 A transaction that involves a firm buying an existing or mature firm. To date PIL has bought 2 firms, Asset Management Co. Ltd. and Guardian Asset Management.
5 Percentage Change
2
VMWM Research Department, August 21, 2012
Stock Analysis: Proven Investments Limited (PIL) Dividends – Payments and Policy Ordinary Shares
Twelve-month dividend yield on ordinary shares is 10%.
Proven’s dividend policy for ordinary shares is to pay 50%
of Net Income as dividends in an effort to provide the
highest value for shareholders. However, PIL paid
approximately 38% of Net Income as dividends in FY
2011/2012. With a projected Net Profit of US$3.4 million for FY 2012/2013, it is expected that the company could pay approximately 45% as
dividends.
Preference Shares
Preferential dividends will be paid quarterly at a fixed rate
of 8% per annum on the 23rd
day of March, June,
September and December.
PIL has entered into an Investment Management Agreement with PML to pay a management fee of 2% and performance-based dividends of
25% of PIL’s Net Profit. This therefore is a cause for concern. It means that the company plans to retain only approximately 25% for
reinvestment purposes since it proposes to pay 50% of profits as dividends.
Dividend Timetable
(ordinary shares)
2011 2012
Payment date June 11 March 14 July 2 August 31
Dividend Per Share (US$) 0.0014 0.0029 0.0024 0.0018
Dividend Timetable (preference shares) 2012
Payment date April 19 June 22 Sept 21
Dividend Per Share (J$) 0.10 0.10 0.10
Management and Corporate Governance
PIL is managed by CEO Chris Williams. Prior to starting Proven Investments, Chris Williams was managing director of NCB Capital Markets
(NCBCM). It was under Chris’ guidance that NCBCM grew into one of Jamaica’s most successful investment houses. Supporting the CEO is VP
Investments, Johann Heaven, who was previously VP Strategic Planning, Projects and Product Development at Scotia DBG. He is a CFA
charterholder and also holds the FRM certification. Johann is currently responsible for leading the investments team and overseeing research
and analysis. In addition, he provides strategic direction and oversees new product development. PIL has also inherited the personnel of GAM.
The Board of Directors of Proven Investments comprises professionals across the Caribbean who bring a mix of independence and oversight.
This diversification across the region is in line with the company’s objective of acquiring companies both inside and outside of Jamaica.
Overseas directors should bring expertise of their respective countries which should give PIL an advantage in targeting companies in those
jurisdictions. The company has also sought to keep the Board lean, currently maintaining only 5 directors. This should not only keep costs down
but also lends itself to the nimbleness needed for a start-up operation.
Directors Experience
Hugh Hart Solicitor; Former Government Senator (Jamaica)
Rhory McNamara Attorney at Law; Manager – McNamara Corporate Services
Yvor Nassef Managing Director - Archipelago Trading Ltd ; Former Executive Director- Dominica Coconut Products; Former Director- Fort Young Hotel; Former Government Senator (Dominica)
Garfield Sinclair Managing Director-LIME; Former President & COO-DBG
John Collins Former Manager & Director -Bank of Nova Scotia Trust Company (Cayman) Ltd.
The Board of Directors is ultimately responsible for the establishment and oversight of the Group’s Risk Management Framework. The Board of
PIL has, so far, established two committees, the Investment Committee and the Audit Committee, for managing and monitoring risk. The PSOJ
Corporate Governance Code states that, in addition to the Audit Committee, companies should have a Remuneration Committee that is
responsible for the development of a remuneration policy and a Nomination Committee that is responsible for election and re-election of
directors. However, PIL has neither of these. All employees are employed to PML and are compensated based on “market rates.”
3
VMWM Research Department, August 21, 2012
Stock Analysis: Proven Investments Limited (PIL)
SWOT Analysis
Operational Structure PIL’s PIL’s PIL’s PIL’s SubsidiariesSubsidiariesSubsidiariesSubsidiaries Nature of BusinessNature of BusinessNature of BusinessNature of Business Ownership (%)Ownership (%)Ownership (%)Ownership (%) PWL Funds management, investment advisory, equity & money market trading 100
PREIT Real estate 85
AMCL Hire Purchase 100
PML Employment of all personnel to Group 100
PIL is a holding company and so generates income from its subsidiaries PWL, PREIT and AMCL. PIL does not manage client funds as an
investment management company. However, PIL acquired GAM (renamed PWL) in 2010, which manages assets and is registered in Jamaica.
PWL is a licensed securities dealer and a licensed investment advisor. It is responsible for the wealth management aspect of PIL and currently
contributes to the majority of PIL’s income. PWL’s strategies involve income spreading or carry trade and portfolio positioning, and operates in
a competitive market with key players holding majority market share. Therefore, it is critical for the company to partake in an aggressive
marketing campaign that will earn it more clients and thus greater margins.
PREIT is a subsidiary that was formed by PIL to manage real estate investments. To date the subsidiary has purchased one property, Proven
Kingsway Ltd, from which it currently receives rental income. Management has declared that plans are in place to purchase additional
properties. However, no definite offer has been made public. With a negative free cash flow of -US$25 million, the company may not have
Top 10 Shareholders Number of Units Held Percentage Held
Peter Bunting 35,735,674 12.12%
Ozymandias 15,085,706 5.11%
Nekia Ltd 14,708,738 4.99%
Pelican Investment Co Ltd 10,854,369 3.68%
Marco Miret 10,000,000 3.39%
Alexander Ewart 9,435,709 3.20%
Tajebe Ltd 9,333,334 3.16%
Barnett Ltd 8,578,641 2.91%
Anita Bicknell 8,000,000 2.71%
Courtney Wilkinson 7,000,000 2.37%
Total 43.64%
Strengths
• Management team has solid reputation in the local
market
• 1st to market with new business model
Weaknesses
• Reduced cash position
• Insufficient brand awareness locally and overseas
• Limited access to capital markets given weak global economy
• Start-up company has low negotiating leverage in acquisitions
Opportunities
• Decline in asset values could mean more acquisition
opportunities
• Sluggish economic conditions provide an opportunity to
capitalize on the depressed nature of the markets and to
acquire good long-term under-valued assets
• Regulatory arbitrage from operating in different
countries.
• Underserved market with few investors with adequate
capital
Threats
• Slow growth economy
• Changes in regulatory policy
• Uncertainties in local & global markets
• Interest rate increases
• Exchange rate volatility could affect the company’s investment
portfolio

4
VMWM Research Department, August 21, 2012
Stock Analysis: Proven Investments Limited (PIL) sufficient funds to execute these projects by 2013 and, as such, may need to raise additional capital.
In February 2012, PIL acquired Asset Management Company Ltd (AMCL), which is a Hire Purchase Financing company, with the intention of
diversifying its income stream. AMCL is the owner of the “Easy Own” brand that allows consumers to purchase furniture and major appliances
on hire purchase from participating vendors. Although Easy Own is said to be offered in 22 stores island wide, it is not a popular name in the
highly competitive retail furniture market. In addition, there is no current marketing campaign around this product. Hence, consumer
awareness and, consequently, profitability may be dampened. Going forward, management plans to roll out a marketing campaign for its AMCL
subsidiary which could result in increased revenue from this subsidiary.
Financial Analysis
PIL has reported financial results for the 16-month period ending March 31 2011 and year ended March 31 2012. We have annualized the 2011
results to normalize the data for comparison purposes.
Revenues: PIL’S revenue for YE 2012 amounted to US$7.2 million. Net Interest Income (NII) and Gains on Securities were the biggest
contributors to Net Revenue, with a contribution of 54% and 41% respectively.
Expenses: The company’s operating expenses increased 19% as a result of an increase in staff costs. Going forward, management plans to roll
out a marketing campaign for its AMCL subsidiary which could increase operating expenses. In addition, with the listing of preference shares in
December 2011, dividend payouts are expected to increase within FY 2012/2013. With increased operating expenses, Net Income fell 50% at
the end of FY 2012.
Balance Sheet: YE 2012 results showed a 2% decline in asset base compared to the previous year. This reduction in asset base stemmed from a
decision that management took to realign the company’s business model in an effort to minimize the financial risk. Liabilities too decreased
marginally due to a reduction in client repos. This reduction in repos is believed to be in keeping with the FSC’s directive for securities dealers
to reduce client repos. During FY 2011, the company restructured its liabilities by replacing short term funding with more long term funding,
such as its preference share offer and US$4 million in notes that it issued via private placement. Shareholder’s equity also marginally decreased
3% when compared to the previous year as a result of net realized fair value losses that were incurred due to the downturn in global markets.
Cash Flow: Net cash provided by operating activities fell 115% in 2012 largely due to the decrease in Net Profit. Net cash provided by financing
activities was also lower given that the FYE 2011 results were bolstered by the capital injection from the share capital increase. Net cash used in
investing activities increased mainly due to the purchase of investment property and subsidiary. These activities resulted in a decrease in cash
and cash equivalents at the end of the period amounting to US$1.7 billion. Free Cash Flow at the end of 2012 was in negative territory, which is
not unusual for a start-up company given that they will have large cash outlays to make purchases.
Ratio Analysis
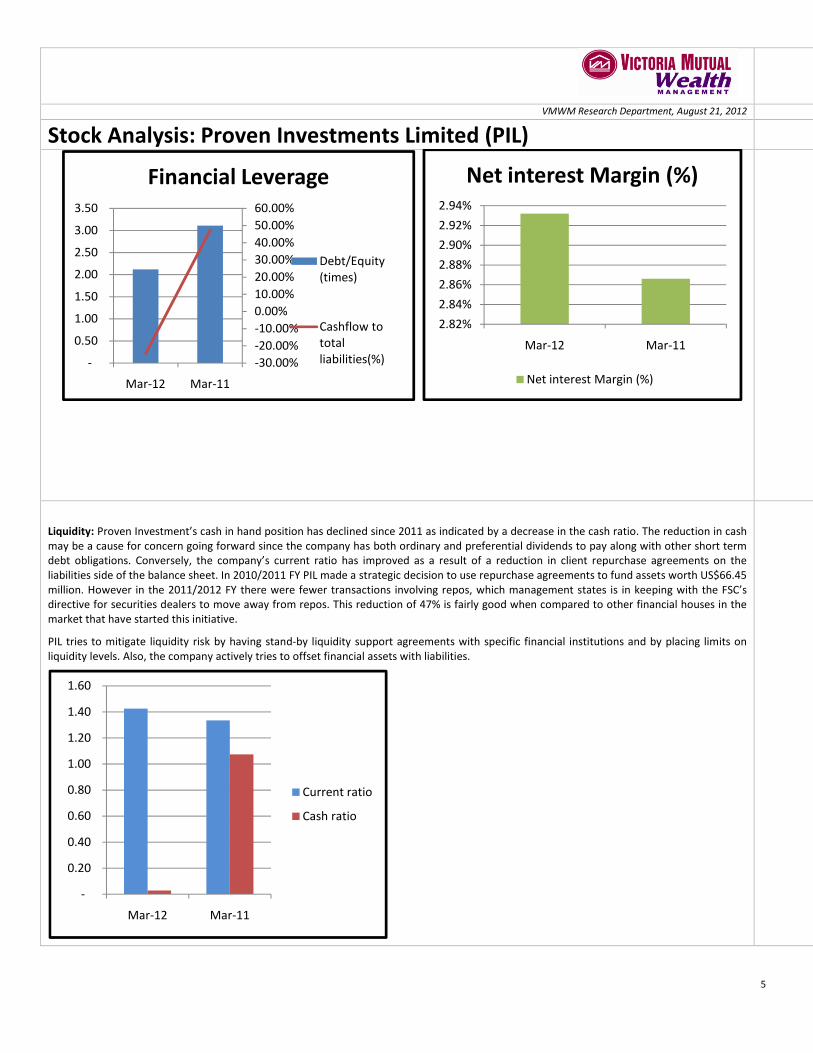
Financial Health: Proven’s debt to equity position (a measure of the degree of financial leverage) and cash flow to total liabilities both
decreased in 2012. We have included in the stock of debt preference shares6, bank overdraft, credit linked notes
7 and notes payable
8.
Debt financing was reduced as the company’s management sought to undertake a strategy which they believe will reduce the riskiness of the
business. They have integrated a policy whereby no one instrument can constitute more than 10% of the company’s portfolio. However, PIL’s
debt/equity of 2.1x in FY 2012 indicates a high degree of risk for the company. In addition, the company’s cash flow to total liabilities ratio of -
24% indicates its inability to cover its liabilities with its operating cash flow. In December 2011 the company issued 200,000,000 units of
preference shares from which it raised J$2 billion, the proceeds of which were used to pursue acquisition opportunities such as AMCL and to
increase the company’s investment portfolio. Net Interest Margin increased marginally in 2012 mainly as a result of an increase in earnings
assets. However, net interest income could decrease going forward attributable to the declining interest rates environment. Hence, revenues
going forward, could suppress Net Income, resulting in fewer funds to operate the business.
6 PIL issued preference shares in December 2011 and the company pays a fixed preferential dividend of 8%.
7 These pay fixed quarterly coupons. However, they have an annual bonus interest payment that is linked to the return on equity of the Group.
8 Consists of equity linked notes, structured notes and margin loans payable. The structured notes are medium term debt instruments that are secured by a set of
securities and have fixed quarterly coupon payments with a bullet payment of principal due at maturity. Margin loans are short term debt securities that are
collateralized by the securities held with brokerage firms, with the proceeds used to purchase additional securities.
5
VMWM Research Department, August 21, 2012
Stock Analysis: Proven Investments Limited (PIL)
Liquidity: Proven Investment’s cash in hand position has declined since 2011 as indicated by a decrease in the cash ratio. The reduction in cash
may be a cause for concern going forward since the company has both ordinary and preferential dividends to pay along with other short term
debt obligations. Conversely, the company’s current ratio has improved as a result of a reduction in client repurchase agreements on the
liabilities side of the balance sheet. In 2010/2011 FY PIL made a strategic decision to use repurchase agreements to fund assets worth US$66.45
million. However in the 2011/2012 FY there were fewer transactions involving repos, which management states is in keeping with the FSC’s
directive for securities dealers to move away from repos. This reduction of 47% is fairly good when compared to other financial houses in the
market that have started this initiative.
PIL tries to mitigate liquidity risk by having stand-by liquidity support agreements with specific financial institutions and by placing limits on
liquidity levels. Also, the company actively tries to offset financial assets with liabilities.
-30.00%
-20.00%
-10.00%
0.00%
10.00%
20.00%
30.00%
40.00%
50.00%
60.00%
-
0.50
1.00
1.50
2.00
2.50
3.00
3.50
Mar-12 Mar-11
Financial Leverage
Debt/Equity
(times)
Cashflow to
total
liabilities(%)
2.82%
2.84%
2.86%
2.88%
2.90%
2.92%
2.94%
Mar-12 Mar-11
Net interest Margin (%)
Net interest Margin (%)
-
0.20
0.40
0.60
0.80
1.00
1.20
1.40
1.60
Mar-12 Mar-11
Current ratio
Cash ratio
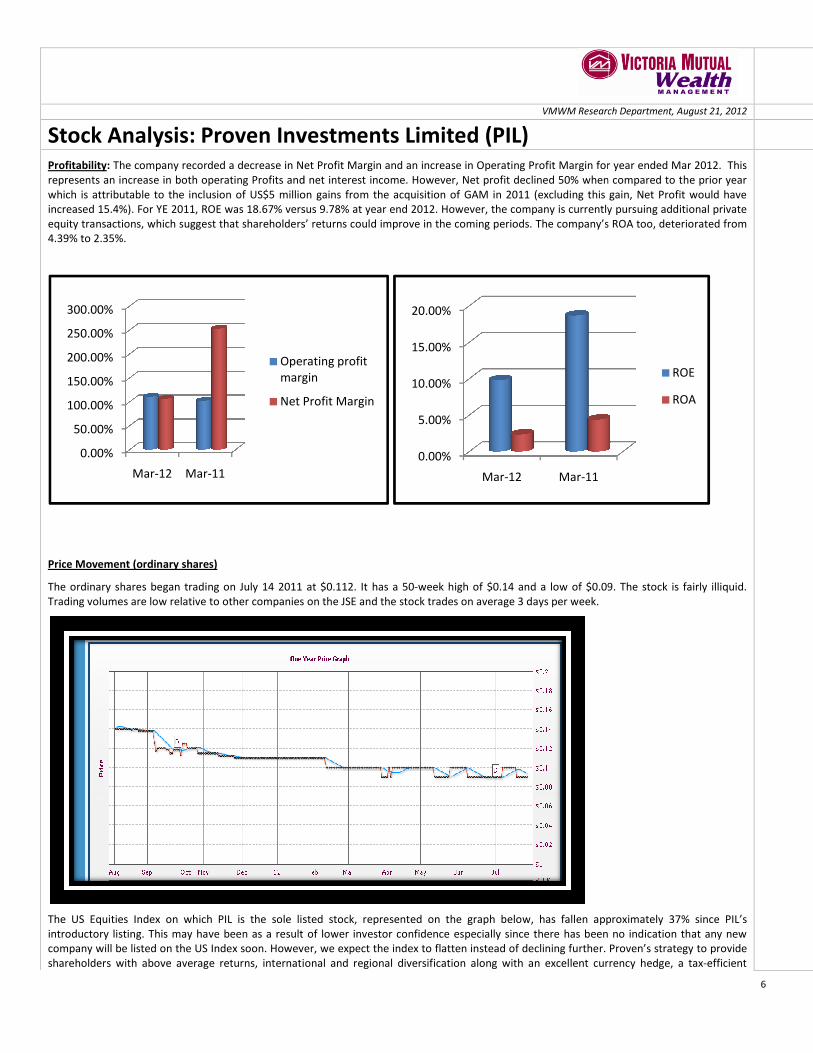
Stock Analysis: Proven Investments LimitedProfitability: The company recorded a decrease in Net Profit
represents an increase in both operating Profits and net interest income. However, Net profit declined 50% when compared to the prior year
which is attributable to the inclusion of US$5 million gains from the acquisition of
increased 15.4%). For YE 2011, ROE was 18.67% versus
equity transactions, which suggest that shareholders
4.39% to 2.35%.
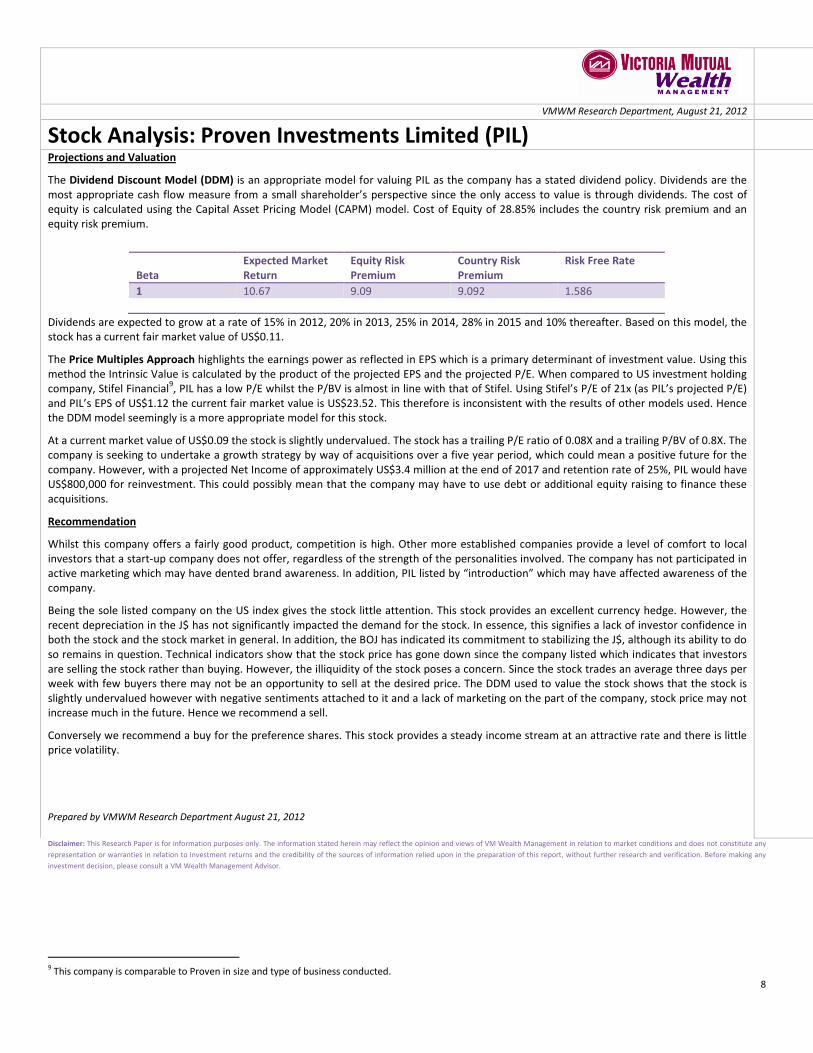
Price Movement (ordinary shares)
The ordinary shares began trading on July 14 2011 at $0.112. It has a 50
Trading volumes are low relative to other companies on the JSE and the stock trades
The US Equities Index on which PIL is the sole listed stock, represented on the graph below, has fallen approximately 37% since PIL’s
introductory listing. This may have been as a result of lower investor confidence especially since there has been no indi
company will be listed on the US Index soon. However, we expect the index to flatten instead of declining further
shareholders with above average returns, international and regional diversification along
0.00%
50.00%
100.00%
150.00%
200.00%
250.00%
300.00%
Mar-12 Mar-11
Operating profit
margin
Net Profit Margin
VMWM Research Department,
Investments Limited (PIL) Net Profit Margin and an increase in Operating Profit Margin for year ended Mar 2012.
and net interest income. However, Net profit declined 50% when compared to the prior year
million gains from the acquisition of GAM in 2011 (excluding this gain, Net Profit would have
versus 9.78% at year end 2012. However, the company is currently pursuing additional private
olders’ returns could improve in the coming periods. The company’s ROA
The ordinary shares began trading on July 14 2011 at $0.112. It has a 50-week high of $0.14 and a low of $0.09. The stock is fairly illiquid.
Trading volumes are low relative to other companies on the JSE and the stock trades on average 3 days per week.
on which PIL is the sole listed stock, represented on the graph below, has fallen approximately 37% since PIL’s
This may have been as a result of lower investor confidence especially since there has been no indi
company will be listed on the US Index soon. However, we expect the index to flatten instead of declining further. Proven’s
shareholders with above average returns, international and regional diversification along with an excellent currency hedge, a tax
Operating profit
margin
Net Profit Margin
0.00%
5.00%
10.00%
15.00%
20.00%
Mar-12 Mar-11
6
WM Research Department, August 21, 2012
for year ended Mar 2012. This
and net interest income. However, Net profit declined 50% when compared to the prior year
in 2011 (excluding this gain, Net Profit would have
company is currently pursuing additional private
The company’s ROA too, deteriorated from
week high of $0.14 and a low of $0.09. The stock is fairly illiquid.
on which PIL is the sole listed stock, represented on the graph below, has fallen approximately 37% since PIL’s
This may have been as a result of lower investor confidence especially since there has been no indication that any new
. Proven’s strategy to provide
with an excellent currency hedge, a tax-efficient
ROE
ROA

Stock Analysis: Proven Investments Limitedstructure and a robust corporate governance structure signifies the
However, low investor confidence could dampen the
Price Movement (preference shares)
Like the ordinary shares, the preference shares trade at low volumes
began trading at $5 and have a 20-week high of $5.10 and a low of $4.51.
VMWM Research Department,
Investments Limited (PIL) structure and a robust corporate governance structure signifies the company’s ability to remain a going concern over the medium term
the stock price further.
shares trade at low volumes on average 3 days per week and are fairly illiquid. Preference share
week high of $5.10 and a low of $4.51. This stock trades in J$ and is listed on the Main Index.
7
WM Research Department, August 21, 2012
remain a going concern over the medium term.
fairly illiquid. Preference shares
and is listed on the Main Index.
8
VMWM Research Department, August 21, 2012
Stock Analysis: Proven Investments Limited (PIL) Projections and Valuation
The Dividend Discount Model (DDM) is an appropriate model for valuing PIL as the company has a stated dividend policy. Dividends are the
most appropriate cash flow measure from a small shareholder’s perspective since the only access to value is through dividends. The cost of
equity is calculated using the Capital Asset Pricing Model (CAPM) model. Cost of Equity of 28.85% includes the country risk premium and an
equity risk premium.
Dividends are expected to grow at a rate of 15% in 2012, 20% in 2013, 25% in 2014, 28% in 2015 and 10% thereafter. Based on this model, the
stock has a current fair market value of US$0.11.
The Price Multiples Approach highlights the earnings power as reflected in EPS which is a primary determinant of investment value. Using this
method the Intrinsic Value is calculated by the product of the projected EPS and the projected P/E. When compared to US investment holding
company, Stifel Financial9, PIL has a low P/E whilst the P/BV is almost in line with that of Stifel. Using Stifel’s P/E of 21x (as PIL’s projected P/E)
and PIL’s EPS of US$1.12 the current fair market value is US$23.52. This therefore is inconsistent with the results of other models used. Hence
the DDM model seemingly is a more appropriate model for this stock.
At a current market value of US$0.09 the stock is slightly undervalued. The stock has a trailing P/E ratio of 0.08X and a trailing P/BV of 0.8X. The
company is seeking to undertake a growth strategy by way of acquisitions over a five year period, which could mean a positive future for the
company. However, with a projected Net Income of approximately US$3.4 million at the end of 2017 and retention rate of 25%, PIL would have
US$800,000 for reinvestment. This could possibly mean that the company may have to use debt or additional equity raising to finance these
acquisitions.
Recommendation
Whilst this company offers a fairly good product, competition is high. Other more established companies provide a level of comfort to local
investors that a start-up company does not offer, regardless of the strength of the personalities involved. The company has not participated in
active marketing which may have dented brand awareness. In addition, PIL listed by “introduction” which may have affected awareness of the
company.
Being the sole listed company on the US index gives the stock little attention. This stock provides an excellent currency hedge. However, the
recent depreciation in the J$ has not significantly impacted the demand for the stock. In essence, this signifies a lack of investor confidence in
both the stock and the stock market in general. In addition, the BOJ has indicated its commitment to stabilizing the J$, although its ability to do
so remains in question. Technical indicators show that the stock price has gone down since the company listed which indicates that investors
are selling the stock rather than buying. However, the illiquidity of the stock poses a concern. Since the stock trades an average three days per
week with few buyers there may not be an opportunity to sell at the desired price. The DDM used to value the stock shows that the stock is
slightly undervalued however with negative sentiments attached to it and a lack of marketing on the part of the company, stock price may not
increase much in the future. Hence we recommend a sell.
Conversely we recommend a buy for the preference shares. This stock provides a steady income stream at an attractive rate and there is little
price volatility.
Prepared by VMWM Research Department August 21, 2012
Beta
Expected Market
Return
Equity Risk
Premium
Country Risk
Premium
Risk Free Rate
1 10.67 9.09 9.092 1.586
Disclaimer: This Research Paper is for information purposes only. The information stated herein may reflect the opinion and views of VM Wealth Management in relation to market conditions and does not constitute any
representation or warranties in relation to investment returns and the credibility of the sources of information relied upon in the preparation of this report, without further research and verification. Before making any
investment decision, please consult a VM Wealth Management Advisor.
9 This company is comparable to Proven in size and type of business conducted.