Stochastic models in Mathematical Genetics (SC1) Simon Myers Email:...
121
Stochastic models in Mathematical Genetics (SC1) • Simon Myers • Email: [email protected] • Course webpage: www.stats.ox.ac.uk/~myers/ma thgen.html • Class problem sheets (7 sheets) are posted online • Notes are also posted online. (First four weeks.)
-
date post
19-Dec-2015 -
Category
Documents
-
view
226 -
download
1
Transcript of Stochastic models in Mathematical Genetics (SC1) Simon Myers Email:...

Stochastic models in Mathematical Genetics (SC1)
• Simon Myers • Email: [email protected]
• Course webpage: www.stats.ox.ac.uk/~myers/mathgen.html
• Class problem sheets (7 sheets) are posted online
• Notes are also posted online. (First four weeks.)

Population genetics
• All organisms differ – due to genetic variation– Unrelated people differ more
than relatives– Still, people share
characteristics• Hair colour, eye colour,
disease susceptibility, colour-blindness, blood group.....
Figure 2: Nests with both host and parasitic common cuckoo eggs, illustrating near-perfect mimicry to the human eye. Black arrows identify cuckoo egg.© 2010 Nature Education Courtesy of M. Honza, T. Grim, & C. Moskat. All rights reserved
• These characteristics are all the result of genetic variation• Why, and how, do we expect mutations to be shared?
• The answer comes only by carefully considering models for genetic data, and their implications
• We need to look “back in time” to discover how mutations arise and spread in a population
(Wellcome Trust, 2010)

Y-chromosome “genealogical tree”
• The axis is time in thousands of years, for a sample of 1,371 human males. Tree built using DNA sequences.
• Black circles represent mutations seen in those samples • Shared characteristics come from rare mutations in the distant past• This tree and the times on it were inferred based on the coalescent
model• Computationally intensive inference (Griffiths and Tavaré, 1994)• This model, its derivation, its properties and inference under the
model are what we will look at first, using : stochastic processes ,and graph theory.
Hammer et al.(PNAS, 2000)http://www.pnas.org/content/97/12/6769/F1.expansion.html

Outline of the course
• Two parts, of 8 lectures each• Part I (weeks 1-4)
– The “neutral model”– Modelling genetic data– Genealogical relationships – Mutation patterns in populations
• Part II (weeks 5-8)– Extending the neutral model– Recombination and “shuffling of
genetic material”– Natural selection– Diffusion process models in genetics

The Wright-Fisher model• Suppose we are interested in a
fragment of DNA, which might look like this:
AC..AAACGTTTAGCCGAT...GG• There are M (very similar) copies
of this fragment in the whole population
• M is often very large (>>1000)• For now, we view each fragment
as an “object”, called a haplotype or gene or sequence– Could be a few positions as shown
above, or the whole Y-chromosome of 58,000,000 letters (bases)
• Our task: model the history of these fragments in the population

The Wright-Fisher model
• Fisher, Wright (1930-31)• “The simplest imaginable inheritance
model”• Models the evolution of a population
forward in time from one generation to the next
• We then (approximately) go back in time • Constant size population of M haplotypes• Generations are discrete, and
independent: in a generation, a complete new set of M haplotypes is created, and all M existing haplotypes die
• Each of the M new haplotypes inherits their genetic material from the previous generation, choosing their “parent” independently and uniformly at random

A picture makes this clearer.Formally, we form generation k+1 by choosing M “parents” at random in generation k with replacementIf parent of haplotype i in generation k+1 is Zi
Some population members have 0 children, others more than 1 child:
Each haplotype chooses parent in previous generation
If haplotypes share a parent back in time, this is called a coalescence eventIf we continue back in time, eventually a single parent is reached, the Most Recent Common Ancestor (MRCA) :
Mj
/Mj)P(Z i
,....,1
1

Mj
/Mj)P(Z i
,....,1
1
Each haplotype chooses parent in previous generation
If haplotypes share a parent back in time, this is called a coalescence eventIf we continue back in time, eventually a single parent is reached, the Most Recent Common Ancestor (MRCA) :
A picture makes this clearer.Formally, we form generation k+1 by choosing M “parents” at random in generation k with replacementIf parent of haplotype i in generation k+1 is Zi
Some population members have 0 children, others more than 1 child:

Mj
/Mj)P(Z i
,....,1
1
We can examine historical relationships in a sample
Each haplotype chooses parent in previous generation
If haplotypes share a parent back in time, this is called a coalescence eventIf we continue back in time, eventually a single parent is reached, the Most Recent Common Ancestor (MRCA) :
A picture makes this clearer.Formally, we form generation k+1 by choosing M “parents” at random in generation k with replacementIf parent of haplotype i in generation k+1 is Zi
Some population members have 0 children, others more than 1 child:
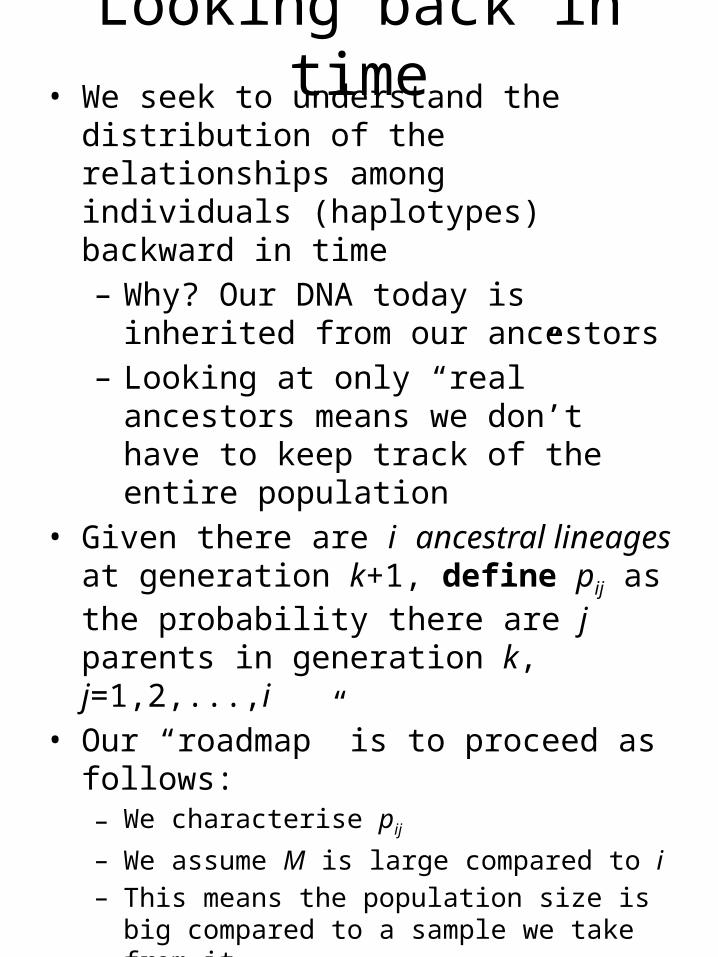
Looking back in time• We seek to understand the distribution of the
relationships among individuals (haplotypes) backward in time– Why? Our DNA today is inherited from
our ancestors– Looking at only “real” ancestors means we
don’t have to keep track of the entire population
• Given there are i ancestral lineages at generation k+1, define pij as the probability there are j parents in generation k, j=1,2,...,i
• Our “roadmap” is to proceed as follows:– We characterise pij
– We assume M is large compared to i– This means the population size is big compared to
a sample we take from it– In this setting, we use pij to approximate the
distribution of the total time while exactly i ancestors remain
– We rescale this time, to measure it in natural units– We show that as M becomes large, the whole
(rescaled) backward process converges (beautifully) to a limit, called the coalescent

Example: two lineages• Suppose we have two ancestors in generation
k+1. Then in generation k there are 1 or 2 ancestors:
• Generations are independent• Define t2 as the time until a
coalescence event occurs, then
• Obviously, this is geometric . What happens if M is very large? Note the mean time
• If we measure time in units of M generations, the mean time is 1; independent of M. Proposition 1.0 shows that as M becomes large, this rescaled time has an exp(1) distribution.
)/11(
/1
22
21
Mp
Mp
,2,111
1)(1
2
kMM
kPk
ME )( 2

Example: two lineages
exp(1) of c.d.f the:0any for
,∞→ as 1→
111
≤)≤()≤(
111
)(1)≤(
-
222
22
t
Me
M
MtPMtPtTP
M
kPkP
t
Mt
k
Proposition 1.0In a Wright-Fisher model with population size M, for a sample of size two taken from the population define t2 as the time back until a coalescence event occurs. Then setting T2=t2/M to measure time in units of M generations, in the limit as M→∞, T2 has an exponential distribution: T2~exp(1).
Proof From above:
Note: by independence of generations, this extends to give the limiting time back until coalescence from any time point where we have two lineages.

M and coalescence times in humans and other animals
In humans, it is known that “appropriate” values for M are surprisingly small. This is approximation is called the “effective population size”:
M ≈ 20,000 in EuropeM ≈ 19,000 in East AsiaM < 50,000 for all human populations, highest
in Africa

M and coalescence times in humans and other animals
The mean coalescence time for two lineages is just in units of M generations, so if we have G=28 years per generation, the average ancestry depth for 2 human chromosomes is
1 ×M ×G in years(20,000-50,000) × 28 =480,000-1,400,000 years
M varies widely across species (Charlesworth, Nature Reviews Genetics 2009):
25,000,000 for E.coli2,000,000 for fruit fly D. Melanogaster
1)( 2 TE
<100 for Salamanders (Funk et al. 1999)
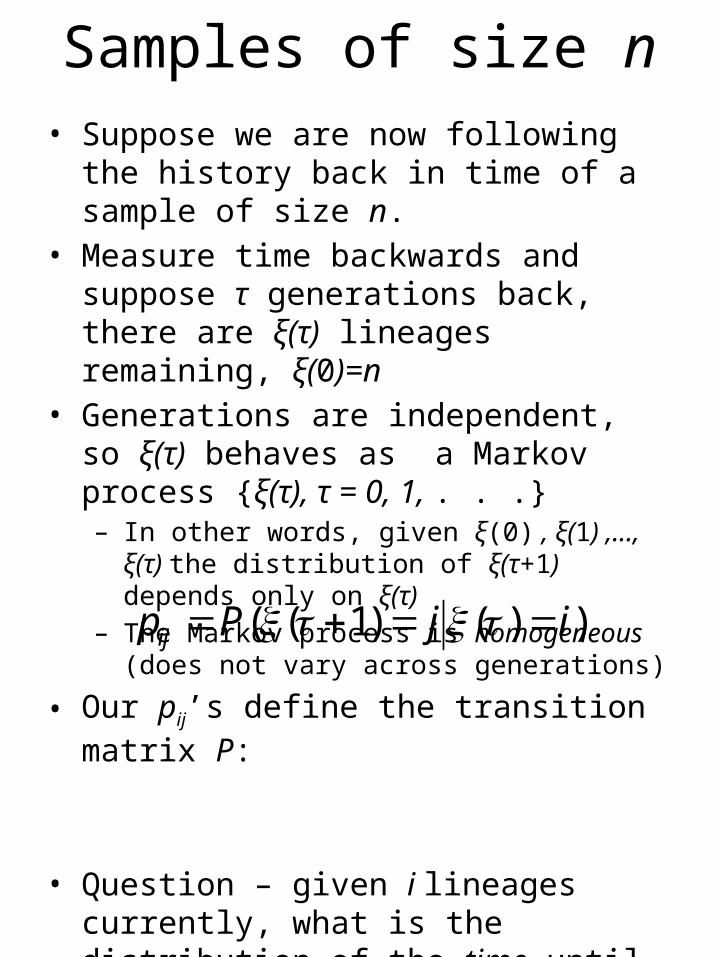
Samples of size n• Suppose we are now following the history
back in time of a sample of size n. • Measure time backwards and suppose τ
generations back, there are ξ(τ) lineages remaining, ξ(0)=n
• Generations are independent, so ξ(τ) behaves as a Markov process {ξ(τ), τ = 0, 1, . . .}– In other words, given ξ(0) , ξ(1) ,..., ξ(τ) the
distribution of ξ(τ+1) depends only on ξ(τ) – The Markov process is homogeneous (does not
vary across generations)
• Our pij’s define the transition matrix P:
• Question – given i lineages currently, what is the distribution of the time until the next coalescence event?
• At the next coalescence event, how many lineages coalesce?
))()1(( ijPpij

Samples of size nWe consider the transition matrix:
.2
11
1
2
2
211
1
1
11
11
21
11
121
)())()1((
21
1,
22
21
1
,
MOi
MMO
M
i
i
M
iM
M
M
Mp
i- i
MOM
MOkM
M
i
MM
M
iM
M
M
M
Mp
ii
jiPijPp
ii
i
i
k
ii
ij
:is ,so coalesce, lineagesof pair one yprobabilit the and
: e,coalescenc noof yprobabilit the so
iii ,5
1,5 iii

Samples of size nWhat is the probability that more than one pair of
lineages coalesce at the same time? This is
Putting this together, supposing M is large and we have i lineages, in a single generation, to
1. In words, asymptotically, only one pair of lineages can coalesce at a time – we have a binary tree.
2. By symmetry, each time a coalescence occurs, all pairs of lineages are equally likely to coalesce
3. To characterise the asymptotic distribution of trees, we then just need to derive the distribution of times between coalescence events. First, the answer.
2
2222
1,,
0
11
1))(1)1((
MO
MOM
MOM
ppiiPii
iiii
1
0
1
,
21,
2,
ij
pM
p
Mp
ji
i
ii
i
ii
any for
2MO

The coalescent (Kingman, Stochastic processes and their application, 1982)
• As for the two lineage case, for the general case we will measure time in unit of M generations
• We will show that the ancestral tree distribution in the Wright-Fisher model converges to the coalescent
• This is one of the greatest discoveries in population genetics• The coalescent limit actually applies much more widely than
just the W-F case (e.g., models with non-discrete gens)• The coalescent can be adapted to include many realistic
features, some which we will see (mutation, population size changes, recombination) and others we will not (population splits and merges, migration......)
• The coalescent is a distribution on binary trees:

The coalescent (Kingman, Stochastic processes and their application, 1982)
Definition 1.1The coalescent is a distribution on binary trees. Starting with n lineages, pairs of lineages coalesce backward in time until a single common ancestor is reached. Defining times Tn, Tn-1,...,T2 while n,n-1 ,..., 2 ancestors remain, the times Tj are independent and exponentially distributed:
At the time of coalescence from j to j-1 lineages, a pair of lineages is chosen at random from the j(j-1)/2 possibilities and coalesces.
The coalescent:
)1(
2)(
2)(
2exp~ 2
jjTEe
jtf
jT j
tj
jj 0t ,
n=6
1)()1exp(~ 22 TET
3/1)()3exp(~ 33 TET
6/1)()6exp(~ 44 TET
15/1)()15exp(~ 66 TET 10/1)()10exp(~ 55 TET

The coalescent limit(Kingman, Stochastic processes and their application, 1982)
Proposition 1.2In the Wright-Fisher model, as the population size M converges to infinity, if time is measured in units of M generations then the distribution on ancestral trees for a sample of n sequences converges to the coalescent.
Proof: We previously showed that as M→∞, only one pair of lineages coalesce at a time, so the limiting tree is binary.
In the Wright-Fisher model, genes choose parents at random, so obviously all pairs of lineages are equally likely to be the one to coalesce at a coalescence event
It remains to show only that the coalescent gives the correct distribution on the rescaled times Tj while j edges remain in the tree. Suppose a sample has j ancestors at some time in the past. Recall we showed the probability j ancestors remain in the previous generation is given by
If tj is the total time while j ancestors remain then
221 MOM
pj
jj
kj
kjjj MO
MpkP
221)( (independence)

The coalescent limit(Kingman, Stochastic processes and their application, 1982)
Proposition 1.2In the Wright-Fisher model, as the population size M converges to infinity, if time is measured in units of M generations then the distribution on ancestral trees for a sample of n sequences converges to the coalescent.
Proof:
Now we rescale time in units of M generations. Set Tj=tj/M.
)1(
2)(
variable.random expan of c.d.f just the is This
. as 1
)(1111
)(1)()(
real. negative-nonany be 0Let t
.limit in the of cdf obtain the toneed We
2
2
2222
jjTE
Me
MtOMt
tMO
M
MtPMtPtTP
MT
j
j
tj
MtjMtj
jjj
j
Properties of the coalescent
The coalescent is the limit of a range of models. From now on, we will work using only this model (until week 6).
The coalescent describes what evolutionary history looks like in populations
We will see it allows us to study variation, its main use.
It also allows us to understand population history
What properties does it predict?We will ask two things in particular:
1. How deep are genealogies in time? How variable are these depths?
2. What is the distribution of tree shapes under the coalescent – e.g. are they approximately symmetrical?

Times in the coalescent
In the coalescent the number of lineages decreases from n to 1. The time at which the final coalescence takes place is called the time to the most recent common ancestor (TMRCA)
1.3 Mean and variance of the TMRCAImmediately:
21 TTTW nnn
n
jjjj
nnnn
TETETEWE
n
j
n
j
n
j
nnn
112
2
1
2
1
2
12
2
21
2
1
2
222
21
)()(
))(()(
)()()()(

Times in the coalescent1.3 Mean and variance of the TMRCAAlso, the times Tj are independent, so
(problem sheet 2)As sample size becomes very large: n→∞
We can interpret this as saying the expected time to coalescence of the whole population is finite, with mean 2. We can build a tree for the whole population. In units of generations:
)()()()( 21 TVarTVarTVarWVar nnn
)(
21
12)(
n
n
WVar
nn
WE as
humans for years sgeneration
000,900000,40
2)(
MWE
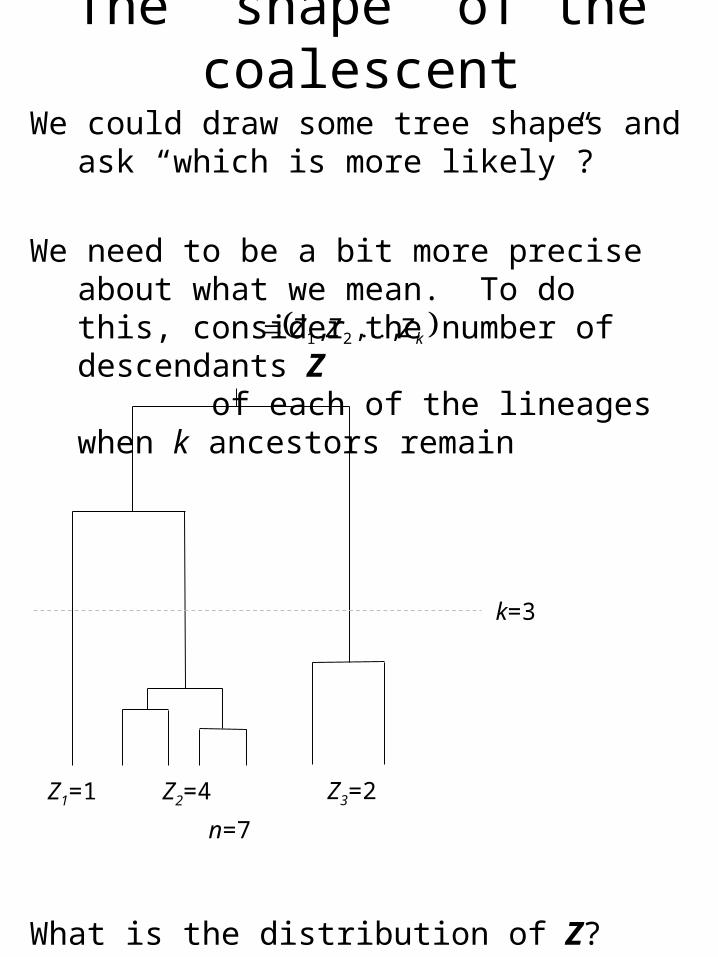
The “shape” of the coalescentWe could draw some tree shapes and ask “which
is more likely”?
We need to be a bit more precise about what we mean. To do this, consider the number of descendants Z of each of the lineages when k ancestors remain
What is the distribution of Z? ANSWER: It is uniform on the possibilities
n=7
k=3
Z1=1 Z2=4 Z3=2
kZZZ ,,, 21

The “shape” of the coalescentProposition 1.4Suppose we have a sample of size n genes, and
that at some time back in the past, there are k sample ancestors. Then the number of descendants Z of each lineage has a uniform distribution on partitions of n :
ProofWe will use (backward) induction. The result is
trivial for k=n. For the induction, suppose it is true for k≥m say. We only need to prove the hypothesis for k=m-1.
(If so, then the hypothesis is obviously true for k=2,....,n)
1
21
21
1
1),,,(
1,
k
nzzzP
iznzzz
k
ik
all for For
kZZZ ,,, 21
(1.4.1)

The “shape” of the coalescentProposition 1.4 proof ctd:Clearly, when we have k lineages, (i) some pair of lineages coalesced to go from k+1 to k
lineages(ii) each of the k current lineages, say i, has probability 1/k
of being the one that coalesced last (i.e. branches next)(iii) Conditional on i branching next, we can write down a
condition on the number of descendants of the k+1 lineages:
(iv) By the induction hypothesis, the probability of any configuration while k+1 ancestors remain is known, so using (iii):
(v) Last, we need to sum over i according to (ii):
k
k+1
Z1 Z2 Z3 .....Zi ...... Zk-1 Zk
Z1 Z2 Z3 Zk-1 ZkZi’ Zi -Zi
’
k
ni
z
zk
n
z
zkiiik
kk
z
zzzzzzP
izzzP
i
i
i
i
1 11
1'11
1
1
1'211
21
1
,,,',',,,
,,,
1
branches

The “shape” of the coalescentProposition 1.4 proof ctd:
Example: how many copies of a mutation that occurs when k=2 are present in the sample?
The same as the number of descendants of one of the lineages when k=2 (Sheet 1, Question 5)
Conclusion: coalescent trees are not very symmetric
proof the completing ,
since
branches
branches) branches
1
1
1
1
1
121
121
21
1
1
,)(1
111
1,,,
(,,,
,,,
k
n
nzk
kn
k
n
kk
nz
kizzzP
iPizzzP
zzzP
k
ii
k
ii
k
ikk
k
ikk
kk

The “shape” of the coalescentNote: We didn’t use times in the last proof – so
Proposition 1.4 holds more generally, for any binary tree with random coalescence.
Corollary: Suppose there are k lineages and let Z be the number of descendants of one particular lineage. What is the distribution of Z?
Answer: This is just the marginal distribution of Z1 in the previous proof. If Z1=z, then the number of descendants of lineages 2,....,k must form a partition of n-z, into k-1 boxes. Thus
1
1
2
1
11
1
1
1
k
n
k
zn
k-znk
n
zZPzZP kk
into of partitionsof #

Simulating the coalescent• We’d like to apply all this theory to the real
world!
• In practice, we can usually only learn about history by looking at patterns of mutation in data
• One thing we’d like to be able to do is simulate the coalescent to see if patterns “match up” with expectations– If so, happy. If not, refine model or infer new model
parameters– Several free programs do this, e.g. makesamples, “ms”
(R.R. Hudson)
• How can we simulate the coalescent?– We must simulate exponential times Tn, Tn-1,..., T2
between coalescence events (and record these)– Then, at each coalescence event we must sample a
random pair, record the answer, remove the original pair and replace with a new label to mark the coalesced pair
– Problem 4 on the sheet

Urn models (supplementary!)Instead of the whole coalescent tree, suppose we only wish to simulate a sample from the number of descendants of k lineages in a sample of size n
• Urn models are a classical tool in probability theory• Also offer efficient simulation frameworks in genetics
• In general, they are probability distributions on sets of coloured balls, sitting in an urn
• We remove balls, and add balls, according to specified rules– This makes simulation trivial
• Balls often represent other things (e.g., lineages)
• There’s a nice urn model representation of the distribution of descendants of k lineages
• Uses the only thing we needed for our induction proof – when there are k lineages, each is equally likely to branch forward in time to give k+1 lineages. Gives an algorithm:
Classical Grecian urnClassical probability urn

Urn model representation1. Begin with k balls in an urn, of different colours2. Take out a ball at random from those in the urn3. Replace this ball with two of the same colour4. Repeat 2 and 3 until there are n balls – then stop
• k initial balls represent lineages, and balls sampled represent lineages that branch forward in time
• Viewing it this way, our uniform distribution on partitions:
is just a classical result in probability theory.
k=4
1
21
21
1
1),,,(
1,
k
nzzzP
iznzzz
k
ik
all for for
(1.4.1)

2.0 Mutation• In practice, we can only really learn about population
history using mutation patterns– We can’t just look – slow pace of change in populations– In any case, histories of interest are usually...historical– We have to infer what happened by looking at the
patterns of mutations in samples from the population– This will be the subject of much of the rest of the
course• We won’t need to know much about the details in some
cases, but it helps to have an idea• What is mutation? DNA can change in a variety of ways:
TGCATTGCGTAGGCTGCATT---TAGGC
TGCTCATCATCATCAGC
TGCATTCCGTAGGC
TGCATTGCGGCGTAGGC
TGCTCATCA------GC
Point mutation
EventPer gen. probability
Deletion
Duplication
Tandem repeat variation
Selfish element insertion
~1.25-2.5×10⁻⁸
<10-8
<10-8
≤5%
?

Mutation in the coalescent
• In order to develop a model for genetic variation, we need to include mutation
• We extend the coalescent to allow mutation• Recall edges represent ancestral lineages back in time• So: mutations in ancestors can be represented on the edges (as
circles)• The descendants of a mutant edge inherit that mutation (unless
another mutation reverses it)
• Assume that with constant probability m per generation, there is a mutation (e.g. m =2.5×10⁻⁸).
• In coalescent time, there are M m mutations per unit time• We model this by taking a parameter q=2M m
• Mutations happen (in the limit as M→∞) continuously along edges, according to a Poisson process of rate q/2 on each edge
Distinct mutation events

Mutation in the coalescent
??? Poisson process???
• Let us refresh our memories, with a simple characterisation of a Poisson process
Definition 2.1 Poisson process.
A Poisson process N(t) of rate l is a continuous time process counting events in time, such that the number of events E(T)=N(T+t)-N(t) in any time interval [t,t+T) of length T has a Poisson distribution with mean ,lT independently of all other time intervals.
t t+T
E(T)~Poi(lT)
N(t)=0, N(t+T)=3E(T)=3
Poi( /2q T6)
Poi( /2[q T6+T5+T4])
Poi( /2[q T6+T5+T4+T3+T2])

The number of mutationsSums of independent Poisson random variables
are PoissonDefine S= Mn + Mn-1 +…+ M2 to be the total number
of mutations for a sample of size n, where Mj is the number of mutations while j ancestors.
Proposition 2.2S has probability generating function
Further, for each j, Mj is independent, and has a geometric distribution with parameter pj=(j-1)/(q+j-1).
Proof.By properties of Poisson processes, since total
21
21
21
2)1(2/
have we,,,given
,2)1(length edge
TTnnTS~Pois
TTT
TTnnTT
nn
nn
nn
11
1
)1(1)(
n
jn j
zzf

The number of mutationsProposition 2.2 proof ctd.Thus
Further the jth term in this product corresponds to mutations in time Tj, so gives the p.g.f of Mj.
result required the 1
1-1
)12 (since 212
1-1
) of (m.g.f 21
)(independ. 21
21
2211
21 independ. that theRecall
p.g.f.Poisson thefrom 21
2
1-
2
1-
2
2
2
21
n
j
n
jj
n
jjT
n
jj
n
jj
nnn
j
ST
Sn
j
z
jjTjj
jz
TjzM
jTzE
jTzE
TTnnTzEzf
jjT
TzE
TzEEzEzf
j
)(
))(/exp(~/)(
)(
/)(
/)(exp
/)(exp
/)()((exp)(
)/)(exp(~
/)((exp
)()(

The number of mutationsProposition 2.2 proof ctd.We are essentially done, as this is the p.g.f of a
geometric random variable. Indeed, setting
It is worth pointing out an interpretation here• Mutations happen independently for each
epoch, while j ancestors• Consider mutations, or coalescences, “events”• While j ancestors remain, the probability the
next event is a mutation is q/(q+j-1). • Otherwise, it is a coalescence with probability
pj= (j-1)/(q+j-1),and we move to a state with j-1 ancestors
1
1
0
1
)1(
11
1
1
1
1
1)(
,...1,0,1
1
1
j
z
j
z
j
j
j
j
jzzEzQ
kj
j
jkMP
k
k
kMj
k
j
j
-1

The mean/variance of mutation counts
Using the p.g.f of Mj
This immediately gives expectation and variance for the total number of mutations S:
This motivates Watterson’s estimator (1975) of q:
11
,1
)1(')1(')1(''),1('
12)1('',
1)1('
2
2
2
jjM
jME
QQQMQME
jQ
jQ
jj
jjjjjj
jj
Var
Var
so
nSVnSE
n
jjjjS
jjSE
n
j
n
j
n
j
n
j
n
j
log~ar ,log~
As
11
11Var
1
1
1
12
21
12
2
1
12
1
1
1ˆ
n
j j
S This moment estimator is unbiased, and consistent as n→∞

Example: Estimation of population size
• As we have discussed, the coalescent is a limit under very general population assumptions
• Time in units of M generations, where M is the “effective population size”
• Estimation of M allows us to calibrate into years, to understand time depth.
• I have given M estimates for humans• The data only give information directly on
q=2M m• To infer M or m, we must know (or assume) the
other. This idea is how M is generally estimated
Example 1 (Zhao et al., PNAS, 2000): In sequence data for 128 human chromosomes sampled worldwide, 75 variant sites were identified. If the mutation rate per DNA base per generation is 2.3 × 10⁻⁸, and 9,901 bases were sequenced, estimate the human effective population size

Example 1 (Zhao et al., PNAS, 2000): In sequence data for 128 human chromosomes sampled worldwide, 75 variant sites were identified. If the mutation rate per DNA base per generation is 2.3×10⁻⁸, and 9,901 bases were examined, estimate the human effective population size
Solution:Watterson’s estimator:
Because we are given , m we can estimate M:
This is a fairly typical value for a worldwide human
sample. Finally...how does one get m? Two ways:– Chimpanzee genome comparisons– Direct measurement in families
Note: Watterson’s estimator does not use all the information in data for q.
82.131
751
ˆ127
1
1
1
j
n
j jj
S
353,30ˆ7.1952ˆ
10 .55410 3.2990122 -4-8
M
MMM

Example: Time conditional on number of mutations
• Genealogy depth is stochastically variable• Longer trees have more mutations (segregating
sites) on average• The distribution of tree depth is altered given the
number of segregating sites seen in data
Example 2 ( Dorit et al., Science, 1995): In sequence data for 38 human Y chromosomes sampled worldwide, no variant sites were identified at the ZFY locus. If the mutation rate at this gene per generation is 1.96 × 10⁻⁵, and generations last 20 years, derive an equation for the expected TMRCA conditional on this data and a population size N

SolutionIf there is no variation in the sample, this means there are no mutation events in the coalescent history of the sample:
Mn = Mn-1 =…= M2=0
We can consider the times Tj while j ancestors remain. Recalling that over time Tj, the number of mutations on each of the j edges is independently Poisson with mean q Tj/2, we have:
Thus conditional on Mj=0, Tj has the exponential distribution with a (reduced) mean
constant) a to(up
2
1exp
of pdf theusing 2
)0(
)()|0()0|(
so and )|0(
2/)1(2/
2/
j
jtjjtj
j
jjjjjjjj
tjjjj
tjj
Tej
e
MP
tftTMPMtf
etTMP
jj
j
1
2)0|(
jjMTE jj

Solution continuedFinally, we can give the expected TMRCA (in years) conditional on no mutations:
Tabulating, we see our knowledge of no mutations (in 729 bp) does not have a huge effect:
21 TTTW nnn
years)(in 10 1.9621
220
gens) (in 1
2
)0|()0|(
38
25-
2
2
j
n
j
n
jjjn
NjjN
Njj
MTESWE
Population size N
Mean TMRCA given no variation
Mean TMRCA unconditionally
2,500 92,000 97,000
5,000 173,000 195,000
10,000 313,000 389,000
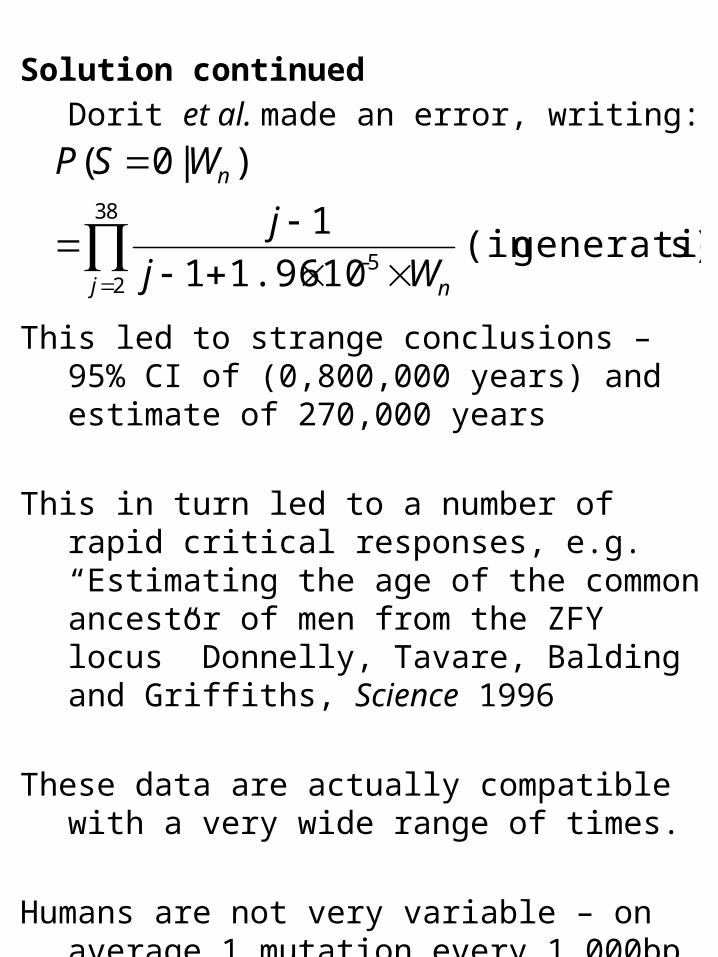
Solution continuedDorit et al. made an error, writing:
This led to strange conclusions – 95% CI of (0,800,000 years) and estimate of 270,000 years
This in turn led to a number of rapid critical responses, e.g. “Estimating the age of the common ancestor of men from the ZFY locus” Donnelly, Tavare, Balding and Griffiths, Science 1996
These data are actually compatible with a very wide range of times.
Humans are not very variable – on average 1 mutation every 1,000bp between 2 human chromosomes.
s)generation(in 10 1.961
1
)|0(38
25-
j n
n
Wj
j
WSP

Supplement: distribution of number of mutations
• We derived the p.g.f of the total number S of mutations. What is the full distribution of S?
• We can apply the Gamma function property that for real z, G(z+1)=z G (z):
1
0
)(
2
1
0
2
0
1
0
2
1
0
)1(2
1
1
11
1
1
!
)()()(
,10)1()()1ln()(
)1ln()1(!
)1(
)1ln(exp)1()1(
)1()1(
))1(1,1()1(
))1((
))1(1()!2()1(
)1(
)1(1
)()(
dxj
xexfjSP
xxnxfxx
dxxxxj
nz
dxxzxxn
dxxxn
znn
zn
znn
zj
j
j
z
jSPzzf
jx
n
jn
j
j
n
zn
n
j
n
j
j
jn
, and if so
)of s(propertie
fun." "of defn

Variable size populations• Real populations don’t have constant size. Suppose
the population size a time t in the past is N(t)=N(0)ν(t)• We need a “clock” – as before, measure time t in units
of N(0) generations, N(0) now present day size• We will extend the coalescent to this setting• Recall that while j ancestors remain in a Wright-Fisher
model, the probability, i.e. “rate” at which coalescence occurs is j(j-1)/2M per generation
• In the new setting, the new per generation coalescence rate is
• Measuring time in units of N(0) generations, while j ancestors, coalescence occurs at rate
Timein past
A B C)(2
)1(
t
jj
)0(
1
)(2
)1(
)(2
)1(
Nt
jj
tN
jj

Definition 2.3The coalescent with variable population size is a distribution on binary trees. Starting with n lineages, randomly chosen pairs of lineages coalesce backward in time until a single common ancestor is reached. Suppose the relative population size at time t in the past is ν(t). While j edges remain at time t, coalescence events occur with instantaneous rate j(j-1)/2ν(t). Equivalently,defining times Tn, Tn-1,...,T2 while n,n-1 ,..., 2 ancestors remain:
Comments1. The standard coalescent case is ν(t)≡1
2. Equation 2.3.1 can be derived directly as the Wright-Fisher limit
3. Intuitively, in (2.3.1), if there are j lineages from time s to time t+s, the coalescence rate changes from j(j-1)/2ν(s) to j(j-1)/2ν(s+t)
This is the reason for the integral term, which “averages out” the coalescence rate
Variable size populations
ts
s
jnnj duu
jsTTTtTP
)(
1
2exp11
(2.3.1)

How do we, e.g., simulate the coalescent with variable size?
The answer: we can use a coupling of times with the standard coalescent case.
Idea: we transform time into new units. Define
Proposition 2.3In the variable population size coalescent with relative population size ν(t) at time t in the past, if time is rescaled by setting
then the transformed times Sn’, Sn-1’,...,S2’ at which coalescence events occur are distributed according to the standard coalescent with constant size population
Comments1. Note that transformed time increases more
quickly when the population size is small2. We invert the transformation to give each 3. To recover coalescence times, we take
differences:
Variable size populations
t
duu
t0 )(
1'
1 jjj SST
0, 11 njnnj STTTS (coalescence times)
jS

Proposition 2.3In the variable population size coalescent with relative population size ν(t) at time t in the past, if time is rescaled by setting
then the transformed times Sn’, Sn-1’,...,S2’ at which coalescence events occur are distributed according to the standard coalescent with constant size population
ProofDefine the untransformed coalescence times Sn, Sn-1,...,S2. Restating (2.3.1) in terms of these times, we have:
Now it is clear the transformation is well defined, so for every positive t’=sj’ there is a corresponding untransformed t=sj. Further the transformation is increasing so
Variable size populations
t
duu
t0 )(
1'
0''2
)1(exp''''
0)(
1
2
)1(exp
0,)(
1
2
)1(exp
1
'
'
11
111
1
1
1
jj
s
s
jjjj
jj
s
s
jjjj
ts
s
jj
ssdujj
sSsSP
ssduu
jjsSsSP
tsduu
jjsStsSP
j
j
j
j
S.T.P is it and
11 '' jjjj ssss

Proposition 2.3In the variable population size coalescent with relative population size ν(t) at time t in the past, if time is rescaled by setting
then the transformed times Sn’, Sn-1’,...,S2’ at which coalescence events occur are distributed according to the standard coalescent with constant size population
ProofUsing this reverse transformation, for any
A key use of this idea is in simulation of histories under this model (and inference).
Variable size populations
t
duu
t0 )(
1'
'
'
1
0 0
1111
1
1
1
2
)1(exp''
2
)1(exp
)(
1
)(
1
2
)1(exp
)(
1
2
)1(exp
''''
j
j
j j
j
j
s
s
jj
s s
s
s
jjjjjjjj
dujj
ssjj
duu
duu
jj
duu
jj
sSsSPsSsSP
:0'' 1 jj ss

• Simulation under a variable size model can be accomplished simply, by the following:
1. Simulate coalescence times Sn’, Sn-1’,...,S2’ under the neutral coalescent. Set Sn+1’=0, and then:
where the Uj’s are i.i.d U(0,1) random variables.
2. Convert these back to untransformed times Sn, Sn-1,...,S2 using
3. Given times, coalescence events are easy to sample, and mutation event counts have the usual Poisson distribution given tree times (note the mutation process in each ancestral lineage is independent of the population size).
In exponential expansion ν(t)=exp(-bt), so
Simulation
jS
j duu
S0 )(
1'
2,,1,,log2
''' 1
nnjU
jSST jjjj
'1log1
11
'0
jjS
S
tj SSedueS j
j
(sheet 2 question 4)
Example

“Star-like” genealogies
Exponential expansion (or expansion generally) makes times relatively shorter in the top parts of the tree
Question: What is the effect of variation in population size on genetic variation data?
This could offer us a way to learn about population sizes in the distant past
To do that, we need to think about the frequency spectrum of mutations
We start by thinking about single mutations

3.0 The spread of diversity
The red mutation happens while there are k=4 lineages remaining.
It spreads and is seen in 3 of 6 sample members – the descendants of the lineage on which it occurs
More generally, the shape of the coalescence tree (Proposition 1.4 corollary) tells us that for any mutation that occurs while k ancestors remain from an initial sample size of n, the probability of b descendants is in general:
10
1
14
16
24
136
)3(
1
1
2
1
)( 4,6
p
k
n
k
bn
bpnk

3.0 The spread of diversity
Almost always in practice, we only see diversity patterns.
We know n=6, b=3 but we do not know the number of lineages when the mutation occurred
What is the unconditional probability, qnb, for a site which varies, that we observe b mutant copies in a sample of size n?This is called the (expected) frequency spectrum of mutations
We can also ask, how old is a mutation seen in b of n copies?
lineages) )P((
lineages) (lineages)P while |copies mutant
kbp
kkbPq
n
knk
n
knb
2
2
(

The infinite-sites model
Strictly, we need to make an assumption here.
If we see a mutation in some sample members but not others, we assume it is the result of one historical event, not e.g. two identical independent mutation events in different ancestors
Specifically – mutations always occur at a position never before mutant. This is called the infinitely-many-sites model
In this model, each individual site has a vanishingly small probability of mutating (but a region has a non-zero rate)
Without loss of generality, label mutations using independent uniform random variables in [0,1] (i.e. labels always unique)
Not allowed!
0.224
0.676 0.83
0.543
0.02
0.965
0.339
0.802
0.83

The infinite-sites model
Not allowed!
0.224
0.676 0.83
0.5430.965
0.339
0.802
0.83
1 2 3 4 5 6
0.02
0.02
0.224
0.339
0.543
0.676
0.8020.83
0.965
1
2
3
4
5
6

3.0 The spread of diversity
The only thing we must work out is the probability a mutation observed in a sample occurs while k lineages, given only that the mutation segregates in the sample. Suppose the mutation occurs at x in [0,1].
We will not (for now) make any assumptions about times in the coalescent tree – so we are in the setting of the coalescent with variable population size
It helps to write the following
where Ik=1 if a mutation occurs in [x,x+dx) while k ancestors
That is, we consider the probability of exactly one mutation occurring, in a region containing x. The number of mutations in [x,x+dx) while k ancestors is Poisson with mean kTkqdx/2, so
lineages) )P((
lineages) (lineages)P while |copies mutant
kbp
kkbPq
n
knk
n
knb
2
2
(
n
kk
k
xn
k
x
x
IP
IP
kδxx,xP
kδxx,xP
δxx,x kPxkP
2
0
2
0
0
)1(
)1(
))[(
))[(
))[((
limlineages while in mutation
lineages while in mutationlim
in mutation | lineages lim) at mutation | lineages
)(2/
2/)2/exp()1(
xoxkT
xkTxkTIP
k
kkk

3.0 The spread of diversity
We can then sum over the distribution of Tk to give unconditionally:
As dx→0, at most one mutation occurs, so
and finally:
lineages) )P((
lineages) (lineages)P while |copies mutant
kbp
kkbPq
n
knk
n
knb
2
2
(
n
kk
k
n
kk
k
x
TkE
TkE
xoTxkE
xoTxkE
xkP
2
2
0
)(
)(
)(2/)(
)(2/)(
(
lim
) at mutation | lineages
)(2/)()1( xoTxkEIP kk
nbTkE
TkE
kbpq
n
kk
n
kk
k
nk
bn
n
knknb
0)(
)(
2
2 1
12
1
2
,
lineages) )P((

Example: constant size population
For a constant size population, recall:
exercise) are algebraof (details
(exercise)
,
1
1
1
1
1
1
1
1
0
1
1
1
1
2
)2()1(2
11
0
1
1
1
1
2
1
0
2
2
1
1
1
1
22
1
1
1
1
2)1(
1
1
12
1
2)1(
2
2)1(
2
1
12
1
)1(
)1()1(
)1(
1,1
0)1(
2)(
2
n
k
n
kk
b
n
kk
n
k
kbnk
bnb
n
kk
n
k
knk
k
bn
n
kk
n
kk
bn
n
kk
n
kk
k
nk
bn
n
kkk
k
n
kkk
k
k
nk
bn
nbk
k
bdxx
dxxxx
dxxx
knk
nbqkk
TE
k

Our constant size model predicts there are more rare than common mutations:
What do we see for real populations? A remarkable match for a new worldwide dataset with 6.5 million mutations:
Real data vs. predictions
“A map of human genetic variation from population level sequencing”Nature Oct. 2010
Errors cluster at extreme frequencies

Supplement: how old is my mutation?
• What is the expected age of a mutation if it is seen in b copies out of n?
• We use the same basic idea as before, and condition on when it occurs. Let the age be ξnb. If the mutation occurs while k ancestors, its age is obviously uniform across the period while k ancestors:
where U is uniform on (0,1) and independent of the Ti’s.
• Applying the same argument as before, we condition on when the mutation occurs and define an indicator Ik=1 if a mutation occurs in a small interval [x,x+dx) containing x while k ancestors
We can consider the constant size case again
)(
)(
)(
)(copies
n
kknk
n
kknkknk
n
kknk
k
n
knkknb
xnb
TkEbp
TTTTkEbp
IPbp
IPbpbIEE
2
21
2
2
0
2/
)1(
)1(),1|(lim
nkknb TTUT 1

Example: constant size popn
n
bj
n
k
kk
nk
kk
k
nk
bn
n
kknk
n
kknkknk
nb
jbn
b
b
TkEbp
TTTTkEbpE
1
1
1
22
22
22
21
12
1
2
21
2
2
2/
21
)(
)(
The algebra missed out is tedious – it relies on certain combinatoric identities. For more (but not quite full) details, see RCG’s notes, linked to on the webpage
The age of a mutation at frequency x in the entire population We just set and let n→∞, so b/n →x and
xx
x
xnnx
x
nxnx
xj
nxn
nxE
n
n
n
nxjn
x
log1
2
logloglog1
2lim
loglog1
2lim
2lim
1
1
nxb
REFS:Kimura and Ohta (1973)Griffiths and Tavare (1998)Wiuf and Donnelly (1999)

Practical implications1. This theory is very important in practice!
– We have seen coalescence times, and hence the frequency spectrum, are affected by historical population size
– So – we can use the former to infer the latter (e.g. Adams and Hudson, Genetics 2004, Williamson et al. PNAS 2005)
– But there are always multiple possible histories exactly matching an observed spectrum (Myers, Fefferman and Patterson Theor. Pop. Biol. 2008)
2. The age of a mutation “should” fit with its frequency– Selectively advantageous mutations can
spread more quickly to high frequency– Essentially all the approaches to find real
selection, in humans and other species, use this idea
– Look for mutations which appear young, but are at high frequency

67
Li and Durbin(Nature, 2011)
(Marie Forest, Jonathan Marchini, me, unpublished, building trees)
Split: About 80-120,000YBP
Estimates of ancient human population size

4.0 The number of different types
We have talked about the number of segregating sites as a measure of diversity
Another natural measure of diversity is the number of distinct haplotypes K in a sample. How does this behave?
It is helpful to us to understand the distribution of this number
First, a definition. We say the infinitely-many-alleles model holds if every mutation makes a new type, never seen before in the population
Note, the infinitely-many-sites model is different from, but implies, infinitely-many-alleles
K=5

Following “non-mutant” lines
We will derive the mean, variance and p.g.f of K, the number of distinct alleles.
• Looking back in time, view alleles (distinct types) as created at mutation events
• To count alleles, we follow the tree, allowing coalescence events, until we see any mutation event – then we know that mutant ancestor passes on a unique type
• We view this as a death process: lines “die”, through either mutation or coalescence
• The last line to be lost always represents some final type
K=5

Following “non-mutant” linesProposition 4.1Under the infinite-alleles model of mutation for the standard coalescent with mutation rate q, the number of alleles K in a sample of size n can be written
where the indicator variables Ij are independent and
ProofConsider following the coalescent history of the sample back in time, allowing lineages to coalesce, and “killing” lineages that mutate, until one lineage remains, at which point the process terminates.
The number of lineages clearly decreases monotonically from n to 1. While j lineages remain, we are tracing the history of a random sample of j lineages in the population, so coalescence occurs at rate j(j-1)/2 and mutation as a Poisson process of total rate j q /2.
Define Ij=1 if the jth lineage is lost by mutation and Ij=0 otherwise. The Ij’s are clearly independent. Denoting Mj to be the number of mutations while j ancestors in the coalescent:
From the previous discussion, each lineage lost by mutation adds one extra allele, and the last line remaining is an allele, so
1.... 21 IIIK nn
1)1(
jIP j
11
11)0(1)0(1)1(
jj
jMPIPIP jjj
1.... 21 IIIK nn
(Propn 2.2)

Following “non-mutant” lines1.... 21 IIIK nn
1)1(
jIP j
As a corollary, it is straightforward to calculate the mean, variance and p.g.f of K:
By definition of the p.g.f:
1
12
22
2
1
12
21
1
1)()(
11
1
1)(....)()()(
n
j
n
j
n
jj
n
j
n
j
nn
j
j
j
jIVarKVar
jj
IEIEIEKE
!1);1()1(
11
1
)()()(
)()(
)(
)(
12
1.... 21
nnxxxx
z
j
z
j
jzEz
zEzEzf
nn
n
n
n
j
n
j
I
IIIKK
j
nn
factorials rising using

Rates in the coalescent• A nice, powerful way to think of the coalescent is in terms of
event rates. As usual we think backwards in time
• While j lineages remain, the total coalescence rate is j(j-1)/2
• We can think of this as each pair of lineages coalescing, independently, at rate 1
• Similarly, while j lineages, the total mutation rate is j q /2, so on each lineage, mutation occurs independently at rate q/2.
• The rate at which some event occurs is the sum of all the rates, and the probability of each type of event can be obtained by the relative rate.
Example 1: In our death process representation of generating alleles, while j lineages (j>1):
Example 2: In the general coalescent, the probability the next event is a mutation on lineage i say is:
2/)1(2
2()1(
2/)1(2
jjθj/
θj/PIP
jjθj/
j mutation) event next
rate Death
)1(2/)1(2
2(
2/)1(2
θjj
θ
jjθj/
θ/iP
jjθj/
mutates) lineage
rate Event

The distribution of KWe can get the distribution of the number of alleles by expanding the p.g.f:
We use an identity involving Stirling numbers of the first kind:
If we observe k alleles, we can obtain the m.l.e of the mutation rate.
Thus, the m.l.e. is the first moment estimator.
n
kn
nK
K kKPzz
zEzf1k
)()()( )(
)(
nk
knskKP
zknsz
xSnxxxx
n
k
n
kn
k
n
n
n
k
knk
n
,,2,1,),(
)(
),(
)1()1(
)(
1)()(
)(
1
)(
)ˆ(ˆ1
ˆ
1
1
const)1(loglog)(log)(
1
1
1
n
j
n
j
n
j
KEj
k
j
kl
jkkKPkl

Large samplesWe can deduce asymptotic behaviour for the number of alleles:
Asymptotically, almost all segregating sites uniquely define a new type in the sample and the number which do not is finite.
nnKVar
j
jKVar
nnKE
jjjjKE
n
j
n
j
n
j
n
j
as
as
log~)(
)(
.log~)(
)(
1111)(
1
12
1
1
1
1
1
1

Supplement: Multiplicity of alleles
• Suppose we are interested in the full distribution of the number of alleles and their frequencies in the sample.
• We will construct an urn model, Hoppe’s urn, to sample from this.
• Note: the death process shown above defines both the alleles (colours) and how many copies of each is in the sample
• At coalescence events, pairs of lineages coalesce at random
• All lineages are associated with colours
• IDEA: We reverse time in the death process, so new types are “born”
K=5

Supplement: Multiplicity of alleles
• Backward in time: While j of n lineages remain,
• Forward in time, we start with 1 lineage, and while j:
• At mutation events, we add a new “colour” to the tree• At lineage branches, the number of copies of chosen colour
increases by 1
K=5
1)(
jP
mutation via death
jjj
jP
jP
11)(
)(
splits lineage particular
mutation via born allele

Supplement: Hoppe’s urn• We have effectively derived an urn representation
• Represent alleles by balls of different colours in an urn, similarly to the “descendants” urn model we earlier introduced
• We add an extra detail. There’s an extra “mutation” ball, of mass q relative to the other balls with mass 1, and chosen with probability proportional to its mass
Definition (Hoppe’s urn model):Hoppe’s urn model constructs a sample of allelic types and multiplicities for n haplotypes under the infinite-alleles model
1. Begin with a white and a coloured ball, of mass q and 1.
2. While j non-white balls of mass 1, pull out one of the j+1 balls with probability proportional to its mass. If the white ball, replace in the urn and add in a single ball of a new colour. If a coloured ball, replace in the urn and add in an additional ball of the same colour
3. When there are n non-white balls, stop.
The number of different colours is the number of haplotypes in the sample, and the multiplicity of each colour the multiplicity of these types, summing to n.

Supplement: birth/death and Hoppe’s urn
v
v
v
Probability
1
2
3
4
1
5
1
6
1
2
3
4
5
6
1
23
4
5 6
The probabilities of numbered events are identical in the urn and the genealogy

Ewen’s sampling formula• Define a(j) to be the number of
types occurring at frequency j in the sample for j=1,2,..,n. Then if K=k:
• Definition: Ewens’ sampling formula gives the probability of the sample configuration:
• This can be proved inductively from the urn model
• Note (n,K) is sufficient for q
n
j
n
j
njj, kα(j)11
)(
n
j
jn
k
jj
nnP
1
)()(
)!(
!))(,),2(),1((

5.0 Gene trees!• Coalescent trees are not, in
general, unique given variation data
• We’d like a historical representation of a sample that is “well defined”, but reflects historical relationships among samples
• The solution is to construct a gene tree
• We again assume infinite-sites: each mutation occurs at a position never before mutant

Example gene tree
2
5 7
48
3
6
a b c d e f
1
1 2 3 4 5 6 7 8
a
b
c
d
e
f
Coalescent tree Gene tree
2
5 7
481
3
6
Data
a b c d e f
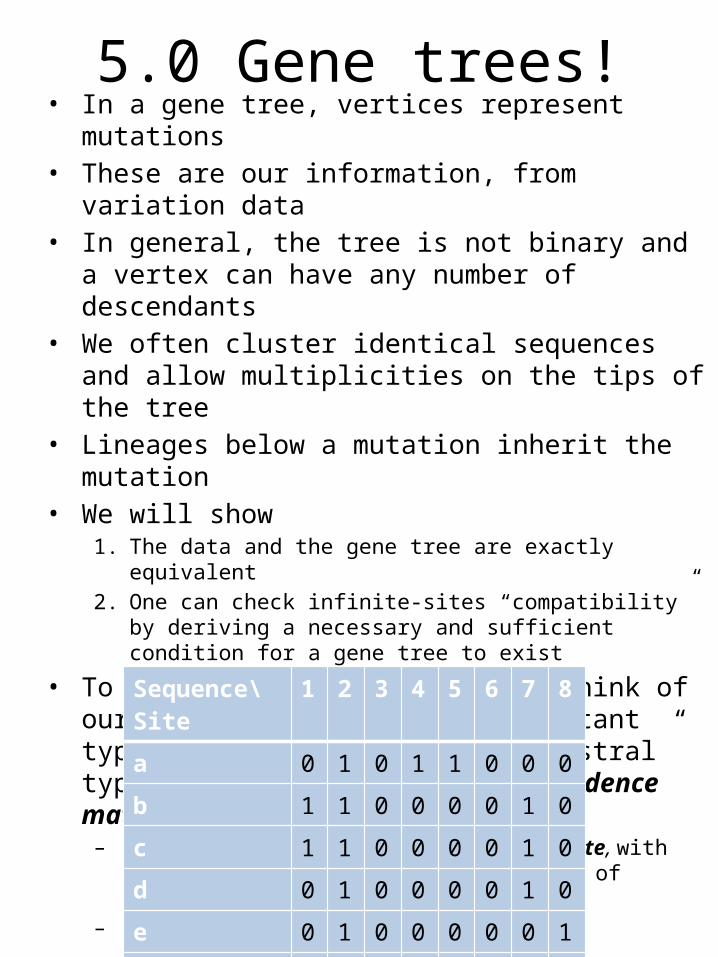
5.0 Gene trees!• In a gene tree, vertices represent mutations• These are our information, from variation data• In general, the tree is not binary and a vertex can have
any number of descendants• We often cluster identical sequences and allow
multiplicities on the tips of the tree• Lineages below a mutation inherit the mutation• We will show
1. The data and the gene tree are exactly equivalent2. One can check infinite-sites “compatibility” by deriving a necessary
and sufficient condition for a gene tree to exist
• To begin constructing a tree, think of our data as binary, with the mutant type denoted by 1, so the “ancestral” type is 0. We define an n×s incidence matrix S
– Each column represents a segregating site, with the total number of sites the number of mutations s in the sample history
– Each row represents a haplotype
Sequence\Site 1 2 3 4 5 6 7 8
a 0 1 0 1 1 0 0 0
b 1 1 0 0 0 0 1 0
c 1 1 0 0 0 0 1 0
d 0 1 0 0 0 0 1 0
e 0 1 0 0 0 0 0 1
f 0 0 1 0 0 1 0 0

Example above:
Notice that in these data, we have the following:
The incidence matrix
• We say a sequence is ancestral if it perfectly matches the type of the ancestor
• This corresponds to a row of zeros in the incidence matrix (mutation occur since the ancestor)
• For site i, define the set of carriers of the mutation:
Sequence\Site 1 2 3 4 5 6 7 8
a (1) 0 1 0 1 1 0 0 0
b (2) 1 1 0 0 0 0 1 0
c (3) 1 1 0 0 0 0 1 0
d (4) 0 1 0 0 0 0 1 0
e (5) 0 1 0 0 0 0 0 1
f (6) 0 0 1 0 0 1 0 0
sjn, i
sjis ijij
11
01 otherwise , site at mutant ind.if
}5{},4,3,2{},1{
},6{},5,4,3,2,1{ },3,2{
8754
6321
OOOO
OOOO
sismO mii ,2,1};1:{
otherwise
,
,,
28254
63271
ji OO
OOOOO
OOOOO

Ordering by inclusionThis pattern turns out to be general, and a powerful way
to test the infinitely-many-sites assumption with the incidence matrix:
Proposition 5.1If the infinitely-many-sites model holds, then defining Oi
to be the set of individuals in a sample of size n carrying the ith mutation i=1,2,...,s, the Oi’s are ordered by inclusion:
ProofConsider the coalescent tree for the sample. For any i and
j, under infinite-sites the ith and jth mutations occur on tree edges. One of the following must occur: the mutation i edge is ancestral to the mutation j edge, the opposite occurs, or neither, respectively leading to the three conditions above.
jiijji OOOOOO
sji
or either all for,,
,,1
ji OO
i
ji
jji
ij OO ji OO

Example• Is the following dataset, with sequence c ancestral,
compatible with infinite-sites?
Sequence\Site 1 2 3 4 5 6 7
a (1) A G C A C G G
b (2) C T T A T A C
c (3) C T C A C G C
d (4) A T C A T G G
e (5) A G C G C G G
Sequence\Site 1 2 3 4 5 6 7
a (1) 1 1 0 0 0 0 1
b (2) 0 0 1 0 1 1 0
c (3) 0 0 0 0 0 0 0
d (4) 1 0 0 0 1 0 1
e (5) 1 1 0 1 0 0 1
Incidence matrix, noting c is ancestral:
Check ordering by inclusion. Note that
Thus the data are not ordered by inclusion, so not compatible with infinite-sitesWe will explore this idea more later on.
Note: removing sequence b would fix things.
15515151 ,,},4,2{},5,4,1{ OOOOOOOO
1 5
a (1) 1 0
b (2) 0 1
c (3) 0 0
d (4) 1 1
e (5) 1 0

Building gene trees• Suppose we take a gene tree and trace a “path
to the root” for each sequence:
• Denote the root as 0 and go backwards in time:
• These “paths to root” are enough to build the gene tree, so equivalent to a gene tree
• We need an algorithm to order mutations from variation data – Gusfield’s algorithm
59
7
2
8
43
61
f b c a e d g
a: 6 5 2 0 b: 1 5 2 0c: 5 2 0d: 7 9 4 8 2 0e: 9 4 8 2 0f: 3 2 0g: 0

Gusfield’s algorithmGusfield, D.(1991). Efficient algorithms for inferring
evolutionary trees. Networks, 21, 19–28. Algorithm 5.2 For data compatible with the infinite-sites model, the
following algorithm allows the generation of a gene tree based on an incidence matrix consisting of 0’s and 1’s, with the ancestral type always denoted by 0.
1. Reorder the columns, and column labels, by considering each column as a binary number, and ordering so the columns are decreasing. If duplicate columns occur, choose an arbitrary non-increasing column order.
2. For each sequence, construct a path to the root by reading from right to left in the corresponding row of the incidence matrix, recording mutation labels where 1’s occur in rows, and append 0 to this list.
3. Given paths back to the root, use these to draw the gene tree.

ExampleA recent common ancestry for human Y chromosomesMichael F. Hammer, Nature 1995. 16 sequences, 4
segregating sites seen.Sequence\Site 1 2 3 4
a (7) 0 0 0 0
b (1) 0 1 0 0
c (3) 1 0 0 0
d (4) 1 0 1 1
e (1) 1 0 0 1
Incidence matrix
Sequence\Site 2 1 4 3
a (7) 0 0 0 0
b (1) 1 0 0 0
c (3) 0 1 0 0
d (4) 0 1 1 1
e (1) 0 1 1 0
Reordered incidence matrix
1.
2.
a: 0b: 2 0c: 1 0d: 3 4 1 0 e: 4 1 0
Paths to root
3.
Gene tree
2
1
4
3
a:7 b:1 c:3 e:1 d:4

Variation data ↔ Gene treeProposition 5.3Any variation dataset expressed in the form of an
incidence matrix, where the sets of carriers of each mutation are ordered by inclusion, is equivalent to a gene tree.
Notes1. This implies that ordering by inclusion is both
necessary (proposition 5.1) and sufficient for a gene tree to exist, and hence for the data to be consistent with infinite-sites, so this is a complete check
2. Clearly a gene tree can be used to give an incidence matrix, which is automatically compatible with infinite-sites, so we must only prove a gene tree exists given an incidence matrix.
3. We will prove that Gusfield’s algorithm correctly produces such a gene tree.

Proof of proposition:We prove Gusfield’s algorithm yields a set of paths to root
giving a valid gene tree by induction on the number of sequences so far included in the gene tree. We consider constructing the tree, successively adding in sequences.
First, assume wlog all columns in the incidence matrix are unique (identical columns can be collapsed into one, if present)
After reordering the matrix, viewing each column as a binary number, note that
The first two algorithm steps obviously lead to a set of sequences of paths to root for each row in the incidence matrix. For the first sequence, we simply add the ordered sequence of mutations that sequence carries,
Suppose we have successfully added k-1 sequences to the gene tree.
There is obviously a gene tree:
For the induction hypothesis, suppose there are s mutations with a gene tree correctly produced from the first s-1 columns
After applying Gusfield’s algorithm, relative to s-1 sites, site s is inserted between some two columns.
Variation data ↔ Gene tree
jiji OOOO
ji
or column column
,
0112
11 1
riii
11i
12i
111 ri
0
ji
OO ji
column column

Proof ctd:We consider adding the kth sequence and Gusfield’s
algorithm provides an ordered sequence of mutations this sequence carries:
Each of these mutations is carried by sequence k, so they are not disjoint, and as noted above:
Mutations on this list are either included on the current gene tree or not. Let be the first mutation already included in the current gene tree. Then form a new edge containing mutations and attach it to node , to include individual k in the gene tree:
We must now only show that the sequence of mutations on the pre-existing path from to the root is exactly
Variation data ↔ Gene tree
021 kr
kk
kiii
},,2,1{21
21
nOOO
iii
kkr
kk
k
iii
kr
kk
column column column
ki1
ki2
kji 1
kj
kk iii 121 ,,
kji
kji
kji
kji
01 kr
kj
kj k
iii
(5.1)

Variation data ↔ Gene treeProof ctd:Note that by equation (5.1):
We know that some previous sequence m carries mutation and hence by (5.2), m must carry all the mutations
Because we successfully added sequence m in, according to the inductive hypothesis, these mutations all lie on the pre-constructed gene tree, and by (5.2) , since we add mutations in the order specified by Gusfield’s algorithm, they lie on the path upward from node to the root.
Conversely, any mutation q on the path from node up to the root is carried by sequence m, and since m carries , ordering by inclusion implies:
Thus sequence k also carries mutation q, so for some r>j
Thus, the mutations on the path from sequence k to the root are exactly those carried by sequence k, and we successfully add this additional sequence in
},,2,1{1
nOOO kkr
kj
kj iii
01 kr
kj
kj k
iii
(5.2)
kji
kji
kji
qiOO k
j
kriq

Bells and whistles• Mutations with identical patterns in the sample can be
randomly permuted on the edge on which they occur
• Identical sequences by convention share a single edge, labelled with multiplicity of the sequence
• Unrooted trees do not assume we know the ancestral type at each mutation– Given say A/G types at a site, we may not be able
to infer which is ancestral– An unrooted tree incorporates the set of all
possible rooted trees.
5 9
7
2
8
43
61
f b c a e d g
5 8
7
2
4
93
61
f b c a e d g8, 4, 9 all equivalent

Unrooted trees• An unrooted tree has sequences (instead of sites) as
vertices. Some sequences are inferred in general• Edges between sequences contain the mutations
separating them• A simple way to construct an unrooted tree from data
is to construct a rooted tree, then “remove” root• In general, multiple (rooted) gene trees can give the
same unrooted tree.• Straighten line to root, slide each mutation up from its
vertex, and collapse edges with no mutations:
Example 1
5 8
7
24
93
61
f b c a e d g
Rooted
2
4
9
8
7
35
6
1
Unrooted
g
fc
b
a
e d
.

Unrooted treesExample 1
5 8
7
2
4
93
61
f b c a e d g
Rooted tree
2
4
9
8
7
35
6
1
3. Unrooted tree
g
fc
b
a
e d
.
58
7
2
4
93
61
f b c a e d
1. Slide mutations up
bf c a e d
58
7
2
4
93
61
f b a d
2. Remove terminal edges
g
bf
c
a
e
d
gg

Example 2

Example 21 2 3 4 5 6 7 8 9 1
011
12
13
14
15
16
17
18
a 1 0 0 1 0 1 0 0 0 0 0 0 0 1 0 0 0 0
b 1 0 0 1 0 1 0 0 0 1 0 0 0 1 0 0 0 0
c 0 1 0 0 0 0 0 0 0 0 0 0 0 0 0 0 0 1
d 0 0 1 0 0 0 0 0 1 0 0 0 0 0 0 0 0 0
e 0 0 0 1 0 1 0 0 0 0 0 0 0 1 0 0 0 0
f 0 0 0 1 1 1 0 0 0 0 0 0 0 1 0 0 0 0
g 0 0 0 0 0 0 0 0 0 0 1 1 0 0 0 0 0 1
h 0 0 0 0 0 0 0 0 0 0 1 1 1 0 0 0 0 1
i 0 0 0 0 0 0 0 0 0 0 0 0 0 0 0 1 1 1
j 0 0 0 0 0 0 0 0 0 0 0 0 0 0 0 1 0 1
k 0 0 0 0 0 0 0 0 0 0 0 0 0 0 0 0 0 0
l 0 0 0 0 0 0 0 0 0 0 0 0 0 0 0 0 0 1
m 0 0 0 0 0 0 0 1 0 0 0 0 0 0 0 0 0 0
n 0 0 0 0 0 0 1 0 0 0 0 0 0 0 1 0 0 0
A rooted tree can be constructed using Gusfield’s algorithm from above incidence matrix (root is sequence k)

Example 2 continued
For these data I gave one possible choice of ancestral sequences leading to a rooted tree. We could have, e.g., used sequence l as ancestral
In general, for an unrooted tree containing s mutations, the total number of different sequences on edges (including tips) is s+1. Any of these could be the ancestor type.
Hence, there are s+1 possible rooted gene trees for a given unrooted tree, in this example 19 rooted gene trees.
Different root choices “toggle” 0 and 1 within columns

Conditions for trees• The infinite-sites model might be a strong assumption
for some species• Given data, it is of interest to test this model• Suppose we know ancestral types• A natural approach is to ask if we can build a rooted
gene tree, and hence a coalescent tree. • If so, we say our data is compatible with the infinite-
sites model.• It is easy to prove the following:
Proposition 5.4A variation dataset expressed in the form of an incidence
matrix is compatible with the infinite-sites model if and only if the sets of carriers of each mutation are ordered by inclusion.
ProofProposition 5.1 shows necessity of ordering-by-inclusion.
The proof of Gusfield’s algorithm (Proposition 5.3) shows we can build a gene tree whenever ordering-by-inclusion holds, which immediately implies sufficiency

Conditions for trees• There is a simple way to test this
condition
Corollary 5.5A variation dataset expressed in the form of an incidence
matrix, where ancestral types are coded 0 and mutant types coded 1, is compatible with the infinite-sites model if and only if no pair of sites shows the pattern
in any 3 rows of the incidence matrix11
10
01

Example revisited• Is the following dataset, with sequence c ancestral,
compatible with infinite-sites?
Sequence\Site 1 2 3 4 5 6 7
a (1) A G C A C G G
b (2) C T T A T A C
c (3) C T C A C G C
d (4) A T C A T G G
e (5) A G C G C G G
Sequence\Site 1 2 3 4 5 6 7
a (1) 1 1 0 0 0 0 1
b (2) 0 0 1 0 1 1 0
c (3) 0 0 0 0 0 0 0
d (4) 1 0 0 0 1 0 1
e (5) 1 1 0 1 0 0 1
Incidence matrix, noting c is ancestral:
Check new condition.
Note that for sites 1 and 5, rows 1, 2 and 4 respectively give the pattern
so these data are incompatible with infinite-sites.
1 5
a (1) 1 0
b (2) 0 1
c (3) 0 0
d (4) 1 1
e (5) 1 0
11
10
01

Conditions for treesProof of Corollary.Suppose we see this pattern at two sites, i and j say and
some 3 rows.
Clearly
so ordering by inclusion does not hold, and the data are incompatible with infinite-sites, proving necessity.
Conversely if the data are incompatible with infinite sites, by the previous proposition for some pair of columns i, j ordering by inclusion does not hold:
For columns i and j and rows l, m, n in the incidence matrix:
jiijji
cj
ciji
OOOOOO
lOmOnmOnlO
,,
}{},{},,{},,{
jiji
jiij
jiji
OnOnOO
OmOmOO
OlOlOO
,
,
,
11
10
01
ji
n
m
l so the pattern is seen, proving sufficiency
11
10
01
ji
n
m
l

Unknown ancestral types
• If we don’t know ancestral types, at each site we can’t tell who has the mutation, only who differs
• The incidence matrix is defined up to “toggling” 0-1 status at each site
• The compatibility question becomes whether it is possible to find a toggling to allow a rooted tree
Corollary 5.6A variation dataset expressed in the form of an incidence
matrix, where ancestral types are unknown, is compatible with the infinite-sites model if and only if no pair of sites shows the pattern
in any 4 rows of the incidence matrix11
10
01
00

Conditions for treesProof of Corollary.Suppose we see this pattern at two sites, i and j say and
some 4 rows.
Clearly, toggling 0-1 status at either site this pattern remains. Therefore for any toggling the pattern
is seen, and the data are incompatible with a rooted tree and hence infinite-sites. This proves necessity.
For the converse, suppose there is no such pattern in any pair of columns. Toggle the matrix columns, so the first sequence is a row of zeros (i.e. pick this to be ancestral). Consider columns i and j. They do not show the pattern
Hence with this choice of ancestral sequence, there is a rooted gene tree by Corollary 5.3, giving sufficiency.
The first row of these two columns is by construction, so no other 3 rows have the pattern
11
10
01
00
11
10
01
.
11
10
01
00
.
11
10
01
00

Unknown ancestral typesand unrooted trees
• Any rooted tree can “build” an unrooted tree• An unrooted tree can “build” multiple rooted trees.• Notice an unrooted tree is invariant to 0-1 toggling of
sites (because mutations on edges just show differences between sequences).
• Thus:1. We can view an unrooted tree as the “ancestral type
unknown” equivalent of a (rooted) gene tree2. The unrooted tree is unique even if ancestral types are
unknown (up to permutation of equivalent mutations)3. Corollary 5.6 can be viewed as a condition on the existence of
an unrooted tree:
Ancestral types knownInfinite sites
Rooted tree
No pattern
11
10
01
Ancestral types unknownInfinite sites
Unrooted tree
No pattern
11
10
01
00
2 4 9 8 73
5 61
g
fcb a
ed
.

6.0 The probability of a dataset
• Suppose we observe some variation data
• What is its likelihood?• We can equivalently think of this
as the probability of a gene tree• We only consider the infinite-sites
case
• We begin with a simple example

6.0 Example
• Consider the following dataset, with 0 ancestral:
• What is the likelihood of the data as a function of q?
• What is the distribution of the TMRCA conditional on q and the data?
• First, note there is only one possible coalescent tree:
Sequence\Site 1 2
a 1 1
b 1 1
c 0 0
Gene tree Coalescent tree

Hf-1
Hf
Coalescent histories
Define the history of a set of sequences:
where Hj defines what occurs at the jth mutation or coalescence event back in time, i.e. whether this event is a mutation or coalescence event, and which lineage(s) are involved. E.g. Hj shown above is a mutation on lineage 5.
),,,( fHHHH 21
Hj
Hj+1
H1

Coalescent historiesSuppose there are k lineages remaining before the jth event. Hj is either a coalescence between two lineages m and n, Ck(m,n) or a mutation on some lineage m, Mk (m):
Different events are independent, conditional on the number of edges k remaining, due to the Markov property of Poisson processes.
For the example:
)1(2/)1(
2/)(
)1(
2
2/)1(
1),(
2/)1(2/2
kkkkmMHP
kkkknmCHP
kkkk
kj
kj
:rate event Total
H1 is a coalescence, H2 and H3 are mutations, H4 coales.
3
2
2223
)1)(2(6
)12(2
2
)12(2
)12(2)13(3
2
)2,1(),1(),1(),2,1(
CMMCPL
(6.1)

Times conditional on historyHaving sampled the sample history, suppose there are k lineages remaining immediately before the jth event, Hj.. Events happen as a Poisson process, so times between events are independent and exponential:
For the example we can write the TMRCA as a sum of 4 independent exponentials. Then for example:
The oldest mutation has expected age
)1(
2
2/)1(exp~
1
2/)1(2/2
kkEE
kkE
Ejj
kkkk
j
j
j be and events between time Let
:rate event Total
1
3
)2(3
2
)12(2
23
)13(3
2)( 32 TTE
E1
E2
E3
E4
1
2
)2(3
2

Times given dataAlternatively - and equivalently - obtain the joint distribution directly:
This expression integrates to give the likelihood
Normalise to obtain the joint conditional density
The conditional density can be used to give the expected TMRCA:
Problem sheet 4 has another example
)exp()3exp(3
2/exp2/exp22
12/exp
3
1
),(),|()|,(
23
232
2
223
232323
tt
tttt
t
ttfttDPDttf
1
3
)2(3
2
)|,()()|( 23
0 0
232323 dtdtDttfttDTTE
t3
t2

Complex datasets
• For a general dataset, we have seen there is no unique coalescent tree.
• We can still sum over histories• Given data D, define H(D) to be the
(finite) set of possible histories producing the data
• The likelihood is just:
• To obtain expected ages of mutations, average over histories given data
)(
)(
)()(
)|(
),,,(
)()()(
DHii
f
i
fDH
DHDH
kHP
HHHP
HPDHPDL
1
21

Review
In the Y-chromosome data.
• The model is the constant-size coalescent we derived• The calibration into years uses M=5,000, estimated as we
have seen (and 20 years per generation)• The structure of the gene tree is drawn using Gusfield’s
algorithm• The ages of the mutations are obtained conditional on the
data, as we have seen, by “summing” over possible histories
• The supplement describes how this summing was done efficiently, using importance sampling (IS).
Hammer et al.(PNAS, 2000)http://www.pnas.org/content/97/12/6769/F1.expansion.html

Supplement: Importance sampling (IS)
• There is typically an extremely large space of histories to sum...e.g. n!(n-1)!/2n trees of n seqs.
• Direct summation often computationally infeasible• Most histories have a negligible contribution to the
likelihood• Can we add up the “important” terms?• We use a simple rearrangement to do this
QHHQ
HP
M
HQ
HPE
HQHQ
HP
HPDL
iM
ii
i
Q
DH
DH
using sample we where
1
)(
)(
)(
)(1
)(
)(
)()(
)(
)()(For ANY distribution on histories with p.m.f Q, giving non-zero probabilities over H(D)
Q is called a proposal distribution

Importance sampling
• We simulate M different histories by sampling each independently using the proposal Q
• Calculate the M corresponding importance weights and average
• Each importance weight is an i.i.d random variable.• The previous page shows the mean of the importance
weight distribution, sampling under Q, is the likelihood we seek.
• The WLLN then implies the likelihood approximation above is exact as M→∞ for any valid proposal
• How to pick a “good” proposal distribution, i.e. Q?– We must be able to write down Q– Picking a “good” proposal just means trying to make
importance weights have low variance– In the coalescent setting, that means picking “likely
histories” given the data
M
ii
i
HQ
HP
MDL
1 )(
)(1)( ith importance
weight

Supplement: IS
The best (known) scheme for infinite sites is due to Stephens and Donnelly (JRSS B, 2000).
They construct a proposal distribution Q on histories as follows.
1. Sample historical events successively back in time.2. Before event j, identify the subset of n0 lineages to whom
the next event could occur3. Choose one of these lineages uniformly at random:
P(lineage i)=1/ n0 and perform the (unique) corresponding mutation or coalescence event
4. Return to step 2 until common ancestor reached
[Note: no q! The mutation rate comes in to the importance weights only through P.]
M
ii
i
HQ
HP
MDL
1 )(
)(1)( ith importance
weight

Example
For the first event in historylineage b could mutate, or lineages c and d might coalesce.Lineage a cannot be involved
Thus n0=3 and
We choose a first event. Next event chosen same way, until common ancestor reached
3/23/13/1)4,3(
3/1)2(
41
41
CHP
MHP
:)2(41 MH If
2/14/14/1)2(|)4,3(
2/14/14/1)2(|)2,1(
4142
4142
MHCHP
MHCHP
All lineages can have an event, n0=4:
Continuing, for example:
18
1
1113
1
2
1
3
1)2,1(),1(),2,1(),3(),4,3(),2( 223344
CMCMCMHQ
Consider a dataset corresponding to the below gene tree, and sampling using Stephens’ and Donnelly’s Q.

Importance sampling example
History 2: M3(3),C3(1,2),C2(1,2)
Sequence\Site 1
a 0
b 0
c 1
History 1: C3(1,2),M2(3),C2(1,2)
History 3: M3(3),C3(2,3),C2(1,2)History 4: M3(3),C3(1,3),C2(1,2)
Initially: Sequence 1 or 2 can coalesce, sequence 3 can mutate so n0=3. Any one of the 3 sequences can be chosen for the first event, with probability 1/3.
9
1((
9
11
3
1
3
1))21()21()3(((
113
2))21()3()21(((
233
223
4) Hist3) Hist
2) Hist
1) Hist
,,C,,CMQQ
,,C,M,CQQ
4 possible histories:

Importance sampling example
Sequence\Site 1
a 0
b 0
c 19
1((
9
11
3
1
3
1))21()21()3(((
113
2))21()3()21(((
233
223
4) Hist3) Hist
2) Hist
1) Hist
,,C,,CMQQ
,,C,M,CQQ
)1(2
2
)2(3
2
)2(3((
)1(2
2
)2(3
2
)2(3))21()21()3(((
)1(2
2
)1(2)2(3
2))21()3()21(((
233
223
4) Hist3) Hist
2) Hist
1) Hist
PP
,,C,,CMPP
,,C,M,CPP
History Likelihood terms Prob. Importance weight
History 1 2/3
History 2 1/9
History 3 1/9
History 4 1/9
Likelihood - -
2)1)(2(3
)1()2(9
22
)1()2(9
22
)1()2(9
22
2)1)(2(2
)1()2(
22
)1()2(
22
)1()2(
22
2
2
1
1
)1)(2(3)(DL
by equation (6.1)
N.B. For any q value, mean importance weight is true likelihood. If q=2, importance weights all identical – scheme is optimal
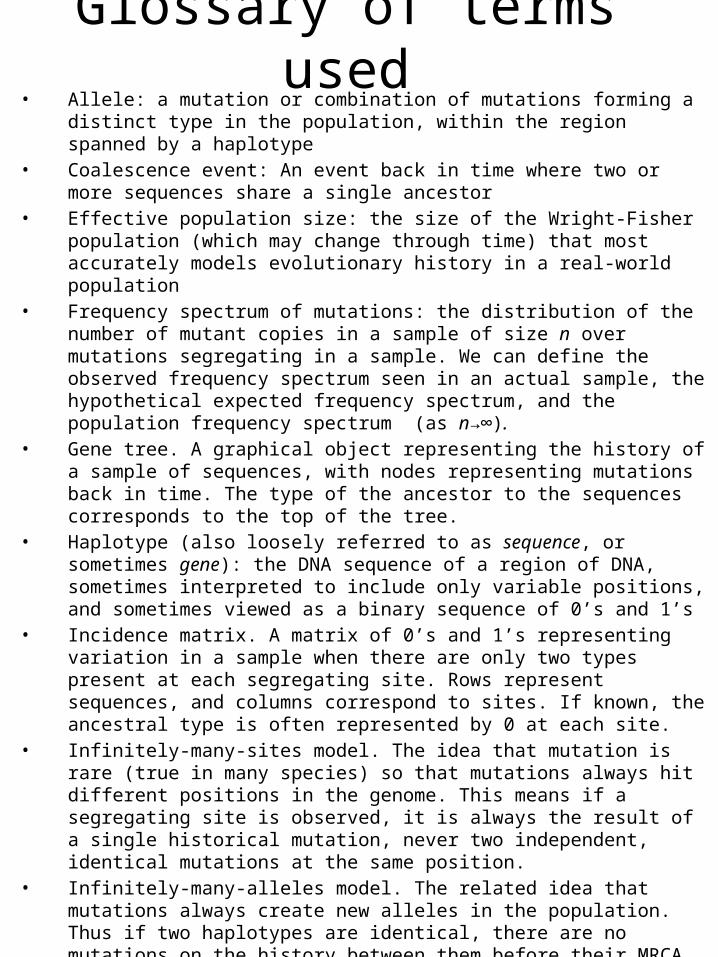
Glossary of terms used• Allele: a mutation or combination of mutations forming a distinct type in the
population, within the region spanned by a haplotype• Coalescence event: An event back in time where two or more sequences share a
single ancestor• Effective population size: the size of the Wright-Fisher population (which may change
through time) that most accurately models evolutionary history in a real-world population
• Frequency spectrum of mutations: the distribution of the number of mutant copies in a sample of size n over mutations segregating in a sample. We can define the observed frequency spectrum seen in an actual sample, the hypothetical expected frequency spectrum, and the population frequency spectrum (as n→∞).
• Gene tree. A graphical object representing the history of a sample of sequences, with nodes representing mutations back in time. The type of the ancestor to the sequences corresponds to the top of the tree.
• Haplotype (also loosely referred to as sequence, or sometimes gene): the DNA sequence of a region of DNA, sometimes interpreted to include only variable positions, and sometimes viewed as a binary sequence of 0’s and 1’s
• Incidence matrix. A matrix of 0’s and 1’s representing variation in a sample when there are only two types present at each segregating site. Rows represent sequences, and columns correspond to sites. If known, the ancestral type is often represented by 0 at each site.
• Infinitely-many-sites model. The idea that mutation is rare (true in many species) so that mutations always hit different positions in the genome. This means if a segregating site is observed, it is always the result of a single historical mutation, never two independent, identical mutations at the same position.
• Infinitely-many-alleles model. The related idea that mutations always create new alleles in the population. Thus if two haplotypes are identical, there are no mutations on the history between them before their MRCA. NB – the infinitely-many-sites model implies the infinitely-many-alleles model, so is a special case (under infinite-sites, each mutation is new in the population so trivially defines a new allele).
• Most recent common ancestor (MRCA): the first ancestor in the history of a sample of n sequences who all n sequences are descended from.

Glossary of terms used• Root sequence: A sequence whose type is identical to that of the MRCA. In the
binary infinite-sites model representation of variation, this corresponds to a sequence whose type is all zeros and can be used to define which type is represented as 0, which as 1, at each mutation.
• Segregating site: a mutation seen in some, but not all, members of a sample of size n• Time to the most recent common ancestor (TMRCA): the time back at which the
MRCA lived• Unrooted tree. A graphical object representing the relationships among a sample of
sequences, with nodes representing sequences and mutations along edges. The type of the ancestor to the sequences does not need to be known.
• Watterson’s estimator: A moment-based estimator of the population scaled mutation rate, based on the number of observed segregating sites in a sample of size n.


![THEME [SC1-DTH-03-2018]](https://static.fdocuments.net/doc/165x107/617d706653c4da530e6e24ea/theme-sc1-dth-03-2018.jpg)