STMicroelectronics N.V. - Zonebourse.com · About STMicroelectronics ... following the...
46
STMicroelectronics N.V. Half-year report 2009
-
Upload
phungtuong -
Category
Documents
-
view
227 -
download
2
Transcript of STMicroelectronics N.V. - Zonebourse.com · About STMicroelectronics ... following the...
STMicroelectronics N.V.
Half-year report 2009
Table of contents
Table of contents ................................................................................................................ 2 I. Director’s report........................................................................................................... 3
A. Business Overview.................................................................................................. 3 B. Segment Information ............................................................................................... 5 C. Net revenues by location of order shipment............................................................ 7 D. Liquidity ................................................................................................................... 7 E. Business Outlook .................................................................................................... 8 F. Other Developments in the First Half of 2009 ......................................................... 9 G. Business risk information ...................................................................................... 10
II. About STMicroelectronics ......................................................................................... 12 For further information, please contact: ........................................................................ 12
III. Interim condensed consolidated financial statements for the six months period ended June 27, 2009 (Unaudited) .................................................................................... 13
A. CONSOLIDATED STATEMENTS OF INCOME ................................................... 14 B. CONSOLIDATED STATEMENTS OF COMPREHENSIVE INCOME .................. 15 C. CONSOLIDATED BALANCE SHEETS................................................................. 16 D. CONSOLIDATED STATEMENTS OF CHANGES IN EQUITY............................. 17 E. CONSOLIDATED STATEMENTS OF CASH FLOWS.......................................... 18
IV. Notes to the interim condensed consolidated financial statements (unaudited)....... 19 1. GENERAL INFORMATION................................................................................... 20 2. SUMMARY OF SIGNIFICANT ACCOUNTING POLICIES ................................... 21 3. SEGMENT INFORMATION .................................................................................. 23 4. BUSINESS COMBINATIONS ............................................................................... 27 5. PROPERTY, PLANT AND EQUIPMENT AND INTANGIBLE ASSETS ............... 30 6. GOODWILL ........................................................................................................... 31 7. INVESTMENTS IN ASSOCIATES........................................................................ 32 8. AVAILABLE FOR SALE FINANCIAL ASSETS..................................................... 33 9. LONG-TERM LOANS AND RECEIVABLES......................................................... 34 10. INVENTORIES .................................................................................................. 34 11. ASSETS HELD FOR SALE............................................................................... 35 12. SHAREHOLDERS EQUITY .............................................................................. 36 13. LONG TERM DEBT........................................................................................... 37 14. OTHER NON CURRENT LIABILITIES ............................................................. 38 15. FAIR VALUE MEASUREMENT ........................................................................ 38 16. OTHER INCOME / OTHER EXPENSES .......................................................... 39 17. RESTRUCTURING ........................................................................................... 40 18. EXPENSES BY NATURE.................................................................................. 41 19. CASH GENERATED FROM OPERATIONS..................................................... 42 20. EARNINGS / (LOSS) PER SHARE................................................................... 43 21. CONTINGENT LIABILITIES.............................................................................. 43 22. CLAIMS AND LEGAL PROCEEDINGS ............................................................ 44 23. RELATED-PARTY TRANSACTIONS ............................................................... 45
V. Sole Member of the Managing Board’s statement (fair view) ................................... 46
3
I. Director’s report
A. Business Overview
The total available market is defined as the “TAM,” while the serviceable available market, the “SAM,” is defined as the market for products produced by us (which consists of the TAM and excludes PC motherboard major devices such as microprocessors (“MPUs”), dynamic random access memories (“DRAMs”), optoelectronics devices and Flash Memories).
In the first half of 2009, the semiconductor industry continued to be negatively impacted by the difficult conditions in the global economy which caused the TAM and the SAM to register double-digit decline. Based on most recently published estimates, in the first half of 2009, semiconductor industry revenues declined on a year-over-year basis by approximately 25% for both the TAM and the SAM to reach approximately $96 billion and $59 billion respectively.
With reference to our business performance, following the deconsolidation of our Flash Memory Group (“FMG”) segment during the first quarter of 2008, the consolidation of the NXP wireless business on August 2, 2008 and the consolidation of the EMP wireless business as of February 3, 2009, our operating results, as reported, are no longer directly comparable to previous periods.
In the first half 2009, our revenues as reported were $3,653 million or a 25.0% decline compared to the equivalent prior year period driven by significant weakness in customer demand across most geographic regions, however in line with the market due to the contribution of the recently acquired wireless businesses. The first half of 2009 also benefited from $18 million in other revenues recognized upon signature of a contract for the licensing of a CMOS technology.
In the first half of 2009, our effective exchange rate was $1.33 for €1.00, which reflects actual exchange rate levels and the impact of cash flow hedging contracts, compared to an effective exchange rate of $1.51 for €1.00 in the first half of 2008.
Our gross margin as reported for the first half of 2009 dropped by 12.8 percentage points on a year-over-year basis to 21.5%, mainly due to lower sales volumes and the pressure on average selling prices, both related to the deteriorating economic conditions. Furthermore, our gross margin for the first half of 2009 was impacted approximately by 7 percentage points by the underutilization charges associated with the substantially reduced activity of our fabs in response to falling demand and with the objective to cut our inventories level in order to protect our cash resources. The negative impact of such charges and of manufacturing inefficiencies was partially offset by the more favorable U.S. dollar exchange rate, and the contribution of an improved product portfolio mix following the wireless businesses acquisition. The gross profit and the gross margin also benefited from the licensing of the CMOS technology.
Our operating expenses, comprising selling, general and administrative expenses, as well as R&D expenses, increased in the first half of 2009 compared to the first half of 2008 despite the significant favorable currency impact due primarily to the increased R&D activities consolidated with the recent wireless acquisitions. Our R&D expenses before capitalization in the first half of 2009 were net of $77 million of tax credits associated with our ongoing programs, compared to $73 million in the first half of 2008.
4
In the first half of 2009, we continued certain ongoing restructuring activities and also implemented new headcount reduction programs to streamline our structure in light of the current adverse market conditions.
Our “Other income” improved significantly in the first half of 2009, supported by the additional funds granted to our R&D programs through new contracts signed with the French Administration covering the period 2008 through 2012, which allowed us to recognize approximately $114 million of income.
As a result, our operating result moved from a profit in the first half 2008 to an operating loss of $724 million in the first half 2009. As indicated above, our operating loss was largely and negatively impacted by the material drop in our revenues and by the unused capacity charges, which were largely exceeding the benefits of a strengthening dollar exchange rate.
The valuation of the fair value of the Auction Rate Securities – purchased for our account by Credit Suisse Securities LLC contrary to our instruction – required recording an impairment charge of $72 million in the first half of 2009 due to a significant and prolonged decline in “fair value” as computed under IAS 39. On February 16, 2009, the arbitration panel of the Financial Industry Regulatory Authority (“FINRA”) awarded us approximately $406 million comprising compensatory damages as well as interest, attorneys’ fees and authorized us to retain interest of approximately $27 million, out of which $25 million has already been paid. We have petitioned the United States District Court for the Southern District of New York seeking enforcement of the award. Credit Suisse has responded by seeking to vacate the FINRA award. Upon receipt of the payment we will transfer ownership of the unauthorized Auction Rate Securities to Credit Suisse and reverse impairment charges posted to date. Until the award is executed, we will continue to own the Auction Rate Securities and, consequently, we account for them in the same manner as in the prior periods.
Finance income decreased significantly in the first half 2009 as a consequence of less interest income received on our financial resources due to significantly lower U.S. dollar and Euro denominated interest rates compared to the first half of 2008. A similar trend was registered in Finance costs.
In the first half of 2009, we registered a $67 million share of loss in associates corresponding mainly to a $50 million net share of Numonyx’s equity loss related to its fourth quarter of 2008 and first quarter of 2009 results and our share in the result of ST-Ericsson AT AG (“JVD”) for an amount of $15 million. We also recorded a $215 million impairment on our associate Numonyx to reflect the worsening conditions in the memory industry.
In summary, our profitability during the first half of 2009 was negatively impacted by the following factors:
• drop in demand as a result of the global economic downturn;
• negative pricing trend;
• impairment and equity loss recorded in relation to our associates;
• manufacturing inefficiencies arising from under utilization of our fabs;
• additional impairment and other restructuring charges related to our ongoing programs;
• expenses from the acquired wireless businesses; and
• loss on financial assets due to significant and prolonged decline in fair value.
5
The factors above were partially offset by the following elements:
• favorable currency impact;
• improved product portfolio mix, after deconsolidating Flash and integrating the recently acquired wireless businesses; and
• cost savings from our on-going restructuring initiatives.
Revenue results of $1.99 billion for the second quarter of 2009 came in above the high end of our internal planning target range of $1.73 to $1.93 billion, principally driven by stronger than expected performance across most market segments including Computer, Automotive, Telecom and Industrial and in China and Asia-Pacific. Bookings steadily increased throughout the second quarter despite a still uncertain environment. Our strong actions on fab loading to reduce inventory levels have led to a reduction in inventories of almost $400 million in just six months. As expected, these actions have driven our second quarter gross margin to an extraordinarily low level. It is clear that the global recession has negatively impacted our financial results in the first half of 2009 but it has not slowed our efforts to develop leading-edge products. In the second quarter our pace of innovation continued as we brought to the market many next-generation products including analog controllers and power MOSFETs for power management in computer motherboards, high-voltage MDMesh power MOSFETs for switched- mode power supplies, MEMS gyroscopes, and advanced GPS solutions. Additionally, we ramped-up 55nm technology in ICs for set-top-boxes and, in wireless, shipped in volume TD-SCDMA devices.
B. Segment Information
We operate in two business areas: Semiconductors and Subsystems.
In the Subsystems business area, the Group designs, develops, manufactures and markets subsystems and modules for the telecommunications, automotive and industrial markets, including mobile phone accessories, battery chargers, ISDN power supplies and in-vehicle equipment for electronic toll payment. Based on its immateriality to its business as a whole, the Subsystems business area does not meet the criteria of a reportable segment under IFRS 8 Operating Segments.
In the semiconductors business area, we design, develop, manufacture and market a broad range of products, including discrete and standard commodity components, application-specific integrated circuits (“ASICs”), full-custom devices and semi-custom devices and application-specific standard products (“ASSPs”) for analog, digital and mixed-signal applications. In addition, we further participate in the manufacturing value chain of Smartcard products through our divisions.
As of March 31, 2008, following the creation of Numonyx, a new independent semiconductor company from the key assets of our and Intel’s Flash memory business (“FMG deconsolidation”), we ceased reporting the FMG segment.
Starting August 2, 2008, we reorganized our product groups. A new segment was created to report wireless operations. In addition, as of February 3, 2009, we added the EMP product line to our Wireless segment.
6
The current organization is as follows:
Automotive Consumer Computer and Communication Infrastructure Product Groups (“ACCI”), comprised of four product lines:
o Home Entertainment & Displays (“HED”);
o Automotive Products Group (“APG”);
o Computer and Communication Infrastructure (“CCI”); and
o Imaging (“IMG”).
Industrial and Multisegment Products Sector (“IMS”), comprised of:
o Analog Power and Micro-Electro-Mechanical Systems (“APM”); and
o Microcontrollers, non-Flash, non-volatile Memory and Smart Card products (“MMS”).
Wireless Segment, comprised of five product lines:
o Wireless Multi Media (“WMM”);
o Connectivity & Peripherals (“C&P”);
o Cellular Systems (“CS”);
o Ericsson Mobile Platforms (“EMP”), in which, since February 3, 2009, we report the portion of sales and operating results of ST-Ericsson as consolidated in our revenue and operating results; and
o Other Wireless, in which we report manufacturing margin, R&D revenues and other items related to the wireless business but outside the ST-Ericsson JVS.
We have restated our results in prior periods for illustrative comparisons of our performance by product segment. The preparation of segment information based on the current segment structure requires management to make significant estimates, assumptions and judgments in determining the operating income of the segments for the prior reporting periods. Management believes that the restated 2008 presentation is consistent with 2009’s and uses these comparatives when managing the Group.
(unaudited) Six Months Ended
June 27,
2009 June 28,
2008 (in millions)
Net revenues by product segments: Automotive Consumer Computer and Communication Infrastructure Product Groups (ACCI) ...................... $ 1,349 $ 2,146 Industrial and Multi-segment Products Sector (IMS) 1,093 1,637 Wireless segment .................................................... 1,169 758 Others(1) ................................................................... 42 29 Flash Memories Group (FMG) ................................. - 299 Total consolidated net revenues........................... $ 3,653 $ 4,870
(1) Includes revenues from sales of subsystems and other products not allocated to product segments.
7
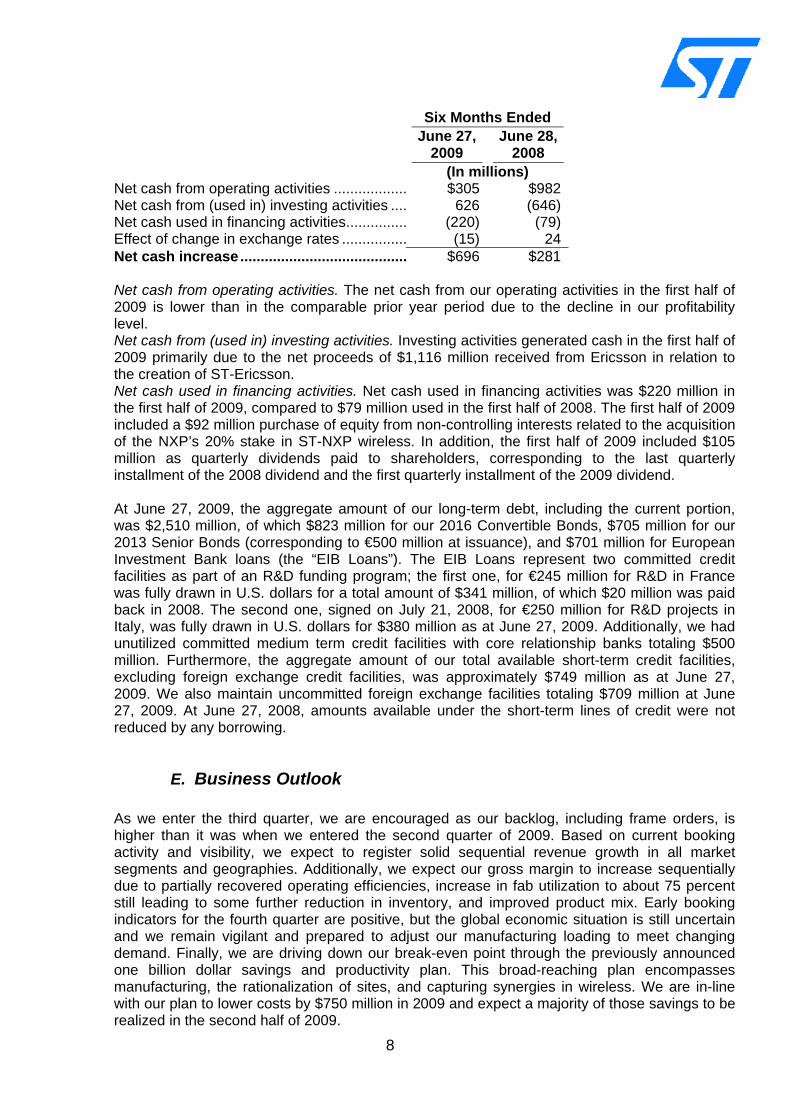
C. Net revenues by location of order shipment The table below sets forth information on our net revenues by location of order shipment: (unaudited) Six Months Ended
June 27,
2009 June 28,
2008 (in millions) Net Revenues by Location
of Order Shipment(1)(2) EMEA ............................................. $ 1,113 $ 1,534 America .......................................... 431 699 Asia Pacific ..................................... 1,075 1,155 Greater China................................. 861 1,245 Japan.............................................. 173 236 Total ............................................... $ 3,653 $ 4,870
(1) Net revenues by location of order shipment are classified by location of customer invoiced. For example, products ordered by U.S.-based companies to be invoiced to Asia Pacific affiliates are classified as Asia Pacific revenues. (2) As of January 1, 2009, Emerging Markets have been reallocated to the Europe, America and Asia Pacific organizations.
D. Liquidity
We maintain a significant gross cash position and a net cash balance, which provide us with adequate financial flexibility. As in the past, our cash management policy is to finance our investment needs with net cash generated from operating activities. As of June 27, 2009, our total liquidity and capital resources were made of: $1,685 million in cash and cash equivalents, $759 million in current available for sale financial assets, $250 million as restricted cash and $170 million as non-current assets invested in Auction Rate Securities. Our cash and cash equivalents were $1,685 million as of June 27, 2009 with a significant increase compared to December 31, 2008 million primarily originated by the proceeds from business combinations. During the first half of 2009, the evolution of our cash flow produced an increase in our cash and cash equivalents of $696 million, generated by net cash from investing activities despite a reduction in cash from operating activities and an increase in cash used in financing activities. The evolution of our cash flow for each of the respective periods is as follows:
8
Six Months Ended June 27,
2009 June 28,
2008 (In millions) Net cash from operating activities .................. $305 $982 Net cash from (used in) investing activities .... 626 (646) Net cash used in financing activities............... (220) (79) Effect of change in exchange rates ................ (15) 24 Net cash increase......................................... $696 $281
Net cash from operating activities. The net cash from our operating activities in the first half of 2009 is lower than in the comparable prior year period due to the decline in our profitability level. Net cash from (used in) investing activities. Investing activities generated cash in the first half of 2009 primarily due to the net proceeds of $1,116 million received from Ericsson in relation to the creation of ST-Ericsson. Net cash used in financing activities. Net cash used in financing activities was $220 million in the first half of 2009, compared to $79 million used in the first half of 2008. The first half of 2009 included a $92 million purchase of equity from non-controlling interests related to the acquisition of the NXP’s 20% stake in ST-NXP wireless. In addition, the first half of 2009 included $105 million as quarterly dividends paid to shareholders, corresponding to the last quarterly installment of the 2008 dividend and the first quarterly installment of the 2009 dividend. At June 27, 2009, the aggregate amount of our long-term debt, including the current portion, was $2,510 million, of which $823 million for our 2016 Convertible Bonds, $705 million for our 2013 Senior Bonds (corresponding to €500 million at issuance), and $701 million for European Investment Bank loans (the “EIB Loans”). The EIB Loans represent two committed credit facilities as part of an R&D funding program; the first one, for €245 million for R&D in France was fully drawn in U.S. dollars for a total amount of $341 million, of which $20 million was paid back in 2008. The second one, signed on July 21, 2008, for €250 million for R&D projects in Italy, was fully drawn in U.S. dollars for $380 million as at June 27, 2009. Additionally, we had unutilized committed medium term credit facilities with core relationship banks totaling $500 million. Furthermore, the aggregate amount of our total available short-term credit facilities, excluding foreign exchange credit facilities, was approximately $749 million as at June 27, 2009. We also maintain uncommitted foreign exchange facilities totaling $709 million at June 27, 2009. At June 27, 2008, amounts available under the short-term lines of credit were not reduced by any borrowing.
E. Business Outlook As we enter the third quarter, we are encouraged as our backlog, including frame orders, is higher than it was when we entered the second quarter of 2009. Based on current booking activity and visibility, we expect to register solid sequential revenue growth in all market segments and geographies. Additionally, we expect our gross margin to increase sequentially due to partially recovered operating efficiencies, increase in fab utilization to about 75 percent still leading to some further reduction in inventory, and improved product mix. Early booking indicators for the fourth quarter are positive, but the global economic situation is still uncertain and we remain vigilant and prepared to adjust our manufacturing loading to meet changing demand. Finally, we are driving down our break-even point through the previously announced one billion dollar savings and productivity plan. This broad-reaching plan encompasses manufacturing, the rationalization of sites, and capturing synergies in wireless. We are in-line with our plan to lower costs by $750 million in 2009 and expect a majority of those savings to be realized in the second half of 2009.
9
For the third quarter of 2009, we expect revenues to be in the range of $2.07 billion to $2.27 billion, up sequentially between about 4% to 14%. This outlook is based on an assumed effective currency exchange rate of approximately $1.37 = €1.00 for the third quarter of 2009, which reflects an assumed exchange rate (about $1.41 = €1.00) combined with the impact of existing hedging contracts (hedged rate: $1.33 = €1.00).
These are forward-looking statements that are subject to known and unknown risks and uncertainties that could cause actual results to differ materially; in particular, refer to those known risks and uncertainties described in “Business Risk Information”.
F. Other Developments in the First Half of 2009
On February 3, 2009, we announced the closing of our agreement to merge ST-NXP Wireless into a new venture with Ericsson Mobile Platform (“EMP”). Ericsson contributed $1.1 billion to the joint venture, out of which $700 million was paid to us. Prior to the closing of the transaction, we exercised our option to buy out NXP’s 20% ownership stake of ST-NXP Wireless. Alain Dutheil, at that time CEO of ST-NXP Wireless and our Chief Operating Officer, leads the joint venture as President and Chief Executive Officer. Governance is balanced. Each parent appoints four directors to the board with Carl-Henric Svanberg, President and CEO of Ericsson, as the Chairman of the Board and Carlo Bozotti, our President and CEO, as the Vice Chairman. Employing about 8,000 people - roughly 3,000 from Ericsson and approximately 5,000 from us - the new global leader in wireless technologies is headquartered in Geneva, Switzerland.
On February 16, 2009, we announced that an arbitration panel of FINRA, in a full and final resolution of the issues submitted for determination, awarded us, in connection with sales of unauthorized Auction Rate Securities made to us by Credit Suisse, approximately $406 million, comprising compensatory damages, as well as interest, attorney’s fees and consequential damages, which were assessed against Credit Suisse. In addition, we are entitled to retain an interest award of approximately $27 million, out of which $25 million has already been paid. Upon receipt of the payment, we will transfer ownership of our portfolio of unauthorized Auction Rate Securities to Credit Suisse and reverse impairment charges posted to date. On February 17, 2009, we filed a petition in the United States District Court for the Southern District of New York seeking enforcement of the award. Credit Suisse has responded by seeking to vacate the FINRA award.
At the end of March 2009, we entered into a framework agreement with the French Ministry of Economy, Industry and Employment for the “Nano2012” Research and Development program which confirmed our position as the Coordinator and Project Leader and allocated to us €340 million (about $450 million) in grants for the period 2008-2012.
On March 31, 2009, we announced the completion of our $500 million medium-term committed credit-facilities program. The $500 million of credit facilities were provided on a bilateral basis by Intesa-San Paolo, Société Générale, Citibank, Centrobanca (UBI Group) and Unicredit. The loan agreements had been executed between October 2008 and March 2009 with commitments from the banks for up to 3 years. We do not currently envisage any utilization of these credit facilities, which have been set up for liquidity purposes to strengthen the Group’s financial flexibility.
At our annual general meeting of shareholders held on May 20, 2009, the following proposals, inter alia, were approved by our shareholders:
• The distribution of a cash dividend of $0.12 per common share, to be paid in four equal installments, in May 2009, August 2009, November 2009 and February 2010. Payment of
10
an installment will be made to shareholders of record in the month of each quarterly payment;
• The reappointment for a three-year term, expiring at the 2012 Annual General Meeting, for the following members of the Supervisory Board: Mr. Doug Dunn and Dr. Didier Lamouche; and
• The maximum number of “restricted” Share Awards under our existing 5-year Employee Unvested Share Award Plan (2008-2012) of 30,500,000, which includes any Unvested Stock Awards granted to our President and CEO as part of his compensation, with the maximum number of “restricted” shares in 2009 to be 6,100,000.
On June 25, 2009, we announced the publication of our 2008 Corporate Responsibility Report. The report which covers all our activities and sites in 2008, contains detailed indicators of our performance across the full range of Social, Environmental, Health & Safety, and Corporate Governance issues and reaffirms our long-established commitment to serving its stakeholders with integrity, transparency and excellence.
G. Business risk information Some of the statements contained in this report that are not historical facts are statements of future expectations that are based on management’s current views and assumptions, and are conditioned upon and also involve known and unknown risks and uncertainties that could cause actual results, performance or events to differ materially from those in such statements due to, among other factors:
• Effect of the current economic downturn on demand in the key application markets and from key customers served by our products, and changes in customer order patterns, including order cancellations, all of which generate uncertainties and make it extremely difficult to accurately forecast and plan our future business activities;
• our ability to adequately utilize and operate our manufacturing facilities at sufficient levels to cover fixed operating costs, as well as the financial impact of obsolete or excess inventories if actual demand differs from our anticipations;
• the impact of intellectual property claims by our competitors or other third parties, and our ability to obtain required licenses on reasonable terms and conditions;
• the outcome of ongoing litigation as well as any new litigation to which we may become a defendant;
• our ability to successfully integrate the acquisitions we pursue, in particular the successful integration and operation of ST-Ericsson in the current difficult economic environment;
• we hold a significant non-marketable investment in Numonyx, our joint venture in the flash-memory market segment, and in ST-Ericsson, our joint venture in the wireless segment. Additionally, we are a guarantor for certain Numonyx debts. Therefore, declines in these market segments could result in significant impairment charges, restructuring charges and gains/losses on associates and additional charges related to debt guarantees;
11
• our ability to manage in an intensely competitive and cyclical industry, where a high percentage of our costs are fixed and are incurred in currencies other than U.S. dollars as well as our ability to execute our restructuring initiatives in accordance with our plans if unforeseen events require adjustments or delays in implementation;
• our ability, in an intensively competitive environment, to secure customer acceptance and to achieve our pricing expectations for high-volume supplies of new products in whose development we have been, or are currently, investing;
• the ability to maintain solid, viable relationships with our suppliers and customers in the event they are unable to maintain a competitive market presence due, in particular, to the effects of the current economic environment;
• changes in the political, social or economic environment, including as a result of military conflict, social unrest and/or terrorist activities ,economic turmoil, as well as natural events such as severe weather, health risks, epidemics (including the potential impact of swine flu on our operations or those of our customers) or earthquakes in the countries in which we, our key customers or our suppliers, operate; and
• changes in our overall tax position as a result of changes in tax laws or the outcome of tax audits, and our ability to accurately estimate tax credits, benefits, deductions and provisions and to realize deferred tax assets.
Such forward-looking statements are subject to various risks and uncertainties, which may cause actual results and performance of our business to differ materially and adversely from the forward-looking statements. Some of these risk factors are set forth and are discussed in more detail in our 2008 Annual Report. Should one or more of these risks or uncertainties materialize, or should underlying assumptions prove incorrect, actual results may vary materially from those described in this report as anticipated, believed or expected. Unfavorable changes in the above or other factors could have a material adverse effect on our business and/or financial condition and on the financial results in the second half of 2009.
12
II. About STMicroelectronics STMicroelectronics is a global leader serving customers across the spectrum of electronics applications with innovative semiconductor solutions. ST aims to be the undisputed leader in multimedia convergence and power applications leveraging its vast array of technologies, design expertise and combination of intellectual property portfolio, strategic partnerships and manufacturing strength. In 2008, the Group’s net revenues were $9.84 billion. Further information on ST can be found at www.st.com. All of STMicroelectronics’ press releases are available at www.st.com/stonline/press/news/latest.htm. All of ST-Ericsson’s press releases are available at http://www.stericsson.com/press/press_releases.jsp. IPAD, MDmesh and SuperMESH are trademarks of STMicroelectronics. All other trademarks or registered trademarks are the property of their respective owners.
For further information, please contact: INVESTOR RELATIONS: Tait Sorensen Director, Investor Relations Tel: +1 602 485 2064 [email protected] MEDIA RELATIONS: Maria Grazia Prestini Senior Director, Corporate Media and Public Relations STMicroelectronics Tel: + 41 22 929 6945 [email protected]
13
III. Interim condensed consolidated financial statements for the six months period ended June 27, 2009 (Unaudited) The interim condensed consolidated financial statements of STMicroelectronics N.V. and its subsidiaries (“the Group”) for the six months ended June 27, 2009, as presented by the Sole Member of the Managing Board, are unaudited. This chapter contains:
• Interim consolidated statements of income for the periods ended June 27, 2009 and June 28, 2008 (unaudited)
• Interim consolidated statements of comprehensive income for the periods ended June
27, 2009 and June 28, 2008 (unaudited)
• Interim consolidated balance sheets as of June 27, 2009 (unaudited) and December 31, 2008
• Interim consolidated statements of changes in equity for the periods ended June 27,
2009 and June 28, 2008 (unaudited)
• Interim consolidated statements of cash flows for the periods ended June 27, 2009 and June 28, 2008 (unaudited)
• Notes to the interim condensed consolidated financial statements (unaudited)
14
A. CONSOLIDATED STATEMENTS OF INCOME
(unaudited) Six Months Ended
USD million except per share amounts NoteJune 27,
2009 June 28,
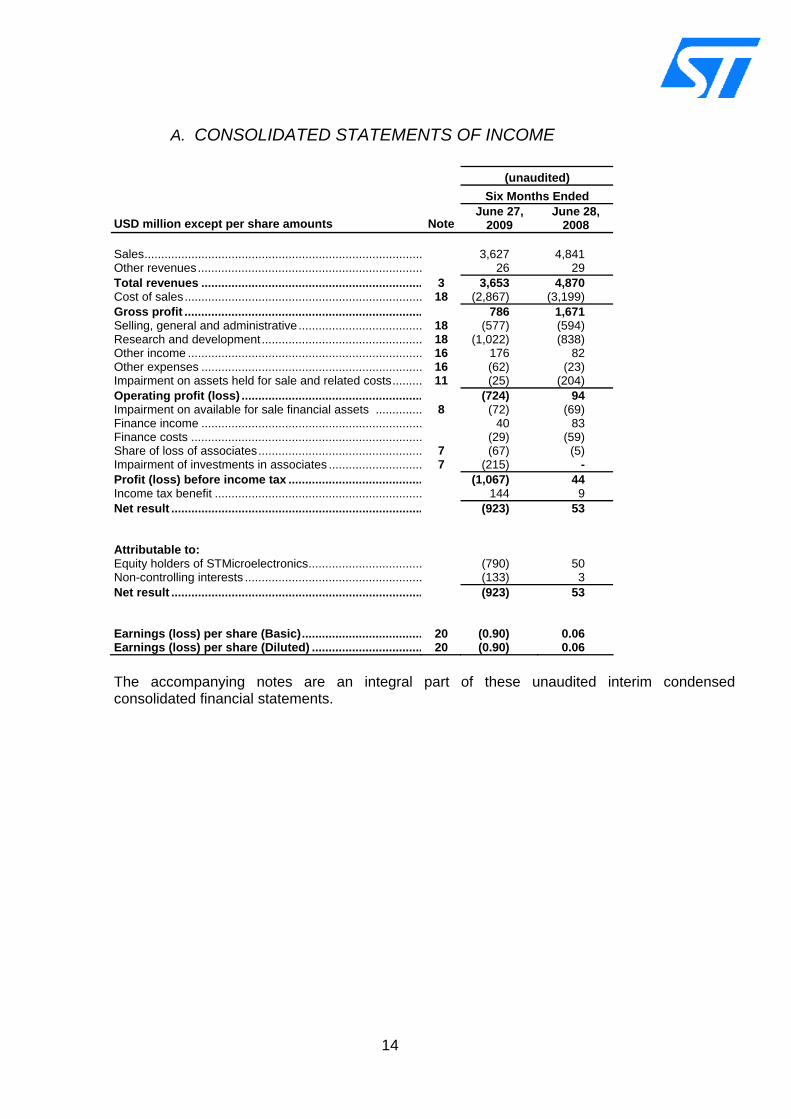
2008 Sales................................................................................... 3,627 4,841 Other revenues................................................................... 26 29 Total revenues .................................................................. 3 3,653 4,870 Cost of sales....................................................................... 18 (2,867) (3,199) Gross profit ....................................................................... 786 1,671 Selling, general and administrative ..................................... 18 (577) (594) Research and development................................................ 18 (1,022) (838) Other income ...................................................................... 16 176 82 Other expenses .................................................................. 16 (62) (23) Impairment on assets held for sale and related costs......... 11 (25) (204) Operating profit (loss) ...................................................... (724) 94 Impairment on available for sale financial assets .............. 8 (72) (69) Finance income .................................................................. 40 83 Finance costs ..................................................................... (29) (59) Share of loss of associates................................................. 7 (67) (5) Impairment of investments in associates ............................ 7 (215) - Profit (loss) before income tax ........................................ (1,067) 44 Income tax benefit .............................................................. 144 9 Net result ........................................................................... (923) 53 Attributable to: Equity holders of STMicroelectronics.................................. (790) 50 Non-controlling interests ..................................................... (133) 3 Net result ........................................................................... (923) 53 Earnings (loss) per share (Basic).................................... 20 (0.90) 0.06 Earnings (loss) per share (Diluted) ................................. 20 (0.90) 0.06 The accompanying notes are an integral part of these unaudited interim condensed consolidated financial statements.
15
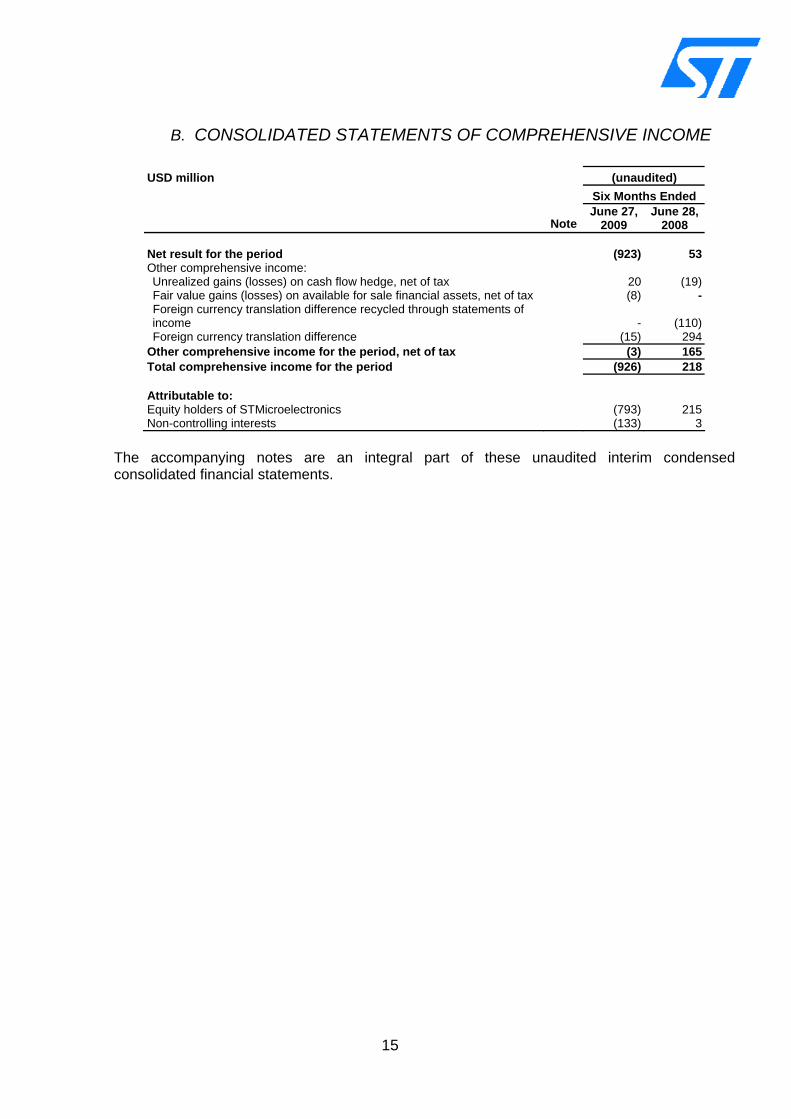
B. CONSOLIDATED STATEMENTS OF COMPREHENSIVE INCOME
USD million (unaudited) Six Months Ended
Note June 27,
2009 June 28,
2008 Net result for the period (923) 53Other comprehensive income: Unrealized gains (losses) on cash flow hedge, net of tax 20 (19)Fair value gains (losses) on available for sale financial assets, net of tax (8) -Foreign currency translation difference recycled through statements of income
- (110)
Foreign currency translation difference (15) 294Other comprehensive income for the period, net of tax (3) 165Total comprehensive income for the period (926) 218 Attributable to: Equity holders of STMicroelectronics (793) 215Non-controlling interests (133) 3
The accompanying notes are an integral part of these unaudited interim condensed consolidated financial statements.
16
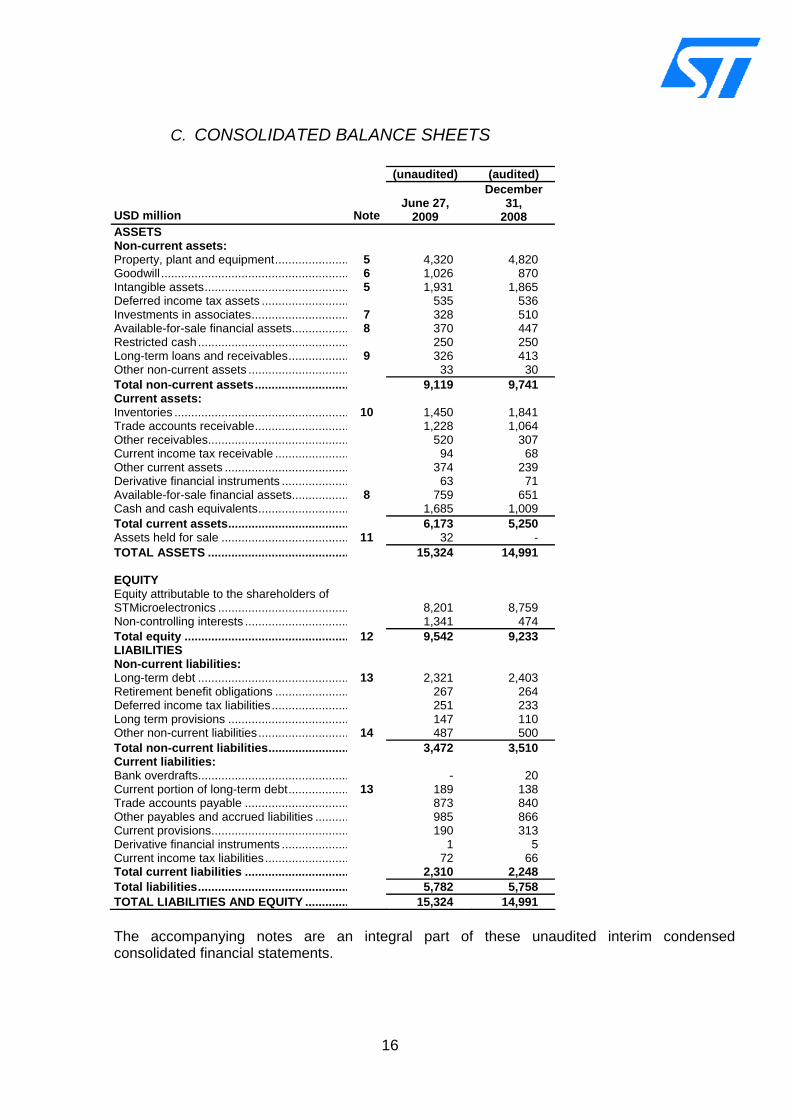
C. CONSOLIDATED BALANCE SHEETS
(unaudited) (audited)
USD million NoteJune 27,
2009
December 31,
2008 ASSETS Non-current assets: Property, plant and equipment...................... 5 4,320 4,820 Goodwill ........................................................ 6 1,026 870 Intangible assets........................................... 5 1,931 1,865 Deferred income tax assets .......................... 535 536 Investments in associates............................. 7 328 510 Available-for-sale financial assets................. 8 370 447 Restricted cash............................................. 250 250 Long-term loans and receivables.................. 9 326 413 Other non-current assets .............................. 33 30 Total non-current assets............................ 9,119 9,741 Current assets: Inventories .................................................... 10 1,450 1,841 Trade accounts receivable............................ 1,228 1,064 Other receivables.......................................... 520 307 Current income tax receivable ...................... 94 68 Other current assets ..................................... 374 239 Derivative financial instruments .................... 63 71 Available-for-sale financial assets................. 8 759 651 Cash and cash equivalents........................... 1,685 1,009 Total current assets.................................... 6,173 5,250 Assets held for sale ...................................... 11 32 - TOTAL ASSETS .......................................... 15,324 14,991 EQUITY Equity attributable to the shareholders of STMicroelectronics ....................................... 8,201 8,759 Non-controlling interests ............................... 1,341 474 Total equity ................................................. 12 9,542 9,233 LIABILITIES Non-current liabilities: Long-term debt ............................................. 13 2,321 2,403 Retirement benefit obligations ...................... 267 264 Deferred income tax liabilities....................... 251 233 Long term provisions .................................... 147 110 Other non-current liabilities........................... 14 487 500 Total non-current liabilities........................ 3,472 3,510 Current liabilities: Bank overdrafts............................................. - 20 Current portion of long-term debt.................. 13 189 138 Trade accounts payable ............................... 873 840 Other payables and accrued liabilities .......... 985 866 Current provisions......................................... 190 313 Derivative financial instruments .................... 1 5 Current income tax liabilities......................... 72 66 Total current liabilities ............................... 2,310 2,248 Total liabilities............................................. 5,782 5,758 TOTAL LIABILITIES AND EQUITY ............. 15,324 14,991 The accompanying notes are an integral part of these unaudited interim condensed consolidated financial statements.
17
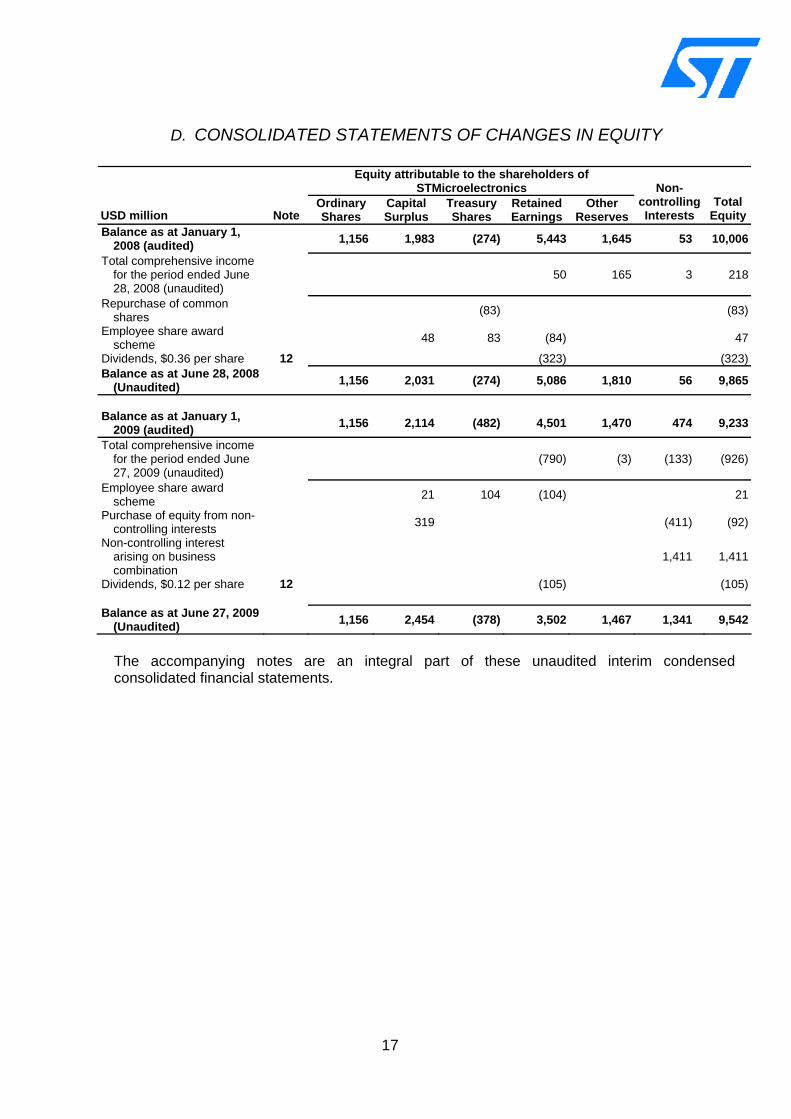
D. CONSOLIDATED STATEMENTS OF CHANGES IN EQUITY
Equity attributable to the shareholders of STMicroelectronics
USD million Note Ordinary Shares
Capital Surplus
Treasury Shares
Retained Earnings
Other Reserves
Non-controlling Interests
Total Equity
Balance as at January 1, 2008 (audited) 1,156 1,983 (274) 5,443 1,645 53 10,006
Total comprehensive income for the period ended June 28, 2008 (unaudited)
50 165 3 218
Repurchase of common shares (83) (83)
Employee share award scheme 48 83 (84) 47
Dividends, $0.36 per share 12 (323) (323)Balance as at June 28, 2008
(Unaudited) 1,156 2,031 (274) 5,086 1,810 56 9,865
Balance as at January 1,
2009 (audited) 1,156 2,114 (482) 4,501 1,470 474 9,233
Total comprehensive income for the period ended June 27, 2009 (unaudited)
(790) (3) (133) (926)
Employee share award scheme 21 104 (104) 21
Purchase of equity from non-controlling interests 319 (411) (92)
Non-controlling interest arising on business combination
1,411 1,411
Dividends, $0.12 per share 12 (105) (105) Balance as at June 27, 2009
(Unaudited) 1,156 2,454 (378) 3,502 1,467 1,341 9,542
The accompanying notes are an integral part of these unaudited interim condensed consolidated financial statements.
18
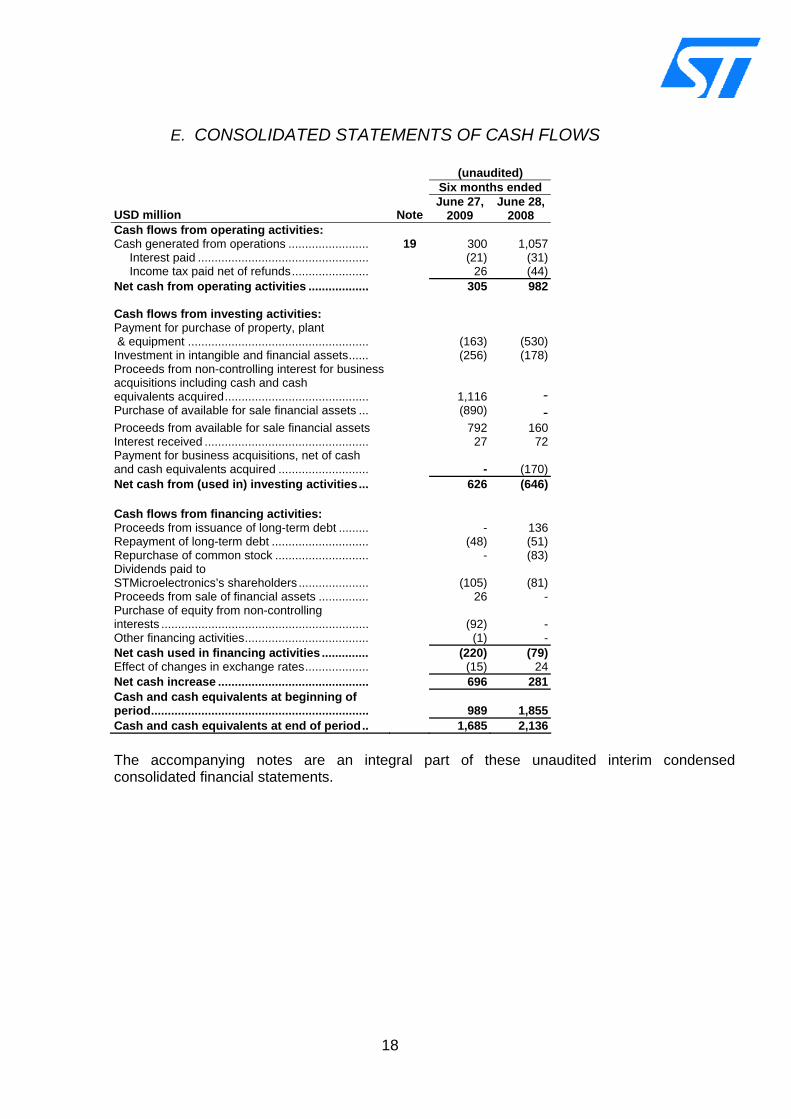
E. CONSOLIDATED STATEMENTS OF CASH FLOWS (unaudited)
Six months ended
USD million NoteJune 27,
2009 June 28,
2008 Cash flows from operating activities: Cash generated from operations ........................ 19 300 1,057
Interest paid ................................................... (21) (31)Income tax paid net of refunds....................... 26 (44)
Net cash from operating activities .................. 305 982 Cash flows from investing activities: Payment for purchase of property, plant & equipment ...................................................... (163) (530)Investment in intangible and financial assets...... (256) (178)Proceeds from non-controlling interest for businessacquisitions including cash and cash equivalents acquired........................................... 1,116 -Purchase of available for sale financial assets ... (890) -Proceeds from available for sale financial assets 792 160Interest received ................................................. 27 72Payment for business acquisitions, net of cash and cash equivalents acquired ...........................
- (170)
Net cash from (used in) investing activities... 626 (646)
Cash flows from financing activities: Proceeds from issuance of long-term debt ......... - 136Repayment of long-term debt ............................. (48) (51)Repurchase of common stock ............................ - (83)Dividends paid to STMicroelectronics’s shareholders ..................... (105) (81)Proceeds from sale of financial assets ............... 26 -Purchase of equity from non-controlling interests ..............................................................
(92) -
Other financing activities..................................... (1) -Net cash used in financing activities .............. (220) (79)Effect of changes in exchange rates................... (15) 24Net cash increase ............................................. 696 281Cash and cash equivalents at beginning of period.................................................................
989 1,855
Cash and cash equivalents at end of period.. 1,685 2,136 The accompanying notes are an integral part of these unaudited interim condensed consolidated financial statements.
19
IV. Notes to the interim condensed consolidated financial statements (unaudited) 1. GENERAL INFORMATION ______________________________________________ 20
2. SUMMARY OF SIGNIFICANT ACCOUNTING POLICIES ______________________ 21
3. SEGMENT INFORMATION ______________________________________________ 23
4. BUSINESS COMBINATIONS ____________________________________________ 27
5. PROPERTY, PLANT AND EQUIPMENT AND INTANGIBLE ASSETS_____________ 30
6. GOODWILL __________________________________________________________ 31
7. INVESTMENTS IN ASSOCIATES_________________________________________ 32
8. AVAILABLE FOR SALE FINANCIAL ASSETS _______________________________ 33
9. LONG-TERM LOANS AND RECEIVABLES _________________________________ 34
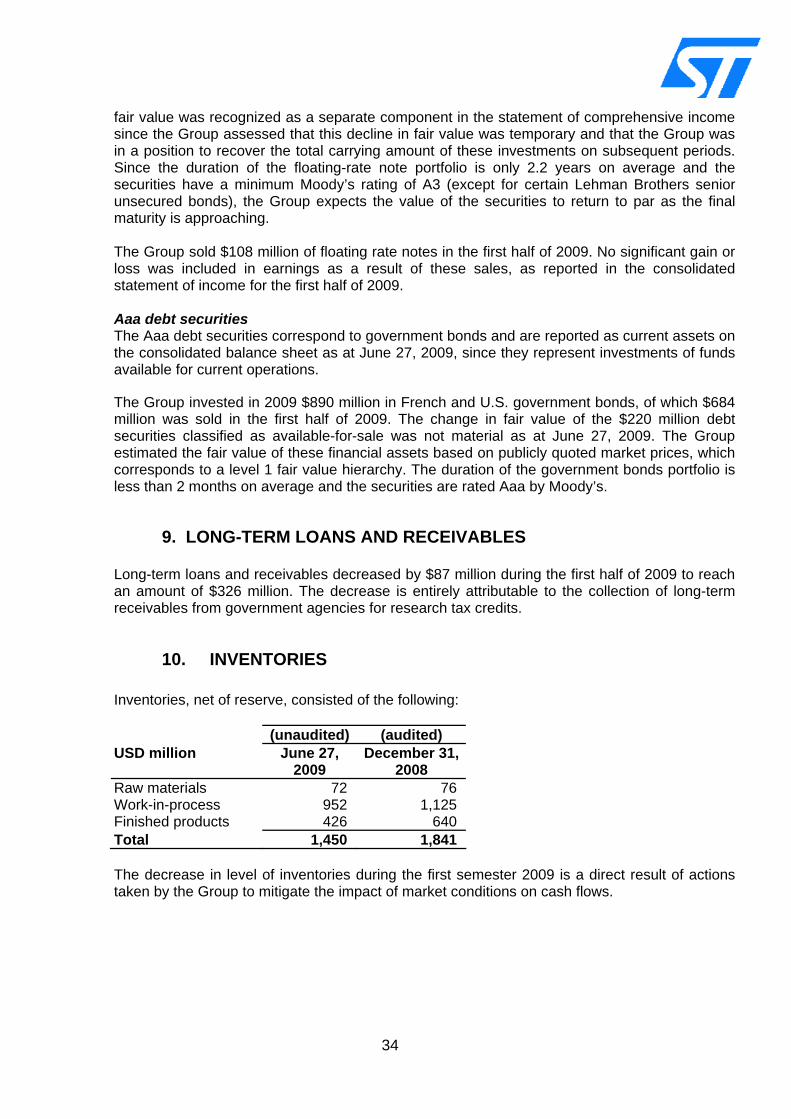
10. INVENTORIES________________________________________________________ 34
11. ASSETS HELD FOR SALE ______________________________________________ 35
12. SHAREHOLDERS EQUITY______________________________________________ 36
13. LONG TERM DEBT ____________________________________________________ 37
14. OTHER NON CURRENT LIABILITIES _____________________________________ 38
15. FAIR VALUE MEASUREMENT ___________________________________________ 38
16. OTHER INCOME / OTHER EXPENSES ____________________________________ 39
17. RESTRUCTURING ____________________________________________________ 40
18. EXPENSES BY NATURE _______________________________________________ 41
19. CASH GENERATED FROM OPERATIONS _________________________________ 42
20. EARNINGS / (LOSS) PER SHARE ________________________________________ 43
21. CONTINGENT LIABILITIES _____________________________________________ 43
22. CLAIMS AND LEGAL PROCEEDINGS_____________________________________ 44
23. RELATED-PARTY TRANSACTIONS ______________________________________ 45
20
1. GENERAL INFORMATION STMicroelectronics N.V. (the “Company”) is registered in The Netherlands with its statutory domicile in 265, Schiphol Boulevard, Amsterdam and its corporate headquarters located in Geneva, Switzerland. STMicroelectronics and its subsidiaries (together “the Group”) are a global independent semiconductor company that designs, develops, manufactures and markets a broad range of semiconductor integrated circuits (“ICs”) and discrete devices. The Group offers a diversified product portfolio and develops products for a wide range of market applications, including automotive products, computer peripherals, telecommunications systems, consumer products, industrial automation and control systems. Within its diversified portfolio, the Group has focused on developing products that leverage its technological strengths in creating customized, system-level solutions with high-growth digital and mixed-signal content. STMicroelectronics is a publicly traded company that is listed on the New York Stock Exchange, on Euronext Paris and on the Borsa Italiana (Italian Stock Exchange). The Group’s fiscal year ends on December 31. Interim periods are established for accounting purposes on a thirteen-week basis. The Group’s first quarter ended on March 28, 2009. Its second quarter ended on June 27, 2009, its third quarter will end on September 26, 2009 and its fourth quarter will end on December 31, 2009. These unaudited interim condensed consolidated financial statements have been approved on August 26, 2009 for issue by the Supervisory Board.
21
2. SUMMARY OF SIGNIFICANT ACCOUNTING POLICIES
a. Basis of preparation These unaudited interim condensed consolidated financial statements for the six months ended June 27, 2009 have been prepared in accordance with IAS 34 Interim Financial Reporting, as adopted in the European Union. The unaudited interim condensed consolidated financial statements do not include all the information and disclosures required in the annual financial statements, and should be read in conjunction with the annual financial statements for the year ended December 31, 2008, prepared in accordance with IFRS, filed with the AFM (Autoriteit Financiële Markten) on April 23, 2009 and approved by the Annual Shareholders’ Meeting on May 20, 2009.
b. Significant accounting policies The accounting policies adopted in the preparation of the interim condensed consolidated financial statements are consistent with those followed in the preparation of the Group’s annual financial statements for the year ended December 31, 2008, except for the adoption of new Standards and amendments to Standards as at January 1, 2009, noted below:
• IAS 1 (Revised) Presentation of Financial Statements The revised Standard separates owner and non-owner changes in equity. The statement of changes in equity includes only details of transactions with owners, with non-owner changes in equity presented as a single line. In addition the Standard introduces the statement of comprehensive income: it presents all items of recognized income and expense, either in one statement, or in two linked statements. The Group has elected to present two statements.
• IFRS 7 Financial Instruments: Disclosures The amended standard requires additional disclosures about fair value measurement and liquidity risk. Fair value measurements are to be disclosed by source of inputs using a three level hierarchy for each class of financial instruments. In addition, reconciliation between the beginning and the ending balance for Level 3 fair value measurements is now required, as well as significant transfers between Level 1 and Level 2 fair value measurements. The Group has elected to present the fair value hierarchy in Note 15 of these interim condensed consolidated financial statements. Full disclosure as required by IFRS 7 will be included in the year-end consolidated financial statements.
• IFRS 3 (Revised) Business Combinations and IAS 27 (Amended) Consolidated and
Separate Financial Statements In January 2008, the IASB issued a revised version IFRS 3 Business Combinations (“IFRS 3R”) and an amended version of IAS 27 Consolidated and Separate Financial Statements (“IAS 27A”). IFRS 3R is a further development of the acquisition model: The standard now applies to more transactions, as combinations by contract alone and combinations of mutual entities are brought into the scope of the standard. The requirements for recognition of contingent consideration have also been amended. Contingent consideration is now required to be recognized at fair value even if it is not deemed to be probable of payment at the date of acquisition. All subsequent changes in debt contingent consideration are recognized in the income statement and no longer against goodwill. The revised standard gives also the option, on a transaction-by-transaction basis, to measure non-controlling interests (previously minority interest) at the fair value of their proportion of identifiable assets and liabilities or at full fair value.
22
The “bargain purchase” guidance remains the same with the requirement to recognize “negative goodwill” immediately in the income statement. IFRS 3R has limited changes to the assets and liabilities recognized in the acquisition balance sheet but while current guidance requires deferred tax assets of the acquired business that are not recognized at the date of the combination but subsequently meet the recognition criteria to be adjusted against goodwill, the revised standard will only allow adjustments against goodwill within the one-year window for finalization of the purchase accounting to the extent that the adjustment relates to new information obtained about facts and circumstances that existed as at the acquisition date. IAS 27A moves the consolidation standard to a mandatory adoption of the economic entity model. A partial disposal of an interest in a subsidiary in which the parent company retains control does not result in a gain or loss but in an increase or decrease in equity under the economic entity approach. Purchase of some or all of the non-controlling interest is treated as an equity transaction. A partial disposal of an interest in a subsidiary in which the parent company loses control but retains an interest triggers recognition of gain or loss on the entire interest. IFRS 3R applies to business combinations with an acquisition date that is on or after the beginning of the first annual reporting period that starts on or after July 1, 2009. IAS 27A takes effect in fiscal years beginning on or after the start of the first annual reporting period that commences on or after July 1, 2009. Earlier application is permitted only at the beginning of an annual reporting period that begins on or after June 30, 2007, and if one of the standards is applied early, the other one must also be applied. The Group decided to early adopt IFRS 3R and IAS 27A for the fiscal year beginning on January 1, 2009.
Other Standards and Interpretations effective from January 1, 2009 were not relevant or did not have a material impact on the Group’s financial statements.
c. Estimates The preparation of the semi-annual financial statements requires management to make judgments, estimates and assumptions that affect the application of accounting policies and the reported amount of assets and liabilities, income and expense. Actual results may differ from these estimates.
23
3. SEGMENT INFORMATION The Group early adopted in 2007 IFRS 8 Operating Segments. The following describes the segment information. Business Segments STMicroelectronics operates in two business areas: Semiconductors and Subsystems. In the Semiconductors business area, STMicroelectronics designs, develops, manufactures and markets a broad range of products, including discrete and standard commodity components, application-specific integrated circuits (“ASICs”), full custom devices and semi-custom devices and application-specific standard products (“ASSPs”) for analog, digital, and mixed-signal applications. In addition, STMicroelectronics further participates in the manufacturing value chain of Smartcard products through its Incard division. The Group also designs, develops, manufactures and markets subsystems and modules for a wide variety of products in the telecommunications, automotive and industrial markets in its Subsystems division. Based on its immateriality, the Group does not report information separately for Subsystems. Since March 31, 2008, following the creation of Numonyx, an independent semiconductor company from the key assets of its and Intel’s Flash memory business (“FMG deconsolidation”), the Group has ceased reporting the FMG segment. Starting August 2, 2008, the Group reorganized its groups. A new segment was created to report wireless operations. In addition, as of February 3, 2009, the Group added the Ericsson Mobile Platform (“EMP”) product line to its Wireless segment. The new organization is as follows:
Automotive Consumer Computer and Communication Infrastructure Product Groups segment (“ACCI”), comprised of four product lines:
1. Home Entertainment & Displays (“HED”); 2. Automotive Products Group (“APG”); 3. Computer and Communication Infrastructure (“CCI”), which now includes the
Communication Infrastructure division, and; 4. Imaging (“IMG”) starting January 1, 2009
Industrial and Multisegment Products Sector (“IMS”), comprised of:
1. Analog Power and Micro-Electro-Mechanical Systems (“APM”); and 2. Microcontrollers, non-Flash, non-volatile Memory and Smart Card products
(“MMS”).
Wireless Products Sector (“WPS”). Starting February 3, 2009, as a consequence of the merger of ST-NXP wireless and Ericsson Mobile Platforms to create ST-Ericsson with Ericsson, the WPS segment has been adjusted and comprised of:
1. Wireless Multi Media (“WMM”); 2. Connectivity & Peripherals (“C&P”); 3. Cellular Systems (“CS”); 4. Ericsson Mobile Platform (“EMP”), in which, since February 3, 2009, the Group
reports the portion of sales and operating results of ST-Ericsson as consolidated in the Group’s revenue and operating results, and;
5. Other Wireless, in which the Group reports manufacturing margin, R&D revenues and other items related to the wireless business but outside ST-Ericsson JVs.
24
The Group has restated its results in prior periods for illustrative comparisons of its performance by product segment. The preparation of segment information according to the new segment structure requires management to make significant estimates, assumptions and judgments in determining the operating income of the segments for the prior reporting periods. STMicroelectronics’s principal investment and resource allocation decisions in the Semiconductor business area are for expenditures on research and development and capital investments in front-end and back-end manufacturing facilities. These decisions are not made by operating segment, but on the basis of the Semiconductor Business area. All these segments share common research and development for process technology and manufacturing capacity for most of their products. In the Subsystems business area, STMicroelectronics designs, develops, manufactures and markets subsystems and modules for the telecommunications, automotive and industrial markets including mobile phone accessories, battery charges, ISDN power supplies and in-vehicle equipment for electronic toll payment. Based on its immateriality to its business as a whole, the Subsystems segment does not meet the requirements for a reportable segment. The following tables present STMicroelectronics’s consolidated net revenues and consolidated operating income by semiconductor operating segment and product lines. For the computation of the Groups’ internal financial measurements, STMicroelectronics uses certain internal rules of allocation for the costs not directly chargeable to the operating segments, including cost of sales, selling, general and administrative expenses and a significant part of research and development expenses. Additionally, in compliance with STMicroelectronics’s internal policies, certain cost items are not charged to the segments, including impairment, unused capacities, restructuring charges and other related closure costs, start-up costs of new manufacturing facilities, some strategic and special research and development programs or other corporate-sponsored initiatives, including certain corporate-level operating expenses and certain other miscellaneous charges. STMicroelectronics’s management information is derived from US-GAAP which is the primary basis to communicate to shareholders. Therefore reconciliation from the combined segment results to Group’s profit (loss) comprises US-GAAP to IFRS measurement differences as well as items not allocated to segments. Typically the reporting segments of STMicroelectronics do not include restructuring and impairment expenses, or significant non-recurring items.
25
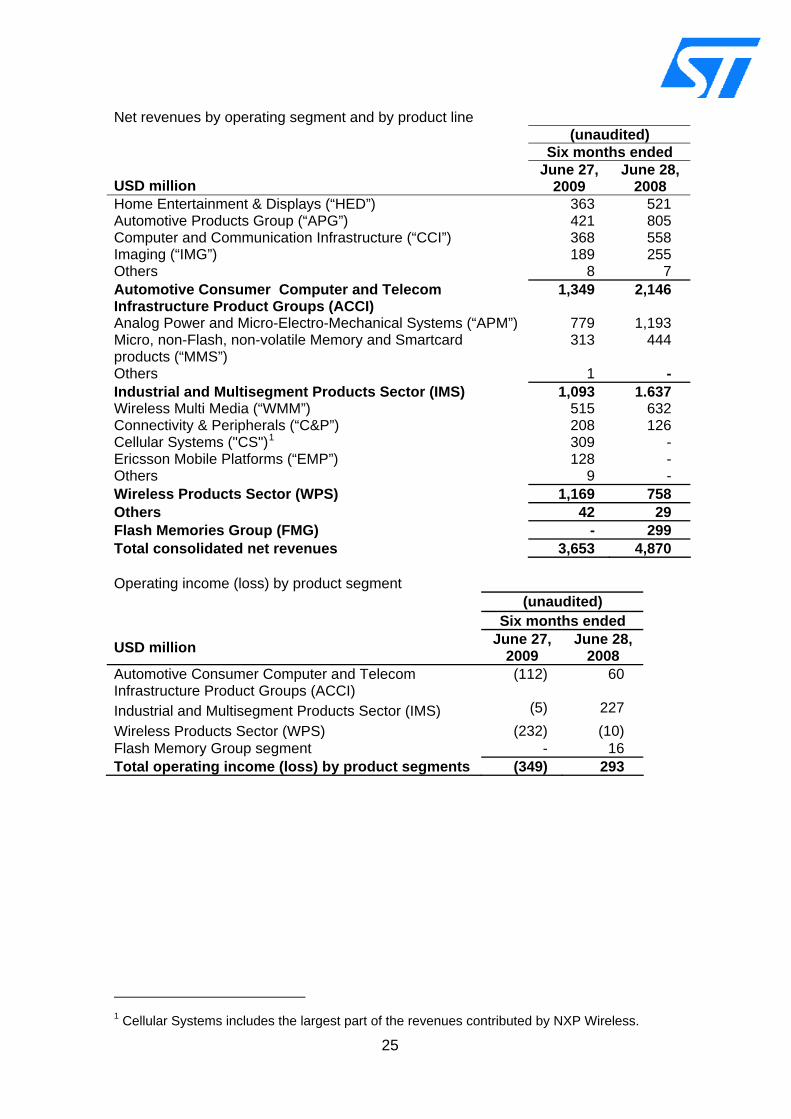
Net revenues by operating segment and by product line (unaudited)
Six months ended
USD million June 27,
2009 June 28,
2008 Home Entertainment & Displays (“HED”) 363 521 Automotive Products Group (“APG”) 421 805 Computer and Communication Infrastructure (“CCI”) 368 558 Imaging (“IMG”) 189 255 Others 8 7 Automotive Consumer Computer and Telecom Infrastructure Product Groups (ACCI)
1,349 2,146
Analog Power and Micro-Electro-Mechanical Systems (“APM”) 779 1,193 Micro, non-Flash, non-volatile Memory and Smartcard products (“MMS”)
313 444
Others 1 - Industrial and Multisegment Products Sector (IMS) 1,093 1.637 Wireless Multi Media (“WMM”) 515 632 Connectivity & Peripherals (“C&P”) 208 126 Cellular Systems ("CS")1 309 - Ericsson Mobile Platforms (“EMP”) 128 - Others 9 - Wireless Products Sector (WPS) 1,169 758 Others 42 29 Flash Memories Group (FMG) - 299 Total consolidated net revenues 3,653 4,870 Operating income (loss) by product segment (unaudited) Six months ended
USD million June 27, 2009
June 28, 2008
Automotive Consumer Computer and Telecom Infrastructure Product Groups (ACCI)
(112) 60
Industrial and Multisegment Products Sector (IMS) (5) 227 Wireless Products Sector (WPS) (232) (10) Flash Memory Group segment - 16 Total operating income (loss) by product segments (349) 293
1 Cellular Systems includes the largest part of the revenues contributed by NXP Wireless.
26
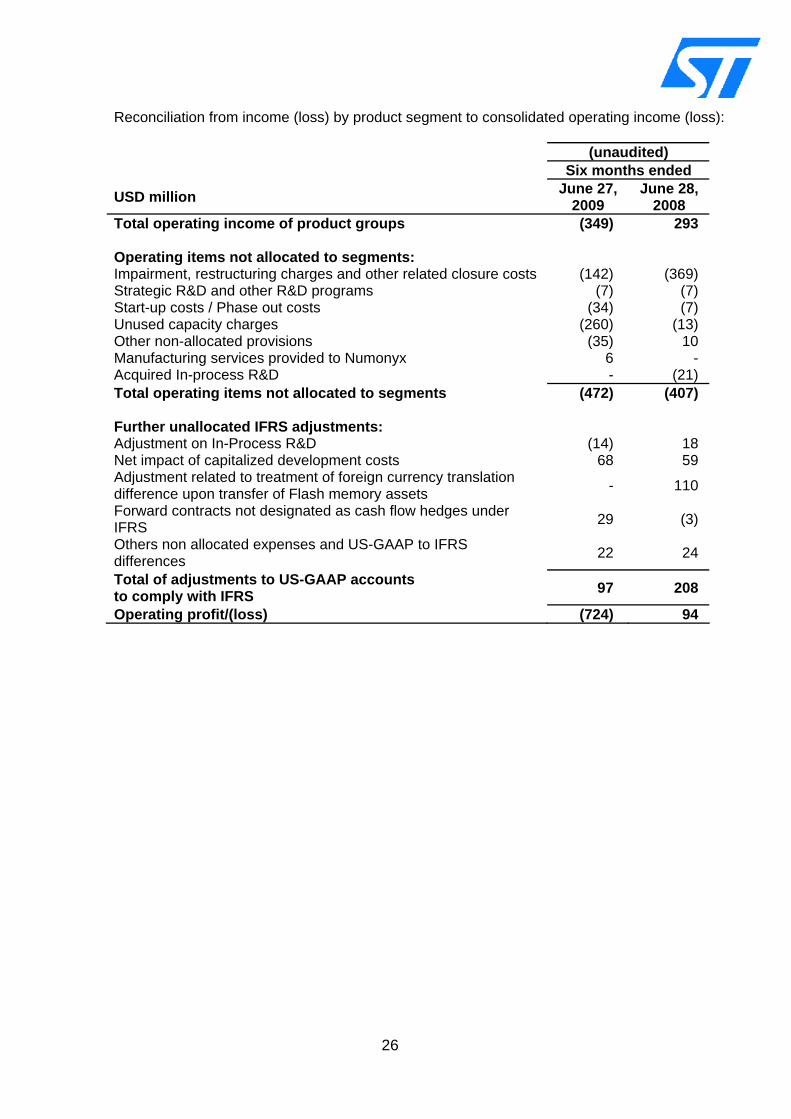
Reconciliation from income (loss) by product segment to consolidated operating income (loss): (unaudited) Six months ended
USD million June 27, 2009
June 28, 2008
Total operating income of product groups (349) 293 Operating items not allocated to segments: Impairment, restructuring charges and other related closure costs (142) (369) Strategic R&D and other R&D programs (7) (7) Start-up costs / Phase out costs (34) (7) Unused capacity charges (260) (13) Other non-allocated provisions (35) 10 Manufacturing services provided to Numonyx 6 - Acquired In-process R&D - (21) Total operating items not allocated to segments (472) (407) Further unallocated IFRS adjustments: Adjustment on In-Process R&D (14) 18 Net impact of capitalized development costs 68 59 Adjustment related to treatment of foreign currency translation difference upon transfer of Flash memory assets - 110
Forward contracts not designated as cash flow hedges under IFRS 29 (3)
Others non allocated expenses and US-GAAP to IFRS differences 22 24
Total of adjustments to US-GAAP accounts to comply with IFRS 97 208
Operating profit/(loss) (724) 94
27
4. BUSINESS COMBINATIONS ST-NXP Wireless – Buy out of the 20% non-controlling interest of NXP B.V. The ST-NXP Wireless purchase agreement provided STMicroelectronics with a call option and NXP with a put option on NXP's 20% non-controlling interest in the new company. Based on the original terms of the purchase agreement, the options could be exercised three years after signing of the agreement, or earlier in case of a business combination with Ericsson Mobile Platforms (“EMP”).
Prior to the closing of the transaction with Ericsson, on February 1, 2009, the Group exercised its option to purchase the 20% non-controlling interest of NXP in ST-NXP for a price of $92 million. NXP’s non-controlling interest amounted to $411 million as at February 1, 2009, thus generated a gain recognized in equity of $319 million.
ST-Ericsson On February 3, 2009, the Group closed a transaction to combine the businesses of EMP and ST-NXP Wireless into a new venture, named ST-Ericsson. ST-Ericsson combines the resources of the two companies and focuses on developing and delivering a complete portfolio of mobile platforms wireless semiconductor solutions across a broad spectrum of mobile technologies. The operations of ST-Ericsson are conducted through two groups of companies. The parent of one of the groups is ST-Ericsson Holding AG (“JVS”), which is owned 50% plus a controlling share by ST. JVS is responsible for the full commercial operation of the combined businesses, namely sales, marketing, supply and the full product responsibility. The parent of the other group, ST-Ericsson AT Holding AG (“JVD”), is owned 50% plus a controlling share by Ericsson and will be focused on fundamental R&D activities. Based upon its analysis, the Group has determined that it controls JVS and therefore consolidates JVS, but that it has only a significant influence on JVD and therefore accounts for its investment in JVD under the equity method. JVD is discussed further in Note 7. In connection with the contributions by ST and Ericsson of their respective businesses to the venture entities, Ericsson paid cash directly to the Group for $700 million and contributed an additional $445 million to JVS. The transaction has been accounted for as a business combination under IFRS 3R. The purchase price allocation of the tangible and intangible assets is preliminary and may be adjusted as a result of obtaining additional information regarding preliminary estimates of fair values made at the date of purchase. The interim condensed consolidated financial statements include the results of JVS for the five month period from the acquisition date. In accordance with IFRS 3R, the Group elected to measure non-controlling interests at full fair value.
28
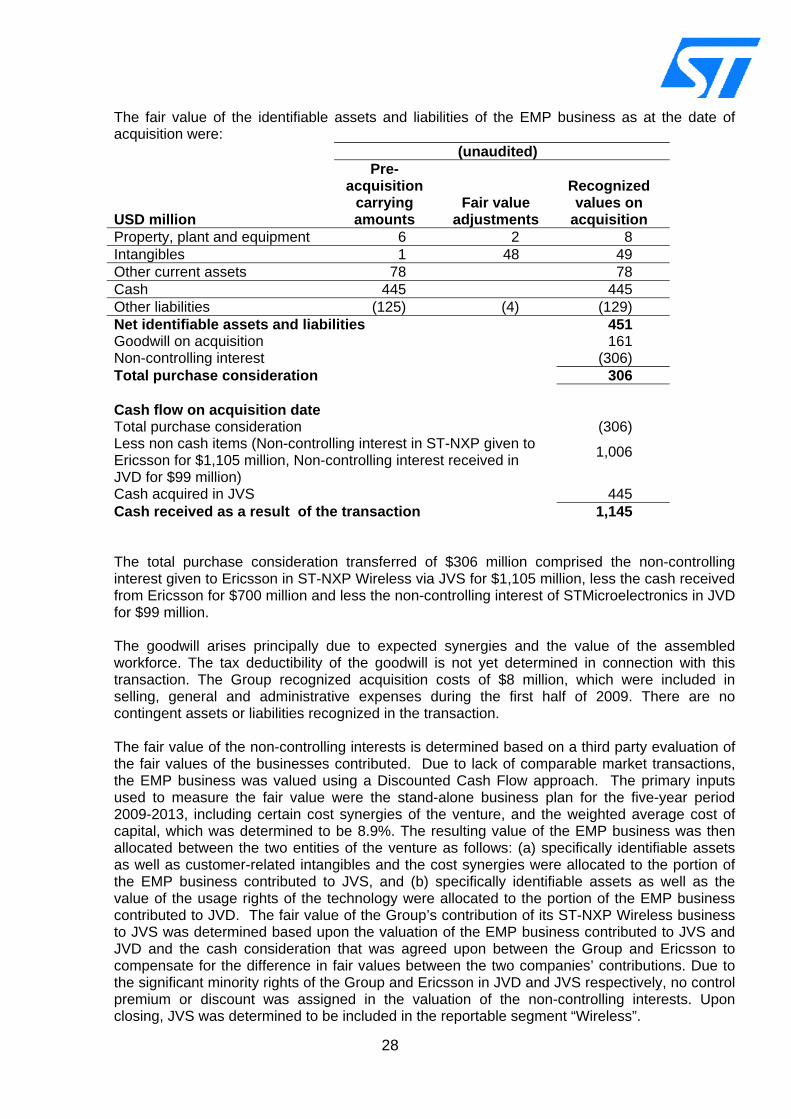
The fair value of the identifiable assets and liabilities of the EMP business as at the date of acquisition were: (unaudited)
USD million
Pre-acquisition
carrying amounts
Fair value adjustments
Recognized values on
acquisition Property, plant and equipment 6 2 8 Intangibles 1 48 49 Other current assets 78 78 Cash 445 445 Other liabilities (125) (4) (129) Net identifiable assets and liabilities 451 Goodwill on acquisition 161 Non-controlling interest (306) Total purchase consideration 306 Cash flow on acquisition date Total purchase consideration (306) Less non cash items (Non-controlling interest in ST-NXP given to Ericsson for $1,105 million, Non-controlling interest received in JVD for $99 million)
1,006
Cash acquired in JVS 445 Cash received as a result of the transaction 1,145 The total purchase consideration transferred of $306 million comprised the non-controlling interest given to Ericsson in ST-NXP Wireless via JVS for $1,105 million, less the cash received from Ericsson for $700 million and less the non-controlling interest of STMicroelectronics in JVD for $99 million. The goodwill arises principally due to expected synergies and the value of the assembled workforce. The tax deductibility of the goodwill is not yet determined in connection with this transaction. The Group recognized acquisition costs of $8 million, which were included in selling, general and administrative expenses during the first half of 2009. There are no contingent assets or liabilities recognized in the transaction. The fair value of the non-controlling interests is determined based on a third party evaluation of the fair values of the businesses contributed. Due to lack of comparable market transactions, the EMP business was valued using a Discounted Cash Flow approach. The primary inputs used to measure the fair value were the stand-alone business plan for the five-year period 2009-2013, including certain cost synergies of the venture, and the weighted average cost of capital, which was determined to be 8.9%. The resulting value of the EMP business was then allocated between the two entities of the venture as follows: (a) specifically identifiable assets as well as customer-related intangibles and the cost synergies were allocated to the portion of the EMP business contributed to JVS, and (b) specifically identifiable assets as well as the value of the usage rights of the technology were allocated to the portion of the EMP business contributed to JVD. The fair value of the Group’s contribution of its ST-NXP Wireless business to JVS was determined based upon the valuation of the EMP business contributed to JVS and JVD and the cash consideration that was agreed upon between the Group and Ericsson to compensate for the difference in fair values between the two companies’ contributions. Due to the significant minority rights of the Group and Ericsson in JVD and JVS respectively, no control premium or discount was assigned in the valuation of the non-controlling interests. Upon closing, JVS was determined to be included in the reportable segment “Wireless”.
29
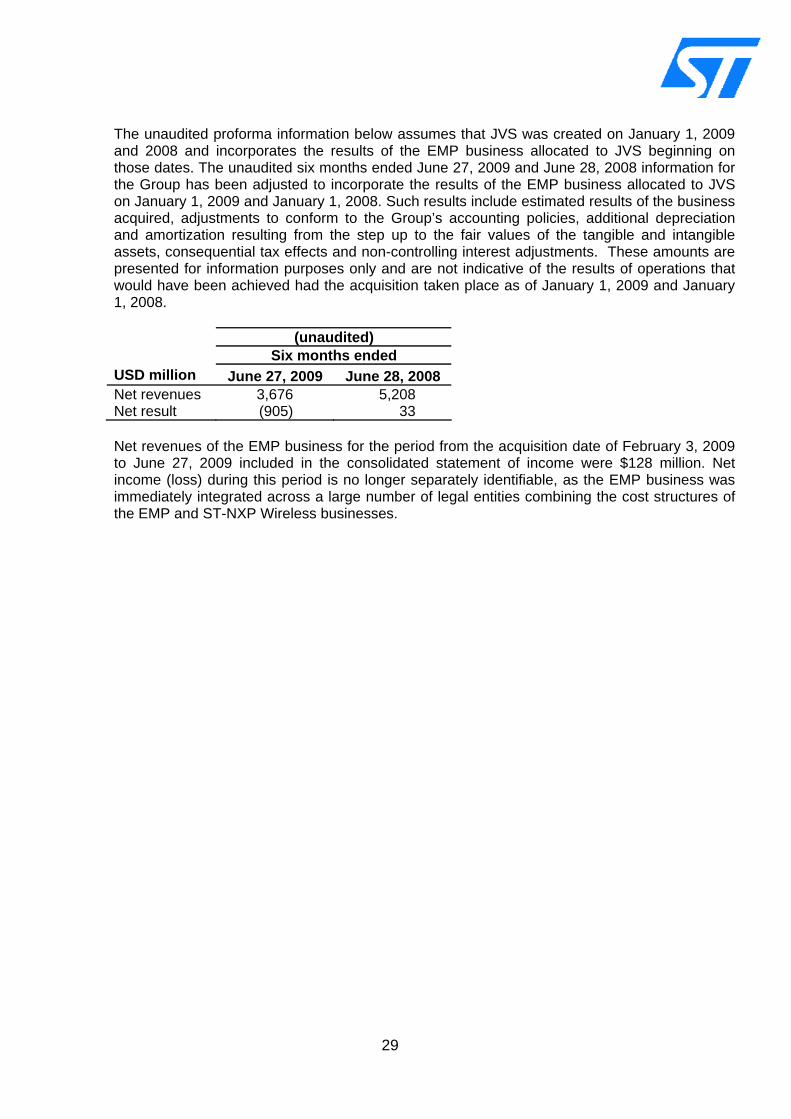
The unaudited proforma information below assumes that JVS was created on January 1, 2009 and 2008 and incorporates the results of the EMP business allocated to JVS beginning on those dates. The unaudited six months ended June 27, 2009 and June 28, 2008 information for the Group has been adjusted to incorporate the results of the EMP business allocated to JVS on January 1, 2009 and January 1, 2008. Such results include estimated results of the business acquired, adjustments to conform to the Group’s accounting policies, additional depreciation and amortization resulting from the step up to the fair values of the tangible and intangible assets, consequential tax effects and non-controlling interest adjustments. These amounts are presented for information purposes only and are not indicative of the results of operations that would have been achieved had the acquisition taken place as of January 1, 2009 and January 1, 2008.
(unaudited) Six months ended
USD million June 27, 2009 June 28, 2008 Net revenues 3,676 5,208 Net result (905) 33
Net revenues of the EMP business for the period from the acquisition date of February 3, 2009 to June 27, 2009 included in the consolidated statement of income were $128 million. Net income (loss) during this period is no longer separately identifiable, as the EMP business was immediately integrated across a large number of legal entities combining the cost structures of the EMP and ST-NXP Wireless businesses.
30
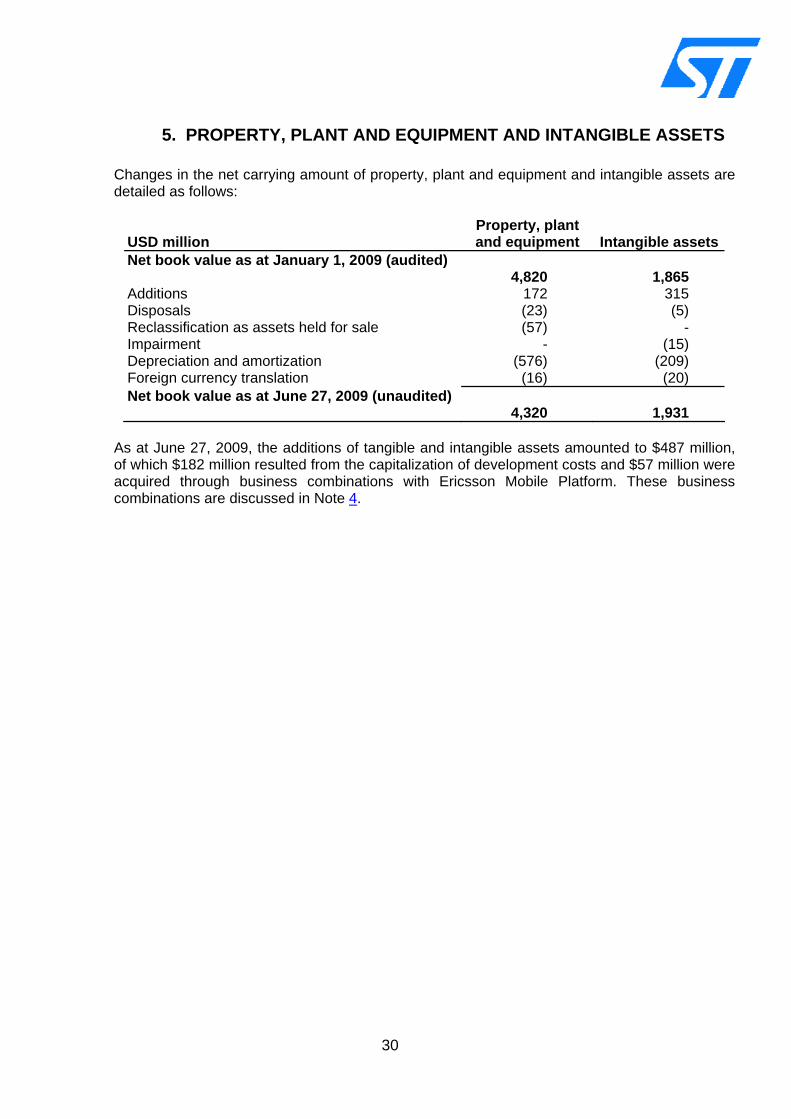
5. PROPERTY, PLANT AND EQUIPMENT AND INTANGIBLE ASSETS Changes in the net carrying amount of property, plant and equipment and intangible assets are detailed as follows:
USD million Property, plant and equipment Intangible assets
Net book value as at January 1, 2009 (audited) 4,820 1,865 Additions 172 315 Disposals (23) (5) Reclassification as assets held for sale (57) - Impairment - (15) Depreciation and amortization (576) (209) Foreign currency translation (16) (20) Net book value as at June 27, 2009 (unaudited) 4,320 1,931
As at June 27, 2009, the additions of tangible and intangible assets amounted to $487 million, of which $182 million resulted from the capitalization of development costs and $57 million were acquired through business combinations with Ericsson Mobile Platform. These business combinations are discussed in Note 4.
31
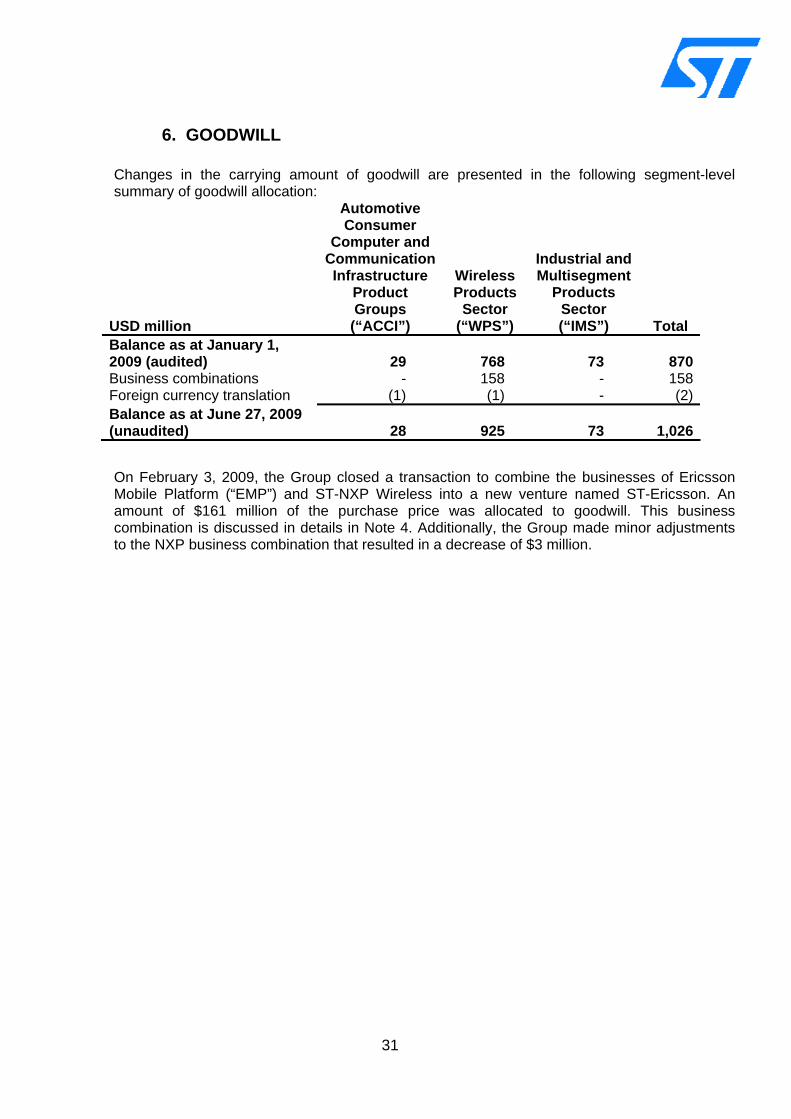
6. GOODWILL Changes in the carrying amount of goodwill are presented in the following segment-level summary of goodwill allocation:
USD million
Automotive Consumer
Computer and Communication Infrastructure
Product Groups
(“ACCI”)
Wireless Products
Sector (“WPS”)
Industrial and Multisegment
Products Sector (“IMS”) Total
Balance as at January 1, 2009 (audited) 29 768 73 870Business combinations - 158 - 158Foreign currency translation (1) (1) - (2)Balance as at June 27, 2009 (unaudited) 28 925 73 1,026
On February 3, 2009, the Group closed a transaction to combine the businesses of Ericsson Mobile Platform (“EMP”) and ST-NXP Wireless into a new venture named ST-Ericsson. An amount of $161 million of the purchase price was allocated to goodwill. This business combination is discussed in details in Note 4. Additionally, the Group made minor adjustments to the NXP business combination that resulted in a decrease of $3 million.
32
7. INVESTMENTS IN ASSOCIATES As at June 27, 2009, STMicroelectronics owns 48.6% of Numonyx Holdings B.V., ("Numonyx"), 50% less one controlling share of ST-Ericsson AT Holding (“JVD”), 41.2% of Veredus Laboratories Pte. Ltd ("Veredus") and 8.1% of ATLab Inc. (“Atlab”) and accounts for these investments in associates using the equity method. Numonyx Upon creation, Numonyx entered into financing arrangements for a $450 million term loan and a $100 million committed revolving credit facility from two primary financial institutions. The loans have a four-year term. Intel and STMicroelectronics have each granted in favor of Numonyx a 50% debt guarantee that is not joint and several. In the event of default and failure to repay the loans from Numonyx, the banks will exercise STMicroelectronics’s rights, subordinated to the repayment to senior lenders, to recover the amounts paid under the guarantee through the sale of the assets. The debt guarantee was evaluated under IAS 39 "Financial Instruments: Recognition and measurement". It resulted in the recognition of a $69 million liability, corresponding to the fair value of the guarantee at inception of the transaction. The same amount was also added to the value of our investment in Numonyx. The debt guarantee obligation is reported on the line “Other non-current liabilities” in the consolidated balance sheet as at June 27, 2009. The guarantee is being amortized on a pro-rata basis over its four-year term. As at June 27, 2009 the guarantee was not exercised and no provision was recorded as Numonyx is current on its debt obligations, is not in default of any debt covenants and is not expected to be in default on these obligations in the foreseeable future. In the accounting of Numonyx under the equity method, the Group applies a one-quarter lag reporting. Consequently, the amount reported on the line ‘share of loss of associates’ is the results of Numonyx for the fourth quarter of 2008 and the first quarter of 2009 that amounted to $100 million. Numonyx had no transaction in the three months ended June 27, 2009 that would require an adjustment for STMicroelectronics’s results. The amount reported on the line ‘share of loss of associates’ also reflects a reduction of depreciation charges totaling of $50 million related to amortization of basis differences arising principally from impairment charges recorded by the Group in prior periods. Additionally, due to the deterioration of both the global economic situation and the Memory market segment, as well as Numonyx’s current and projected results, STMicroelectronics re-assessed the fair value of its investment and recorded a $215 million impairment charge on the line ‘Impairment on investments in associates’ in the statement of income for the six months period ended June 27, 2009. At June 27, 2009 the Group’s investment in Numonyx, including the amount of the debt guarantee, amounted to $230 million. ST-Ericsson AT Holding On February 3, 2009, the Group announced the closing of a transaction to combine the businesses of Ericsson Mobile Platform (‘EMP’) and ST-NXP Wireless into a new venture, ST-Ericsson. As part of the transaction, the Group received an interest in ST-Ericsson AT Holding AG (‘JVD’). JVD, in which the Group owns 50% less a controlling share, is held by Ericsson, and is the parent company of a group of entities that perform fundamental R&D activities for the ST-Ericsson venture. The Group reviewed the extent of its control over JVD in light of IAS27A and IAS 28 and determined that it had significant influence. As a result, JVD is considered as an associate and valued under the equity method. The Group’s investment in JVD at the date of the transaction was valued at $99 million. In the six months ended June 27, 2009, the line ‘Share of loss of associates’ included a charge of $15 million related to JVD, taking into account the amortization of the basis difference. The Group’s current maximum exposure to loss as a result of its involvement with JVD is limited to its investment, which is shown at $84 million on the consolidated balance sheet as at June 27, 2009.
33
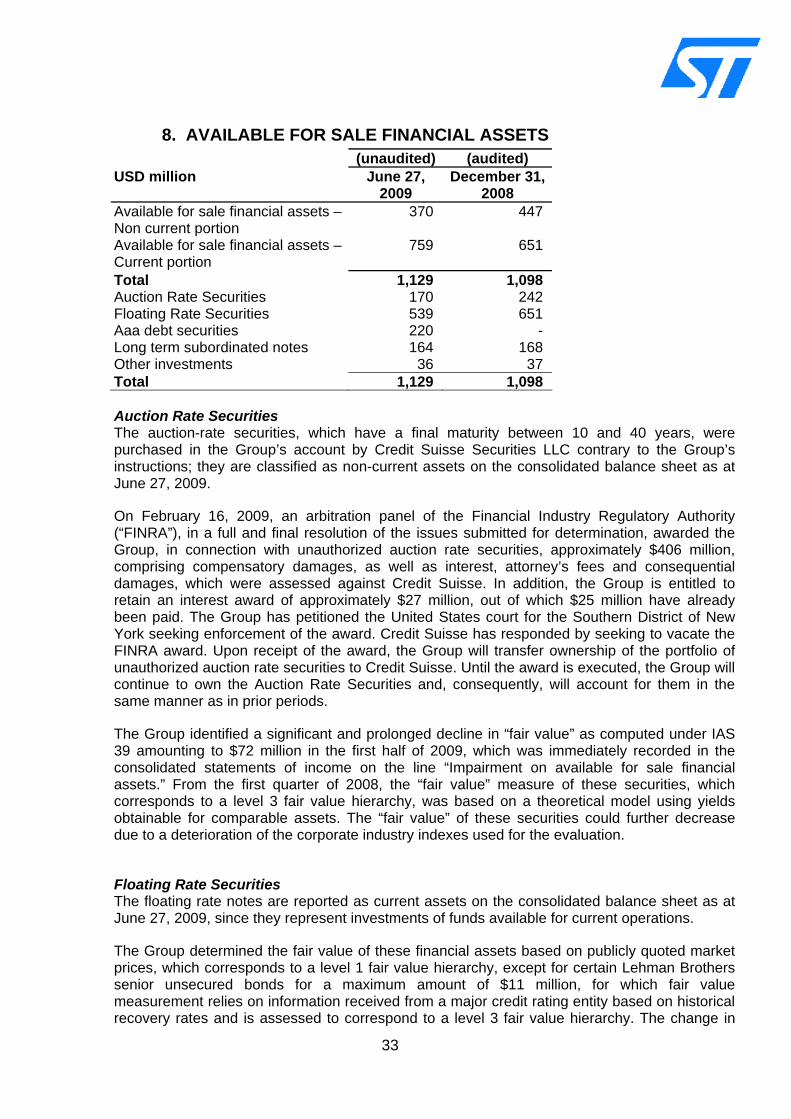
8. AVAILABLE FOR SALE FINANCIAL ASSETS (unaudited) (audited) USD million June 27,
2009 December 31,
2008 Available for sale financial assets – Non current portion
370 447
Available for sale financial assets – Current portion
759 651
Total 1,129 1,098 Auction Rate Securities 170 242 Floating Rate Securities 539 651 Aaa debt securities 220 - Long term subordinated notes 164 168 Other investments 36 37 Total 1,129 1,098 Auction Rate Securities The auction-rate securities, which have a final maturity between 10 and 40 years, were purchased in the Group’s account by Credit Suisse Securities LLC contrary to the Group’s instructions; they are classified as non-current assets on the consolidated balance sheet as at June 27, 2009.
On February 16, 2009, an arbitration panel of the Financial Industry Regulatory Authority (“FINRA”), in a full and final resolution of the issues submitted for determination, awarded the Group, in connection with unauthorized auction rate securities, approximately $406 million, comprising compensatory damages, as well as interest, attorney’s fees and consequential damages, which were assessed against Credit Suisse. In addition, the Group is entitled to retain an interest award of approximately $27 million, out of which $25 million have already been paid. The Group has petitioned the United States court for the Southern District of New York seeking enforcement of the award. Credit Suisse has responded by seeking to vacate the FINRA award. Upon receipt of the award, the Group will transfer ownership of the portfolio of unauthorized auction rate securities to Credit Suisse. Until the award is executed, the Group will continue to own the Auction Rate Securities and, consequently, will account for them in the same manner as in prior periods.
The Group identified a significant and prolonged decline in “fair value” as computed under IAS 39 amounting to $72 million in the first half of 2009, which was immediately recorded in the consolidated statements of income on the line “Impairment on available for sale financial assets.” From the first quarter of 2008, the “fair value” measure of these securities, which corresponds to a level 3 fair value hierarchy, was based on a theoretical model using yields obtainable for comparable assets. The “fair value” of these securities could further decrease due to a deterioration of the corporate industry indexes used for the evaluation.
Floating Rate Securities The floating rate notes are reported as current assets on the consolidated balance sheet as at June 27, 2009, since they represent investments of funds available for current operations.
The Group determined the fair value of these financial assets based on publicly quoted market prices, which corresponds to a level 1 fair value hierarchy, except for certain Lehman Brothers senior unsecured bonds for a maximum amount of $11 million, for which fair value measurement relies on information received from a major credit rating entity based on historical recovery rates and is assessed to correspond to a level 3 fair value hierarchy. The change in
34
fair value was recognized as a separate component in the statement of comprehensive income since the Group assessed that this decline in fair value was temporary and that the Group was in a position to recover the total carrying amount of these investments on subsequent periods. Since the duration of the floating-rate note portfolio is only 2.2 years on average and the securities have a minimum Moody’s rating of A3 (except for certain Lehman Brothers senior unsecured bonds), the Group expects the value of the securities to return to par as the final maturity is approaching. The Group sold $108 million of floating rate notes in the first half of 2009. No significant gain or loss was included in earnings as a result of these sales, as reported in the consolidated statement of income for the first half of 2009. Aaa debt securities The Aaa debt securities correspond to government bonds and are reported as current assets on the consolidated balance sheet as at June 27, 2009, since they represent investments of funds available for current operations.
The Group invested in 2009 $890 million in French and U.S. government bonds, of which $684 million was sold in the first half of 2009. The change in fair value of the $220 million debt securities classified as available-for-sale was not material as at June 27, 2009. The Group estimated the fair value of these financial assets based on publicly quoted market prices, which corresponds to a level 1 fair value hierarchy. The duration of the government bonds portfolio is less than 2 months on average and the securities are rated Aaa by Moody’s.
9. LONG-TERM LOANS AND RECEIVABLES Long-term loans and receivables decreased by $87 million during the first half of 2009 to reach an amount of $326 million. The decrease is entirely attributable to the collection of long-term receivables from government agencies for research tax credits.
10. INVENTORIES Inventories, net of reserve, consisted of the following:
(unaudited) (audited) USD million June 27,
2009 December 31,
2008 Raw materials 72 76 Work-in-process 952 1,125 Finished products 426 640 Total 1,450 1,841
The decrease in level of inventories during the first semester 2009 is a direct result of actions taken by the Group to mitigate the impact of market conditions on cash flows.
35
11. ASSETS HELD FOR SALE The Group had committed in the third quarter of 2007 to a restructuring plan, aimed at redefining the Group’s manufacturing strategy in order to be more competitive in the semiconductor market. This manufacturing plan is pursuing, among other initiatives, the transfer of 150-mm production from Carrollton (Texas) to Asia, the transfer of 200-mm production from Phoenix (Arizona) to Europe and Asia and the restructuring of the manufacturing operations in Morocco with a progressive phase out of the activities in Ain Sebaa site. In April 2009, the Group has completed the phase-out of manufacturing operations in Ain Sebaa and Carrollton.
In the first half of 2009, upon the completion of all production and the receipt of certain offers by third parties, the Group plans to sell its Carrollton facilities. In accordance with IFRS 5 Non Current Assets Held for Sale and Discontinued Operations, the Group reclassified the assets of its manufacturing site in Carrollton as Held for sale and incurred impairment charges related to their disposal. The carrying value of the assets to be sold totaled $51 million at the date of the reclassification, while fair value less costs to sell amounted to approximately $30 million, which generated in the first half of 2009 an impairment charge of $21 million. Fair value less costs to sell was based on the consideration to be received upon the sale, which is expected to occur within one year. In the first half of 2009, the Group also recorded impairment charges totaling $4 million on long-lived assets of the Group’s manufacturing site in Phoenix (Arizona), for which no alternative future use existed within the Group and which were also classified as assets held for sale. The carrying value of those assets to be disposed of by sale totaled $6 million at the date of the reclassification, while fair value less costs to sell amounted to $2 million.
36
12. SHAREHOLDERS EQUITY
a) DIVIDENDS At the Annual General Meeting of Shareholders on May 14, 2008 shareholders approved the distribution of $0.36 per share in cash dividends, payable in four equal quarterly installments. Through December 31, 2008, payments totaled $0.27 per share or approximately $240 million. The remaining $0.09 per share cash dividend was paid in the first half of 2009 for a total amount of $79 million, including the payment of $8 million for related withholding tax. At the Group’s annual general meeting of shareholders held on May 20, 2009, the distribution of a cash dividend of $0.12 per common share to be paid in four quarterly installments was approved by the shareholders of the Group. First payment occurred in the second quarter of 2009 and amounted to $26 million.
b) TREASURY SHARES Following the authorization by the Supervisory Board, announced on April 2, 2008, to repurchase up to 30 million shares of its common stock, the Group acquired in 2008 29,520,220 shares, for a total amount of approximately $313 million, of which $83 million was paid in the first half of 2008, also reflected at cost as a reduction of the shareholders’ equity. This repurchase intends to cover the transfer of shares to employees upon vesting of future share based remuneration programs.
The treasury shares have been designated for allocation under the Group’s share based remuneration programs of non-vested shares including such plans as approved by the 2005, 2006, 2007 and 2008 Annual General Meeting of Shareholders. As of June 27, 2009, 10,893,654 treasury shares were transferred to employees under the Group’s share based remuneration programs of which 4,003,906 in the first half of 2009.
As of June 27, 2009, the Group owned a number of treasury shares equivalent to 32,026,566.
37
13. LONG TERM DEBT (unaudited) (audited)
USD million June 27, 2009
December 31,2008
Bank loans: 2.10% due 2009, floating interest rate at Libor + 0.40% 50 50 2.56% due 2010, floating interest rate at Libor + 1.00% 45 50 Funding program loans: 2.00% (weighted average), due 2009, fixed interest rate 1 4 0.90% (weighted average), due 2010, fixed interest rate 18 24 3.28% (weighted average), due 2012, fixed interest rate 8 10 0.50% (weighted average), due 2013, fixed interest rate 3 2 0.50% (weighted average), due 2014, fixed interest rate 8 10 3.24% (weighted average), due 2017, fixed interest rate 65 72 0.63% due 2014, floating interest rate at Libor + 0.017% 120 120 1.12% due 2015, floating interest rate at Libor + 0.026% 65 65 1.08% due 2016, floating interest rate at Libor + 0.052% 136 136 1.55% due 2016, floating interest rate at Libor + 0.277% 180 180 1.23% due 2016, floating interest rate at Libor + 0.173% 200 200 Finance leases: 5.4% (weighted average), due 2011, fixed interest rate...... 13 15 5.00% due 2013, fixed interest rate..................................... 70 78 Senior Bonds: 1.66%, due 2013, floating interest rate at EURIBOR + 0.40% 705 703 Convertible bonds 4.92% liability component of 2016 convertible bond 823 822 Total long-term debt 2,510 2,541 Less current portion (189) (138) Total long-term debt, less current portion 2,321 2,403 The liability component of the 2016 convertible bond bears interests at an effective interest rate of 4.92%. In the first half of 2009, the Group recomputed the amount of interests and consequently recorded a cumulative positive adjustment since issuance of $19 million impacting the lines “Finance costs” in the statement of income and “Long-term debt” in the balance sheet.
38
14. OTHER NON CURRENT LIABILITIES Other non-current liabilities consist of the following: (unaudited) (audited)
USD million June 27, 2009
December 31, 2008
Share conversion option of convertible debt 2016 278 274 Debt financial guarantees 65 73 Capacity rights (non current portion) 55 63 Seniority awards 32 30 Other non-current liabilities 57 60 Total 487 500
15. FAIR VALUE MEASUREMENT As at June 27, 2009, the Group held the following financial instruments measured at fair value: (unaudited) USD million June 27,
2009 Level 12 Level 23 Level 34
Cash flow hedges Receivables 25 25 - - Payables - - - - Financial assets at fair value through profit or loss
Trading derivatives 38 38 - - Available for sale financial assets Aaa debt securities issued by U.S. Treasury 220 220 - -
Auction rate securities 170 - - 170 Floating rate notes 539 528 11 Long-term subordinated notes 164 - - 164 Other investments 36 5 - 31 Financial liabilities at fair value through profit or loss
Trading derivatives 1 1 - - During the six months ended June 27, 2009, there has been no transfer between Level 1 and Level 2 fair value measurements, and no transfers into and out of Level 3 fair value measurements. 2 Quoted prices (unadjusted) in active markets for identical assets or liabilities 3 Inputs other than quoted prices included within Level 1 that are observable for the asset or liability,
either directly (ie as prices) or indirectly (ie derived from prices) 4 Inputs for the asset or liability that are not based on observable market data (unobservable inputs)
39
16. OTHER INCOME / OTHER EXPENSES USD million Other
income Other expenses
Six months ended June 28, 2008 (unaudited) 82 (23) Increase in R&D funding programs 87 - Increase in phase-out costs - (27) Others 7 (12) Six months ended June 27, 2009 (unaudited) 176 (62) Other income increased by $94 million during the first half of 2009 compared to the same period in 2008. The increase is mainly related to Research & Development funding programs. R&D funding income is associated with R&D projects conducted by the Group, which, upon project approval, qualify as funding on the basis of contracts with local government agencies. For the six months ended June 27, 2009, R&D funding was significantly higher than in comparable previous periods as a result of a new program in France which was entered into during the first quarter of 2009 and covers a time period beginning retroactively in 2008. Other expenses increased by $39 million during the six months ended June 27, 2009 compared with the six months ended June 28, 2008. The increase is mainly attributable to phase-out costs associated with the closure of our facilities in Carrollton (Texas) and Ain Sebaa (Morocco).
40
17. RESTRUCTURING In the first six months of 2009, a total charge of $111 million was recorded as a result of restructuring projects, including related asset impairments .
The total restructuring program charges in the first six months of 2009 and 2008 are presented by classification as follows:
(unaudited) Six months ended
USD million June 27, 2009
June 28, 2008
STMicroelectronics NV Cost of Sales 53 33 Selling General and Administrative Expenses 7 8 Research and Development 27 4 Impairment on assets held for sale 25 204 Total operating income by classification 111 249 Of which : ST-Ericsson Cost of Sales 3 - Selling General and Administrative Expenses 1 - Research and Development 18 - Total operating income by classification 22 -
The impairment on assets held for sale relates to the closure of the Carrollton facility in the United States.
During the first half of 2009, the Group incurred restructuring charges related principally to the manufacturing plan committed to by the Group in 2007 (the “2007 restructuring plan”) and restructuring initiatives undertaken in 2009, including the new plan announced in April 2009 by ST-Ericsson, to be completed by the second quarter of 2010 (the “STE restructuring plan”). The main actions included in the restructuring plan are a re-alignment of product roadmaps to create a more agile and cost-efficient R&D organization and a reduction in workforce of 1,200 worldwide to reflect further integration activities following the merger. The Group recorded restructuring charges totaling $22 million pursuant to the announcement of the STE restructuring plan as described above, which mainly related to on-going termination benefits for involuntary leaves pursuant to the closure of certain locations in Europe and the Unites States of America.
41
18. EXPENSES BY NATURE Expenses recorded as cost of sales and operating expenses other than “impairment, restructuring charges and other related closure costs” and “other income and expenses” are detailed as follows: (unaudited) Six months ended
USD million June 27,2009
June 28, 2008
Depreciation and amortization 785 722 Employee benefit expense 1,544 1,812 Purchase of materials and subcontracting services 1,373 1,811 Changes in inventories 368 (184) Transportation 53 66 Royalties and patents 46 59 Advertising costs 7 6 Other expenses 290 339 Total cost of sales, research and development, and selling, general and administrative expenses. 4,466 4,631
Employee benefit expense is detailed as follows: (unaudited) Six months ended
USD million June 27,2009
June 28, 2008
Wages and salaries 1,171 1,378 Compensation of Sole Member of the Managing Board 1 1 Social security costs 312 376 Stock-based compensation expense 38 36 Pension cost 22 21 Total employee benefit expense included in cost of sales, research and development, and selling, general and administrative expenses
1,544 1,812
(unaudited) Six months ended
USD million June 27,2009
June 28, 2008
Cost of sales 589 808 Selling, general and administrative 350 401 Research and development 605 603 Total employee benefit expense included in cost of sales, research and development, and selling, general and administrative expenses
1,544 1,812
42
19. CASH GENERATED FROM OPERATIONS Cash generated from operations is detailed as follows: (unaudited) Six months ended
USD million June 27,2009
June 28, 2008
Net result (923) 53 Depreciation and amortization 785 722 Amortization of discount of convertible debt 8 9 Impairment on financial assets 72 69 Gain on financial assets 8 - Other non-cash items 8 21 Income tax (7) 6 Share of loss of associates and impairment on
investments in associates 282 5
Impairment on assets held for sale, goodwill and other investments
(65) 222
Trade receivables, net (165) 164 Inventories, net 368 (179) Trade payables 18 144 Other assets and liabilities, net (89) (179) Cash generated from operations 300 1,057
43
20. EARNINGS / (LOSS) PER SHARE For the periods ended June 27, 2009 and June 28, 2008, earnings / (loss) per share (“EPS”) were calculated as follows: (unaudited) Six months ended
USD million except per share amounts June 27, 2009
June 28, 2008
Basic EPS Net result attributable to shareholders of STMicroelectronics (790) 50
Weighted average shares outstanding 875,473,813 900,129,990 Basic EPS (0.90) 0.06 Diluted EPS Net result attributable to shareholders of STMicroelectronics (790) 50
Weighted average shares outstanding 875,473,813 900,129,990 Dilutive effect of non vested shares - 2,007,538 Dilutive effect of convertible bonds - 74,936 Number of shares used in calculating diluted EPS 875,473,813 902,212,464
Diluted EPS (0.90) 0.06 As at June 27, 2009, common shares issued were 910,319,305 shares, of which 32,026,566 shares were owned by the Group as treasury shares. As at June 27, 2009, there were outstanding stock options exercisable into the equivalent of 38,784,264 common shares. There was also the equivalent of 42,699,840 common shares outstanding for convertible debt, out of which 5,624 for 2013 bonds and 42,694,216 for the 2016 bonds. None of these bonds have been converted to shares during the six months ended June 27, 2009.
21. CONTINGENT LIABILITIES STMicroelectronics has issued guarantees totaling $525 million related to its associates’ debt, which is comprised of the $250 million ten-year debt guarantee issued for the joint venture with Hynix that was contributed to Numonyx and the $275 million 50% debt guarantee not joint and several granted in favor of Numonyx, which entered into financing arrangements for a $450 million term loan and a $100 million committed revolving credit facility.
44
22. CLAIMS AND LEGAL PROCEEDINGS The Group has received and may in the future receive communications alleging possible infringements of third party intellectual property rights. Furthermore, the Group may become involved in costly litigation brought against the Group regarding patents, mask works, copyrights, trademarks or trade secrets. In the event that the outcome of any litigation is unfavorable to the Group, the Group may be required to license the underlying intellectual property right at economically unfavorable terms and conditions, and possibly pay damages for prior use, and/or face an injunction, all of which individually, or in the aggregate, could have a material adverse effect on the Group’s results of operations, cash flow or financial position, as well as impair its ability to compete.
The Group is otherwise also involved in various lawsuits, claims, investigations and proceedings incidental to its business and operations. These matters mainly include the risks associated with claims from customers or other parties. The Group accrues for these loss contingencies when the loss is considered probable and can be estimated. The Group regularly evaluates claims and legal proceedings together with their related probable losses, to determine whether any accruals need to be made or adjusted based on the current information available to the Group. Legal costs associated with claims are expensed as incurred. In the event of litigation that is adversely determined with respect to the Group’s interests, or in the event, based on new evidence or communications the Group needs to change its evaluation regarding a third-party claim, this could entail a material adverse effect on its operations or financial condition at the time.
Based on management’s current assumptions made with support of the Group’s outside attorneys, the Group has not identified any probable loss, which may arise out of current litigation.
45
23. RELATED-PARTY TRANSACTIONS Transactions with significant shareholders, their affiliates and other related parties were as follow: (unaudited) Six months ended
USD million June 27, 2009
June 28, 2008
Sales & other services 149 157 Research and development expenses (112) (23) Other purchases (33) (146) Other income and expenses (19) (4) (unaudited) (audited) Six months ended Year ended
USD million June 27, 2009
December 31, 2008
Accounts receivable 129 63 Accounts payable (66) 65 Other assets (liabilities) (1) -
For the periods ended June 27, 2009 and June 28, 2008, the related party transactions were primarily with significant shareholders of STMicroelectronics, or their subsidiaries and companies in which members of the Supervisory Board of STMicroelectronics perform similar policy making functions. These include, but are not limited to: Areva, France Telecom, Equant, Orange, Finmeccanica, Cassa Depositi e Prestiti, Flextronics, Oracle, Thomson. The related party transactions presented in the table above also include transactions between STMicroelectronics and its associates as listed in Note 7.
46
V. Sole Member of the Managing Board’s statement (fair view) With reference to article 5.25d paragraph 2c of the Dutch Financial Supervision Act (“Wft”), the Sole Member of the Managing Board states that as far as he is aware, the interim condensed consolidated financial statements provided in this report provide a true and fair view of the assets, liabilities and the financial position on the balance sheet date as well as the profit for the first financial half-year of STMicroelectronics N.V. and the companies included jointly in the consolidation, and the notes to the interim condensed consolidated financial statements in this report provide a fair review of the information as required under article 5.25d paragraph 8 and 9 of the Financial Supervision Act (“Wft”). C. Bozotti, Sole Member of the Managing Board