
Stimulation of IL-2 Secretion in Human Lymphocytes
6
Stimulation of IL-2 Secretion in Human Lymphocytes Using the Lionheart LX Automated Microscope to Image and Analyze Silver-stained ELISPOT Assays A p p l i c a t i o n N o t e Biomarkers, Cellular Imaging BioTek Instruments, Inc. P.O. Box 998, Highland Park, Winooski, Vermont 05404-0998 USA Phone: 888-451-5171 Outside the USA: 802-655-4740 Email: [email protected] www.biotek.com Copyright © 2018 Paul Held, Ph.D., Lab Manager, Applications Department, BioTek Instruments, Inc., Winooski, VT USA Key Words: ELISPOT Cytokine Jurkat Cell Brightfield Silver Stain IL-2 Introduction Cytokines are small molecular weight proteins or peptides secreted by many cell types (particularly immune system cells) that regulate the duration and intensity of the immune response. The cytokine interleukin 2 (IL-2) is a pleiotropic cellular regulatory molecule that is produced by lymphoid cells in response to several stimuli. It plays a role in preventing autoimmune diseases by promoting differentiation of immature T cells into regulatory T cells [1] . In addition, it causes the differentiation of T cells into effector T cells and memory T cells when the original T cell was stimulated by an antigen [2] . T-cell activation is normally initiated by the interaction of a cell surface receptor to its specific ligand molecule along with a co-stimulatory molecule [3] . This binding event triggers the rapid hydrolysis of inositol phospholipids to diacylglycerol and inositol phosphates by phospholipase C (PLC). Diacylglycerol is an allosteric activator of protein kinase C (PKC) activation and inositol phosphates, which trigger Ca ++ release and mobilization, resulting in a cascade of additional cellular responses mediating T-cell activation. One of these cellular responses is the production and secretion of IL-2. Triptolide is a diterpene triepoxide, that is a potent immunosuppressant and anti-inflammatory agent. Triptolide has been shown to inhibit the expression of IL-2 in activated T cells at the level of purine-box/nuclear factor and NF-κB mediated transcription activation. (Figure 1). [4] While Jurkat cells are a leukemic T-cell line known to produce IL-2, under normal growth conditions little IL-2 is produced. Only after stimulation will substantial amounts of the cytokine be expressed [5] . Phytohemagglutinin (PHA) is a lectin that binds to the sugars on glycosylated surface proteins, including the T cell receptor (TCR), and nonspecifically binds them. The result is the low level stimulation of the signal cascade required for IL-2 secretion [6] . Likewise, Phorbol myristate acetate (PMA) is a small organic compound, which has a structure analogous to diacylglycerol, that diffuses through the cell membrane into the cytoplasm where it directly activates Protein Kinase C (PKC), Used in combination with Ionomycin, a calcium ionophore that triggers calcium release also results in producing a low level signal. However, when PMA and a co-stimulator, such as PHA, stimulate Jurkat cells IL-2 concurently, production is strongly enhanced [7] . The silver spot ELISPOT assay procedure is very similar to that of a conventional ELISPOT. The plates are first coated with the appropriate capture antibody. Cultured secreting cells Abstract Lymphocytes are used in several fields of research including autoimmune disorders, infectious diseases, vaccine development and hematological malignancies. The ELISPOT assay monitors ex-vivo cellular immune responses to antigenic stimuli. While the original ELISPOT assays used PVDF membrane plates, recently the assay format has developed to use a silver staining process that allows clear bottom plates to be utilized. Here we use the Lionheart™ LX Automated Microscope in conjunction with Gen5™ Microplate Reader and Imager Software to quantitate changes in IL-2 secretion in Jurkat cells using a silver-stain ELISPOT assay format. Figure 1. Schematic of signal cascade for Stimulation of IL-2 secretion.
Transcript of Stimulation of IL-2 Secretion in Human Lymphocytes

Stimulation of IL-2 Secretion in Human Lymphocytes Using the Lionheart LX Automated Microscope to Image and Analyze Silver-stained ELISPOT Assays
A p p l i c a t i o n N o t e
Biomarkers, Cellular Imaging
BioTek Instruments, Inc.P.O. Box 998, Highland Park, Winooski, Vermont 05404-0998 USAPhone: 888-451-5171 Outside the USA: 802-655-4740 Email: [email protected] www.biotek.comCopyright © 2018
Paul Held, Ph.D., Lab Manager, Applications Department, BioTek Instruments, Inc., Winooski, VT USA
Key Words:
ELISPOT
Cytokine
Jurkat Cell
Brightfield
Silver Stain
IL-2
Introduction Cytokines are small molecular weight proteins or peptides secreted by many cell types (particularly immune system cells) that regulate the duration and intensity of the immune response. The cytokine interleukin 2 (IL-2) is a pleiotropic cellular regulatory molecule that is produced by lymphoid cells in response to several stimuli. It plays a role in preventing autoimmune diseases by promoting differentiation of immature T cells into regulatory T cells[1]. In addition, it causes the differentiation of T cells into effector T cells and memory T cells when the original T cell was stimulated by an antigen[2].
T-cell activation is normally initiated by the interaction of a cell surface receptor to its specific ligand molecule along with a co-stimulatory molecule[3]. This binding event triggers the rapid hydrolysis of inositol phospholipids to diacylglycerol and inositol phosphates by phospholipase C (PLC).
Diacylglycerol is an allosteric activator of protein kinase C (PKC) activation and inositol phosphates, which trigger Ca++ release and mobilization, resulting in a cascade of additional cellular responses mediating T-cell activation. One of these cellular responses is the production and secretion of IL-2. Triptolide is a diterpene triepoxide, that is a potent immunosuppressant and anti-inflammatory agent. Triptolide has been shown to inhibit the expression of IL-2 in activated T cells at the level of purine-box/nuclear factor and NF-κB mediated transcription activation. (Figure 1).[4]
While Jurkat cells are a leukemic T-cell line known to produce IL-2, under normal growth conditions little IL-2 is produced. Only after stimulation will substantial amounts of the cytokine be expressed[5]. Phytohemagglutinin (PHA) is a lectin that binds to the sugars on glycosylated surface proteins, including the T cell receptor (TCR), and nonspecifically binds them. The result is the low level stimulation of the signal cascade required for IL-2 secretion[6]. Likewise, Phorbol myristate acetate (PMA) is a small organic compound, which has a structure analogous to diacylglycerol, that diffuses through the cell membrane into the cytoplasm where it directly activates Protein Kinase C (PKC), Used in combination with Ionomycin, a calcium ionophore that triggers calcium release also results in producing a low level signal. However, when PMA and a co-stimulator, such as PHA, stimulate Jurkat cells IL-2 concurently, production is strongly enhanced[7].
The silver spot ELISPOT assay procedure is very similar to that of a conventional ELISPOT. The plates are first coated with the appropriate capture antibody. Cultured secreting cells
Abstract
Lymphocytes are used in several fields of research including autoimmune disorders, infectious diseases, vaccine development and hematological malignancies. The ELISPOT assay monitors ex-vivo cellular immune responses to antigenic stimuli. While the original ELISPOT assays used PVDF membrane plates, recently the assay format has developed to use a silver staining process that allows clear bottom plates to be utilized. Here we use the Lionheart™ LX Automated Microscope in conjunction with Gen5™ Microplate Reader and Imager Software to quantitate changes in IL-2 secretion in Jurkat cells using a silver-stain ELISPOT assay format.
Figure 1. Schematic of signal cascade for Stimulation of IL-2 secretion.

2
Application Note Biomarkers, Cellular Imaging
are added to the wells along with any experimental mitogen or antigen. Cells are maintained for a period of time after which they are removed. The analyte remains bound to the capture antibodies in close proximity to the location on the plate where the cell that secreted the analyte was situated. After removal of the cells and any unbound materials, a biotinylated detection antibody is added followed by an enzyme conjugate with incubation to allow binding and wash to remove unbound materials after each. Spots are formed with a substrate that deposits silver on the plate bottom at the locations of the original analyte capture. The resultant spots are then analyzed/counted by image analysis (Figure 2).
Figure 2. ELISPOT silver stain Procedure.
The main difference between the ELISPOT assays used in this study is that the microplates use a transparent mem-brane, allowing inverted geometry microscopes to be used to quantify the silver spots. This allowed use of the Lionheart™ LX Automated Microscope.
Materials and Methods
Human IL-2 ELISPOT silver stain kit was obtained from U-CyTech biosciences (Utrecht, The Netherlands). Phorbol 12-myristate (PMA), cat # (P8139, and phytohemagglutin-L (PHA), cat#11249738001 and Triptolide (cat # XXXX) were purchased from Millipore-Sigma. Ionomycin (cat# 407952) was from EMD-Millipore. Jurkat cells (human lymphoma) were from ATCC.
Cell Culture
Jurkat cells were grown in RPMI-1640 plus 10% FBS supplemented with 2 mM glutamine, penicillin and strep-tomycin. The suspension cells were split 1:5 with fresh media every 2-3 days. For experiments, unless otherwise indicated cells were plated at a density of 1 × 10⁵/well in 96-well plates, previously coated with IL-2 antibody. Jurkat cells were stimulated to secrete IL-2 with a combi-nation of PMA (50 ng/mL), Ionomycin (1 µg/mL) and PHA (1 µg/mL).
Triptolide Inhibition
Jurkat cells were plated at 1 × 10⁵/well in 50 µL volume of complete RPMI media. After allowing cells to recover for 1 hour at 37 °C, in a humidified 5 % CO2 environment, triptolide treatment was added in complete RPMI media at 4x of final concentration to each well in 50 µL. After treating with triptolide for 1 hour, IL-2 stimuli mixture (2x) was added in 100 µL for a final volume of 200 µL. After stimulating for 24 h, plates were assayed using an ELISPOT kit.
ELISPOT Assay
A Human IL-2 ELISPOT kit from U-CyTech Biosciences was used for these experiments. The assays were per-formed according to the kit instructions. Briefly, the plates are first coated with the appropriate concentration of capture antibody and allowed to absorb overnight at 4 °C. The unbound antibody is aspirated and the plate is manually washed 3x with PBS. The wells are then filled with a blocking solution (200 µL) and allowed to incubate for at least 1 hour at room temperature. Cultured Jurkat cells are added to the wells along with any experimental mitogen or inhibitor in a total volume of 200 µL. Cells are maintained for a period of 24 hours after which they are removed by washing 6x with 250 µL PBS-Tween 0.05% using a MultiFlo™ FX Multi-Mode Dispenser. A bioti-nylated detection antibody (100 µL) is added to the well and allowed to incubate for 60 minutes at 37 °C, after which unbound detection antibody is removed by washing. A streptavidin-GABA conjugate is then added (100 µL) and incubated at 37 °C for 60 minutes. Again, unbound conjugate is removed by washing and two-part substrate is then added that deposits silver grains onto the well bottom. Reactions are halted after 60 minutes at RT by washing with deionized water (250 µL) 3x and allowed to dry. Entire wells were then imaged.
Plate Washing
Plates were washed according to the assay kit instructions using a MultiFlo™ FX Washer Dispenser (BioTek Instru-ments. Wash buffer consisted of PBS (NaCl 137 mM, KCl 2.7 mM, Na2HPO4 10 mM, KH2PO4 7.4 mM) supplement-ed with 0.05% Tween 20. Unless specifically indicated, plates were washed six times with 250 µL buffer per well.
3
Application Note Biomarkers, Cellular Imaging
Stitching
Parameter Value
Channel Brightfield
Size 4528 x 4158 (35.91 Mb)
Crop Edges Yes
Reduce Image 50%
Preprocessing
Parameter Value
Background Light
Flattening Auto
Rolling Ball Diameter 1430 µm
434 pixels
Image Smoothing 0
Spot Counting
Parameter Value
Channel Tsf[Stitched[Bright Field]]
Threshold
Value 15000
Background Light
Split Touching Obj Yes
Fill Holes in Masks Yes
Advanced Options
Parameter Value
Smoothing 0
Background 5% lowest pixels
Min. Object Selection 50 µm
Max. Object Selection 500 µm
Include edge obj Yes
Entire Image No (Disc Plug)
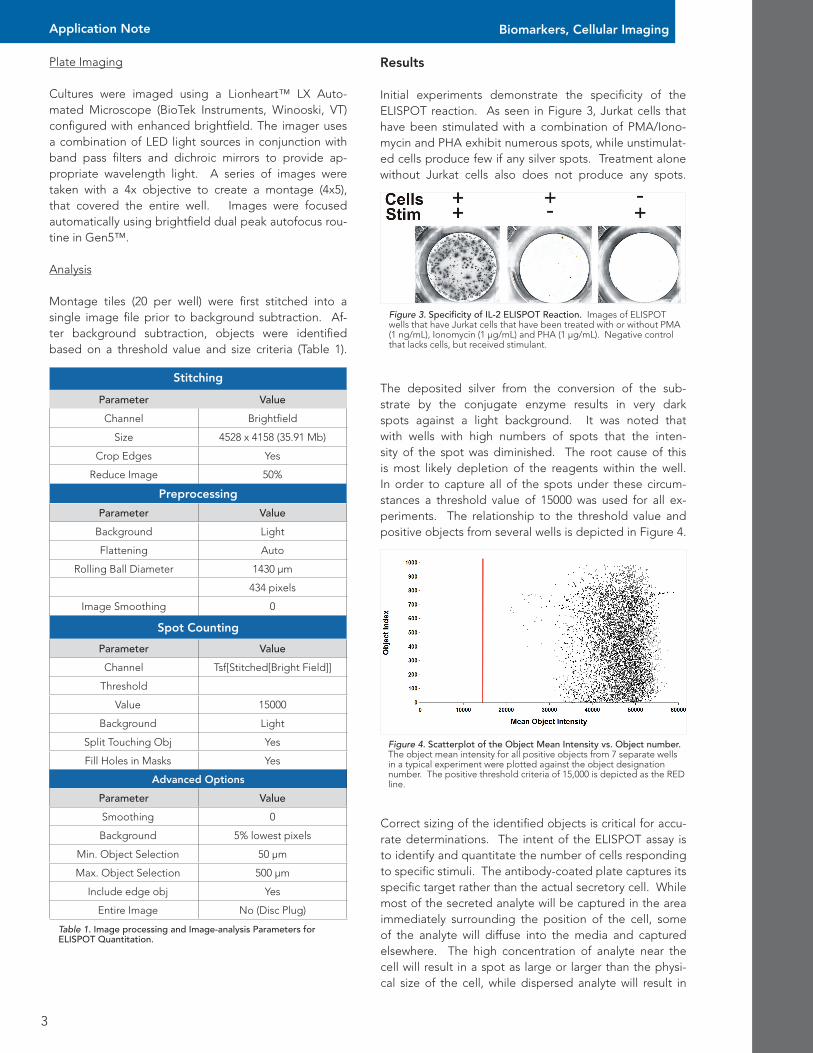
Table 1. Image processing and Image-analysis Parameters for ELISPOT Quantitation.
Plate Imaging
Cultures were imaged using a Lionheart™ LX Auto-mated Microscope (BioTek Instruments, Winooski, VT) configured with enhanced brightfield. The imager uses a combination of LED light sources in conjunction with band pass filters and dichroic mirrors to provide ap-propriate wavelength light. A series of images were taken with a 4x objective to create a montage (4x5), that covered the entire well. Images were focused automatically using brightfield dual peak autofocus rou-tine in Gen5™.
Analysis
Montage tiles (20 per well) were first stitched into a single image file prior to background subtraction. Af-ter background subtraction, objects were identified based on a threshold value and size criteria (Table 1).
Results
Initial experiments demonstrate the specificity of the ELISPOT reaction. As seen in Figure 3, Jurkat cells that have been stimulated with a combination of PMA/Iono-mycin and PHA exhibit numerous spots, while unstimulat-ed cells produce few if any silver spots. Treatment alone without Jurkat cells also does not produce any spots.
Figure 3. Specificity of IL-2 ELISPOT Reaction. Images of ELISPOT wells that have Jurkat cells that have been treated with or without PMA (1 ng/mL), Ionomycin (1 µg/mL) and PHA (1 µg/mL). Negative control that lacks cells, but received stimulant.
The deposited silver from the conversion of the sub-strate by the conjugate enzyme results in very dark spots against a light background. It was noted that with wells with high numbers of spots that the inten-sity of the spot was diminished. The root cause of this is most likely depletion of the reagents within the well. In order to capture all of the spots under these circum-stances a threshold value of 15000 was used for all ex-periments. The relationship to the threshold value and positive objects from several wells is depicted in Figure 4.
Figure 4. Scatterplot of the Object Mean Intensity vs. Object number.The object mean intensity for all positive objects from 7 separate wells in a typical experiment were plotted against the object designation number. The positive threshold criteria of 15,000 is depicted as the RED line.
Correct sizing of the identified objects is critical for accu-rate determinations. The intent of the ELISPOT assay is to identify and quantitate the number of cells responding to specific stimuli. The antibody-coated plate captures its specific target rather than the actual secretory cell. While most of the secreted analyte will be captured in the area immediately surrounding the position of the cell, some of the analyte will diffuse into the media and captured elsewhere. The high concentration of analyte near the cell will result in a spot as large or larger than the physi-cal size of the cell, while dispersed analyte will result in

4
Application Note Biomarkers, Cellular Imaging
very small silver deposits. Because the density of the deposited silver grains is very high, it is critical that the selected spots are sized appropriately. Figure 5 demon-strates the number of dense silver grains 1 µm or great-er present in a typical ELISPOT well. Only those spots exceeding 50 µm in size are designated as true spots.
Figure 5. Scatterplot of object size vs object number. All spots achieving a threshold of 15000 greater than 1 µm in size were plotted against their designation number. Spots designated as positive (size >50 µm) are indicated in RED.
The number of recorded spots produced from stimulat-ed cells is proportional to the number of secreting cells. When a titration of Jurkat cells are exposed to a fixed concentration of stimulant the number of counted spots is proportional to the cell number. As demonstrated in Figure 6, increasing numbers of cells in a well results in an increase in the number of spots counted. Cell counts above 20,000 per well resulted in the spots coalescing together. Subsequent experiments used 10,000 cells per well.
Figure 6. Jurkat Cell Titration. Jurkat cells were seeded at various concentration into an ELISPOT plate and stimulated with 50 ng/mL PMA, 1 µg/mL Ionomycin, and 30 µg/mL PHA for 24 hours. The ELISPOT plate was then assayed for IL-2 secretion. Data points represent the mean of 8 determinations.
Secretion of IL-2 following stimulation of Jurkat cells is time dependent. Virtually no spots are observed in the first two hours after stimulation. Maximum secre-tion, as determined by spot number, was observed after approximately 8-10 hours in the presence of the stimu-lant. Further exposure did not result in an increase in the number of observed spots (Figure 7).
Figure 7. The Effect of Stimulation Exposure time on IL-2 secretion. Jurkat cells were exposed to 50 ng/mL PMA, 1 µg/mL Ionomycin and 30 µg/mL PHA for various periods of time before being assayed for IL-2 secretion using a silver staining ELISPOT assay. Data points represent the mean of 6 determinations.
Stimulation of IL-2 secretion by a mixture of PMA, Ion-omycin and PHA is dose dependent. As observed in Figure 8, when a serial dilution of the compound mixture is used to stimulate IL-2 secretion, with increas-ing dilution (lower concentration) fewer spots are ob-served with the ELISPOT assay for IL-2.
Figure 8. Titration of Stimulate Mixture. Jurkat cells were stimulated with various dilutions of PMA/Ionomycin and PHA mixture for 24 hours in an ELISPOT plate coated with IL-2 antibody. Concentration is expressed as a percentage of the highest concentration (50 ng/mL PMA, 1 µg/mL Ionomycin, 30 µg/mL PHA). After stimulation IL-2 secretion was assessed and spots counted. Data points represent the mean of 6 determinations.
5
Application Note Biomarkers, Cellular Imaging
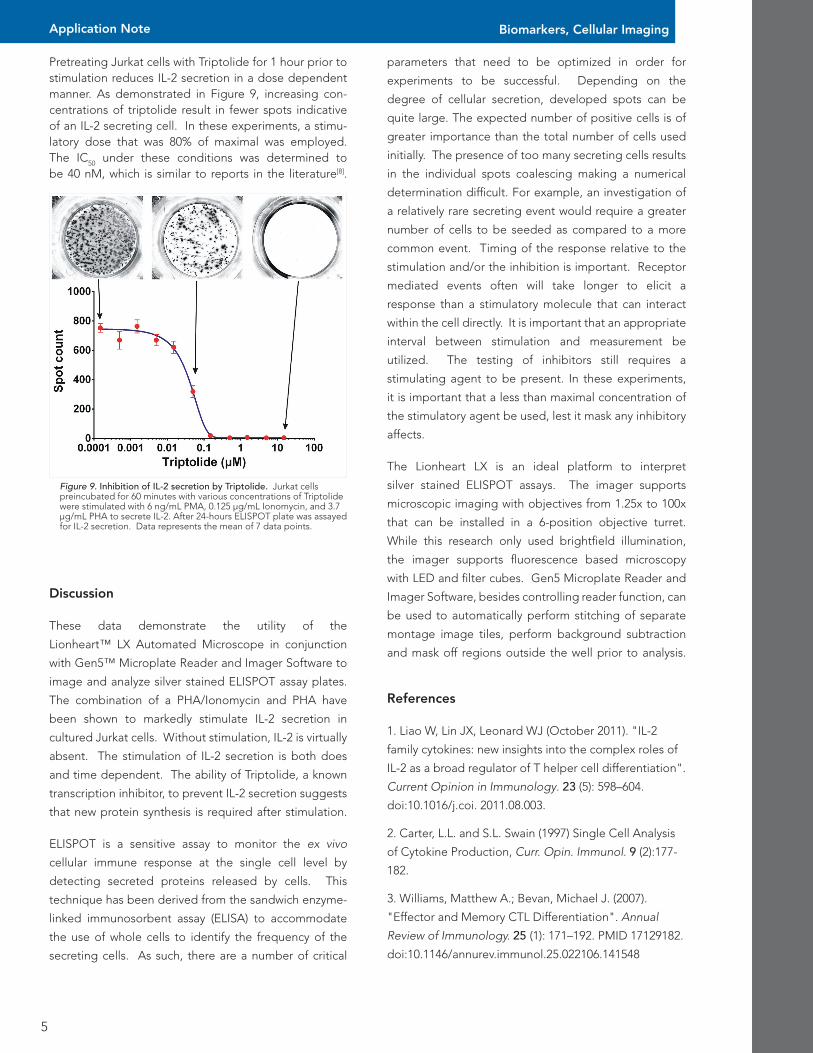
Pretreating Jurkat cells with Triptolide for 1 hour prior to stimulation reduces IL-2 secretion in a dose dependent manner. As demonstrated in Figure 9, increasing con-centrations of triptolide result in fewer spots indicative of an IL-2 secreting cell. In these experiments, a stimu-latory dose that was 80% of maximal was employed. The IC50 under these conditions was determined to be 40 nM, which is similar to reports in the literature[8].
Discussion
These data demonstrate the utility of the
Lionheart™ LX Automated Microscope in conjunction
with Gen5™ Microplate Reader and Imager Software to
image and analyze silver stained ELISPOT assay plates.
The combination of a PHA/Ionomycin and PHA have
been shown to markedly stimulate IL-2 secretion in
cultured Jurkat cells. Without stimulation, IL-2 is virtually
absent. The stimulation of IL-2 secretion is both does
and time dependent. The ability of Triptolide, a known
transcription inhibitor, to prevent IL-2 secretion suggests
that new protein synthesis is required after stimulation.
ELISPOT is a sensitive assay to monitor the ex vivo
cellular immune response at the single cell level by
detecting secreted proteins released by cells. This
technique has been derived from the sandwich enzyme-
linked immunosorbent assay (ELISA) to accommodate
the use of whole cells to identify the frequency of the
secreting cells. As such, there are a number of critical
References
1. Liao W, Lin JX, Leonard WJ (October 2011). "IL-2
family cytokines: new insights into the complex roles of
IL-2 as a broad regulator of T helper cell differentiation".
Current Opinion in Immunology. 23 (5): 598–604.
doi:10.1016/j.coi. 2011.08.003.
2. Carter, L.L. and S.L. Swain (1997) Single Cell Analysis
of Cytokine Production, Curr. Opin. Immunol. 9 (2):177-
182.
3. Williams, Matthew A.; Bevan, Michael J. (2007).
"Effector and Memory CTL Differentiation". Annual
Review of Immunology. 25 (1): 171–192. PMID 17129182.
doi:10.1146/annurev.immunol.25.022106.141548
Figure 9. Inhibition of IL-2 secretion by Triptolide. Jurkat cells preincubated for 60 minutes with various concentrations of Triptolide were stimulated with 6 ng/mL PMA, 0.125 µg/mL Ionomycin, and 3.7 µg/mL PHA to secrete IL-2. After 24-hours ELISPOT plate was assayed for IL-2 secretion. Data represents the mean of 7 data points.
parameters that need to be optimized in order for
experiments to be successful. Depending on the
degree of cellular secretion, developed spots can be
quite large. The expected number of positive cells is of
greater importance than the total number of cells used
initially. The presence of too many secreting cells results
in the individual spots coalescing making a numerical
determination difficult. For example, an investigation of
a relatively rare secreting event would require a greater
number of cells to be seeded as compared to a more
common event. Timing of the response relative to the
stimulation and/or the inhibition is important. Receptor
mediated events often will take longer to elicit a
response than a stimulatory molecule that can interact
within the cell directly. It is important that an appropriate
interval between stimulation and measurement be
utilized. The testing of inhibitors still requires a
stimulating agent to be present. In these experiments,
it is important that a less than maximal concentration of
the stimulatory agent be used, lest it mask any inhibitory
affects.
The Lionheart LX is an ideal platform to interpret
silver stained ELISPOT assays. The imager supports
microscopic imaging with objectives from 1.25x to 100x
that can be installed in a 6-position objective turret.
While this research only used brightfield illumination,
the imager supports fluorescence based microscopy
with LED and filter cubes. Gen5 Microplate Reader and
Imager Software, besides controlling reader function, can
be used to automatically perform stitching of separate
montage image tiles, perform background subtraction
and mask off regions outside the well prior to analysis.

6
Application Note Biomarkers, Cellular Imaging
AN032018_01, Rev. 03/20/18
4. Qiu, D., G.Z. Zhao, Y.Aoki, L.Shi, A. Uyei,S. Nazarian,
J.C.-H. Ng, P. Kao (1999) Immunosuppressant PG490
(Triptolide) Inhibits T-cell Interleukin-2 Expression at the
Level of Purine-box/Nuclear Factor of Activated T-cells
and NF-kB Transcriptional Activation, J. Biol. Chem.
274 (19):13443-13450 PMID:10224109
5. Weiss, A., R.L. Wiskocil, and J.D. Stobo (1984) The
role of T3 surface receptors in the activation of human
T cells: a two stimulus requirement for IL-2 production
reflects events occurring at a pre-translational level, J.
Immunology 133:123-128. PMID:6327821
6. Chen, L., and D.B. Flies (2013) Molecular mechanisms
of T cell co-stimulation and co-inhibition, Nat. Rev.
Immunology 13 (4):227-242. doi: 10.1038/nri3405.
7. Manger, B., K.J. Hardy, A. Weiss, and J.D. Stobo
(1986) Differential effect of Cyclosporine A on activation
signaling in human T cell lines.
8. McCallum, C., S. Kwon, P. Leavitt et al. (2005) In
vitro versus in vivo effects of triptolide: the role of
transcriptional inhibition, Therapy 2 (2):261-273 ISSN
2044-9038.


![Neurotransmitter and neuropeptide regulation of mast cell ......triene B4 or TNF-α secretion, and nicotinic acetylcholine receptor antagonists blocked cholinergic stimulation [18].](https://static.fdocuments.net/doc/165x107/61297cd3ffa07a7e800de298/neurotransmitter-and-neuropeptide-regulation-of-mast-cell-triene-b4-or-tnf-.jpg)
