Sticky Data and Superstitious Patterns: Visualization beyond Cognitivism
59
Sticky Data and Superstitious Patterns: Visualization beyond Cognitivism Dietmar Offenhuber, PhD Northeastern University @dietoff offenhuber.net | northeastern.edu/visualization
-
Upload
dietmar-offenhuber -
Category
Data & Analytics
-
view
456 -
download
0
Transcript of Sticky Data and Superstitious Patterns: Visualization beyond Cognitivism

Sticky Data and Superstitious Patterns: Visualization beyond Cognitivism
Dietmar Offenhuber, PhD Northeastern University @dietoff offenhuber.net | northeastern.edu/visualization

Seeing as Thinking
"My contention is that the cognitive operations called thinking are not the privilege of mental processes above and beyond perception but the essential ingredients of perception itself. I am referring to such operations as active exploration, selection, grasping of essentials, simplification, abstraction, analysis and synthesis, completion, correction, comparison, problem solving, as well as combining, separating, putting in context.
There is no basic difference in this respect between what happens when a person looks at the world directly and when he sits with his eyes closed and ‘thinks’."
Rudolf Arnheim, Visual Thinking, 1969
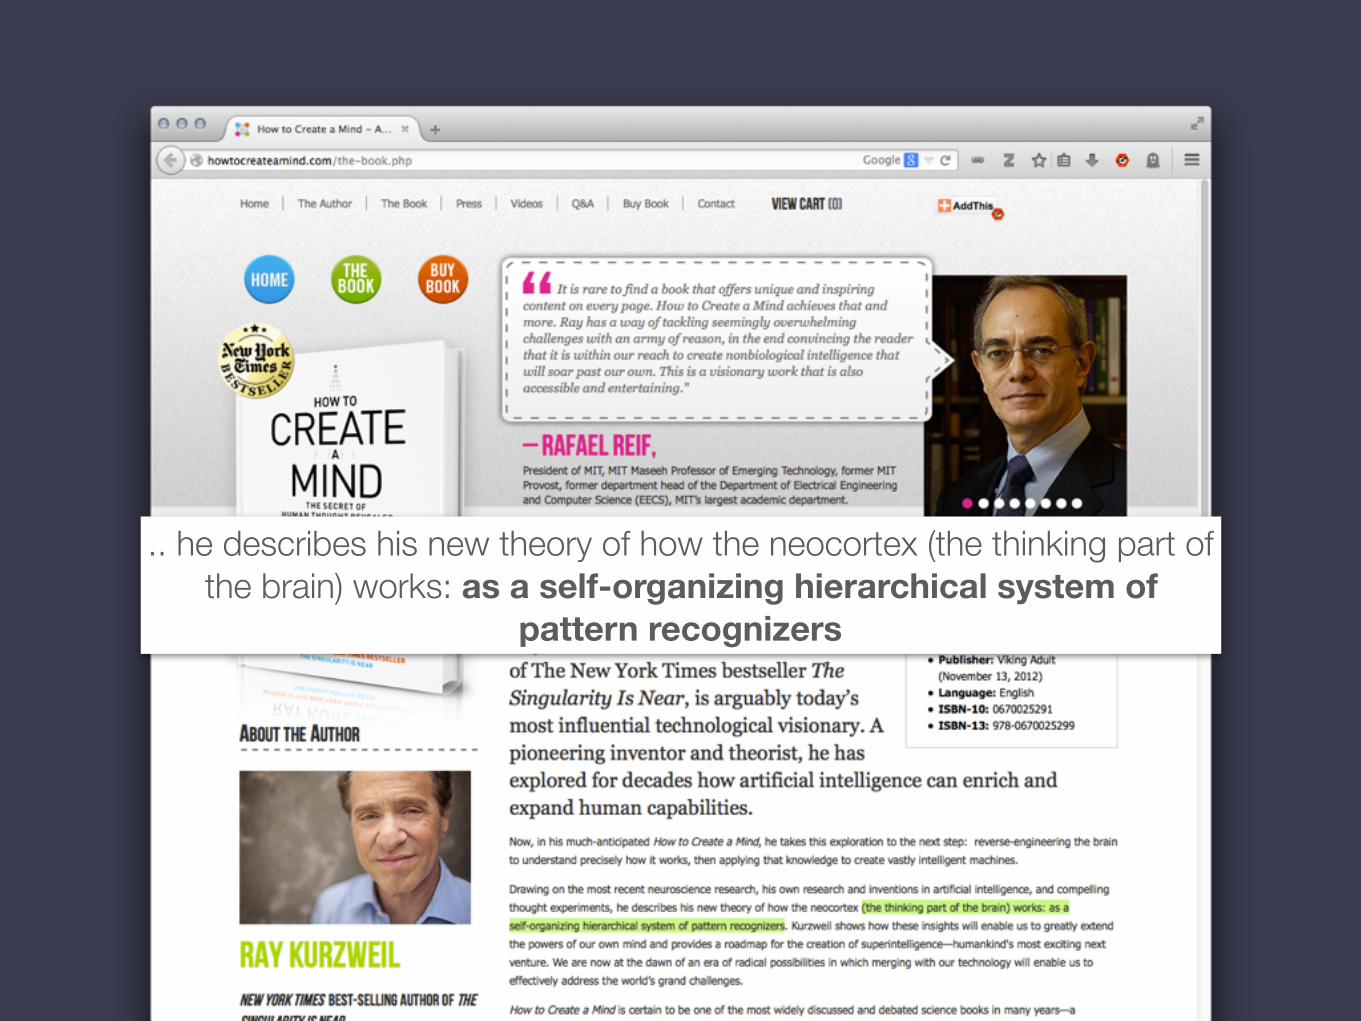
.. he describes his new theory of how the neocortex (the thinking part of the brain) works: as a self-organizing hierarchical system of
pattern recognizers

“A decade-old toasted cheese sandwich said to bear an image of the Virgin Mary has sold on the eBay auction website for $28,000.”
BBC news, Nov. 23, 2004

Gizmodo - iPhoto Discovers Face in Delicious Chocolate Chip Cookie Dough

Riegler, Alexander. 2007. “Superstition in the Machine.” In Anticipatory Behavior in Adaptive Learning
Systems, edited by Martin V. Butz, Olivier Sigaud, Giovanni Pezzulo, and Gianluca Baldassarre,
4520:57–72. Berlin, Heidelberg: Springer.
“Under normal conditions, humans construct information
rather than process it. […] When it fails, cognition
switches to pattern processing.
There is a close relationship between pattern discovery
and superstition, since humans and animals alike excel at
finding structures where there are none.” — Alexander Riegler


Gregor Aisch, 2011

Accountability Technologies
collecting data
coordinating volunteers
spreading the message
Guttenplag activity, visualization: User8, reproduced in:
Offenhuber, Dietmar, and Katja Schechtner, eds. 2013. Accountability Technologies - Tools for Asking Hard Questions. Vienna: Ambra V.
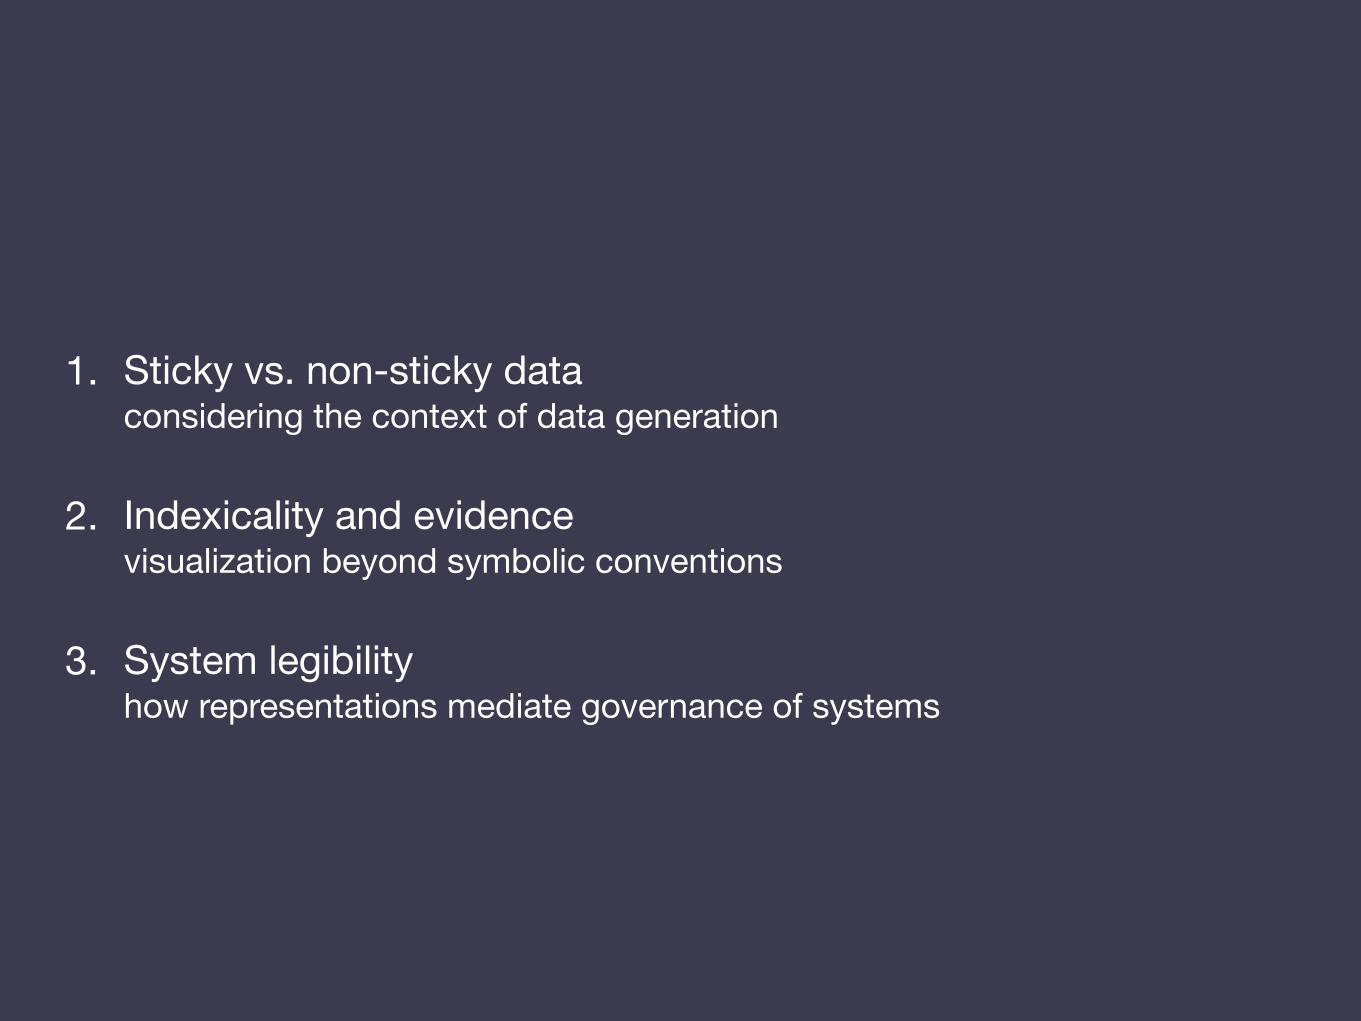
1. Sticky vs. non-sticky data considering the context of data generation
2. Indexicality and evidencevisualization beyond symbolic conventions
3. System legibilityhow representations mediate governance of systems

Sticky vs. non-sticky data
considering the context of data generation

Masaki Fujihata, Impressing Velocity, ICC, Tokyo 1992

wegzeit series (2000-2002)
interactive software Sonar 2002, Barcelona, ES ISEA 2002, Nagoya, JP Transmediale 2003, Berlin, DE vectors online journal 2005

The meaning is in the context
Drucker, Johanna. 2011. “Humanities Approaches to Graphical Display.” Digital Humanities Quarterly 5 (1).

Sorting Out CitiesDietmar Offenhuber & Ars Electronica Futurelab Miraikan Museum Tokyo, 2014

Video by YouTube users: Shunichi Kitamura, barmaglot0

Cities occupy 3% of the earth’s land surface. If all urban areas would be combined in one large city, it would be slightly larger than the size of Europe, or about half the size of Brazil.
Data: MODIS 500-m map of global urban extent — Center for Sustainability and the Global Environment (SAGE), University of Wisconsin-Madison

53% of the global population lives in cities; more than half of the global population lives in Southeast Asia.
Data: Center for International Earth Science Information Network - CIESIN - Columbia University. 2014. Gridded Population of the World, Version 4 (GPWv4)
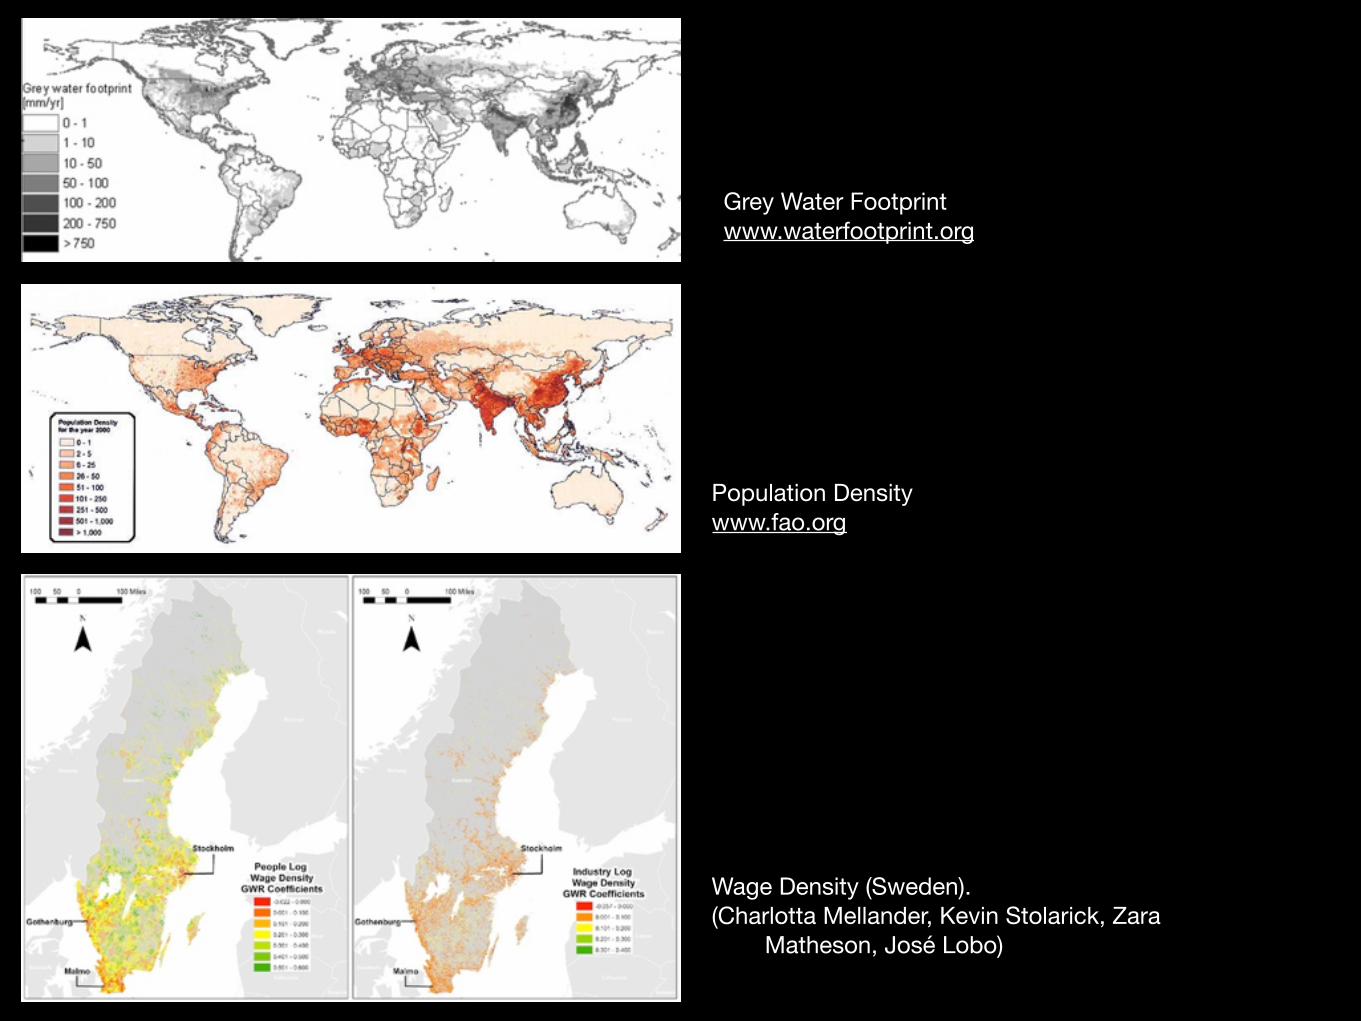
Grey Water Footprint www.waterfootprint.org
Population Density www.fao.org
Wage Density (Sweden). (Charlotta Mellander, Kevin Stolarick, Zara
Matheson, José Lobo)

NASA black marble dataset
http://earthobservatory.nasa.gov/Features/NightLights/
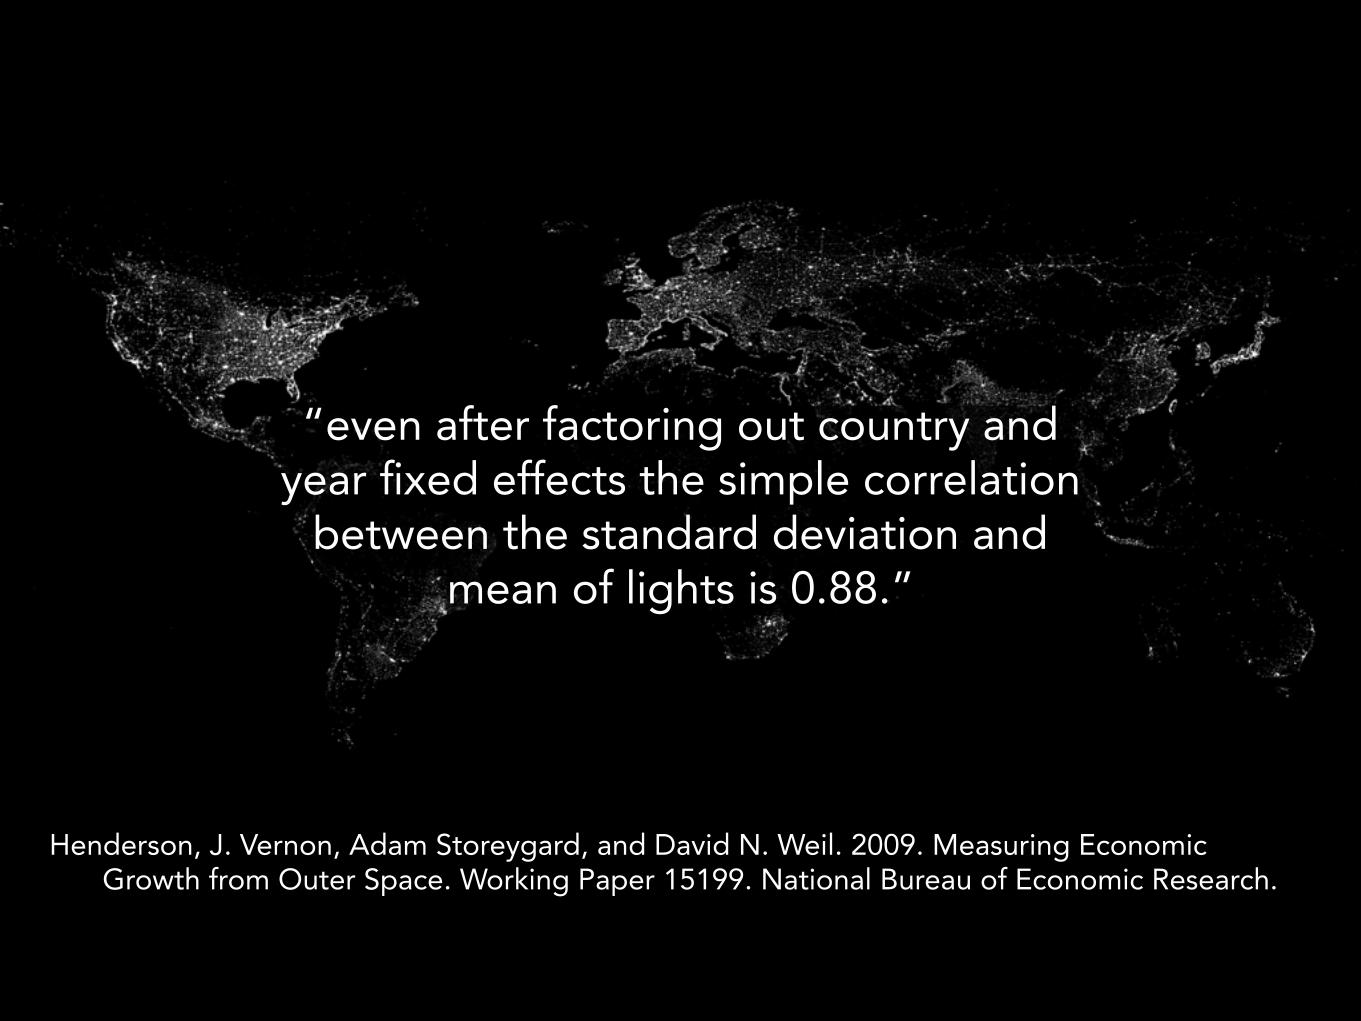
“even after factoring out country and year fixed effects the simple correlation
between the standard deviation and mean of lights is 0.88.”
Henderson, J. Vernon, Adam Storeygard, and David N. Weil. 2009. Measuring Economic Growth from Outer Space. Working Paper 15199. National Bureau of Economic Research.
Sticky data: user-generated data resists the transcendence of context


Categorizations and design
Peter Morville (2014)
trashsidewalk
street
left
pick
earlypicked
pickupdays
bags
Topic 11
illegaldumping
streetparking
sign
light
sidewalk
parked
faded
side
Topic 6
abandonedbridge
bikelane
stickers
remove
sidewalk
street
paintcar
Topic 22
watersignstreet
tire
bentparking
sidewalk
park
fountain
cars
Topic 7
deadtree
trash
sidewalk
streettrees
gangpark
front
ice
Topic 20
streetparkingcar
parkedsidewalklight
parkbrokenside
blocking
Topic 12
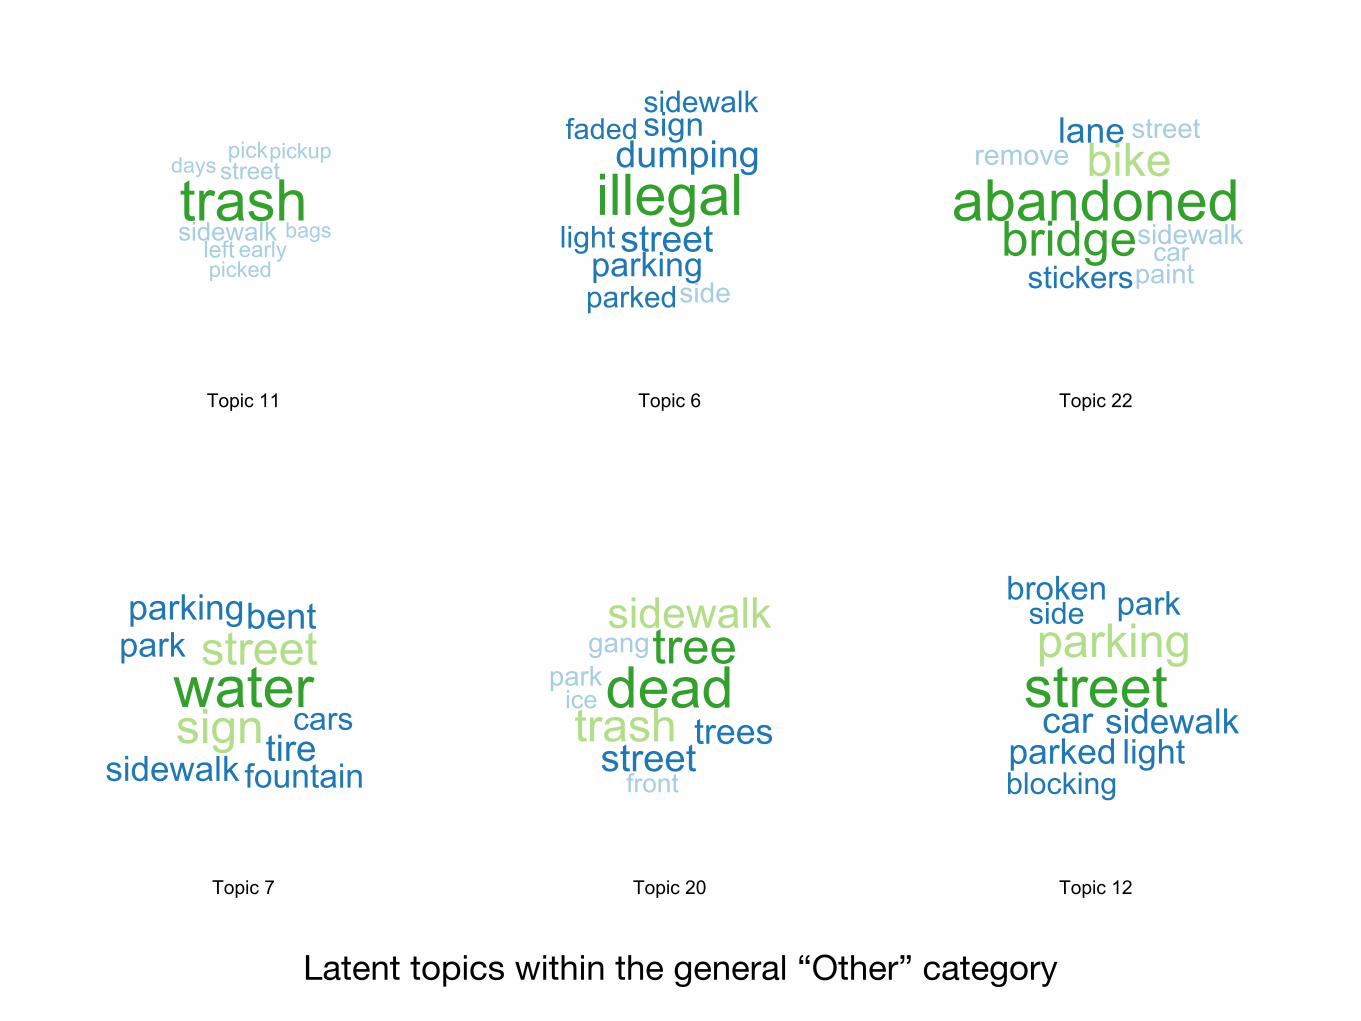
Latent topics within the general “Other” category
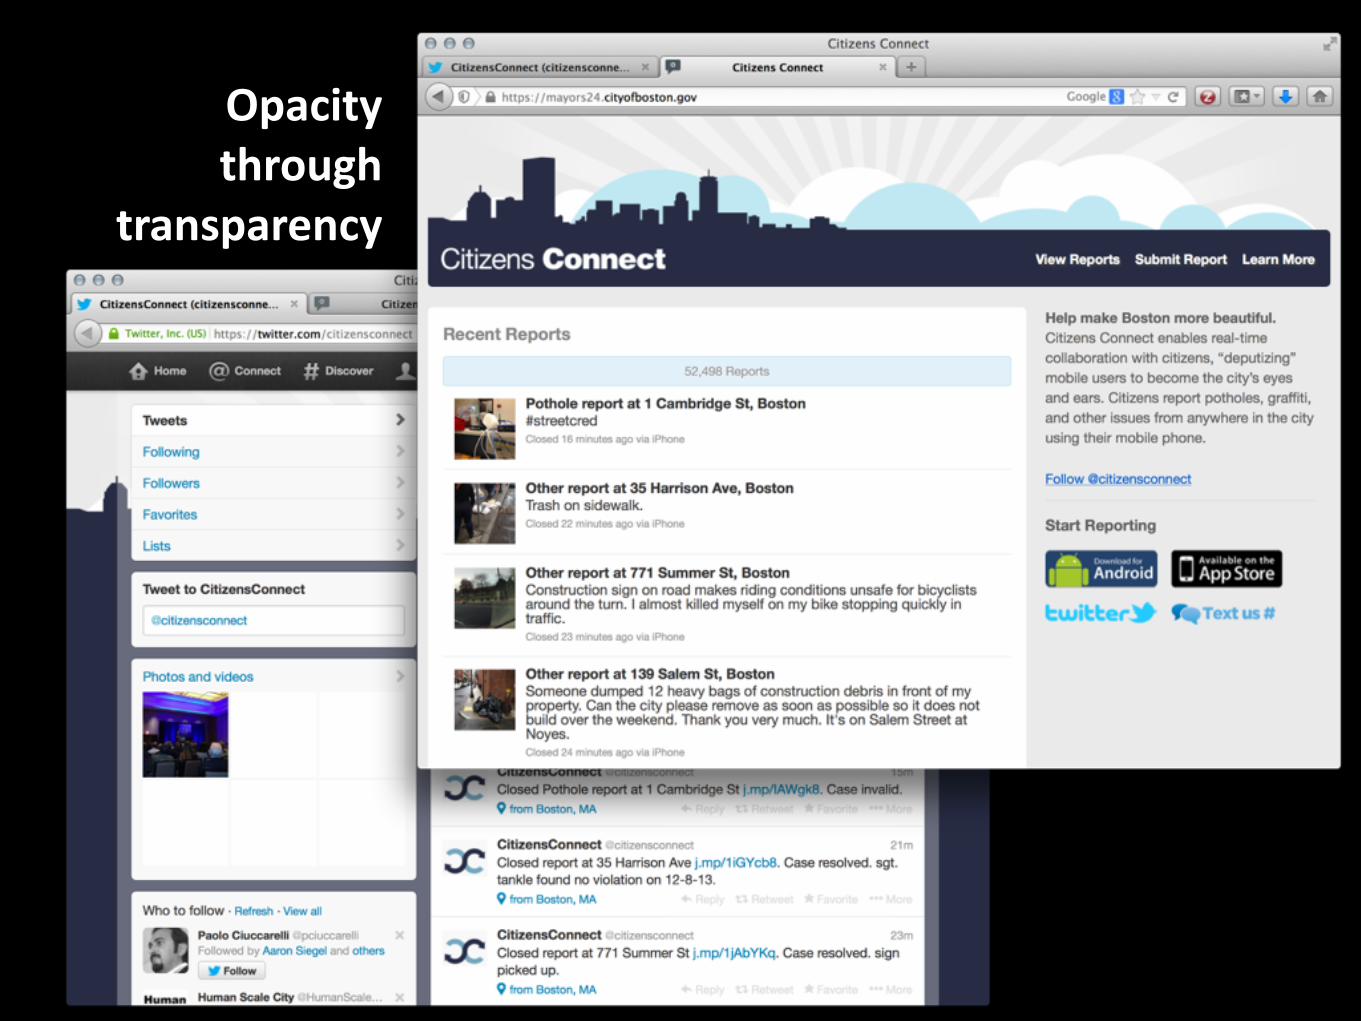
Opacitythrough
transparency

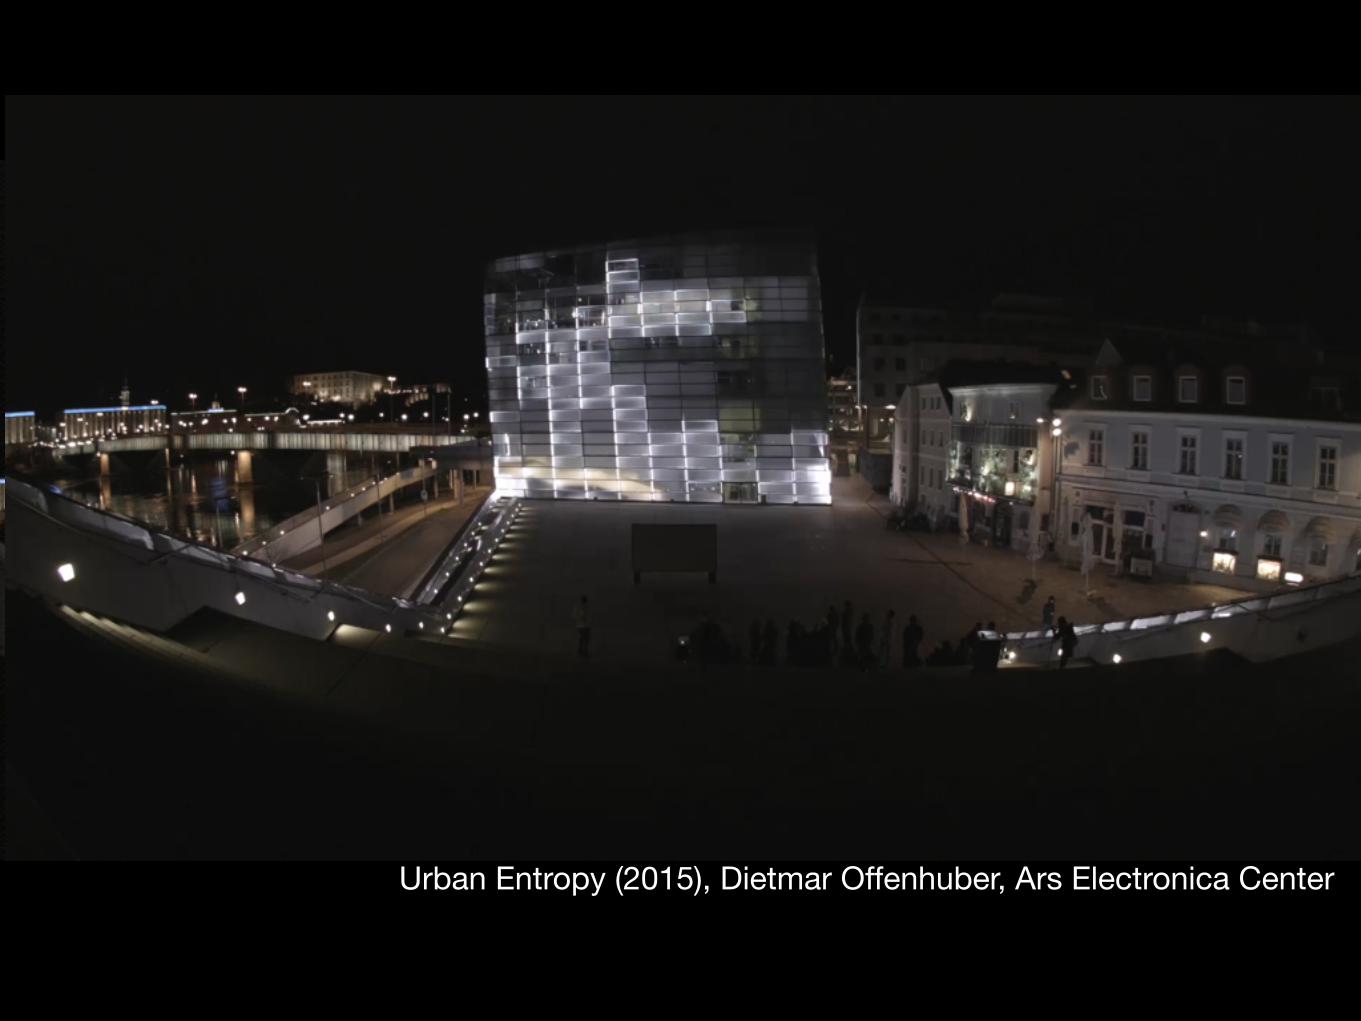
Urban Entropy (2015), Dietmar Offenhuber, Ars Electronica Center
Indexicality and evidence
visualization beyond the symbolic convention
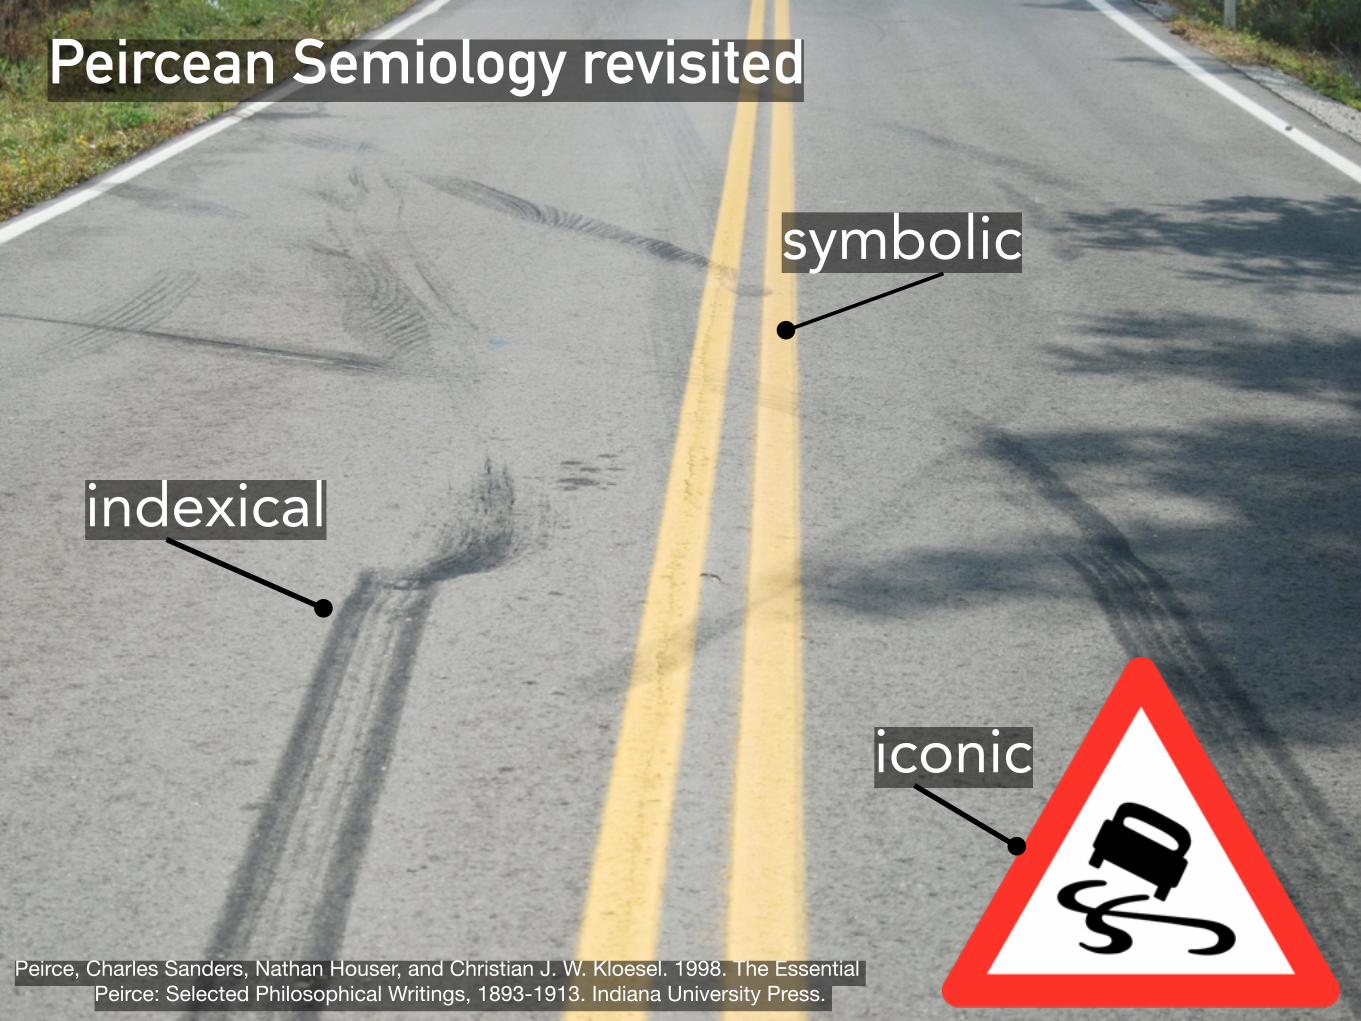
Peircean Semiology revisited
iconic
symbolic
indexical
Peirce, Charles Sanders, Nathan Houser, and Christian J. W. Kloesel. 1998. The Essential Peirce: Selected Philosophical Writings, 1893-1913. Indiana University Press.

iconic
symbolic
indexical0
50
100
April May June July
0
50
100
April June
?


Kamel Makhloufi “function”, 2010 https://www.flickr.com/photos/melkaone/5121285002/

Wilks, Kiesl, Moser, 2007, Garden of Eden, Ars Electronica 2007

West Elevatornear Dunkin Donutsdescends to commuter rail
North Elevatornear northern entrancedescends to Northeastern entrance
East Elevatorcentral breezewaydescends to bus station
uppe
r bre
ezew
ayin
side
ele
vato
rlo
wer
pla
tfor
m
Sonic VertiscapesSkye Morét with Sam Auinger, Bruce Odland & Katrin Emlercoding assistance from Armin AkhavanSonic Commons Workshop 2015Northeastern University + Harvard GSD
Constraints for generative code. The soundscapes below represent a 15 sec. recording of each space.
frequency = step size
intensity (dB) = diameter
At Boston’s Ruggles Station I examined the sonic identity of spaces, listening closely to soundscapes and their patterns and signatures.
While transiting normal pedestrian paths, I identified clear vertical sonic thresholds. Elevators function as temporary aural escapes—passages from one soundscape to the next. Below, I examine their sonic identity with generative code, allowing decibel and frequency levels to determine the visual scape. For us to transition, as a society, toward a multi-sensual approach to design, we must understand how our actions and use of space manifest themselves within the sonic commons.
Skye Moret
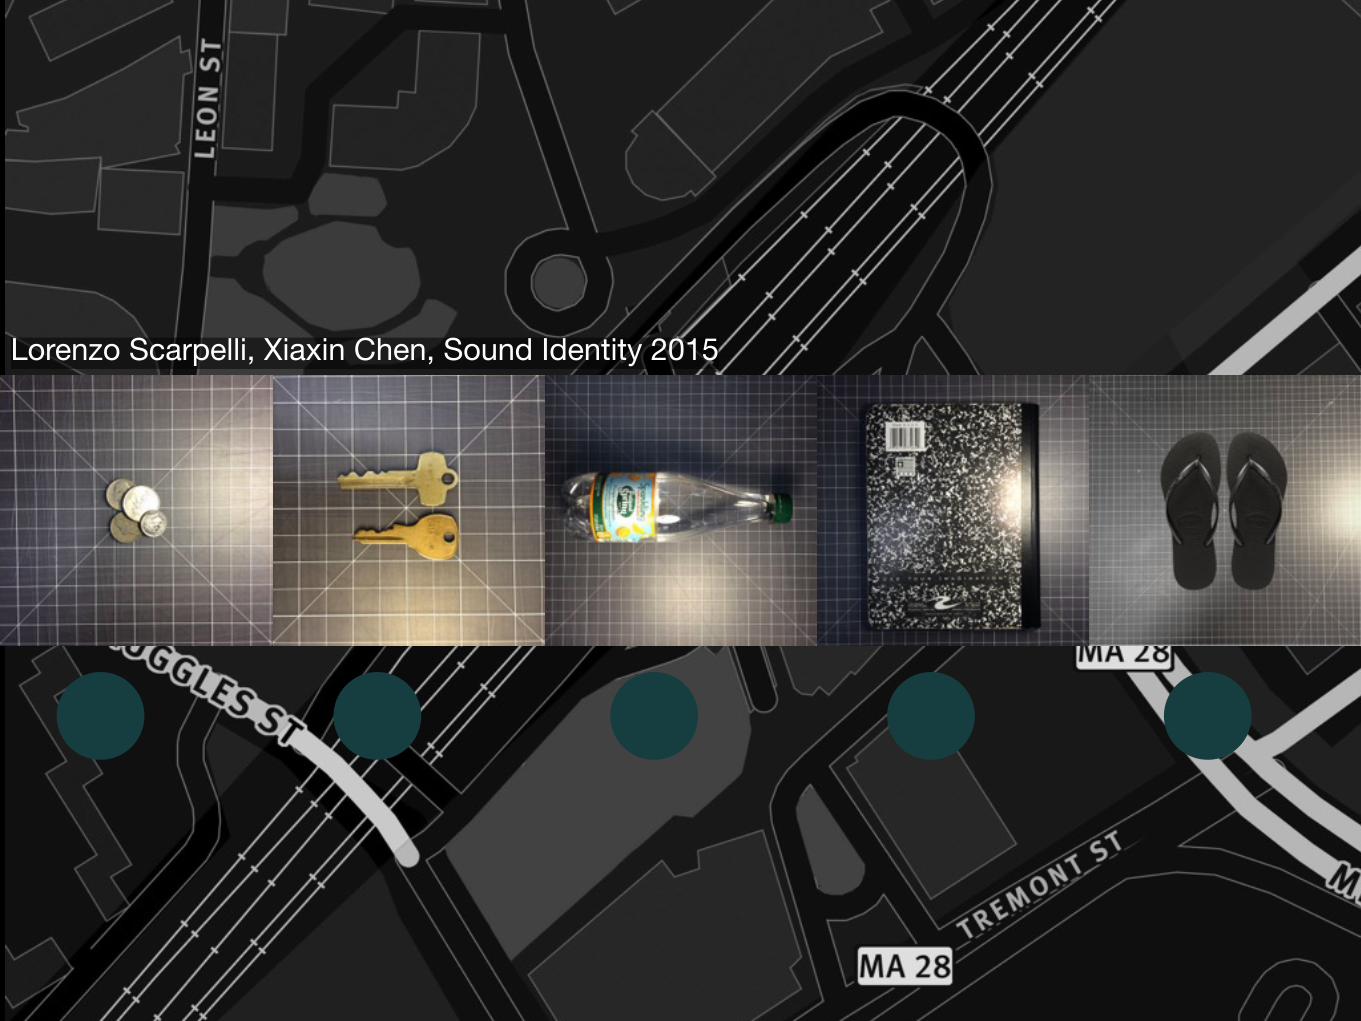
Lorenzo Scarpelli, Xiaxin Chen, Sound Identity 2015

Lorenzo Scarpelli, Xiaxin Chen. Sound Identity. 2015

Design principles of indexical visualization: framing, not mapping a phenomenon
Offenhuber, Dietmar, and Orkan Telhan. 2015. “Indexical Visualization – the Data-Less Information Display.” In Ubiquitous Computing, Complexity and Culture, edited by Ulrik Ekman, Jay David Bolter, and Lily Diaz. New York: Crc Press.

infrastructure legibility and governance
how representations mediate governance of systems

Folk theories
Kempton, Willett. 1986. “Two Theories of Home Heat Control.” Cognitive Science 10 (1): 75–90.

Trash Track - Senseable City Lab 2009. Image: Christophe Chung

Trash Track - Senseable City Lab 2009. image: Dietmar Offenhuber
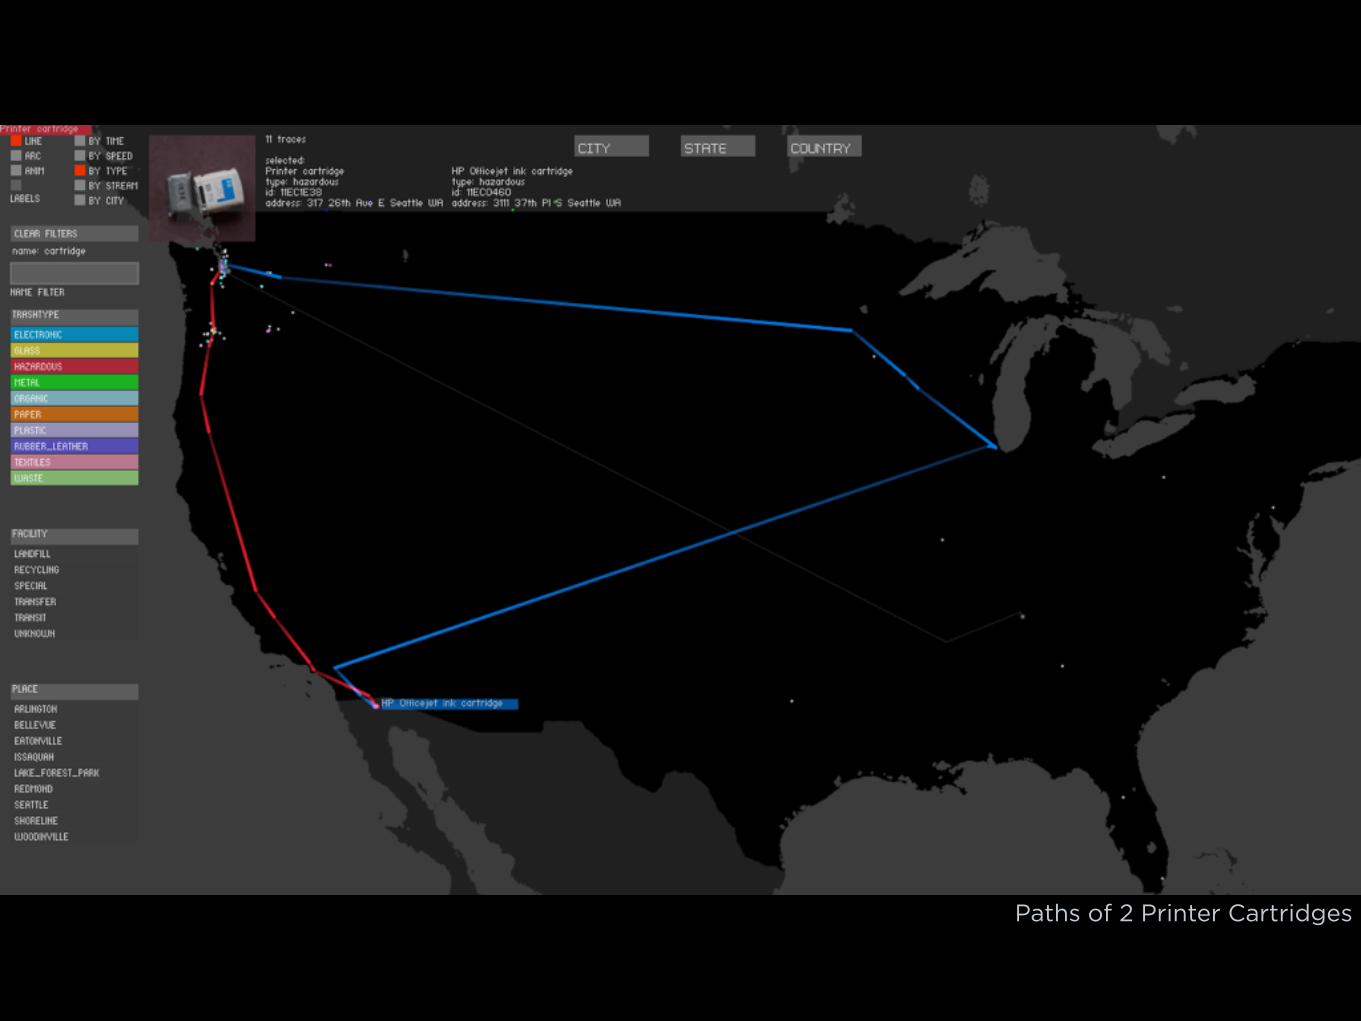
Paths of 2 Printer Cartridges

Items reported from this facility between Oct. 22 and Nov. 8. some objects for several days. Most items came through the AW recycling center.


IMPROSTRUCTURE
Dietmar Offenhuber (NU), Katja Schechtner (ADB), Julia Nebrija (Manila)
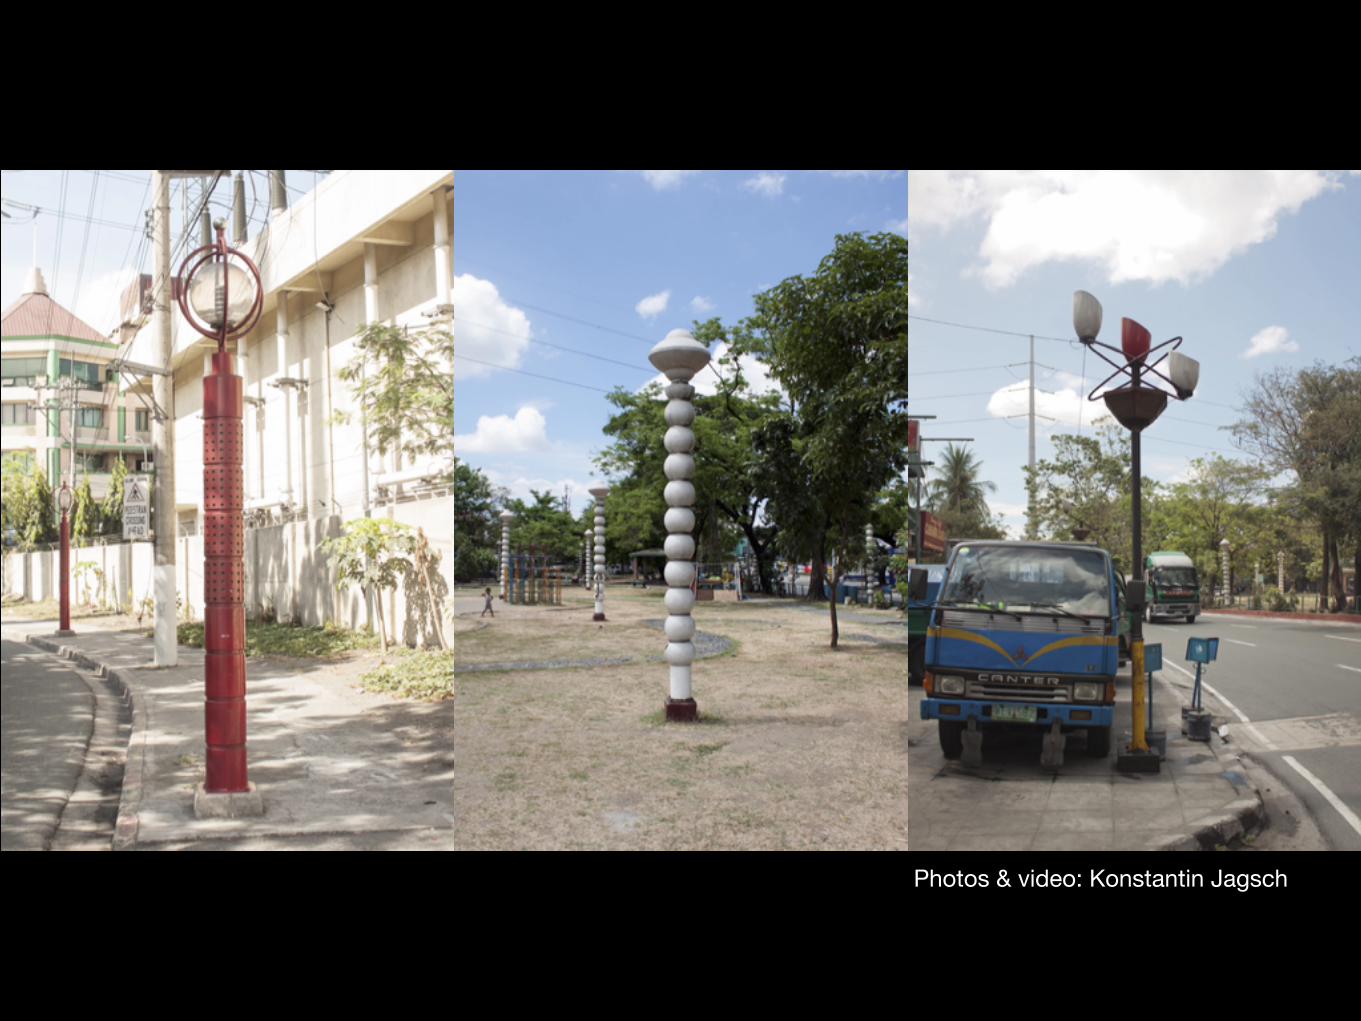
Photos & video: Konstantin Jagsch
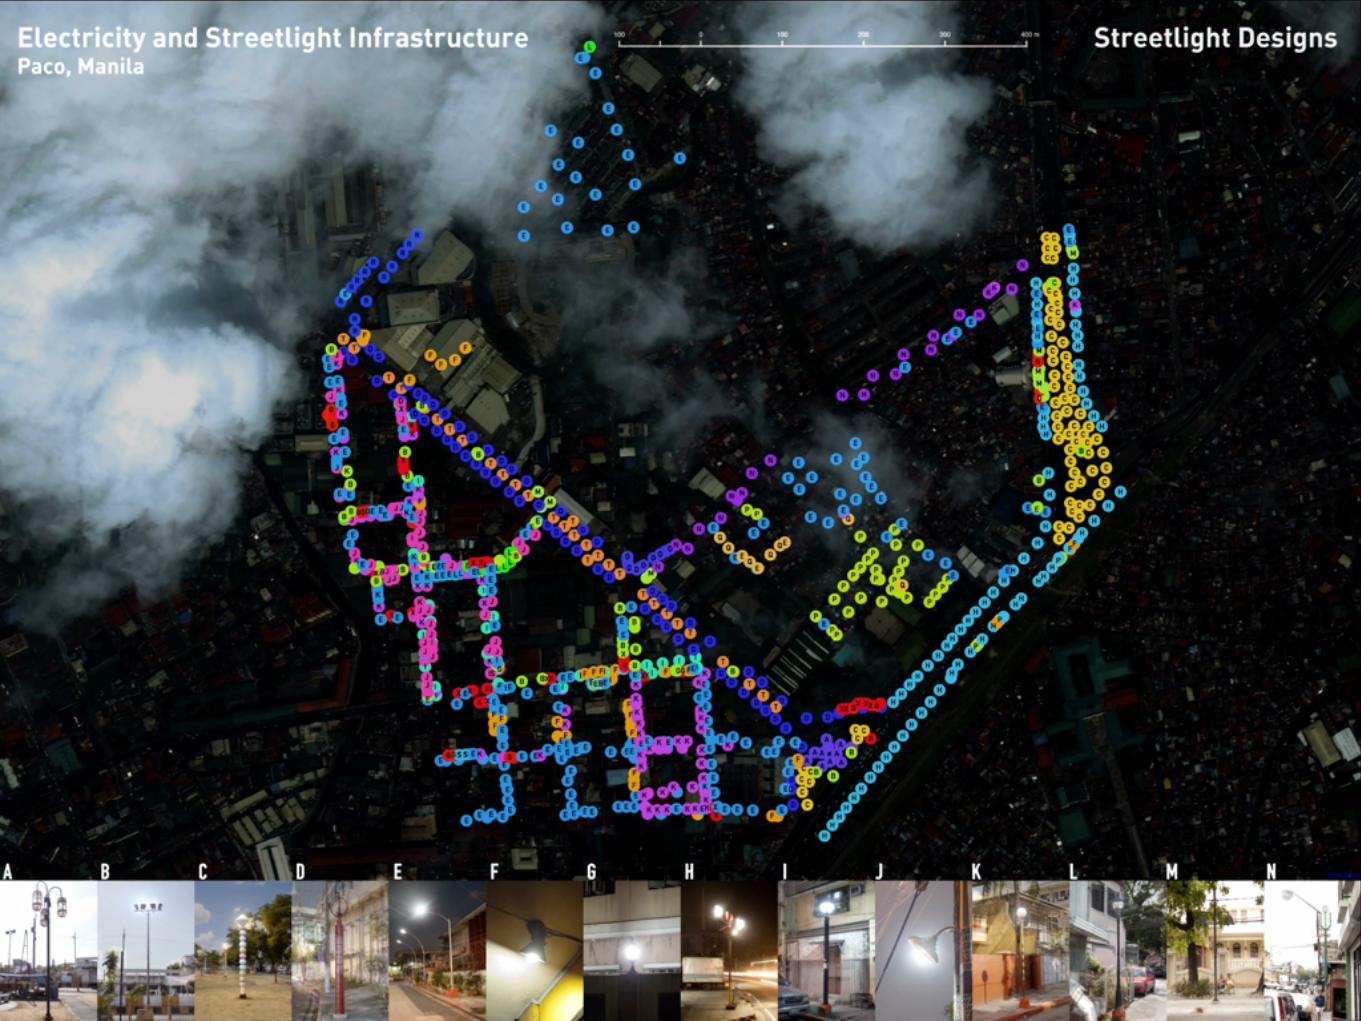


Black market of electricity - Paco, Manila

Ad-hoc repairs, lighting hybrids (K. Jagsch)

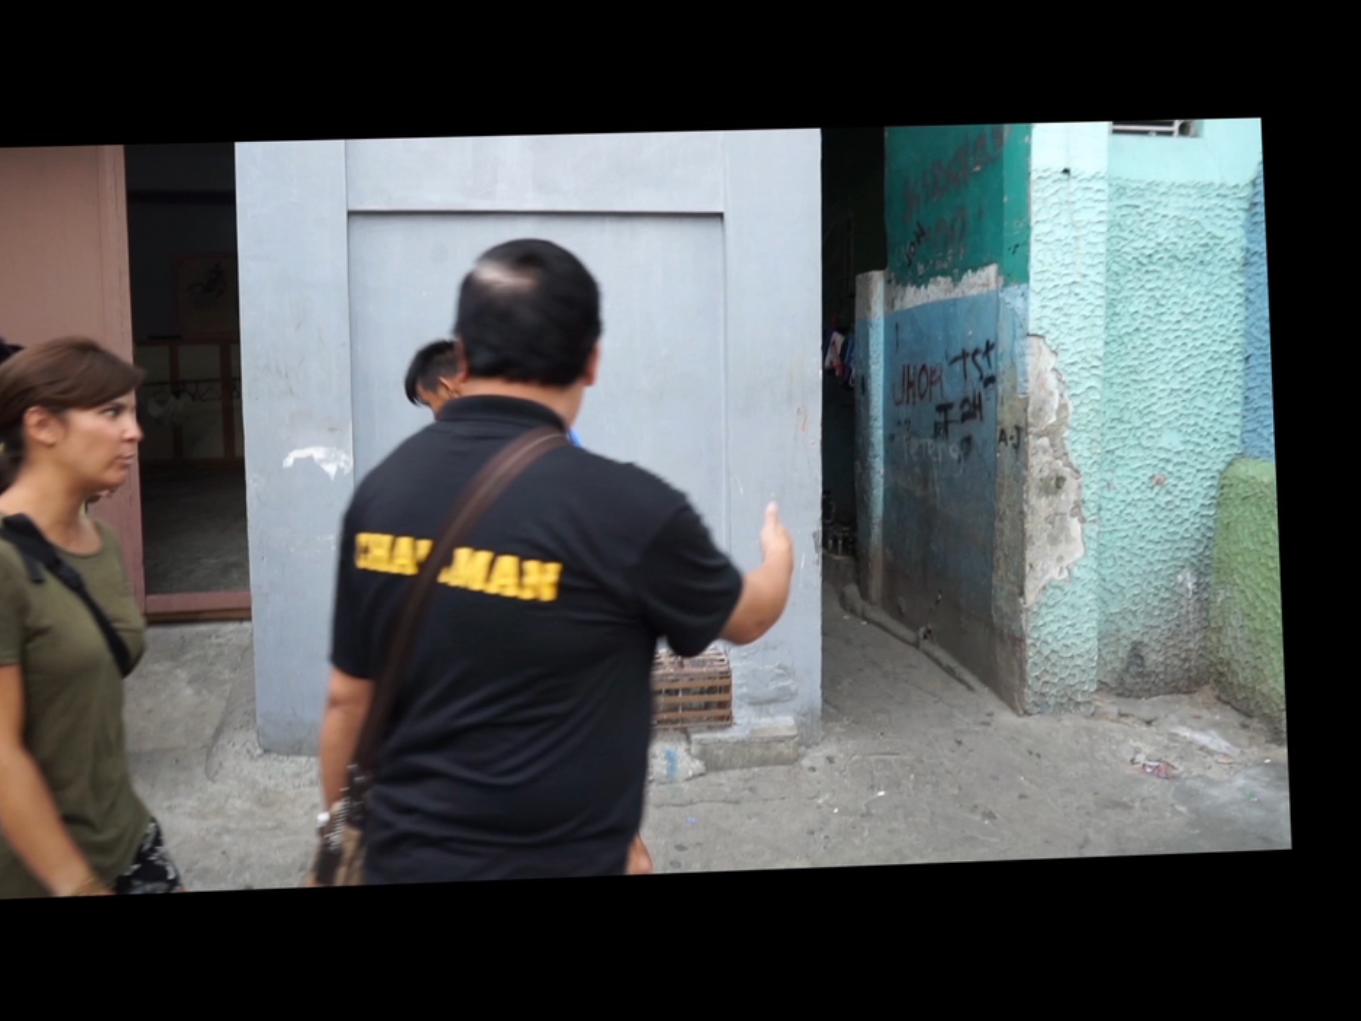

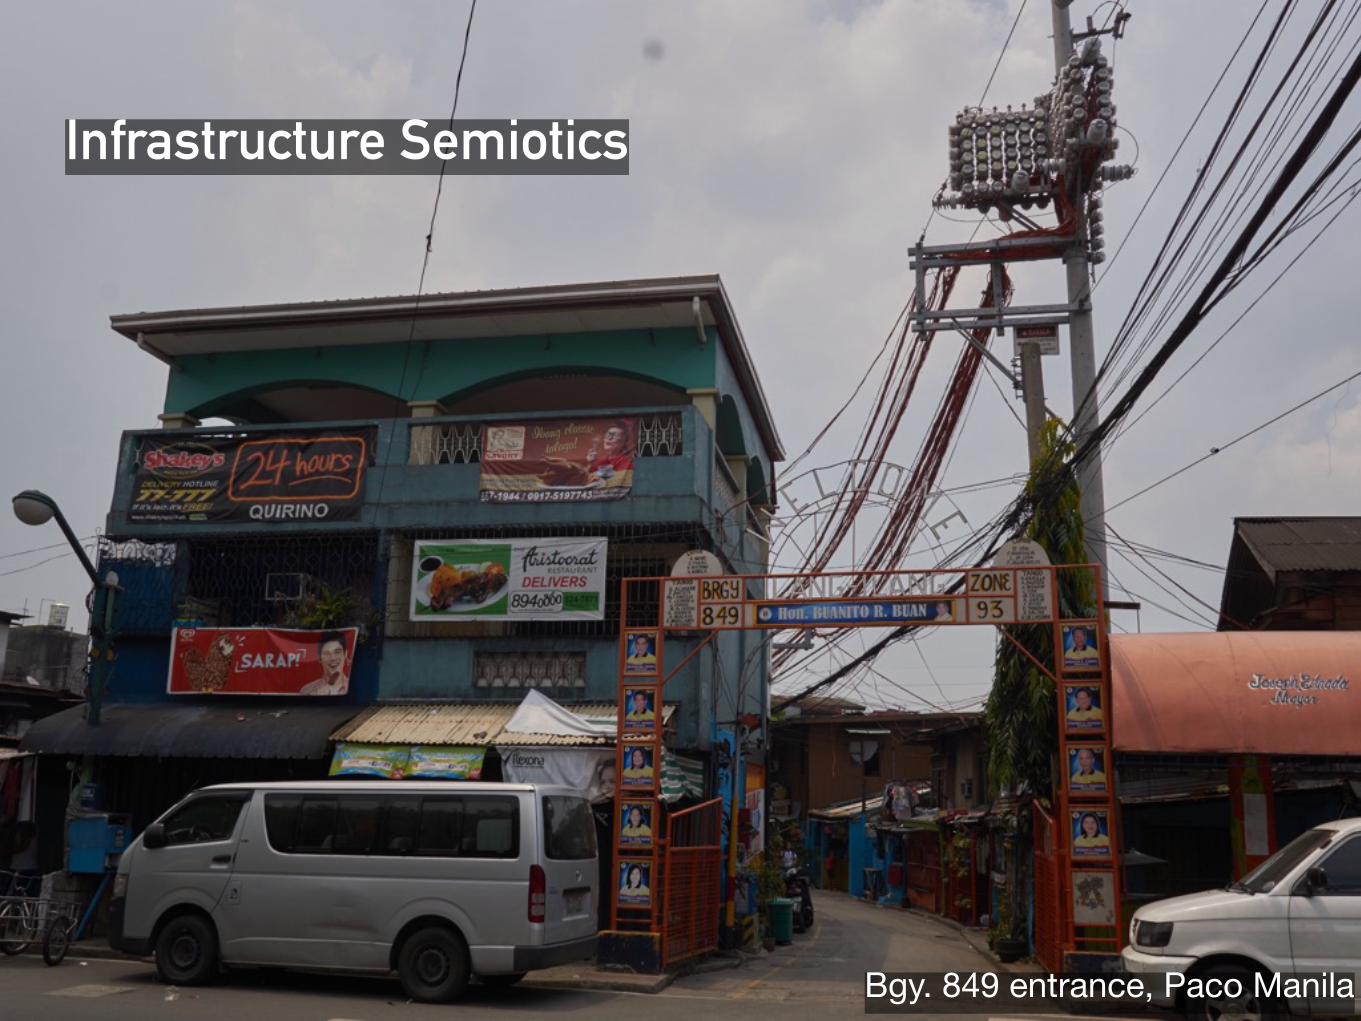
Infrastructure Semiotics
Bgy. 849 entrance, Paco Manila

The representation of infrastructure shapes its governance.
Offenhuber, Dietmar. (in press). Waste Is Information - Infrastructure, Representation, and Accountability in the Digital Age. Cambridge, Mass.: MIT Press.

Paradigm 1 Paradigm 2 Paradigm 3
Metaphor of interaction
Interaction as man-machine coupling
Interaction as information communication
Interaction as phenomenologically situated
Central goal for interaction
Optimizing fit between man and machine
Optimizing accuracy and efficiency of information transfer
Support for situated action in the world
Typical questions of interest
How can we fix specific problems that arise in interaction?
What mismatches come up in communication between computers and people?
What existing situated activities in the world should we support?
How can we accurately model what people do?
How do users appropriate technologies, and how can we support those appropriations?
How can we improve the efficiency of computer use?
How can we support interaction without constraining it too strongly by what a computer can do or understand?
What are the politics and values at the site of interaction, and how can we support those in design?
Harrison, Steve, Deborah Tatar, and Phoebe Sengers. 2007. “The Three Paradigms of HCI.” In Alt. Chi. Session at the SIGCHI Conference on Human Factors in Computing Systems San Jose, California, USA, 1–18.
The third paradigm of HCI