
Sterling Bank Plc · Nigeria Bank Analysis | Public Credit Rating Page 2 Organisational profile...
8
Nigeria Bank Analysis | Public Credit Rating Sterling Bank Plc Nigeria Bank Analysis June 2018 Financial data: (USDm comparative)* 31/12/16 31/12/17 NGN/USD (avg.) 252.7 305.3 NGN/USD (close) 304.5 305.5 Total assets 2,708.1 3,459.9 Primary capital 281.3 336.9 Secondary capital 43.1 42.8 Net advances 1,537.8 1,957.7 Liquid assets 431.0 541.3 Operating income 270.4 240.3 Profit after tax 20.4 27.9 Market cap .# N40.3bn/USD132m Market share** 3.1% *Central Bank of Nigeria (“CBN”) exchange rates # As at 23 May 2018. ** Based on industry assets as at 31 December 2017. Rating history: Initial rating (April 2009) Long-term: BBB(NG) Short-term: A2(NG) Rating outlook: Stable Last rating (June 2017) Long-term: BBB(NG) Short-term: A3(NG) Rating outlook: Negative Related methodologies/research: Global Criteria for Rating Banks and Other Financial Institutions, updated March 2017 Sterling rating reports (2009-17) Glossary of Terms/Ratios, February 2016 GCR contacts: Analysts Yinka Adeoti /Julius Adekeye Credit Analyst/Senior Credit Analyst [email protected] [email protected] Committee Chairperson Dave King king@globalratings.net Analysts location: Lagos, Nigeria Tel: +234 1 904-9462 Website: www.globalratings.com.ng Summary rating rationale Sterling Bank Plc (“Sterling” or “the bank”) is a mid-sized commercial bank in Nigeria, with a market share of 3.1% (FY16: 2.6%) by total assets at FY17. Sterling’s capitalisation improved considerably in FY17, with shareholders’ funds increasing by 20.2% to N102.9bn, underpinned by internal capital generation. As a result, risk weighted capital adequacy ratio (“CAR”) increased to 12.2% at FY17 (FY16: 11.2%), exceeding the regulatory minimum by some margin. To further strengthen capitalisation and enhance operation, the bank intends to issue a new tranche of the existing bond programme in 3Q FY18. The Gross non-performing loans (“NPL”) reduced by 18.8% to N38.5bn at FY17, supported by enhancement of the bank’s enterprise risk management framework, improved risk profile of oil and gas sector loan exposure (which constitute a significant portion of loan book) as well as active loan recovery effort, which resulted in recovery of N4.7bn during the year. Consequently, NPL ratio improved to 6.2% at FY17 (FY16: 9.9%) and strengthened further to 6.0% at 1Q FY18, albeit above regulatory threshold of 5%. Specific provision coverage of NPLs improved to 35.8% at FY17 (FY16: 8.9%). Sterling evidenced liquidity pressure during FY17, with the bank’s statutory liquidity ratio falling short of the minimum requirement at some points (recording lowest ratio of 22.3% in August 2017), albeit normalising at year end at 33.0% (April 2018: 43.6%). Sterling’s dependence on expensive funds exerted pressure on margins, with net interest margin shrinking 350 basis points to 8.4% in FY17, resulting in a 10.4% decline in net interest income to N50.2bn. However, a firmer 87.8% rise in non-funded revenue underpinned a 7.4% growth in total operating income to N73.4bn. The bank’s cost tightening measures (with operating expenses increasing by a marginal 3.7%) yielded improved efficiency indicators, with the cost ratio declining to 71.5% (FY16: 74.1%). Overall, the bank achieved a 43.5% growth in pre-tax profit to N8.5bn, translating to return on average equity (“ROaE”) and return on average assets (“ROaA”) of 9.0% and 0.9% (FY16: 5.7% and 0.6%) respectively. Factors that could trigger a rating action may include; Positive change: An improvement in the quality of assets, higher profitability, enhanced capitalisation and liquidity metrics would be favourably considered. Negative change: A rating downgrade could arise from a weakening in the competitive positioning and sustained pressure on liquidity metrics. Rating class Rating scale Rating Rating outlook Expiry date Long-term National BBB(NG) Stable June 2019 Short-term National A3(NG)
Transcript of Sterling Bank Plc · Nigeria Bank Analysis | Public Credit Rating Page 2 Organisational profile...

Nigeria Bank Analysis | Public Credit Rating
Sterling Bank Plc Nigeria Bank Analysis June 2018
Financial data:
(USDm comparative)*
31/12/16 31/12/17
NGN/USD (avg.) 252.7 305.3
NGN/USD (close) 304.5 305.5
Total assets 2,708.1 3,459.9
Primary capital 281.3 336.9
Secondary capital 43.1 42.8
Net advances 1,537.8 1,957.7
Liquid assets 431.0 541.3
Operating income 270.4 240.3
Profit after tax 20.4 27.9
Market cap.# N40.3bn/USD132m
Market share** 3.1%
*Central Bank of Nigeria (“CBN”) exchange rates
#As at 23 May 2018.
** Based on industry assets as at 31 December 2017.
Rating history:
Initial rating (April 2009)
Long-term: BBB(NG)
Short-term: A2(NG)
Rating outlook: Stable
Last rating (June 2017)
Long-term: BBB(NG)
Short-term: A3(NG)
Rating outlook: Negative
Related methodologies/research: Global Criteria for Rating Banks and Other
Financial Institutions, updated March 2017 Sterling rating reports (2009-17)
Glossary of Terms/Ratios, February 2016
GCR contacts: Analysts
Yinka Adeoti /Julius Adekeye
Credit Analyst/Senior Credit Analyst
Committee Chairperson
Dave King
Analysts location: Lagos, Nigeria Tel: +234 1 904-9462
Website: www.globalratings.com.ng
Summary rating rationale
Sterling Bank Plc (“Sterling” or “the bank”) is a mid-sized
commercial bank in Nigeria, with a market share of 3.1% (FY16:
2.6%) by total assets at FY17.
Sterling’s capitalisation improved considerably in FY17, with
shareholders’ funds increasing by 20.2% to N102.9bn, underpinned
by internal capital generation. As a result, risk weighted capital
adequacy ratio (“CAR”) increased to 12.2% at FY17 (FY16: 11.2%),
exceeding the regulatory minimum by some margin. To further
strengthen capitalisation and enhance operation, the bank intends to
issue a new tranche of the existing bond programme in 3Q FY18.
The Gross non-performing loans (“NPL”) reduced by 18.8% to
N38.5bn at FY17, supported by enhancement of the bank’s enterprise
risk management framework, improved risk profile of oil and gas
sector loan exposure (which constitute a significant portion of loan
book) as well as active loan recovery effort, which resulted in
recovery of N4.7bn during the year. Consequently, NPL ratio
improved to 6.2% at FY17 (FY16: 9.9%) and strengthened further to
6.0% at 1Q FY18, albeit above regulatory threshold of 5%. Specific
provision coverage of NPLs improved to 35.8% at FY17 (FY16:
8.9%).
Sterling evidenced liquidity pressure during FY17, with the bank’s
statutory liquidity ratio falling short of the minimum requirement at
some points (recording lowest ratio of 22.3% in August 2017), albeit
normalising at year end at 33.0% (April 2018: 43.6%).
Sterling’s dependence on expensive funds exerted pressure on
margins, with net interest margin shrinking 350 basis points to 8.4%
in FY17, resulting in a 10.4% decline in net interest income to
N50.2bn. However, a firmer 87.8% rise in non-funded revenue
underpinned a 7.4% growth in total operating income to N73.4bn.
The bank’s cost tightening measures (with operating expenses
increasing by a marginal 3.7%) yielded improved efficiency
indicators, with the cost ratio declining to 71.5% (FY16: 74.1%).
Overall, the bank achieved a 43.5% growth in pre-tax profit to
N8.5bn, translating to return on average equity (“ROaE”) and return
on average assets (“ROaA”) of 9.0% and 0.9% (FY16: 5.7% and
0.6%) respectively.
Factors that could trigger a rating action may include;
Positive change: An improvement in the quality of assets, higher
profitability, enhanced capitalisation and liquidity metrics would be
favourably considered.
Negative change: A rating downgrade could arise from a weakening in
the competitive positioning and sustained pressure on liquidity metrics.
Rating class Rating scale Rating Rating outlook Expiry date Long-term National BBB(NG)
Stable June 2019 Short-term National A3(NG)

Nigeria Bank Analysis | Public Credit Rating Page 2
Organisational profile
Corporate summary1
Sterling is a commercial bank in Nigeria, offering
retail and corporate banking services to individual
and corporate clients. In 2011, the bank divested all
its non-core banking subsidiaries in line with CBN’s
directives and acquired Equitorial Trust Bank
Limited to further expand its geographical presence
and strengthen its competitive positioning within the
Nigerian banking space.
Ownership structure Sterling’s shareholding structure remained
unchanged in FY17, comprising foreign and local
investors (both private and institutional). Table 1
outlines the major shareholders with holdings
exceeding 5%.
Table 1: Shareholding structure % holding
FY17
Silverlake Investment Limited 25.0
State Bank of India 8.9
SNNL/AMCON 5.9
Dr. Mike Adenuga 5.6
Ess-ay Investment Ltd 5.0
Others 49.6
Total 100.0
Source: Sterling AFS.
Strategy and operations
The bank continued to strengthen its strategic plans
of growing organically, deepening focus within the
retail banking segment and improve customers’
banking experience. To this end, sterling embarked
on massive investment in digital banking platforms
and other alternate channels aimed at delivering
efficient services to customers as well as improve the
bank’s market share. As such, the bank launched an
online lending platform called “Specta” which
provides personal loans to customers within the
shortest time frame of 5 minutes upon meeting the
stipulated requirement.
Sterling’s Alternative Finance, the non-interest
banking platform, continues to evolve through the
development of tailor-made products to capture more
segments of the financial market and further diversify
the income stream of the bank. The bank also
realigned its commercial banking businesses with a
view to drive business expertise within focused
sector. In this regard, the bank during FY17
introduced HEART initiative to build sustainable
development in the bank’s five priority sector which
includes; Health, Education, Agriculture, Renewable
Energy, and Transportation.
At end-December 2017, Sterling operated through a
network of 179 branches, 5,680 active POS
1 Refer to previous rating reports for a detailed background.
terminals, 835 ATM, and a staff complement of
2,260.
Governance structure
The composition of the bank’s board of directors
(“board”) and its governance structure are in line
with CBN’s code of corporate governance for banks
in Nigeria, and that of the Securities and Exchange
Commission (“SEC”) for listed companies. The
board composition and adherence to selected aspects
of appropriate corporate governance are as
highlighted below.
Description Findings
Board size 11 members
Number of executive directors 4 (Including Managing Director)
Number of non-executive directors 7 (Including Chairman)
Independent directors Yes, 2
Tenure of non-executive directors 4 years each/max. 2 cycles
Number of board committees 5-(Risk Management, Audit, Credit, Finance and General Purpose, and Governance and Remuneration.)
Internal audit and compliance Yes, independent unit
External auditors and rotation policy
Ernst and Young /10 year tenure (renewable annually)
Changes to the composition of the board during the
review period include the retirement of one director
in 2017 and retirement of additional four directors in
early 2018 (including the immediate past Managing
Director, Mr Yemi Adeola). As such, Mr Abubakar
Suleiman (formerly an Executive Director of the
bank) assumed the role of the Managing Director
effective from 1st April 2018, while Mr Emmanuel
Emefienim was appointed as an Executive Director.
Financial reporting
Sterling’s FY17 financial statements were compiled
in accordance with International Financial Reporting
Standard, the Companies and Allied Matters Act,
Financial Reporting Council of Nigeria requirements
and the Banks and Other Financial Institutions Act.
The auditor, Ernst & Young, issued an unqualified
opinion on the FY17 financial statements.
Operating environment2
Economic overview
The Nigerian economy returned to growth (albeit
slowly) in 2Q FY17, after five consecutive quarters
of contraction since 1Q FY16. Available data from
the National Bureau of Statistics reflects real annual
growth rate for 2017 at 0.8% compared to -1.6% in
2016. This was largely driven by improved global oil
prices and production volumes (due to reduced
vandalism on oil and gas pipelines in the Niger Delta
region). As such, while global oil prices rose above
the $44.5 a barrel benchmark of the government,
crude oil production also averaged 1.91million
2 Refer to GCR’s 2017 Nigerian Financial Institutions Overview for an
overview of selected economic and industry developments.
Nigeria Bank Analysis | Public Credit Rating Page 3
barrels per day (“mbpd”) against 1.76mbpd the
previous year, impacting positively on government
revenues and overall economic activities. The non-oil
sector grew 0.5% in 2017, compared to -0.22% in
2016. Other initiatives resulting in the quick
economy rebound were CBN policies implemented
during the period. This includes the effort towards
boosting liquidity in the FX market, as well as
narrow the gap between the parallel market and
official exchange rates through the establishment of a
special window for investors, exporter and end-users
known as Investors’& Exporters’ FX Window (I&E
window). Furthermore, CBN maintained its tight
monetary stance by leaving the benchmark monetary
policy rates and cash reserve ratio for commercial
banks unchanged at 14% and 22.5% throughout
2017. As a result, the Nigerian Naira exchanged at
N306.3/USD and N362.8/USD at the official and
parallel market rates respectively by December 2017
(December 2016: N305.2/USD and N493.3/USD at
official and parallel exchange rates respectively).
Also, headline inflation slowed to 15.4% in
December 2017, from a peak of 18.7% in January
2017 (December 2016: 18.6%) and this has further
improved to 11.6% at May 2018.
On the back of improved macroeconomic conditions,
the Nigerian Stock Exchange all-share index for
equities closed at 38,243 points at FY17 (FY16: 26,
874points), with banking stocks among the most
improved. Similarly, market capitalization stood at
N22.9tn compared to N16.2tn at end-FY16.
Based on the foregoing GDP growth for the year
2018 has been forecast at 3.5% by the World Bank
and later revised to 2.5%. This is based on
expectation that government’s effort to stimulate
domestic demand through investment in
infrastructure and the economy recovery and growth
plan (“ERGP”), launched by the Presidency in April
2017) will be implemented successfully. The ERGP
is a medium term plan for 2017-2020, with focus on
key sectors such as agriculture and food security,
energy, transportation and manufacturing.
Industry overview
Despite the challenging operating environment in
2016 and 2017, performance (in terms of
profitability) improved for most of the players in
FY17, albeit with increasing NPLs. Total assets for
the industry grew 9.2% to N34.6tn at FY17, largely
emanating from reduction of Federal Government
borrowings from the domestic market and ability of
banks to mobilize more deposits. As such, total loans
to the private sector stood at N20.4tn, albeit NPLs for
the industry rose significantly from 5.3% at FY15 to
12.8% and 15% at FY16 and 1H FY17 respectively.
A major factor impacting on banks asset quality is the
high exposure to the oil and gas sector (accounted for
up to 29% of the industry loans as at 1H FY17), and
this is more likely to affect the large and mid-sized
banks.
The average CAR for the industry moderated to
11.5% at 1H FY17 from 14.8% at December FY16.
The decline in CAR was attributed to the slow
economic recovery and the rise in NPLs, which
resulted in capital deterioration. To ascertain the
viability of the players, CBN conducted a stress test
for banks during 2017 and the outcome reflects that
only the large banks could withstand a further
deterioration of up to 50% of their NPLs. To combat
the deterioration in capitalization of banks, CBN
issued a circular in January 2018, which amends the
existing internal capital generation and dividend
payout ratios. The new circular takes into cognisance
the composite risk rating of the banks, NPLs, and
CAR ratios in arriving at the dividend payout ratio
(which takes effect immediately).
Going forward, banks’ capitalization is likely to be
further impacted by the implementation of the
International Financial Reporting Standards (“IFRS”)
9, which commences in January 2018. IFRS 9
prescribes new guidelines for the classification and
measurement of financial assets and liabilities,
making fundamental changes to the methodology for
measuring impairment losses, by replacing the
‘incurred loss’ model with a more forward looking
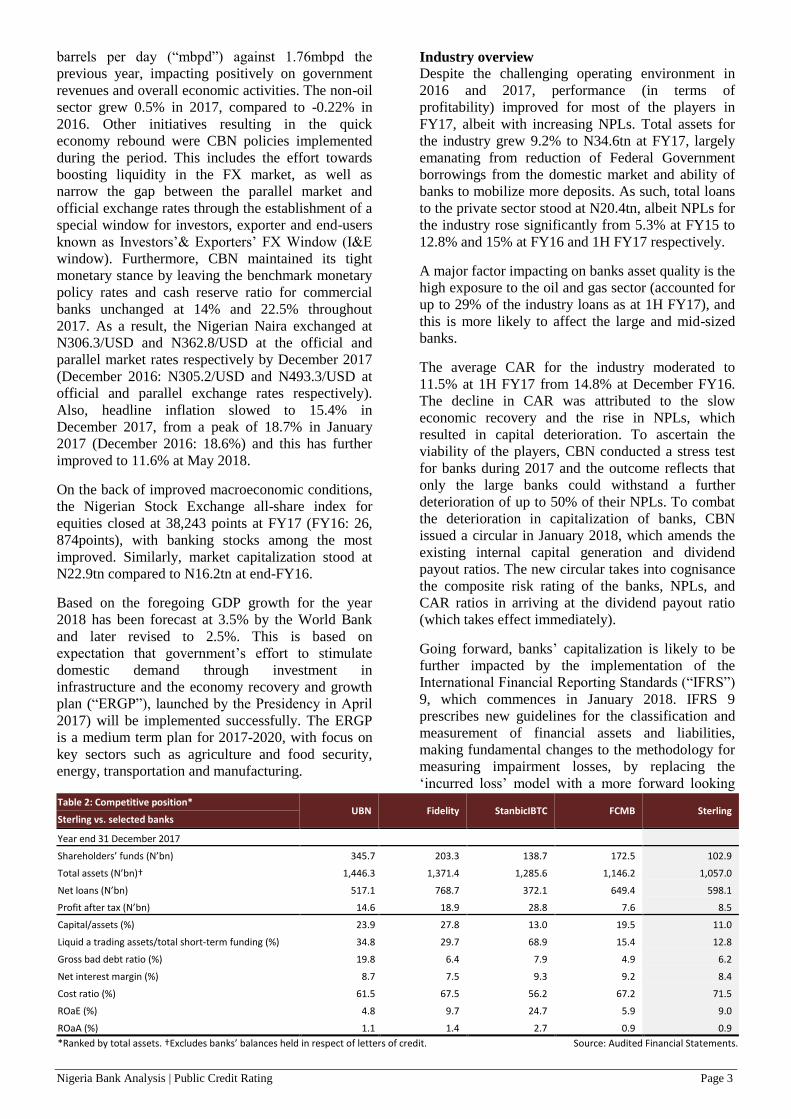
Table 2: Competitive position* UBN Fidelity StanbicIBTC FCMB Sterling
Sterling vs. selected banks
Year end 31 December 2017 Shareholders’ funds (N’bn) 345.7 203.3 138.7 172.5 102.9
Total assets (N’bn)† 1,446.3 1,371.4 1,285.6 1,146.2 1,057.0
Net loans (N’bn) 517.1 768.7 372.1 649.4 598.1
Profit after tax (N’bn) 14.6 18.9 28.8 7.6 8.5
Capital/assets (%) 23.9 27.8 13.0 19.5 11.0
Liquid a trading assets/total short-term funding (%) 34.8 29.7 68.9 15.4 12.8
Gross bad debt ratio (%) 19.8 6.4 7.9 4.9 6.2
Net interest margin (%) 8.7 7.5 9.3 9.2 8.4
Cost ratio (%) 61.5 67.5 56.2 67.2 71.5
ROaE (%) 4.8 9.7 24.7 5.9 9.0
ROaA (%) 1.1 1.4 2.7 0.9 0.9
*Ranked by total assets. †Excludes banks’ balances held in respect of letters of credit. Source: Audited Financial Statements.

Nigeria Bank Analysis | Public Credit Rating Page 4
‘expected loss’ model. Thus, impacting NPLs and
capital adequacy.
As at December 2017, the commercial banking space
comprise 22 players, with 10 authorised as
international banks, 9 licensed as national, 2 regional
and 1 non-interest bank with national license.
Competitive position Competition remained intense among the commercial
banks throughout 2017, as most banks shift focus
towards the retail banking. With a balance sheet size
of N1.1tn at FY17, Sterling ranks fairly with peers.
However, the bank’s liquidity metrics ranks the
lowest vis a vis peers, while cost-to-income ratio
stood relatively above peers’ average as shown in
Table 2.
Financial profile
Likelihood of support
Given the relative size of the bank, available support
is currently limited to its’ shareholders, as previously
demonstrated during the capital raising exercise in
FY13 and private placement in FY14.
Funding composition
The bank’s major source of funding remains
customer deposits, which constituted 66.8% of the
total funding at FY17. Other funding sources include
equity (11.3%), other borrowings (20.8%) and
interbank borrowings (1.1%). Details of each source
of funding are discussed below.
Customer deposits and interbank funding
Sterling’s total deposits increased by 17.1% to
N684.8bn at FY17, largely driven by growth in
savings deposits and term deposits which grew
15.9% and 36.3% to N60.7bn and N275.1bn
respectively. Growth in savings deposits was
enhanced by deepened penetration in retail banking
as the bank leveraged digital banking platforms and
agent banking services. However, the bank’s deposit
book tilted towards a relatively expensive term
deposits which accounted for a higher 46.6% of
deposits at FY17 (FY16: 35.5%). Hence, cost of
funds increased to 7.4% at FY17 (FY16: 6.3%). The
bank displayed a reduced reliance on interbank
funding during the year, with the liability pool ending
down at N11bn, representing 53.5% decline over
FY16. Management forecast 15% growth in deposit
for FY18, with focus on strong mobilisation of low-
cost deposit. Accordingly, performance as at 1Q
FY18 shows deposit growth of 4.9% to N718.5bn.
The deposits were fairly diversified, with the single
and twenty largest depositors accounting for 3.0%
and 21.3% of the book at FY17 respectively. Also,
maturity profile displayed a relatively short-dated
tenor, with 61.3% of the pool maturing in less than
three months.
Table 3: Deposit book characteristics
By Source: % By type: % Corporate 43.0 Demand 43.1
Individual 21.3 Savings 10.3
Public sector 8.9 Term 46.6
Financial Institution 26.8 Concentration:
Single largest 3.0 Ten largest 14.6
Five largest 9.6 Twenty largest 21.3
Maturity: <3 months 61.3 3-6 months 0.2
3-6 months 4.0 >1 year 34.5
Source: Sterling AFS.
Capital Structure
Table 4: Capitalisation FY16 FY17
N'bn N'bn
Tier 1 77.3 80.5
Tier 2 (1.9) 5.9
Total regulatory capital 75.4 86.5
Total risk weighted assets 675.9 708.1 RWCAR (%) 11.2 12.2
Source: Sterling AFS.
Sterling’s Shareholders’ funds grew by 20.2% to
N102.9bn, representing a compounded annual growth
rate of 12.9% over the review period (2013-2017),
underpinned by strong internal capital generation. As
a result, CAR increased to 12.2% at FY17 (FY16:
11.2%), exceeding the regulatory minimum by some
margin. To further strengthened capitalisation and
enhance operation, the bank intends to issue a new
tranche of the existing bond programme in 3Q FY18.
Borrowings The bank’s total borrowings grew significantly by
130.9% to N225.9bn at FY17. This liability pool
comprises various credit facilities secured from
financial institutions, including intervention funds
granted by Nigerian government-owned financial
institutions (Bank of Industry and CBN) under its
agriculture, power, aviation, micro, small and
medium enterprise and manufacturing sectors credit
schemes, for on-lending to qualified customers
(Table 5).
Table 5: Borrowings FY16 FY17
N'bn N'bn
Citibank 15.3 7.7
Bank of Industry 2.2 1.7
CBN Agricultural Fund 18.4 56.5
CBN State ECA 9.8 14.5
Standard Chartered Bank 24.5 11.8
Islamic Corporation 9.3 14.7
Nigeria Mortgage Refinance Company 1.7 1.6
CBN MSME 1.0 0.3
AFREXIM - 20.0
CBN (Fixed Tenor repo) - 84.2
Debt Securities 15.4 13.1
Total 97.8 225.9
Source: Sterling AFS.

Nigeria Bank Analysis | Public Credit Rating Page 5
Included in the outstanding borrowings at FY17 are
two 7-year debt securities issued by the bank in 2011
and 2016, with interest payable semi-annually at 13%
and 16.5% respectively.
Liquidity positioning
Sterling evidenced liquidity pressure during FY17,
with its statutory liquidity ratio falling short of the
minimum requirement at some points (recording
lowest ratio of 22.3% in August 2017), albeit
normalising at year end at 33.0% (April 2018:
43.6%). The matching of the bank’s asset and
liability maturities also reflected a negative liquidity
gap of N266.0bn (2.6x total shareholders’ funds) in
the less than 3 month maturity band, with cumulative
positive liquidity gaps displayed across the up to one
year maturity bands. However, (behaviorally)
substantial portion of deposits are usually rolled over
at maturity, coupled with the available credit lines
from other financial institutions offers some comfort
regarding liquidity risk severity.
Table 6: Net liquidity gap profile
<3 months
3-6 months
6-12 months
>1 year
N'bn N'bn N'bn
Assets 617.9 51.8 146.5 906.0
Liabilities (883.9) (23.4) (8.3) (115.1)
Net liquidity gap (266.0) 28.4 138.2 790.9
Cumulative liquidity gap (266.0) (237.6) (99.4) 691.5
Source: Sterling AFS.
Credit risk (strategic overview)
Risk management
The board’s risk management oversight is supported
by various management committees, which helps to
develop, implement and modify risk strategies. In a
bid to further strengthen its risk management
framework, the bank implemented a multi-faceted
risk management solution called “the Corporate Axe
Credit Portal”. This platform provides seamless risk
assessment, monitoring and control of credit
exposures to customers (especially commercial and
corporate customers).
Asset composition
Table 7: Asset mix FY16 FY17
N’bn % N’bn %
Cash and liquid assets 131.2 15.9 165.4 15.6
Cash 11.8 1.4 15.4 1.5
Liquidity reserve deposits 94.5 11.5 74.0 7.0
Treasury bills and bonds 1.7 0.2 6.9 0.7
Balances with other banks 23.3 2.8 69.1 6.5
Net loans and advances 468.2 56.8 598.1 56.6
Investments 93.0 11.3 104.1 9.8
Available for sale inv. 34.9 4.2 80.0 7.6
Held to maturity inv. 58.1 7.0 24.1 2.3
Property, Plant and Equipment 14.6 1.8 16.5 1.6
Pledged assets 86.9 10.5 145.2 13.7
Other assets 30.7 3.7 27.8 2.6
Total* 824.6 100.0 1,057.0 100.0
*Excludes balances held on behalf of customers in respect of letters of credit. Source: Sterling AFS.
Sterling’s total asset grew by 28.2% to N1.1tn at
FY17, underpinned largely by a rise in pledged assets
and expansion in net loans and advances which
increased by 27.7% to N598.1bn and accounted for a
relatively stable 56.6% (FY16: 56.8%) of total asset
mix at FY17. Similarly, cash and liquid asset grew by
26.1% to N165.4bn on the back of an increase in
interbank placements.
Overall, investment securities (largely comprising
risk-free federal government bonds and treasury bills)
increased by 11.9% to N104.1bn at FY17, as the
bank took advantage of the attractive yields on
government securities.
Loan portfolio
Gross loans and advances increased by 29.5% to
N617.6bn at FY17. While cognisance is taken of the
bank’s effort at diversifying loan portfolio across the
various economic sectors, a significant level of
concentration is maintained in the oil and gas albeit
accounting for a lower 40.7% of the loan book at
FY17 (FY16: 48.9%). Going forward, management
intends to shift lending focus to five priority sectors
which are; health, education; agriculture; renewable
energy; and transportation where some level of
business expertise has over time been built. The bank
however expects a conservative growth in loan book
(about 10%) in FY18, with emphasis mainly on
quality exposures.
A further analysis of the loan book reveals the bank
maintained a high level of concentration by obligor,
with the single largest obligor accounting for 4.4% of
gross loans (equating to 26.7% shareholders’ funds,
above regulatory limit of 20%), while the twenty
largest obligors represents 48.7% of the loan book at
FY17. The maturity profile of the loan book is
relatively long-dated, with 64.9% maturing after one
year.
Table 8: Loan book characteristics (%)
By sector: Agriculture 3.1 Transportation 3.3
Oil and gas 40.7 Manufacturing 1.1
Real estate and Construction 11.4 IT and Communication 2.8
Financial Institutions 9.5 Power 3.7
Government 11.3 Others 13.1
Largest exposures By Maturity:
Single largest 4.4 < 3 month 23.6
Five largest 17.8 3-6 months 4.6
Ten largest 30.1 6-12 months 7.0
Twenty largest 48.7 > 12 months 64.9
Source: Sterling AFS.
Contingencies
Off-balance sheet assets grew 17.8% to N131.1bn at
FY17, accounting for 11.0% of the total on and off-
balance sheet assets. These comprised; bonds,
guarantee and indemnities (72.5%), letter of credit
(19.9%), and Others (7.6%).

Nigeria Bank Analysis | Public Credit Rating Page 6
Asset quality
Sterling’s gross NPLs reduced by 18.8% to N38.5bn
at FY17, supported by enhancement of the bank’s
enterprise risk management framework, improved
risk profile of the oil and gas sector loan exposure
(which constitute a significant portion of loan book)
as well as active loan recovery effort, which resulted
in recovery of N4.7bn during the year. Consequently,
NPL ratio improved to 6.2% at FY17 (FY16: 9.9%)
and strengthened further to 6.0% at 1Q FY18, albeit
above regulatory threshold of 5%. Specific provision
coverage of NPLs improved to 35.8% at FY17 (FY16:
8.9%). It is noteworthy that a sizeable portion of
NPLs were skewed toward the oil and gas and
transportation sectors, constituting a combined 60.6%
of gross NPLs at FY17. Going forward, Management
expects to maintain a sound asset quality through
implementation of a strict loan selection and approval
process.
Table 9: Asset quality FY16 FY17
N’bn N’bn
Gross advances 476.7 617.6
Performing 429.3 579.1
Impaired 47.4 38.5 Provision for impairment (8.5) (19.5)
Individually impaired (4.2) (13.8)
Collectively impaired (4.3) (5.7)
Net NPLs 38.9 19.0
Select asset quality ratios (%):
Gross NPLs ratio 9.9 6.2
Net NPLs ratio 9.2 4.1
Net NPLs/Capital 43.7 21.3
Source: Sterling AFS.
Financial performance and prospects
A five year financial synopsis, together with
management accounts to 31st March 2018 is reflected
on page 7 of this report, supplemented by the
commentary below.
Sterling’s dependence on expensive funds exerted
pressure on margins, with net interest margin
shrinking 350 basis points to 8.4% in FY17, resulting
in a 10.4% decline in net interest income to N50.2bn
in FY17. Notwithstanding this, the bank’s total
operating income grew by 7.4% to N73.4bn in FY17,
on the back of a significant growth in non-interest
income which grew by 87.8% (largely supported by
increase in fee and commission income and trading
income). Sterling’s cost tightening measures (with
operating expenses increasing by a marginal 3.7%)
supported improved efficiency indicators, with the
cost ratio declining to 71.5% (FY16: 74.1%). Overall,
the bank achieved a 43.5% growth in pre-tax profit to
N8.5bn, translating to ROaA and ROaE of 9.0% and
0.9% (FY16: 5.7% and 0.6%) respectively.
The bank projects a pre-tax profit of N15.1bn in
FY18, representing 75.6% above FY17’s position.
According to management, total income is expected
to be driven by expansion in fees related income via
digital banking platform and other alternate channels.
The result at 1Q FY18 shows non-interest income
was in line with forecast, while pre-tax profit lags
full-year budget by 15.8% on an annualised basis.
The bank is however optimistic about achieving the
budgeted level given the relative stability in the
general operating environment.
Table 10: Budget FY18 vs. interim results
Actual FY17
Budget FY18
Actual 1Q-FY18
% of budget*
(N’bn) (N’bn) (N’bn)
Statement of comprehensive income
Net interest income 50.2 60.4 12.4 82.0
Other income 23.3 22.1 8.0 143.8
Total income 73.4 82.6 20.4 98.6
Impairment charge (12.3) (13.2) (1.3) 9.5
Operating expenses (52.5) (54.3) (15.9) 117.2
Profit before tax 8.6 15.1 3.2 84.2
Statement of financial position
Deposits 684.8 787.6 718.5 91.2
Advances 598.1 637.0 609.8 95.7
Total assets 1,057.0 1,263.6 1,039.2 82.2
Tier I capital 102.9 116.6 94.0 80.6
*All annualised, except impairment charge. Source: Sterling.

Nigeria Bank Analysis | Public Credit Rating Page 7
Year end: 31 December
Statement of Comprehensive Income Analysis 2013 2014 2015 2016 2017 1Q 2018
Interest income 69,973 77,932 80,909 99,104 110,318 31,804 Interest expense (34,160) (34,915) (41,367) (43,115) (60,137) (19,415) Net interest income 35,813 43,017 39,542 55,989 50,181 12,389 Other income 21,656 25,747 29,285 12,336 23,172 7,962 Total operating income 57,469 68,764 68,827 68,325 73,353 20,351 Impairment charge (8,259) (7,389) (8,151) (11,714) (12,267) (1,254) Operating expenditure (39,899) (50,627) (49,659) (50,611) (52,479) (15,922) Net profit before tax 9,310 10,748 11,016 6,000 8,607 3,175 Tax (1,035) (1,743) (724) (838) (85) (75) Net profit after tax 8,275 9,005 10,293 5,162 8,522 3,100 Other comprehensive income/(loss) (445) (836) 2,285 (12,477) 8,755 920
Total comprehensive income 7,830 8,169 12,578 (7,315) 17,277 4,020
Statement of Financial Position Analysis
Subscribed capital 38,668 57,154 57,154 57,154 57,154 57,154 Reserves (incl. net income for the year) 24,790 27,561 38,411 28,506 45,783 36,819 Hybrid capital (incl. eligible portion of subordinated term debt) 4,564 4,564 4,564 13,128 13,068 12,876 Total capital and reserves 68,021 89,279 100,129 98,788 116,005 106,849
Bank borrowings (incl. deposits, placements & REPOs) - - - 23,769 11,048 12,826 Deposits 432,263 655,751 590,696 580,330 680,430 718,496 Other borrowings 4,695 10,251 10,251 24,458 24,458 165,322 Short-term funding (< 1 year) 436,958 666,002 600,947 628,557 715,937 896,644
Deposits 138,248 193 193 4,404 4,404 -
Other borrowings 34,100 35,120 50,035 60,246 188,389 -
Long-term funding (> 1 year) 172,348 35,313 50,228 64,650 192,792 -
Payables/Deferred liabilities 19,249 27,127 45,082 32,636 32,264 35,715 Other liabilities 19,249 27,127 45,082 32,636 32,264 35,715
Total capital and liabilities 696,576 817,721 796,386 824,631 1,056,998 1,039,208
Balances with central bank 82,196 133,321 84,410 94,482 73,984 84,057 Property, plant and equipments 9,069 13,952 15,258 14,604 16,451 16,570 Derivative financial assets - - - 8 - - Receivables/Deferred assets (incl. zero rate loans) 96,661 100,680 91,212 117,548 172,992 100,412 Non-earnings assets 187,927 247,953 190,881 226,642 263,427 201,039
Short-term deposits & cash 8,190 10,778 16,232 11,780 15,404 13,586 Loans & advances (net of provisions) 321,744 371,246 338,726 468,250 598,073 609,791 Bank placements 80,894 91,173 81,015 23,327 69,105 65,295 Marketable/Trading securities 2,201 1,949 4,693 1,653 6,883 22,039
Equity investments 95,620 94,621 164,839 92,979 104,106 127,458
Total earning assets 508,649 569,767 605,505 597,989 793,571 838,169
Total assets† 696,576 817,721 796,386 824,631 1,056,998 1,039,208
Contingencies 201,629 203,843 166,245 111,260 131,106 173,828
Ratio Analysis (%)
Capitalisation
Internal capital generation 12.3 9.6 13.2 n.a. 16.8 4.3
Total capital / Net advances + net equity invest. + guarantees 11.0 13.3 14.9 14.7 13.9 11.7
Total capital / Total assets 9.8 10.9 12.6 12.0 11.0 10.3
Liquidity ‡
Net advances / Deposits + other short-term funding 55.9 55.7 56.3 74.0 83.0 68.0
Net advances / Total funding (excl. equity portion) 52.8 52.9 52.0 67.5 65.8 68.0
Liquid & trading assets / Total assets 13.1 12.7 12.8 4.5 8.6 9.7
Liquid & trading assets / Total short-term funding 20.9 15.6 17.0 5.8 12.8 11.3
Liquid & trading assets / Total funding (excl. equity portion) 15.0 14.8 15.7 5.3 10.1 11.3
Asset quality
Impaired loans / Gross advances 2.1 3.1 4.8 9.9 6.2 6.0
Total loan loss reserves / Gross advances 2.1 2.5 4.4 1.8 4.3 4.2
Bad debt charge (income statement) / Gross advances (avg.) 3.0 2.1 2.2 2.9 2.3 0.2
Bad debt charge (income statement) / Total operating income 14.4 10.7 11.8 17.1 16.7 6.2
Profitability
Net income / Total capital (avg.) 13.1 10.4 13.3 n.a. 16.1 3.6
Net income / Total assets (avg.) 1.2 1.1 1.6 n.a. 1.8 0.4
Net interest margin 10.6 9.7 8.7 11.9 8.4 7.0
Interest income + com. fees / Earning assets + guarantees (a/avg.) 6.3 5.7 5.2 8.0 6.2 1.3
Non-interest income / Total operating income 37.7 37.4 42.5 18.1 31.6 39.1
Non-interest income / Total operating expenses (or burden ratio) 54.3 50.9 59.0 24.4 44.2 50.0
Cost ratio 69.4 73.6 72.2 74.1 71.5 78.2
OEaA (or overhead ratio) 6.3 6.7 6.2 6.2 5.6 1.5
ROaEβ 15.0 12.2 11.4 5.7 9.0 12.6
ROaA 1.3 1.2 1.3 0.6 0.9 1.2
Nominal growth indicators
Total assets 22.8 17.4 (2.6) 3.5 28.2 (1.7)
Net advances 40.2 15.4 (8.8) 38.2 27.7 2.0
Shareholders funds 36.1 33.5 12.8 (10.4) 20.2 (8.7)
Total capital and reserves 32.8 31.3 12.2 (1.3) 17.4 (7.9)
Deposits (wholesale) 23.0 15.0 (9.9) (1.0) 15.9 4.9
Total funding (excl. equity portion) 22.5 15.1 (7.1) 6.5 31.1 (1.3)
Net income 8.7 4.3 54.0 (158.2) n.a (6.9)
† Excludes balances held in respect of letter of credit.
‡ Please note that for these ratios, liquid assets exclude the statutory reserve balance.
Sterling Bank Plc(Naira in millions except as noted)

Nigeria Bank Analysis | Public Credit Rating Page 8
SALIENT FEATURES OF ACCORDED RATINGS
GCR affirms that a.) no part of the ratings was influenced by any other business activities of the credit rating agency; b.) the ratings were based solely on the merits of the rated entity, security or financial instrument being rated; c.) such ratings were an independent evaluation of the risks and merits of the rated entity, security or financial instrument; and d.) the validity of the ratings is for a maximum of 12 months, or earlier as indicated by the applicable credit rating document.
The ratings were solicited by, or on behalf of, Sterling Bank Plc, and therefore, GCR has been compensated for the provision of the ratings.
Sterling Bank Plc participated in the rating process via face-to-face management meetings, teleconferences and other written correspondence. Furthermore, the quality of info received was considered adequate and has been independently verified where possible.
The credit ratings above were disclosed to Sterling Bank Plc with no contestation of/changes to the ratings.
The information received from Sterling Bank Plc and other reliable third parties to accord the credit rating included the latest audited annual financial statements as at 31 December 2017 (plus four years of comparative numbers), latest internal and/or external report to management, full year budgeted financial statements for 2018, most recent year-to-date management accounts to 31 March 2018, reserving methodologies and capital management policies. In addition, information specific to the rated entity and/or industry was also
received.
ALL GCR CREDIT RATINGS ARE SUBJECT TO CERTAIN LIMITATIONS, TERMS OF USE OF SUCH RATINGS AND DISCLAIMERS. PLEASE READ THESE LIMITATIONS, TERMS OF USE AND DISCLAIMERS BY FOLLOWING THIS LINK: HTTP://GLOBALRATINGS.COM.NG/UNDERSTANDING-RATINGS. IN ADDITION, RATING SCALES AND DEFINITIONS ARE AVAILABLE ON GCR’S PUBLIC WEB SITE AT HTTP://GLOBALRATINGS.COM.NG/RATINGS-INFO/RATINGS-SCALES-DEFINITIONS. PUBLISHED RATINGS, CRITERIA, AND METHODOLOGIES ARE AVAILABLE FROM THIS SITE AT ALL TIMES. GCR'S CODE OF CONDUCT, CONFIDENTIALITY, CONFLICTS OF INTEREST, COMPLIANCE, AND OTHER RELEVANT POLICIES AND PROCEDURES ARE ALSO AVAILABLE FROM THE UNDERSTANDING RATINGS SECTION OF THIS SITE. CREDIT RATINGS ISSUED AND RESEARCH PUBLICATIONS PUBLISHED BY GCR, ARE GCR’S OPINIONS, AS AT THE DATE OF ISSUE OR PUBLICATION THEREOF, OF THE RELATIVE FUTURE CREDIT RISK OF ENTITIES, CREDIT COMMITMENTS, OR DEBT OR DEBT-LIKE SECURITIES. GCR DEFINES CREDIT RISK AS THE RISK THAT AN ENTITY MAY NOT MEET ITS CONTRACTUAL AND/OR FINANCIAL OBLIGATIONS AS THEY BECOME DUE. CREDIT RATINGS DO NOT ADDRESS ANY OTHER RISK, INCLUDING BUT NOT LIMITED TO: FRAUD, MARKET LIQUIDITY RISK, MARKET VALUE RISK, OR PRICE VOLATILITY. CREDIT RATINGS AND GCR’S OPINIONS INCLUDED IN GCR’S PUBLICATIONS ARE NOT STATEMENTS OF CURRENT OR HISTORICAL FACT. CREDIT RATINGS AND GCR’S PUBLICATIONS DO NOT CONSTITUTE OR PROVIDE INVESTMENT OR FINANCIAL ADVICE, AND CREDIT RATINGS AND GCR’S PUBLICATIONS ARE NOT AND DO NOT PROVIDE RECOMMENDATIONS TO PURCHASE, SELL OR HOLD PARTICULAR SECURITIES. NEITHER GCR’S CREDIT RATINGS, NOR ITS PUBLICATIONS, COMMENT ON THE SUITABILITY OF AN INVESTMENT FOR ANY PARTICULAR INVESTOR. GCR ISSUES ITS CREDIT RATINGS AND PUBLISHES GCR’S PUBLICATIONS WITH THE EXPECTATION AND UNDERSTANDING THAT EACH INVESTOR WILL MAKE ITS OWN STUDY AND EVALUATION OF EACH SECURITY THAT IS UNDER CONSIDERATION FOR PURCHASE, HOLDING OR SALE. Copyright © 2018 Global Credit Rating Company Limited. THE INFORMATION CONTAINED HEREIN MAY NOT BE COPIED OR OTHERWISE REPRODUCED OR DISCLOSED , IN WHOLE OR IN PART, IN ANY FORM OR MANNER OR BY ANY MEANS WHATSOEVER, BY ANY PERSON WITHOUT GCR’S PRIOR WRITTEN CONSENT. The ratings were solicited by, or on behalf of, the issuer of the instrument in respect of which the rating is issued, and GCR has been compensated for the provision of the ratings. Information sources used to prepare the ratings are set out in each credit rating report and/or rating notification and include the following: parties involved in the ratings and public information. All information used to prepare the ratings is obtained by GCR from sources reasonably believed by it to be accurate and reliable. Although GCR will at all times use its best efforts and practices to ensure that the information it relies on is accurate at the time, GCR does not provide any warranty in respect of, nor is it otherwise responsible for, the accurateness of such information. GCR adopts all reasonable measures to ensure that the information it uses in assigning a credit rating is of sufficient quality and that such information is obtained from sources that GCR, acting reasonably, considers to be reliable, including, when appropriate, independent third-party sources. However, GCR cannot in every instance independently verify or validate information received in the rating process. Under no circumstances shall GCR have any liability to any person or entity for (a) any loss or damage suffered by such person or entity caused by, resulting from, or relating to, any error made by GCR, whether negligently (including gross negligence) or otherwise, or other circumstance or contingency outside the control of GCR or any of its directors, officers, employees or agents in connection with the procurement, collection, compilation, analysis, interpretation, communication, publication or delivery of any such information, or (b) any direct, indirect, special, consequential, compensatory or incidental damages whatsoever (including without limitation, lost profits) suffered by such person or entity, as a result of the use of or inability to use any such information. The ratings, financial reporting analysis, projections, and other observations, if any, constituting part of the information contained herein are, and must be construed solely as, statements of opinion and not statements of fact or recommendations to purchase, sell or hold any securities. Each user of the information contained herein must make its own study and evaluation of each security it may consider purchasing, holding or selling. NO WARRANTY, EXPRESS OR IMPLIED, AS TO THE ACCURACY, TIMELINESS, COMPLETENESS, MERCHANTABILITY OR FITNESS FOR ANY PARTICULAR PURPOSE OF ANY SUCH RATING OR OTHER OPINION OR INFORMATION IS GIVEN OR MADE BY GCR IN ANY FORM OR MANNER WHATSOEVER.