
Step and Touch Voltage Update for 2004 090804
23
Step and Touch Voltage – an update for 2004 Abstract: Hazardous step and touch voltages arise in a variety of high voltage electrical installations, and there are a number of different industry publications which publish acceptable step and touch voltage limits. This paper sets out the derivation of step and touch voltage limits based on the work of Dalziel and Biegelmeier and Lee, and AS/NZS 60479.1:2002. It then provides an outline of the different step and touch voltage limits used in current Australian guidelines, handbooks, and standards. There is a lack of consistent information available to utilities and designers to establish reliable step and touch voltage limits for different installations. This places the utilities and designers in a position of risk from litigation due to personal injury as the engineering models and guidelines in current use may not provide a robust defence. As a key step in risk management, this paper proposes further research to establish consistent and reliable step and touch voltage limits based on body shock currents, body impedance, and probability. Keywords: Step voltage, touch voltage, electric shock, electrocution, body shock current, body impedance. Author Biography Bruce Walsh BE (Hons1) F.I.E. Australia, CP Eng, NPER3, AIAMA Bruce Walsh is a Fellow of the Institution of Engineers of Australia who specialises in forensic electrical engineering. Drawing on his electrical trade background, Bruce has developed specialist expertise in the analysis of electric shock incidents and electrocutions, and a practical approach to prevention and safe work practices. Bruce has provided expert evidence for matters in most courts in Australia. Bruce is a Director of Ballengearry Consulting, a firm which provides project management, expert opinion services, and develops and presents in-house training courses for industry. With formal studies in Commercial Arbitration and Mediation, Bruce is often called on to act as an expert to determine matters in dispute, and brings a practitioner’s view to risk management.
-
Upload
tamador-hammash -
Category
Documents
-
view
398 -
download
4
Transcript of Step and Touch Voltage Update for 2004 090804

Step and Touch Voltage – an update for 2004 Abstract: Hazardous step and touch voltages arise in a variety of high voltage electrical installations, and there are a number of different industry publications which publish acceptable step and touch voltage limits. This paper sets out the derivation of step and touch voltage limits based on the work of Dalziel and Biegelmeier and Lee, and AS/NZS 60479.1:2002. It then provides an outline of the different step and touch voltage limits used in current Australian guidelines, handbooks, and standards. There is a lack of consistent information available to utilities and designers to establish reliable step and touch voltage limits for different installations. This places the utilities and designers in a position of risk from litigation due to personal injury as the engineering models and guidelines in current use may not provide a robust defence. As a key step in risk management, this paper proposes further research to establish consistent and reliable step and touch voltage limits based on body shock currents, body impedance, and probability. Keywords: Step voltage, touch voltage, electric shock, electrocution, body shock current, body impedance. Author Biography Bruce Walsh BE (Hons1) F.I.E. Australia, CP Eng, NPER3, AIAMA Bruce Walsh is a Fellow of the Institution of Engineers of Australia who specialises in forensic electrical engineering. Drawing on his electrical trade background, Bruce has developed specialist expertise in the analysis of electric shock incidents and electrocutions, and a practical approach to prevention and safe work practices. Bruce has provided expert evidence for matters in most courts in Australia. Bruce is a Director of Ballengearry Consulting, a firm which provides project management, expert opinion services, and develops and presents in-house training courses for industry. With formal studies in Commercial Arbitration and Mediation, Bruce is often called on to act as an expert to determine matters in dispute, and brings a practitioner’s view to risk management.
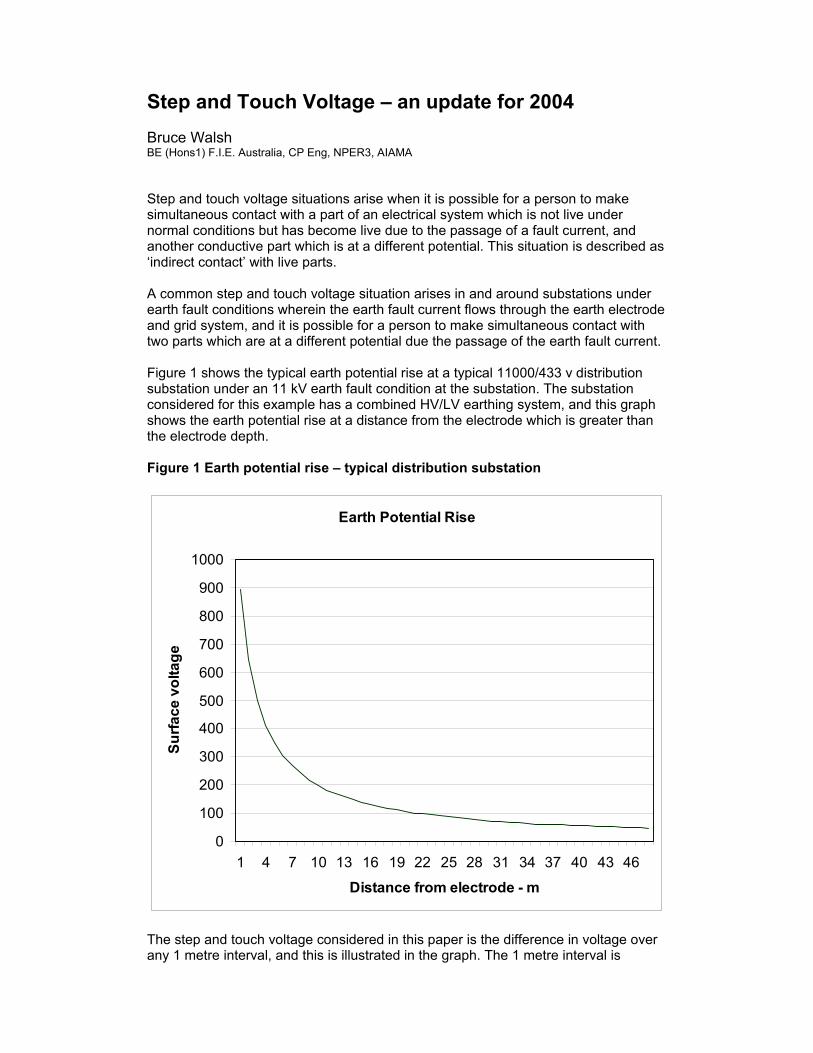
Step and Touch Voltage – an update for 2004 Bruce Walsh BE (Hons1) F.I.E. Australia, CP Eng, NPER3, AIAMA Step and touch voltage situations arise when it is possible for a person to make simultaneous contact with a part of an electrical system which is not live under normal conditions but has become live due to the passage of a fault current, and another conductive part which is at a different potential. This situation is described as ‘indirect contact’ with live parts. A common step and touch voltage situation arises in and around substations under earth fault conditions wherein the earth fault current flows through the earth electrode and grid system, and it is possible for a person to make simultaneous contact with two parts which are at a different potential due the passage of the earth fault current. Figure 1 shows the typical earth potential rise at a typical 11000/433 v distribution substation under an 11 kV earth fault condition at the substation. The substation considered for this example has a combined HV/LV earthing system, and this graph shows the earth potential rise at a distance from the electrode which is greater than the electrode depth. Figure 1 Earth potential rise – typical distribution substation
Earth Potential Rise
0
100
200
300
400
500
600
700
800
900
1000
1 4 7 10 13 16 19 22 25 28 31 34 37 40 43 46
Distance from electrode - m
Surfa
ce v
olta
ge
The step and touch voltage considered in this paper is the difference in voltage over any 1 metre interval, and this is illustrated in the graph. The 1 metre interval is

defined by the reach distance for an adult person (1m for touch) or the step distance for an adult (1m for step). These distances are defined in the appendices of AS 20671. The determination of earth potential rise is relatively straightforward, and the information is reasonably obtainable. The next step, is to determine if the step and touch voltages that result from the earth potential rise are acceptable. If not, then the designer will need to include mitigation measures, some of which may involve cost and systemic engineering constraints. For example, in customer’s installations AS/NZS 3000:2000 Clause 7.8.10.4.2 states that a combined HV/LV earthing system must have a resistance of 1 Ω, however, the resistance can be more then 1 Ω if the step and touch voltages are satisfactory. The question is ‘What is the acceptable step and touch voltage limit’. The step and touch voltage limits currently available have been derived over many years, and some of these limits have been modified with through improved information, or through the use of statistical approaches to risk management. This paper sets out some of the background to the current body of information on step and touch voltage limits, and discusses some of the engineering issues confronting engineers in 2004:
• Risk of litigation due to death/injury: The basis for engineering design needs to be robust and transparent to manage this risk. There is a significant risk of utilities and designers being prosecuted for failing to exercise a ‘duty of care’.
• Economic responsibility: There is a responsibility on planners and designers to develop strategies which balance the engineering and economic needs.
• Engineering risk assessment: Engineering planning and design is prepared with consideration of the risk of an event occurring. If a problem arises, then the risk assessment needs to be transparent and reliable.
In step and touch voltage situations there is a significant risk of harm to people, and this has been the subject of much debate and research over the years. There is insufficient data, however, as to the number and frequency of non fatal electric shock incidents. While there is some expectation that medically treated injuries are to be reported, there is some inconsistency in the extent of the utility and non-utility reporting systems. In the author’s experience, there is a community expectation for Coronial inquests and Workplace Health and Safety inspectors to question the diligence of the designers and utilities involved in an incident. This diligence extends to a hazard identification and risk assessment relating to the maintenance and operation of the part of the network or installation involved in the incident. In the author’s opinion, the electrical industry needs to publish a consistent package of information which identifies and quantifies the risks associated with designs prepared for step and touch voltage situations.
Physiological Harm This paper considers the threshold of physiological harm to humans when exposed to step and touch voltage limits at 50 Hz. It should be noted that different criteria are necessary for livestock, and also for humans and livestock when exposed to different frequencies.2 The passage of electrical current is measured in terms of quantum and duration. Physiological reactions to the passage of electrical current through the body range from minor muscular contractions, to ventricular fibrillation. The severity of these physiological reactions is situation dependent. That is, muscular contractions may cause ‘death by drowning’ for a person receiving a shock while fully immersed in a swimming pool, yet not be considered to be serious for a person standing on the concourse of the same swimming pool. Similarly a severe muscular contraction of very short duration may be unlikely to cause harm whereas the same current for a longer duration may cause ventricular fibrillation. It has been recognized that ventricular fibrillation is likely to lead to death, so much of the work relating to body shock currents has concentrated on the minimum current necessary to cause ventricular fibrillation. Larger currents are likely to cause cardiac arrest, respiratory failure, and burns. Dalziel and the threshold of fibrillation (1960) Dalziel sought to establish the threshold of fibrillation by conducting experiments on animals.2 Dalziel’s primary work involved dogs, and he referred to work by Kouwenhoven which included calves, sheep, dogs, cats, rabbits, pigs, and guinea pigs.3 The physiological response was measured for a current pathway between major extremities of the body. Dalziel’s work postulated that for shocks of 3 seconds duration, there was a correlation between body weight and fibrillating body shock currents for animals of the same species. Using graphical statistical analysis, and based on the results for fibrillating currents of 3 seconds duration, Dalziel developed a mathematical expression for the threshold of ventricular fibrillation to be:
tKI = mA (1)
Where I is the body shock current at the threshold of fibrillation t is the duration of the flow of that current K is a constant, which Dalziel determined (below) For 0.05% of a large population group, the minimum value for I, at 60 Hz, was found to be 95 mA for 70 kg body weight and 65 mA for 50 kg body weight. It is understood that this low percentage group was taken to represent people who may be more likely to suffer physiological harm as a result of a shock incident. That is, the elderly, the infirm, and children. From the experimental data, a value was found for K at 3 seconds:

165953 =×=K for 70 kg body weight (2) And Dalziel postulated a general expression:
tI 165%)05.0( = mA for 70 kg body weight (3)
Equation (3) provides a value for the lower threshold of fibrillating current in r.m.s. mA, and met with some controversy at the time. An expression was also developed for a 50% population group:
tI 446%)50( = mA for 70 kg body weight (4)
Dalziel recommended against using this value for any safety analysis as the probability of ventricular fibrillation was too great. A mathematical expression for the energy required to produce fibrillation is found by squaring equation (1):
tKI2
2 = (5)
And then transposing and multiplying by body resistance Rb :
bb RKtIREnergy 22 == watt.seconds (6) The value of Rb was taken to be 500 Ω, and the lower value of energy required to produce fibrillation was found to be 13.6 watt seconds (1652x10-3X500) for 70 kg body weight. The limits of the experimental data were 8.3 ms to 5 s. From the data provided by the Kouwenhoven experiments (published in1959) and analyzed by Dalziel, it is obvious that some of the animals were defibrillated and retested several times. The implications of multiple fibrillation and defibrillation events were not recorded or identified at the time. Dalziel identified that it was likely that fibrillation was a biological outcome and that fibrillation was determined by factors in addition to the quantum and duration of body shock currents, but had importantly established a relationship between body weight, shock current duration, and time. Biegelmeier and Lee and the heart cycles (1980) 20 years after Dalziel, Biegelmeier and Lee provided further analysis and explanation of the experiments to establish the threshold of fibrillation in humans.4 Biegelmeier and Lee postulated that there was a relationship between fibrillating currents and the timing of the heart cycle.
The following explanation of fibrillation due to shock current has been extracted from the Biegelmeier and Lee paper.
“Ventricular fibrillation is caused when an electrical stimulus of sufficient strength strikes the heart in the vulnerable period. This period which is represented in the electrocardiogram by the T-wave, is characterized by a non-homogeneity or differences in the refractoriness of the heart fibres. Only then can fibrillation be initiated, and it is self sustained by cyclic excitations. Fibrillation of the ventricles (the main pumping chambers) is accompanied by a loss of coordinated muscular contraction and the heart muscle quickly becomes exhausted and, if the condition is not soon corrected, an irreversible standstill of the heart occurs.” Quoting from an earlier paper by Ferris et al: “It is well known to physiologists that an external stimulus during diastole can cause a premature heart beat known as a ‘extrasystole’. This premature beat will have a ventricular contraction and relaxation similar to those of a normal heart beat, although smaller in magnitude and duration. The relaxation corresponds to the partial refractory phase of the normal cycle. This suggests that extrasystoles were caused in these cases with consequent advancement in time of the partial refractory phase, thereby bringing about fibrillation even though the shock would not have been long enough to reach the normal partial refractory phase.”
If an a.c. shock current occurs during ‘systole’ and the body shock current is low, then nothing happens. This is at a time in the heart cycle when the ventricle is refractory to stimulus.
If the shock current continues into the diastole period then a premature beat is initiated. This is during the time of relaxation and filling of the ventricles. If the shock occurs during diastole, a premature heart beat is immediately initiated. However the threshold of fibrillation for this first premature beat is approximately the same as for the normal heart beat. Only if the shock lasts long enough to produce a second response is the threshold of fibrillation lowered. It is interesting to note that the duration of the first extrasystole is approximately one third of that of one normal heart beat. If the a.c. shock continues so as to cause more premature beats the threshold of ventricular fibrillation is progressively lowered until it approaches the excitation threshold in diastole.
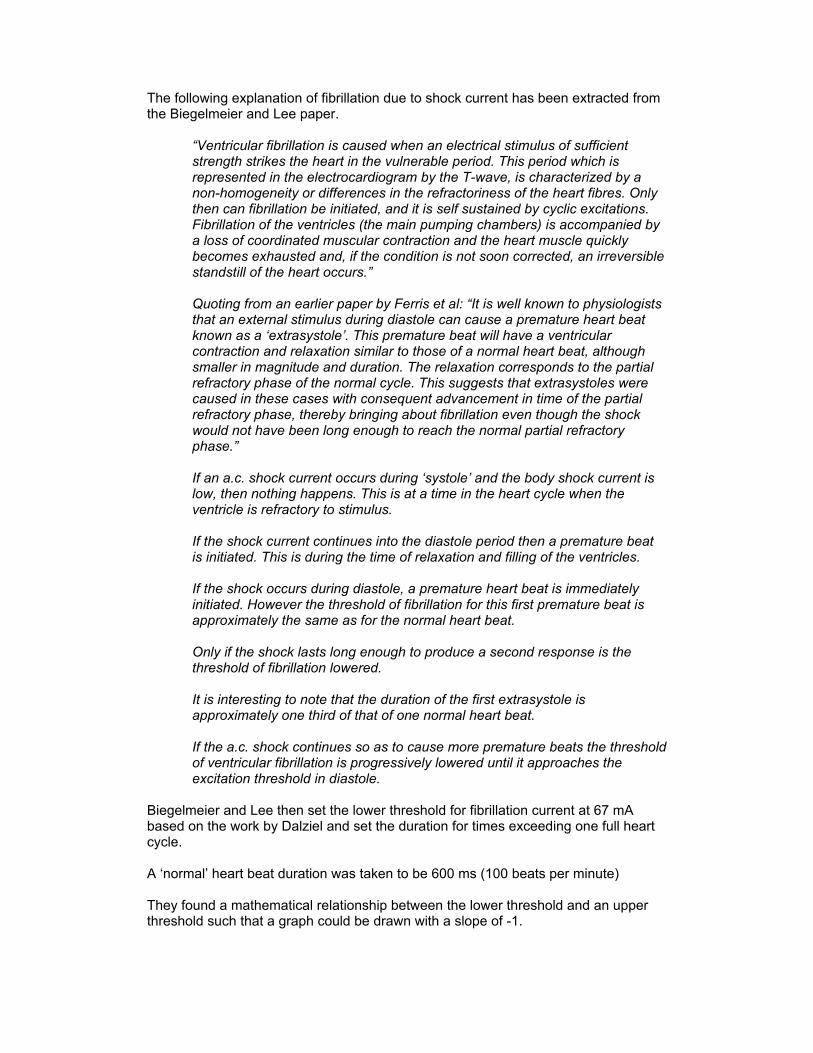
Biegelmeier and Lee then set the lower threshold for fibrillation current at 67 mA based on the work by Dalziel and set the duration for times exceeding one full heart cycle. A ‘normal’ heart beat duration was taken to be 600 ms (100 beats per minute) They found a mathematical relationship between the lower threshold and an upper threshold such that a graph could be drawn with a slope of -1.
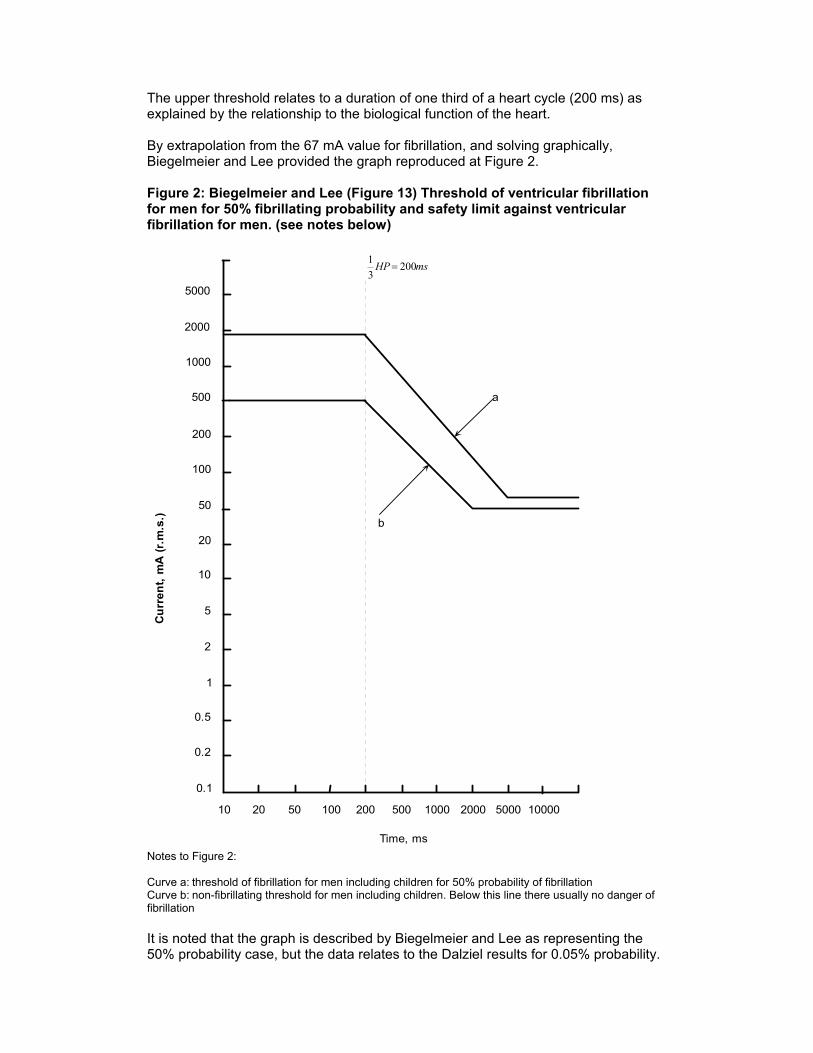
The upper threshold relates to a duration of one third of a heart cycle (200 ms) as explained by the relationship to the biological function of the heart. By extrapolation from the 67 mA value for fibrillation, and solving graphically, Biegelmeier and Lee provided the graph reproduced at Figure 2. Figure 2: Biegelmeier and Lee (Figure 13) Threshold of ventricular fibrillation for men for 50% fibrillating probability and safety limit against ventricular fibrillation for men. (see notes below)
msHP 20031
=
Cur
rent
, mA
(r.m
.s.)
0.1
0.2
0.5
1
2
5
10
20
100
200
500
Time, ms
10 20 50 100 200 500 1000 2000 5000 10000
50
1000
2000
5000
a
b
Notes to Figure 2: Curve a: threshold of fibrillation for men including children for 50% probability of fibrillation Curve b: non-fibrillating threshold for men including children. Below this line there usually no danger of fibrillation It is noted that the graph is described by Biegelmeier and Lee as representing the 50% probability case, but the data relates to the Dalziel results for 0.05% probability.
The author suggests that this is a typographical error in the Biegelmeier and Lee paper, and that these curves relate to 0.05% probability. Biegelmeier and Lee proposed that a safety margin should be used and assigned a non-fibrillating threshold of 500 mA for shocks of duration of less than 200ms decreasing to 50 mA for shock durations exceeding 2 s. From this graphical approach, Biegelmeier and Lee suggested that:
• Body shock currents exceeding 500 mA but with a duration less than one third of a heart period (200 ms) had a 30% probability of causing death which may explain why only 30% of people struck by lightning die.
• Body shock currents above 200 mA were only likely on high voltage installations or under lightning conditions. This assessment was based on a body impedance of 1000 Ω.
• Low voltage safety devices could be set as high as 200 mA with a tripping time of 500ms and still satisfy the requirements of curve b in Figure 2.
• Low voltage residual current devices on branch circuits should be set at 30 mA.
• Low voltage residual current devices for fixed appliances or whole installations should be set at 100 mA and with a disconnection time less than 500ms.
Biegelmeier and Lee went on to conduct limited experiments on human subjects for hand to hand body shock currents to determine the threshold of muscular cramping. AS/NZS 60479.1 and Body shock currents Australian Standard AS/NZS 60479:20015 supersedes AS 3859-1991 ‘Effects of current passing through the human body’. Both of these standards are based on IEC 60479 and the latest version of that standard is 1994. The standard is intended to provide guidance on the effects of shock currents on the human body for use in the establishment of electrical safety parameters. AS/NZS60479:2001 notes that it is based on the results of experiments on animals and clinical observations, and further that only a few experiments have been carried out on living human beings. The standard does not address the broader topics of risk assessment and the probability of a human coming into contact with live parts. While the effect of current passing through the human body is the ultimate limiting criteria, a practical approach is to consider the voltage which will cause the current to flow. This is limited by the internal impedance of the human body, and the impedance of the surface contact areas The internal impedance of the human body is considered to be mostly resistive. Skin impedance comprises resistance and capacitance in a semi-insulating layer. As the current increases, the skin impedance decreases. At voltages above 50 V, skin impedance decreases considerably and becomes negligible when the skin breaks down and then the overall body impedance approaches the internal impedance.

Table 1 has been repeated from AS/NZS 60479.1:2001 and illustrates the total body impedance for live humans, with surface areas of contact of 5,000mm2 to 10,000mm2, corresponding to a range of hand sizes. Table 1 – Total body impedance ZT for a current path hand to hand a.c. 50/60 Hz, for large surface areas of contact. (from AS/NZS 60479.1:2001)
The internal impedance of the human body depends on the current path and this can be determined from Figure 3 and Table 1. Figure 3 – Internal impedances of the Human Body (AS/NZS 60479.1:2001)
From this diagram it can be determined that a path from one hand to both feet indicates an internal impedance approximately 75% of the impedance which would
have been measured from hand to one foot, and is approximately 1.25 times the impedance which would have been measured from hand to hand. For a 50% population sample at high voltage, the hand to hand body impedance is taken from Table 1 to be 750 Ω, and from Figure 3, the hand to foot impedance is ~940 Ω, and the hand to both feet impedance is ~700 Ω. The impedance of the skin and the contact areas need to be added to the internal impedance to calculate the total body impedance. At voltages above 220 V the skin breaks down and the impedance due to the contact surface area becomes negligible (1 to 10 Ω), thus at high voltage the body impedance is ~700 Ω. The other impedances to be considered are those external to the body, for example:
• Shoes • Gloves • Insulating mats • High resistance layers (e.g. gravel)
From this information it is possible to predict the limits of touch voltage before significant physiological harm is based on body shock currents. IEC 60990:1999 ‘Methods of measurement of touch current and protective conductor current’ 6refers to the body shock currents and impedance models of IEC 60479.1, then adopts 500 Ω as a model body impedance to establish the thresholds of ‘perception’1 and ‘the inability to let go’2 and ‘non fibrillating physical harm’3, under body shock current conditions. This standard includes the test and measurement models to establish thresholds and would be particularly useful for further research into step and touch voltage limits for different applications. AS/NZS 60479.1 has provided an update on the work of Biegelmeier and Lee, and this is shown in Figure 4, (repeated from AS/NZS 60479.1 Fig 14).
1 The reaction threshold has been found to be 0.5mA r.m.s on average. 2 The let go current has been found to be 10mA r.m.s on average, but as low as 5mA for the adult population 3 Skin burns at a current density of 300 to 400 mA r.m.s/cm2
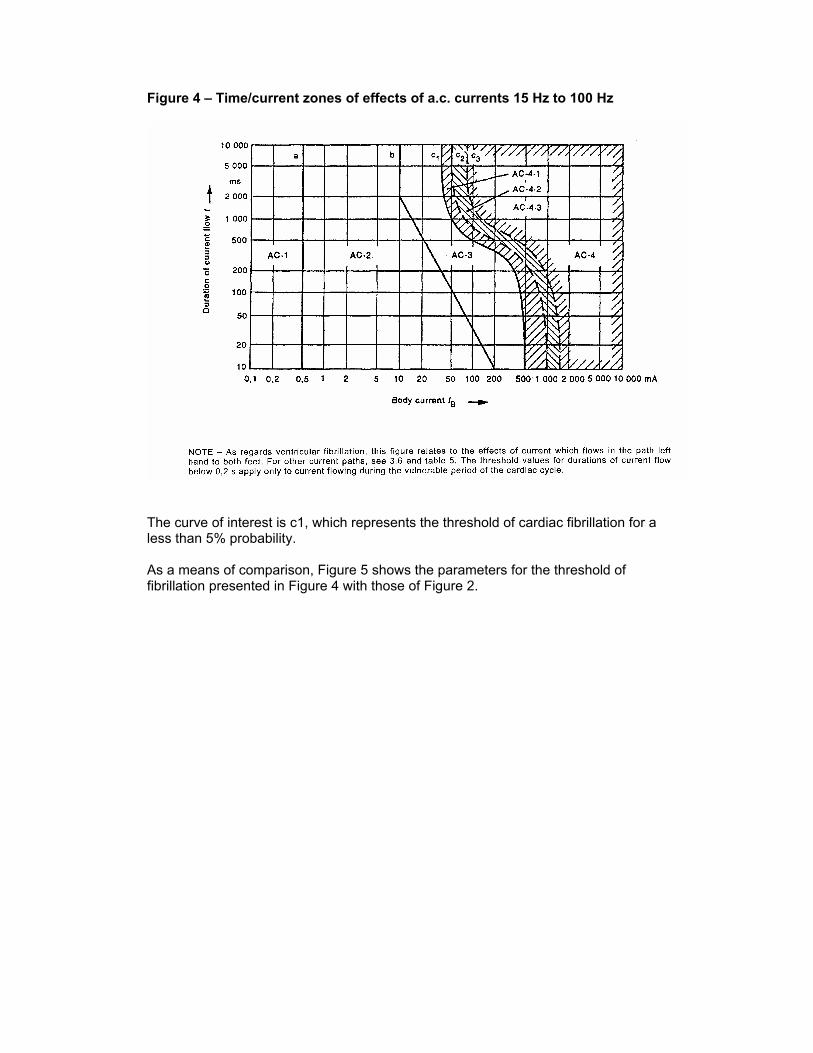
Figure 4 – Time/current zones of effects of a.c. currents 15 Hz to 100 Hz
The curve of interest is c1, which represents the threshold of cardiac fibrillation for a less than 5% probability. As a means of comparison, Figure 5 shows the parameters for the threshold of fibrillation presented in Figure 4 with those of Figure 2.

Figure 5 – Comparison between AS/NZS 60479.1:2001 and Biegelmeier and Lee curves a and b (refer to Figure 2).
msHP 20031
=C
urre
nt, m
A (r
.m.s
.)
0.1
0.2
0.5
1
2
5
10
20
100
200
500
Time, ms
10 20 50 100 200 500 1000 2000 5000 10000
50
1000
2000
5000
a
b
AS/NZS 60479.1 Fig 14 c1
This comparison shows that there is a close correlation between the work of Biegelmeier and Lee in determining the threshold of fibrillation, however the fibrillation threshold body shock currents have decreased over time. The AS/NZS 60479.1 curve may appear to be more conservative than those of Biegelmeier and Lee, however, the curve results from more extensive tests, including those carried out on living humans and cadavers, and relates to a defined body current path. The earlier experiments by Biegelmeier and Lee related only to tests between extremities and did not specifically record body current paths. AS/NZS 60479.1 provides a further method for determining the effect on the heart for current paths other than left hand to both feet as shown in Figure 4. This method uses a heart current factor where:

FI
I refh = (7)
where Iref is the body current for the path left hand to feet as shown in Figure 4 Ih is the body current for the paths given in Table 2 F is the heart current factor for the paths given in Table 2 Table 2 – Heart current factor F for different current paths (From AS/NZS 60479.1)
The heart current factor method shows that the body impedance is not the sole method for determining the likely threshold of fibrillation. That is, if a body impedance ‘hand to both feet’ of 1000 Ω is considered with a fibrillation threshold of 500 mA for 100ms, then this might be acceptable for that body current path. However, for a body current path hand to hand, the likely threshold of fibrillation is 1250mA (500/0.4) for 100ms, and the corresponding body impedance is 800 Ω. From the work of AS/NZS 60479.1, it is logical for designers to consider the case of a current path of ‘hand to both feet’, as this is both a ‘worst case’ body path, and one of the most likely scenarios to be encountered in practice. Figure 6 shows the touch voltage limits for a body current path of hand to feet and a total body impedance of 750 Ω, corresponding to 50% of the population at high voltage based on a mathematical expression
BBT RiV = (8) Where VT is touch voltage limit applicable to a body shock current iB and for a body impedance RB (for a defined current path – threshold of fibrillation).

Figure 6 - Touch Voltage limits for hand to feet and total impedance 750 Ω.
Touch Voltage Limits
0
50
100
150
200
250
300
350
400
10 20 50 100 200 500 1000 2000 5000 10000
Time (ms)
Touc
h Vo
ltage
(V)
Figure 7 shows the same body current path of hand to both feet, with a total impedance of 1000 Ω. Figure 7 - Touch Voltage limits for hand to feet and total impedance 1000 Ω.
Touch Voltage Limits
0
100
200
300
400
500
600
10 20 50 100 200 500 1000 2000 5000 10000
Time (ms)
Touc
h Vo
ltage
(V)
These figures show the impact on the acceptable limits for step and touch voltages when a probability assessment is made on the single issue of body impedance. That is, if a high value of body impedance is assumed, then the step and touch voltage limit will be higher, at least for faults with a duration of less than 200 ms.

There are two (2) recent Australian publications which set out step and touch voltage limits which are discussed in the following sections. ESAA EG-1:2000 Substation Earthing guide This publication7 provides touch and step voltage limits in accordance with IEEE 80 based generally on the work by Dalziel, summarized as follows: The basic equation for a body shock current is given by
BTh
Thb RZ
VI
+= where (9)
Ib is the body current, VTh is the step or touch voltage, ZTh is the body contact impedance, and RB is the body resistance. From the general formula for the ground resistance of a metallic disc
bR
4ρ
= (10)
where ρ is the soil resistivity and b is the radius of a metallic disc, the limiting equations for step voltage (Estep) and touch voltage Etouch) become
)6( ρ+= bBstep RIE (11)
)5.1( ρ+= bBtouch RIE (12) And for a thin layer of surface material, the ground resistance of the foot on the surface material Rf is given by
ss
f Cb
R
=4ρ
(13)
Where, Cs is a reduction factor due to the surface thickness and type of surface material. ρs is the resistivity of the surface material and is 1 when the crushed rock resistivity is equal to the soil resistivity. And the general equations become
)6( ssbBstep CRIE ρ+= (14)
)5.1( ssbBtouch CRIE ρ+= (15) The value of IB has been taken from Dalziel’s general equation for shock energy
sB t
kI = Amps (16)
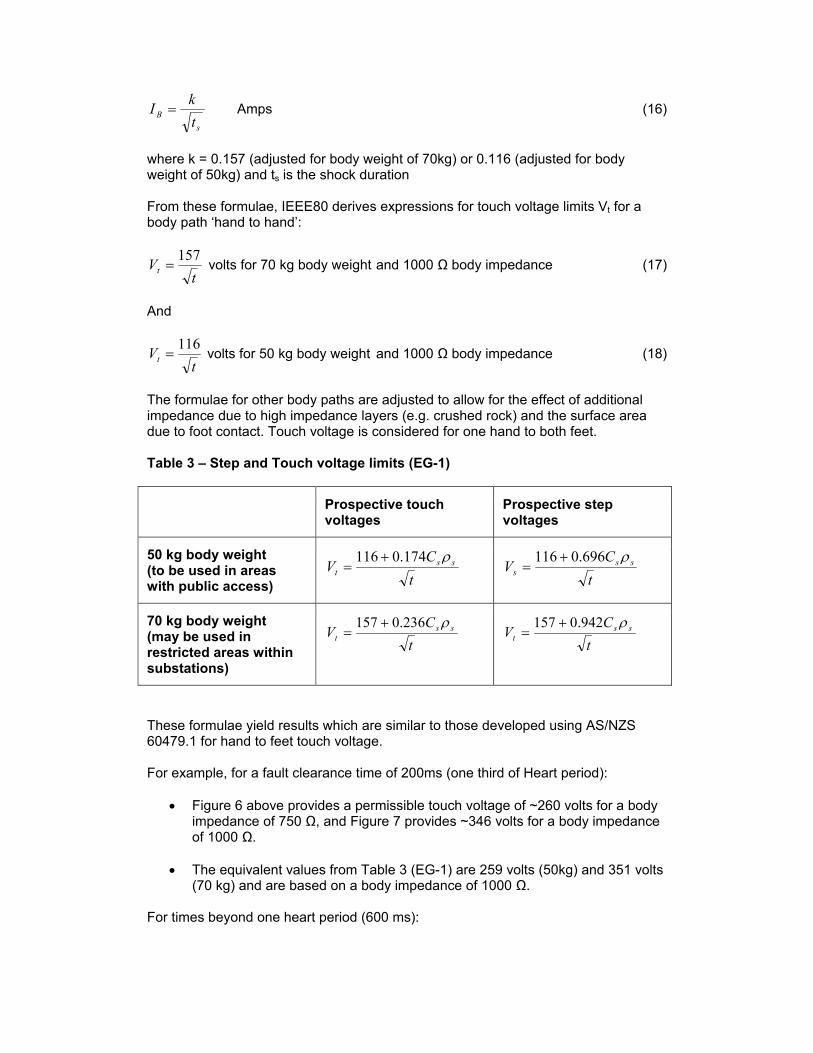
where k = 0.157 (adjusted for body weight of 70kg) or 0.116 (adjusted for body weight of 50kg) and ts is the shock duration From these formulae, IEEE80 derives expressions for touch voltage limits Vt for a body path ‘hand to hand’:
tVt
157= volts for 70 kg body weight and 1000 Ω body impedance (17)
And
tVt
116= volts for 50 kg body weight and 1000 Ω body impedance (18)
The formulae for other body paths are adjusted to allow for the effect of additional impedance due to high impedance layers (e.g. crushed rock) and the surface area due to foot contact. Touch voltage is considered for one hand to both feet. Table 3 – Step and Touch voltage limits (EG-1)
Prospective touch voltages
Prospective step voltages
50 kg body weight (to be used in areas with public access) t
CV sst
ρ174.0116 +=
tC
V sss
ρ696.0116 +=
70 kg body weight (may be used in restricted areas within substations)
tC
V sst
ρ236.0157 +=
tC
V sst
ρ942.0157 +=
These formulae yield results which are similar to those developed using AS/NZS 60479.1 for hand to feet touch voltage. For example, for a fault clearance time of 200ms (one third of Heart period):
• Figure 6 above provides a permissible touch voltage of ~260 volts for a body impedance of 750 Ω, and Figure 7 provides ~346 volts for a body impedance of 1000 Ω.
• The equivalent values from Table 3 (EG-1) are 259 volts (50kg) and 351 volts
(70 kg) and are based on a body impedance of 1000 Ω. For times beyond one heart period (600 ms):
• The AS/NZS 60479.1 methodology described in this paper yields ~ 50 Volts for a body impedance of 750 Ω and 66 Volts for a body impedance of 1000 Ω.
• The equivalent values from Table 3 (EG-1) are 149 volts (50kg) and 202 volts
(70 kg) based on a body impedance of 1000 Ω. While the values provided by the Table 3 (EG-1) formulae are higher than those predicted using the AS/NZS 60479.1 method, they are reasonably consistent in the approach. The difference between the 2 methods is the low value of current adopted by AS/NZS 60479.1 for shock durations greater than 1 second. The probability of a person being exposed to a step or touch voltage situation is higher than in some other applications and environmental conditions than in others. For example, it is unlikely that a person would come into contact with a concrete pole in a remote rural area under earth fault conditions. The calculation of probability and risk management is one which needs to be addressed by utilities and designers and is discussed below. The work by Dalziel, Biegelmeier and Lee, and AS/NZS 60479.1 focuses on the body currents likely to cause fibrillation. The work in IEEE80 and EG-1 provides further guidance in the application of step and touch voltage limits to ensure that electrical systems are designed to prevent fatal electric shock incidents. That is, the formulae used are based on body shock currents below those likely to cause fibrillation. In the absence of tests carried out on humans to establish the threshold of fibrillation, the best information available to the industry relies on tests on animals, and tests on humans with regard to muscular contractions. AS/NZS 60479.1 provides updated information on the impedance of the human body at different voltages, with these tests conducted on cadavers. The question remains with regard to probability. ‘What is the probability of an incident occurring when a person is present, and what is the probability of a shock current being of sufficient magnitude to cause a fatal electric shock’? The second part of that probability question was provided by Biegelmeier and Lee in their work on heart physiology. They found that the probability of a fibrillating current occurring in the first one third of the heart cycle (200 ms) was 30%. The first part of the probability question is much more difficult to determine, and has a significant legal risk attached. In the first instance, there is a lack of published probability formulae and data for the electrical industry. In the second instance, the author questions if the risk management approach applied through the use of probability would be accepted by any coronial enquiry as a defence. In the author’s experience, the general public, and the coroner’s courts generally have a high expectation of the utility to provide a safe electrical system. In the author’s experience, a coroner might accept that a person approached a conductor, and came into contact with it, and that high voltage protection systems cannot detect and disconnect on that type of direct contact. However, there is a

community expectation that the utility network or installation will not harm an innocent bystander. Handbook HB C(b)1:2003 Guidelines for design and maintenance of overhead distribution and transmission lines. ESAA Handbook C(b)18 provides a guide to prospective touch voltages which is explained in Appendix H. The handbook expresses a view that Biegelmeier and Lee and AS/NZS 60479 are unduly conservative and that compliance would be unachievable at any realistic cost. Figure 7 – Prospective touch voltage (from HB C(b)1:2003)
It is noted that step voltages should not exceed twice the value of the touch voltages in Figure 7. Curve A1: This curve aligns with those of Biegelmeier and Lee if a total body impedance of 1000 Ω is considered. The handbook states that a current of 60 mA has been used for faults with a duration exceeding 2 seconds. The curve is to be used as the upper limit for lines operating at not more than 66 kV in special locations. Special locations means within a school grounds or a swimming pool area. Curve A2: This curve is based on Dalziel’s prediction of an upper limit on the threshold of fibrillating current. The curve could also be compared to Biegelmeier and Lee for a total body impedance of 2000 Ω. This curve is used for lines operating in excess of 66 kV in special locations.

Curve B1: This curve is based on a corrected value for body shock current to take body weight into account, and generally follows the Biegelmeier and Lee curve but assumes a total body impedance of 8000 Ω. This curve is used for lines operating at not more than 66 kV in frequented locations. Curve B2: This curve generally follows the Biegelmeier and Lee curve but assumes a total body impedance of 16,000 Ω. This curve is used for lines operating at more than 66 kV in frequented locations. HB C(b)1 appears to have taken a risk and probability based approach to step and touch voltages. The handbook identifies that utilities should comply with EG-1 in the vicinity of substations. HB C(b)1 is used by many utilities and other organizations as a guide for compliance, and it is the author’s view that designers and operators need to be aware of the risk associated with the use of the step and touch voltages proposed. The compliance risk lies in the publication and adoption of AS/NZS 60479.1 and the legal argument that can flow in any coronial enquiry. For example, AS/NZS 60479 has established through testing that the impedance of the human body at voltages above 5 kV approaches an asymptotic value of 650 Ω for 5% of a large population group. EG-1 states that studies have shown that it is prudent to neglect the effect of shoe and glove impedance, especially at locations such as recreational and camping areas, and adopts a body impedance of 1000 Ω. The risk management and incident probability approach implemented through HB C(b)1 appears to be directed at the transmission and distribution network assets rather than the utility exposure to litigation. In terms of the probability of physiological harm resulting from step and touch voltages, the following probability models appear to have been included in the touch voltage curves:
a) Curves A1 and A2 are consistent with a 30% probability of fibrillation occurring for a body shock current of up to 200ms.
b) Curve A1 is consistent with a probability of fibrillation occurring for 0.05% of a large population group.
c) Curve A1 is consistent with a body impedance of 1000 Ω and this relates to 50% of a large population group.
d) Curve A2 is consistent with the upper limit of Dalziel’s fibrillation currents for 50% of a population group.
Curves B1 and B2 do not relate to the available information relating to body shock currents and body impedances. Where these curves are used, utilities considering litigation risk need to document and verify the probability models used.

Practical solutions As with all mature industries, new methods need to be found to meet the changing needs of the community. To reduce step and touch voltages to manageable levels, there are some traditional methods:
• Install a grading ring at 1m from the equipment to provide an equipotential zone ( consider the step voltage issues as well).
• Use Neutral/Earthing impedances at zone substations to reduce the earth fault currents for ‘close to substation’ faults.
• Overhead earth wires to split/redirect the earth fault current for ‘close to substation’ faults.
• Reduce the earth fault clearance time • Introduce impedance between the person and the source voltage
With the introduction of concrete poles, there are new hazards in the community. Traditional timber poles (non CCA) provided a degree of insulation, and little danger arose from step or touch voltages arising from an insulator fault on a pole. The resistance of a concrete pole to a remote earth is predictable and measurable, and values in the order of 8 Ω have been measured on typical structures in good soil conditions. Under an insulator fault condition, the pole becomes an electrode, and there is a touch and step voltage issue at the base of the pole. Figure 8 illustrates the earth potential rise adjacent to a concrete pole under earth fault conditions.

Figure 8 Earth Potential Rise adjacent to a 66 kV concrete pole
Earth Potential Rise
0
2000
4000
6000
8000
10000
12000
14000
16000
18000
1 4 7 10 13 16 19 22 25 28 31 34 37 40 43 46
Distance from electrode - m
Surfa
ce v
olta
ge
The touch and step voltages arising in Figure 8 are not acceptable as these represent a significant risk to people and property. There are several solutions possible for this scenario:
• Grading ring at ~1m from the base of the pole • High resistance material extending 1m from the base of the pole • Insulating material extending 1m from the base of the pole • Insulating material on the pole to a height of 2.4m
Improving the earthing resistance of the pole is not suggested as a ‘general approach’, as there is an engineering assessment needed. The engineering calculations show that as the earthing resistance is reduced, the earth fault current increases, and when the soil conditions are considered the touch and step voltages may not have changed enough to meet compliance in spite of the work carried out.

Summary and further work The work of Dalziel and Biegelmeier and Lee has contributed substantially to the body of work which has been incorporated into AS/NZS 60479.1. The recommendations and guidelines provided by EG-1, IEEE80, and Handbook HB C (b)1 Touch Voltage curve A1 are consistent with AS/NZS 60479.1, and include probability models which represent 0.05% of a large population group. Where utilities elect to apply Handbook HB C (b)1 Touch Voltage curves A2, B1 and B2, then the author recommends that the utilities document the probability models used. It should be noted that the probability of fibrillation occurring is 30% at 500 Volts, for a 1000 Ω body impedance. Further detailed work is necessary to establish consistent and reliable step and touch voltage limits for different applications. Body shock currents and the fibrillation threshold need to be modeled, and the latest computerised biological modeling techniques should make this possible. There needs to be research undertaken to establish the incidence of fault currents and the presence of people, as shock incidents are not necessarily investigated and recorded to the extent necessary to establish root cause. Training may be needed for those personnel assigned to investigate incidents to establish a consistent investigation and reporting methodology. It is recommended that probability models are established for different installation conditions. For example:
• Distribution substations • Overhead feeders – bare conductor – rural and urban • Overhead feeders – Aerial Bundled Conductor – rural and urban • Underground feeders • Zone substations • Subtransmission feeders – rural and urban • Transmission feeders – rural and urban
From an engineering view, earth potential rises will occur under earth fault conditions and these may present a hazard to people in the vicinity through step and touch voltage situations. In the author’s opinion, utilities and designers are exposed to a high risk of litigation until this level of research is applied and adopted as a published code of practice.
References 1 AS 2067-1984 Switchgear assemblies and ancillary equipment for alternating voltages above 11 kV. 2 Dalziel CF. Threshold 60 cycle fibrillating currents. AIEE transactions on power apparatus and systems v 79, n 50, Part 3(60-40):667-673 Oct 1960. 3 Kouwenhoven WB, Knickerbocker GG, Chestnut RW, Milnor WR, Sass DJ. AC shocks on varying parameters affecting the heart. Ibid., pt I (Communications and electronics) vol. 78, May 1959, pp 163-69. 4 Biegelmeier G, Lee WR. New considerations on the threshold of ventricular fibrillation. IEEE Proceedings Vol 127, No 2, Pt A, March 1980. 5 Australian Standard AS/NZS 60479:2001 ‘Effects of current on human beings and livestock’ 6 IEC 60990 ‘Methods of measurement of touch current and protective conductor current 7 ESAA EG-1:2000 Substation Earthing Guide 8 Handbook HB C(b)1:2003 Guidelines for design and maintenance of overhead distribution and transmission lines.


