Stemming the Tide · paradigm shift in the state’s approach to corrections. Usually when thinking...
27
Stemming the Tide e Racial and Economic Impacts of West Virginia’s Prison System February 2012
Transcript of Stemming the Tide · paradigm shift in the state’s approach to corrections. Usually when thinking...
Stemming the TideThe Racial and Economic Impacts of West Virginia’s Prison System
February 2012
Acknowledgments
This report was supported by a generous grant from the W.K. Kellogg Foundation.
Contributors
Elizabeth Paulhus is a Policy Analyst with the West Virginia Center on Budget and Policy.
Rick Wilson is the Area Director of the West Virginia Economic Justice Program for the American Friends Service Committee.
Sunny Thomson was a summer Research Associate at the West Virginia Center on Budget and Policy.
Reverend James Patterson is the Executive Director of the Partnership for African American Churches.
Beth Spence is the Program Coordinator of the West Virginia Economic Justice Program for the American Friends Service Committee.
The contributors thank the West Virginia Division of Corrections staff who provided data and information on the prison system, as well as the staff at the West Virginia State Archives who assisted in locating old annual reports and other files on the corrections system.
Special thanks go to George Castelle, Kanawha County Chief Public Defender,Alyson Clements from the American Civil Liberties Union of West Virginia, and Ted Boettner, Executive Director of the WVCBP, for their insights and input into the format and content of this report.
Layout and design by Elizabeth Paulhus. Cover image credit: ©cico / www.fotosearch.com.
1
Table of Contents3
4
6678
999
11121212
14141417
181819
21
22
Foreword
Executive Summary
Introduction Toward Mass Incarceration: Political and Racial Factors Income Inequality and Mass Incarceration The Effect of Incarceration on Individuals and Communities
Section One The Current State of West Virginia’s Prison System Organization of the Corrections System in West Virginia Demographics of the Prison Population Educational Attainment Security Classification Mental Health and Substance Abuse Current Spending on State Prisons
Section Two Trends in Corrections in West Virginia The Growth of the Prison Population Possible Causes of the Growth Increasing Costs of Prisons
Section Three Policy Ideas and Recommendations Reducing Admissions to Prison Reducing Time Spent in Prison Section Four Conclusion
Endnotes

2 Stemming the Tide
List of Figures, Tables, and Maps10
11111213
14
151516171717
1216
9
Figure 1. African Americans Disproportionately Represented in State’s Corrections SystemFigure 2. West Virginia’s Prison Population Is AgingFigure 3. Prison Population Has Lower Levels of Education than State as a WholeFigure 4. How the Division of Corrections Allocates FundsFigure 5. Annual Cost of Housing Inmates in Prison Is Much Higher than AlternativesFigure 6. Growth in the Prison Population Has Meant an Increase in Inmates Housed in Regional JailsFigure 7. Prisoner to Total Population Ratio, 1990-2009Figure 8. Total Crime Rate per 100,000 ResidentsFigure 9. Paroles Denied and Granted in West VirginiaFigure 10. Expenditures on Corrections, FY 1995-2010Figure 11. A Growing Percent of General Revenue Goes Toward CorrectionsFigure 12. West Virginia’s General Revenue Spending on Corrections Has Grown Faster than Most States
Table 1. The Majority of State Prisoners Are Classified as Medium Security or LessTable 2. Comparison of States’ Maximum Sentences for Most Serious Form of Robbery
Map 1. Some Counties Contribute Disproportionately to State Prisons

The Racial and Economic Impacts of West Virginia’s Prison System 3
ForewordA light is shining on the West Virginia Division of Corrections as never before. The light is in the hands of the Governor, the State Legislature, social services providers, community members, and the inmates themselves. This particular light is not unique to West Virginia, but is being employed in other states as well. The searchlight of which I am speaking is being used to find possible solutions to the growing problem of prison overcrowding. This report explores the problem and proposes some solutions.
Unlike most reports that simply crunch the numbers, this report also offers a sociological and historical analysis that shows the need for a basic philosophical rethinking of the correctional system in West Virginia and in the United States as a whole. Such a rethinking would entail embracing a complete paradigm shift in the state’s approach to corrections. Usually when thinking of a paradigm shift, one thinks of a new approach, an exciting discovery, the latest promising practice, or the most recent cutting-edge research. However, this report proposes that a “backward paradigm shift” be embraced, which would revert the prevailing underlying philosophy of corrections back to the thinking of the early 1800s. During that time, “The often stated goal of the prison system was rehabilitation of the criminal.”
This paradigm shift would provide those searching for answers concerning the existent overcrowding problem with solutions previously given only token consideration and rejected. First and foremost, the philosophical doctrine of issuing long prison sentences to those convicted of relatively minor crimes would be abandoned, and this harsh punishment would be reserved for the most dangerous members of society. These new solutions would include increasing the number of inmates paroled, limiting the use of technical violations to incarcerate those recently paroled, reducing the sentences given to individuals convicted for nonviolent offenses, and eliminating the practice of mass incarceration of minorities and low-income people for seemingly minor infractions of the law.
This report makes no claim of giving all of the answers and solutions to this most perplexing problem. However, it demands that a fresh look be taken and an alternative philosophical underpinning be accepted. This, in turn, can lead the state to take a different approach to resolving the rampant prison overcrowding problem.
Reverend James Patterson,Executive Director,
Partnership of African American Churches
4 Stemming the Tide
Despite a relatively stable crime rate, West Virginia is facing a growing prison population, which currently is larger than the capacity of the existing state prisons. As a result, many state prisoners are being housed in regional jails where they cannot access educational and supportive services offered by the Division of Corrections. With more individuals serving sentences in prison, there is a growing financial burden on the state. This population increase is associated with an increase in prison spending, with a growing percentage of the General Revenue fund going toward the Division of Corrections. Prison population growth and its associated overcrowding are not only criminal justice issues, but also fiscal concerns for West Virginia.
Executive Summary
This growth in the prison population in a state with little total population growth and a stable crime rate is in part the effect of sentencing patterns that place offenders into prison rather than into alternatives like community corrections and give them long sentences, as well as a reduction in the rate of granting parole. It also is a result of the shift from understanding prison as a place of rehabilitation to one of punishment that accompanied the “war on drugs” and the movement in the 1970s toward harsher sentences and being tough on crime. The growing prison population appears to be mainly the result of structures and policies, rather than an increase in crime.
Although overcrowding and housing inmates in regional jails may seem like new issues, they have actually plagued West Virginia for decades, even culminating in several lawsuits.1 After the U.S. Supreme Court ruled that the overcrowding in California was unconstitutional, calling it “cruel and unusual,” states like West Virginia are anxious to find solutions to their own overcrowding problems. Although one option recommended during the 2011 legislative interim sessions is the building of a new 1,200-bed medium security prison at a cost of $120 to $200 million (not including annual operating costs), opponents argue that “state governments cannot build their way out of the overcrowding problems.”2 A better option is to find ways to reduce the prison population by decreasing the number of offenders entering the system and increasing the number exiting from it.
West Virginia could consider several options for reducing prison admissions, such as:
• Expanding drug courts to every county and creating mental health courts. This would ensure that inmates in need of substance use or mental health care treatment would receive it.
• Increasing the use of alternative sanctions for technical parole and probation violators. This could take the form of more traditional methods like electronic monitoring and day report centers, or could mean the creation of “halfway back centers” that would provide support services and programs.
The state could also reduce the length of time that inmates spend in prison and increase the number exiting from the prison system by:
• Conducting a comprehensive review of its criminal code and comparing sentencing patterns to those in other states.
• Seeking ways to increase the number of inmates released to parole, which not only would reduce the prison population but also would give the inmates access to supportive services in their transition back into society.
• Expanding its current “good time” credits to include the completion of educational and other programs rather than just simply good behavior.
The Racial and Economic Impacts of West Virginia’s Prison System 5
Key Findings • Many state prisoners are being housed in regional jails, where they lack access to various educational and rehabilitative services. In 2009, approximately 20 percent of the Division of Corrections population was housed in regional jails, while an additional seven percent was housed at the Stevens Correctional Center/McDowell County Corrections.
• Most state prisoners in West Virginia are not high risk. Only 10 percent are classified as maximum security. One in three inmates can work outside the confines of the prison or is eligible for community-based placements.
• Many state prisoners struggle with mental illness, substance abuse, or the co-occurence of the two. Many of these individuals would benefit more from treatment and rehabilitation than from regular incarceration.
• African Americans are disproportionately represented in the West Virginia prison system, and are four times more likely than whites to be in prison.
• The majority of recidivists in West Virginia are picked up for technical parole violations, not new crimes.
• Only five percent of state prisoners have more than a high school degree, compared with 43 percent of the state as a whole. As such, educational programs for inmates in prison are crucial to help them develop the skills and knowledge to be more competitive workers in the future.
• The cost of housing an inmate in prison is nearly 20 times greater than putting someone on parole or probation. Yet West Virginia had 6,200 inmates in prison in 2010 and only 1,264 in-state parolees.
• West Virginia had the nation’s second highest growth in general revenue spending on corrections between 1990 and 2010.

6 Stemming the Tide
West Virginia is not alone in experiencing a dramatic increase in imprisonment rates and in prison-related costs in recent decades. The number of adult federal and state prisoners in the United States increased from 139 per 100,000 residents in 1980 to 502 per 100,000 in 2009—an increase of 261 percent.3 More than two million Americans are now incarcerated in prisons or jails, and the total number of Americans under some form of penal supervision (including jail, prison, parole and probation) is greater than 7.2 million.4
According to the International Centre for Prison Studies based in the United Kingdom, the United States has the highest incarceration rate in the world at 756 per 100,000, including juveniles as well as adults.5 With less than five percent of the world’s population, the United States accounts for nearly a quarter of the world’s prison population.
Introduction
It was not always this way. When Alexis de Tocqueville visited the United States in the early 1800s, he was impressed with the leniency of the young republic’s system of corrections and wrote, “In no country is criminal justice administered with more mildness than in the United States.” The goal of the prison system was the rehabilitation of the criminal. For most of the 20th century, prison rates in the United States were fairly low and stable in comparison to contemporary levels. From 1930 to 1970, the average annual rate of imprisonment was around 110 per 100,000.6
Beginning in the 1970s, the nature of punishment changed in the United States, heralding in an age of mass incarceration. Before this point, incarceration in prisons was the method of last resort. A range of other punishments, including suspension from school, police warnings, and probation, “ensured prison was rarely used, and only then for violent offenders or career criminals who cycled in and out of jail.”7
During the 1970s, prison no longer was seen as a last resort; instead, it became the prime destination for millions of Americans, particularly low-income, low-skilled young men without high school diplomas or post-secondary education. This was disproportionately true for African Americans. Today, prison is no longer just for violent offenders and those who underwent alternative punishments with no success at rehabilitation.8 Americans are locked up for crimes — from writing bad checks to using drugs — that
would rarely produce prison sentences in other countries, and they are kept incarcerated far longer than prisoners in other nations.9 As a result, the prison population in America continues to swell, even when crime rates have remained static or have fallen.
Toward Mass Incarceration: Political and Racial FactorsThe goal of the rehabilitation of offenders, which Tocqueville found so exceptional in the young republic, fell out of fashion in the last decades of the 20th century. Politicians, policy makers and a sizeable portion of the electorate called for “law and order,” a crackdown on crime, and eventually a “war on drugs.” Increasingly, the goal of the prison system had more to do with punishment, deterrence, and the incapacitation of offenders rather than their reform.
As has often been the case in American history, there were racial undertones behind this shift in the political mood. In the 1950s and 1960s, the Civil Rights movement overturned the system of legal segregation that prevailed in much of the American South, a system of social control that had maintained power relations since the late 1800s. African American activism challenged informal forms of discrimination around the country. In some cases, urban communities experienced unrest, riots, and/or increases in crime. These massive changes contributed both to a racial backlash and to a climate of fear among white voters that

The Racial and Economic Impacts of West Virginia’s Prison System 7
political leaders were all too eager to exploit. Some recent authors have in fact suggested that mass incarceration replaced traditional Jim Crow policies as a means of controlling low-income minority populations.10
The policy response around the nation included new criminal penalties, more severe sentencing and parole systems, less reliance on probation and other alternatives to incarceration, and a mushrooming prison-building industry. Not surprisingly, the impact of the “wars” on crime and drugs hit low-income minority communities the hardest. African Americans are locked up at six times the rate of whites. The disparity is particularly glaring when one considers that African Americans “comprise 13% of the U.S. population and 14% of drug users, yet they are 37% of the people arrested for drug offenses and 56% of those incarcerated for drug crimes.”11
There are many reasons for this disproportionate impact. Aside from such economic factors as growing inequality and large racial disparities in terms of income, wealth, educational opportunities and employment,12 “… police may scrutinize and arrest the poor more frequently than the affluent … Police tend to view disadvantaged blacks and Hispanics and the communities in which they live as unsafe. The poor are treated with more suspicion as a result.”13 These communities might not have higher rates of crime than more affluent communities; they may simply be under greater scrutiny or have a greater police presence.
This differential treatment of minorities is repeated and amplified at every stage of the criminal justice system. For example, a 2001 study of the juvenile justice system in West Virginia found that African American youth comprised four percent of the state’s juvenile population in 1998, but represented nine percent of referrals to juvenile court, 18 percent of those placed in detention, and 17 percent of juveniles placed in correctional facilities.14 In 1999, more than half of the juvenile cases transferred to adult criminal court for prosecution were African American.15 In contrast, white youth comprised 95 percent of the state’s juvenile population, but only 89 percent of referrals to juvenile court, 79 percent of those placed in detention, and 80 percent of juveniles placed in correctional facilities.16
Income Inequality and Mass IncarcerationFrom the 1940s to the 1970s, the United States experienced a period of reduced economic inequality in terms of wealth and income, a trend that has been labeled “the Great Compression.”17 That period of relatively low inequality began to unravel in the 1970s and gave way to a widening economic gap that has been called “the Great Divergence.”18 It is probably no coincidence that the era of mass incarceration coincided with this widening economic inequality.
The widening economic inequality of the 1970s can be explained by a number of factors: the stagflation of the late 1970s, in which high unemployment co-existed with double digit inflation, deindustrialization, globalization, automation, deregulation, tax changes and shifting budget priorities. Among those hit hardest by economic and policy changes were young men living in low-income and minority communities where there was little demand for unskilled or semi-skilled labor. Many of these would soon become major casualties of the wars on crime and drugs.
The relationship between socio-economic factors and a given society’s approach to crime and punishment has long been a subject of research and debate. For example, in the late 1930s, the German scholars Georg Rusche and Otto Kirchheimer published Punishment and Social Structure, which examined issues of crime, punishment and economics over several centuries and in several countries. The authors concluded that the degree of severity or laxity of punishment varied with the state of the labor market. Periods of high unemployment seemed to be associated with harsher approaches, while periods of low unemployment were associated with more lenient approaches. They argued that major reductions in crime would only be possible, “if society is in a position to offer its members a certain measure of security and to guarantee a reasonable standard of living.”19
In a similar fashion, modern-day sociologist Bruce Western analyzed the relationship between economic factors and imprisonment and found that “there is strong evidence that deteriorating labor market status is closely associated with increasing risks of imprisonment.”20

8 Stemming the Tide
The Effect of Incarceration on Individuals and CommunitiesOne way to analyze the effects of mass incarceration on both individuals and communities is to consider its impact over the normal life course. As sociologist Bruce Western notes, “Today, arriving at adult status involves moving from school to work, then to marriage, to establishing a home and becoming a parent. Completing this sequence without delay promotes stable employment, marriage, and other positive life outcomes. The process of becoming an adult thus influences success in fulfilling adult roles and responsibilities.”21
Incarceration is a major disruption in the ordinary life course—although for minority males in poor neighborhoods, it is increasingly becoming a normal part of the life course. When young offenders are incarcerated for offenses that would not have carried long prison terms prior to the era of mass incarceration, the effects on the life course and on life chances can be dramatic.
Former prisoners generally earn less than those who have not been imprisoned and are more likely to be unemployed or sporadically employed in jobs lacking paths for advancement. The social stigma associated with incarceration may block access to careers, public benefits, and even voting rights in some states. The effects of the disruption may tempt ex-offenders toward repeat offenses. Incarceration thus is a powerful driver of increasing inequality.
Incarceration has a strong impact on family life. Western concludes, “the influence of the penal system ranges beyond the negative effects of imprisonment on men’s wages and employment. Imprisonment has also inhibited the formation of stable two-parent families in the low-income urban neighborhoods from which most of the penal population is drawn. Stable families provide the poor with a valuable means of improving welfare. Families pool resources, socialize and supervise children, and provide networks of mutual aid.”22 Former prisoners are less likely to marry or to live with the other parent of their children, which can affect the bond between the children and the absent parent. Those who are married often find their marriages falling apart because of the disruption of incarceration. Incarceration also increases the chance of domestic violence in future relationships. These effects ripple through already fragile communities.
Finally, mass incarceration can also hide the extent of social and economic distress in vulnerable communities. People housed in prison do not have regular jobs, yet are not counted as unemployed. They are poor, but are not included in poverty statistics. They earn little or nothing, but are not factored into surveys on wages and earnings.
The Racial and Economic Impacts of West Virginia’s Prison System 9
Section OneThe Current State of West Virginia’s Prison SystemAs West Virginia has followed the national trend of shifting the focus of incarceration from rehabilitation to punishment,23 an increasing number of the state’s residents have ended up behind prison bars. Since prison is far more expensive per inmate than parole, probation, and alternatives like work release centers, the cost of corrections continues to rise in West Virginia.
Certain demographic trends are important to note among the prison population and may help shape policies that keep people out of prison and prevent former prisoners from reoffending. A disproportionate number of African Americans are in the state’s prisons compared with in the population at large. The overwhelming majority of prisoners have a high school education or less. Despite the general impression of prisoners held by society, most state prisoners are not high-risk. In fact, nearly one-third of prisoners can work outside the confines of the prison or are eligible for community-based placements. Only 10 percent are classified as maximum security. In West Virginia, approximately one-quarter of prisoners have a mental illness, and many struggle with substance abuse.
Organization of the Corrections System in West VirginiaThe West Virginia Division of Corrections is one of several criminal justice divisions within the Department of Military Affairs and Public Safety.24 The Division of Corrections (DOC), the Regional Jail and Correctional Facilities Authority (RJA), the Division of Justice and Community Services, the Division of Juvenile Services, and the Parole Board oversee the West Virginia corrections system.25 Each division has its own director, and each has a particular mission to fulfill.
The DOC currently operates 13 correctional facilities, including several work release/study centers. Once someone has been convicted and sentenced, they are placed into DOC custody and should be transferred to one of the state’s prisons run by the DOC. In prison, which is designed for long-term stays, inmates have access to various educational and rehabilitative services. If the state prisons are over capacity, prisoners are placed in regional jails, causing overcrowding and other issues in these short-term facilities designed for “the confinement, custody, supervision or control of adult persons convicted of misdemeanors or awaiting trial or awaiting transportation to a state correctional facility.”26
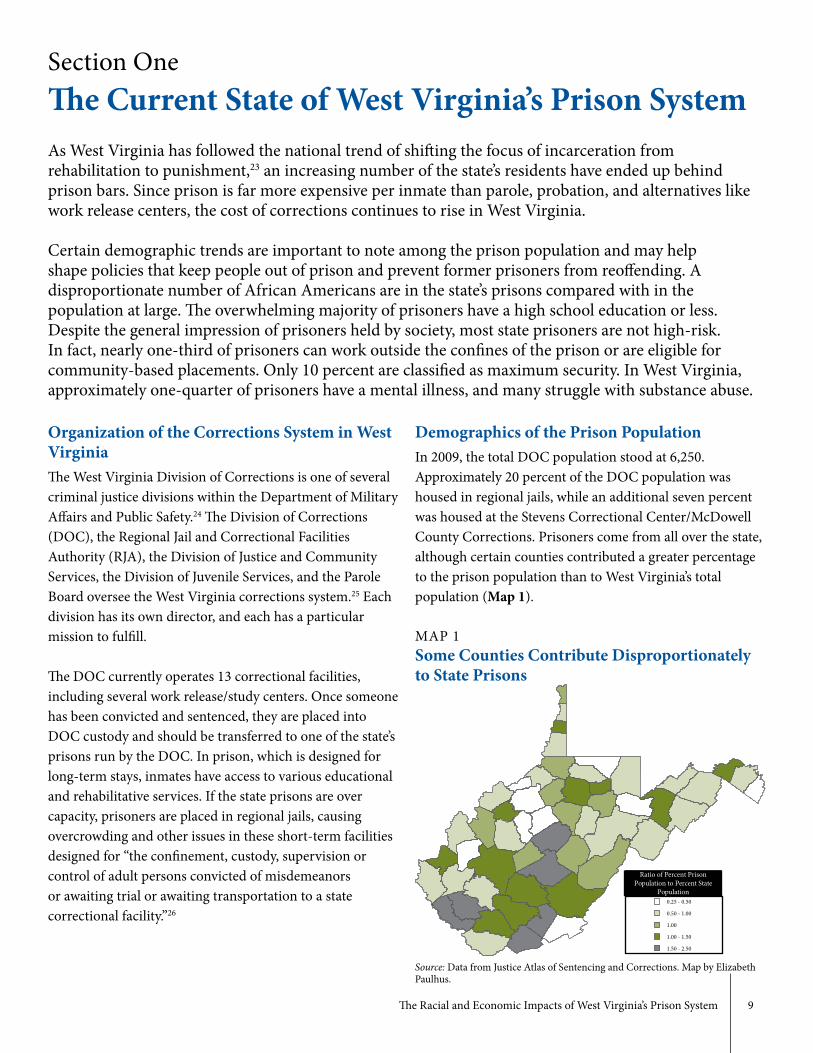
Demographics of the Prison PopulationIn 2009, the total DOC population stood at 6,250. Approximately 20 percent of the DOC population was housed in regional jails, while an additional seven percent was housed at the Stevens Correctional Center/McDowell County Corrections. Prisoners come from all over the state, although certain counties contributed a greater percentage to the prison population than to West Virginia’s total population (Map 1).
MAP 1Some Counties Contribute Disproportionately to State Prisons
Source: Data from Justice Atlas of Sentencing and Corrections. Map by Elizabeth Paulhus.
Ratio of Percent Prison Population to Percent State
Population0.25 - 0.50
0.50 - 1.00
1.00
1.00 - 1.50
1.50 - 2.50

10 Stemming the Tide
In 2010, approximately 90 percent of inmates housed in DOC prisons were male and 10 percent were female.27
Roughly 13 percent of inmates were African American, and more than 85 percent were white. Although the percent of African Americans in the West Virginia prison system is well below the national level of approximately 41 percent, they are similarly disproportionately represented in prison.28 The percentage of prisoners who are African American is 3.94 times more than the percentage of state residents who are African American, while the national difference is 3.25 times. In 2010, African Americans in West Virginia were nearly four times more likely to be in prison than whites.29
Of additional concern is the difference in the percent of African Americans in various types of corrections. As of the 2010 census, African Americans comprise only 3.4 percent of West Virginia’s population, yet they are more than 13 percent of the prison population (Figure 1).30 However, in 2009, African Americans comprised only 8.0 percent of probationers and 11.4 percent of parolees.31
FIGURE 1African Americans Disproportionately Represented in State’s Corrections System
Source: State data from U.S. Census Bureau, 2010 American Community Survey 1-Year Estimates. Prison population from the WVDOC, “Annual Report FY 2009-2010.” Probation and parole data 2009 from Lauren Glaze and Thomas P. Bonczar, “Bulletin: Probation and Parole in the United States, 2009” (Washington, D.C.: Bureau of Justice Statistics, December 2010).
Asian
White
Multi-racial, Other
Hispanic/Latino
African American
85.2%
93.2%
90.9%
88.1%
13.4%
8.0%
11.4%
3.4%State
Prison
Probation
Parole
“When it comes to locking people up, race matters. ... for the same offenses, black West Virginians receive much harsher sentences. To not recognize this is to turn a blind eye to the truth.”
- Former Supreme Court Justice, Larry StarcherThe Record, 11/30/2007

The Racial and Economic Impacts of West Virginia’s Prison System 11
West Virginia’s prison population is also aging due in part to long sentences and reduced parole. In 2004, only 12.8 percent of state prisoners were over the age of 50. By 2010, this figure had climbed to 18 percent (Figure 2). With an aging population comes increased costs for medical treatment and care, special housing for some inmates, and other age-specific concerns.
Educational AttainmentNational data show that the likelihood of being imprisoned is much higher – in some cases, more than twenty times – for individuals with a high school degree or less.32 West Virginia’s prison population mirrors this national trend. In 2010, nearly all inmates had only a high school degree or less – 25.8 percent did not finish high school, 42.6 percent had a GED, and 26.4 percent had a high school degree.33 As such, educational programs for inmates in prison are crucial to help them develop the skills and knowledge to be more competitive workers in the future, which should reduce their chances of reoffending once released.
Compared to statewide education rates, the prison population has much lower education levels (Figure 3). Only 16.7 percent of West Virginia residents over the age of 18 have less than a high school degree, whereas more than a quarter of the prison population lacks a high school degree.34 On the other end of the spectrum, only 5.2 percentof inmates had education past high school, while 42.6 percent of all state residents had at least some college.
FIGURE 3Prison Population Has Lower Levels of Education than State as a Whole
Source: State data from U.S. Census Bureau, 2010 American Community Survey 1-Year Estimates. Prison data from WVDOC, “Annual Report FY 2009-2010.”
FIGURE 2West Virginia’s Prison Population Is Aging
Source: WVDOC, Annual Reports from 2004 to 2010.
0%
4%
8%
12%
16%
20%
FY 2010FY 2009FY 2008FY 2007FY 2006FY 2005FY 2004FY 2003FY 2002
Percent of Prison Population Over
Age 50
State
Prison
Less than High School
High School or GED
More than High School
16.7%
40.7%
42.6%
69.0%
25.8%
5.2%

12 Stemming the Tide
Security ClassificationWhen many people think of prisons, they envision hardened criminals locked in cells or solitary confinement; in other words, maximum security. However, most inmates do not fall into this security classification. In West Virginia, only 10.2 percent of inmates are listed as maximum security. More than 60 percent of inmates are classified as medium security or less (Table 1). In fact, one in three inmates can work outside the confines of the prison or is eligible for community-based placements (e.g., Work Release).35 The majority of prisoners, therefore, are not deemed so dangerous that they are placed in locked units.
TABLE 1The Majority of State Prisoners Are Classified as Medium Security or Less
Security Classification
Number of Inmates Percent
Community 413 8.1%Minimum 1,200 23.6%Medium 1,511 29.7%Close 1,064 20.9%Maximum 517 10.2%Receiving/Intake 383 7.5%
Source: Table recreated from WVDOC, “Annual Report FY 2009-2010.”
Mental Health and Substance AbuseFinally, a large number of prisoners struggle with mental health issues, substance abuse, or both. According to the National Alliance on Mental Illness, which used data from the Bureau of Justice Statistics, approximately 1,400 adult prisoners in West Virginia had a mental illness in 2008.36 This equaled nearly one-quarter of the state’s prisoners. In addition, many inmates have substance abuse problems. Although the percentage of West Virginia prisoners who had been sentenced for a drug or narcotics offense was only 11.7 percent,37 the Commissioner of the DOC, Jim Rubenstein, contends that nearly 85 percent of prison inmates had substance abuse issues that had contributed to their imprisonment.38 In short, a large portion of West Virginia’s state prisoners is dealing with mental health and/or substance abuse problems and would benefit more from treatment and rehabilitation than from regular incarceration.
Current Spending on State PrisonsIn fiscal year 2010, the DOC spent $160.1 million on administrative support and prison industries, parole services, work release/community-based programs, youthful offender services, adult offender services, and staff training.39 The bulk of these funds came from General Revenue (93 percent), with the remainder allocated from the appropriated special revenue fund and the non-appropriated special fund.40
Approximately half of the budget covers personnel services and employee benefits (Figure 4).41 The other half covers direct expenses of housing the inmates, such as food, utilities, medical, payroll for prison industries, and payments to the regional jails and federal prisons for the state prisoners held there.
Source: WVDOC, “Annual Report FY 2009-2010.” Note: Percentages may not total 100% due to rounding.
Utilities(3.6%)Food
(4.0%)
Other Operating Expenses
(9.8%)
Inmate Medical(15.8%)
Payments to Regional Jails & Federal Prisons
(16.1%)
Personnel Services(34.5%)
Other(2.2%)
FIGURE 4How the Division of Corrections Allocates Funds
The Racial and Economic Impacts of West Virginia’s Prison System 13
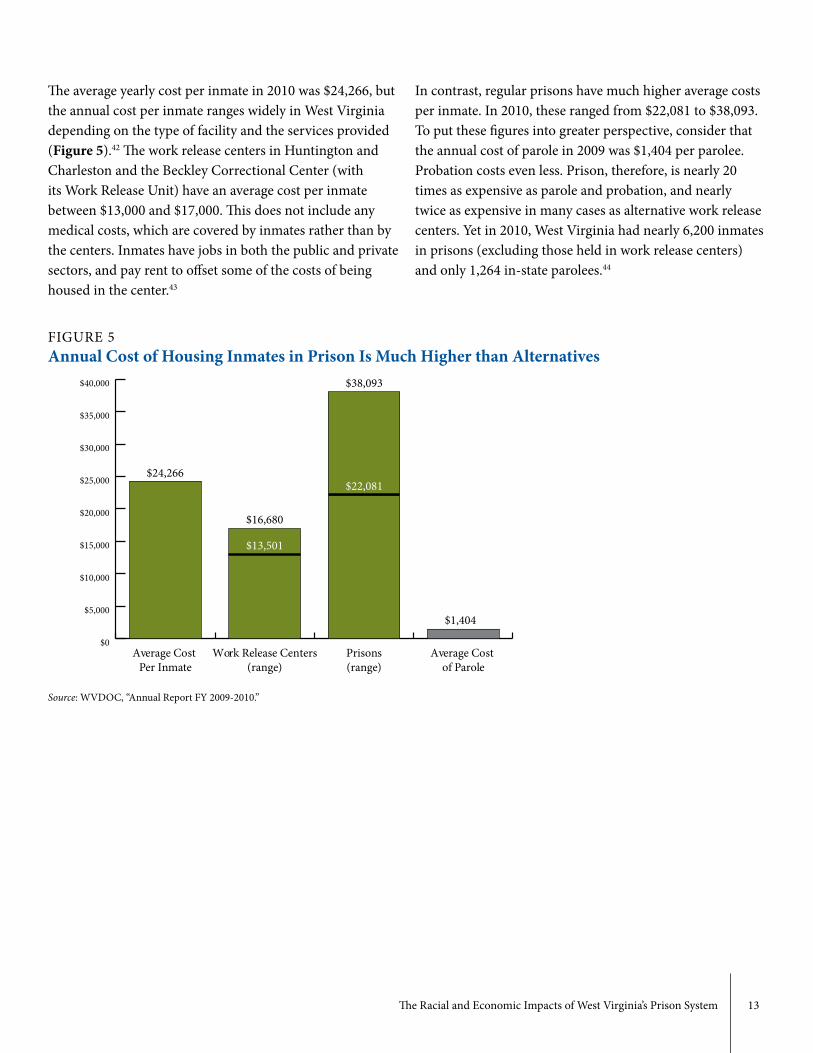
The average yearly cost per inmate in 2010 was $24,266, but the annual cost per inmate ranges widely in West Virginia depending on the type of facility and the services provided (Figure 5).42 The work release centers in Huntington and Charleston and the Beckley Correctional Center (with its Work Release Unit) have an average cost per inmate between $13,000 and $17,000. This does not include any medical costs, which are covered by inmates rather than by the centers. Inmates have jobs in both the public and private sectors, and pay rent to offset some of the costs of being housed in the center.43
$0
$5,000
$10,000
$15,000
$20,000
$25,000
$30,000
$35,000
$40,000
Average Cost of Parole
Prisons(range)
Work Release Centers(range)
Average Cost Per Inmate
$22,081
$13,501
$16,680
$38,093
$1,404
$24,266
In contrast, regular prisons have much higher average costs per inmate. In 2010, these ranged from $22,081 to $38,093. To put these figures into greater perspective, consider that the annual cost of parole in 2009 was $1,404 per parolee. Probation costs even less. Prison, therefore, is nearly 20 times as expensive as parole and probation, and nearly twice as expensive in many cases as alternative work release centers. Yet in 2010, West Virginia had nearly 6,200 inmates in prisons (excluding those held in work release centers) and only 1,264 in-state parolees.44
FIGURE 5Annual Cost of Housing Inmates in Prison Is Much Higher than Alternatives
Source: WVDOC, “Annual Report FY 2009-2010.”

14 Stemming the Tide
Section TwoTrends in Corrections in West VirginiaDespite a fairly stable crime rate, the West Virginia prison population has tripled since 1990. More people are committed to the prison system than are released as sentence lengths have increased, parole revocations have become common, and fewer people are granted parole. Since growth in the prison population has outstripped growth in the state’s total population, the percent of the state’s residents in prison has risen as well. This growth in prisons corresponded to a steady increase in spending on corrections, which absorbed a larger percentage of the state’s general revenue. Between 1990 and 2010, West Virginia had the nation’s second largest percent increase in spending on total corrections from its general revenue fund.
The Growth of the Prison PopulationIn addition to the tripling of the state’s prison population from 1990 to 2009, growth has also occurred in the number of prisoners being held in regional jails or in facilities with contracts from the DOC. West Virginia built new prisons or converted other structures into prisons in an attempt to keep up with the growth in the prison population. Excluding Mount Olive Correctional Center, which was built as a replacement to the West Virginia Penitentiary, seven new prisons were opened between 1993 and 2005, and one work release center became a correctional center. Despite these new facilities and additional beds, more and more state prisoners found themselves housed in regional jails due to the rapid growth.
In 1990, 1,575 West Virginians were in the custody of the DOC, and all were held in a state prison (Figure 6). By 2000, the total DOC population had grown to 3,772 inmates, with nearly 800 being housed in regional jails instead of prisons. As mentioned previously, the total DOC population stood at 6,250 in 2009, with nearly 20 percent being held in regional jails.
Possible Causes of the GrowthThe growth in the number of prisoners in DOC custody would not be so perplexing if West Virginia’s total population had grown at a comparable rate. However, the state’s total population has increased only approximatelythree percent from 1990 to 2009. The problem with the growth in the prison population becomes even more apparent when comparing it to the total state population.
FIGURE 6Growth in the Prison Population Has Meant an Increase in Inmates Housed in Regional Jails
Source: WVDOC, Annual Reports from 2004 to 2010.
Inm
ates
0
1,000
2,000
3,000
4,000
5,000
6,000
7,000
Contracted
In Prison
Total DOC Population
2009200720052003200119991997199519931991
“The regional jails have put bunk beds and bunks within their cells in their facilities to expand their capacity beyond its original design. There really is no more room at the inn.”
- Jim Rubenstein, Commissioner of the West Virginia Division of Corrections,
West Virginia Public Broadcasting, 2/8/2011
The Racial and Economic Impacts of West Virginia’s Prison System 15
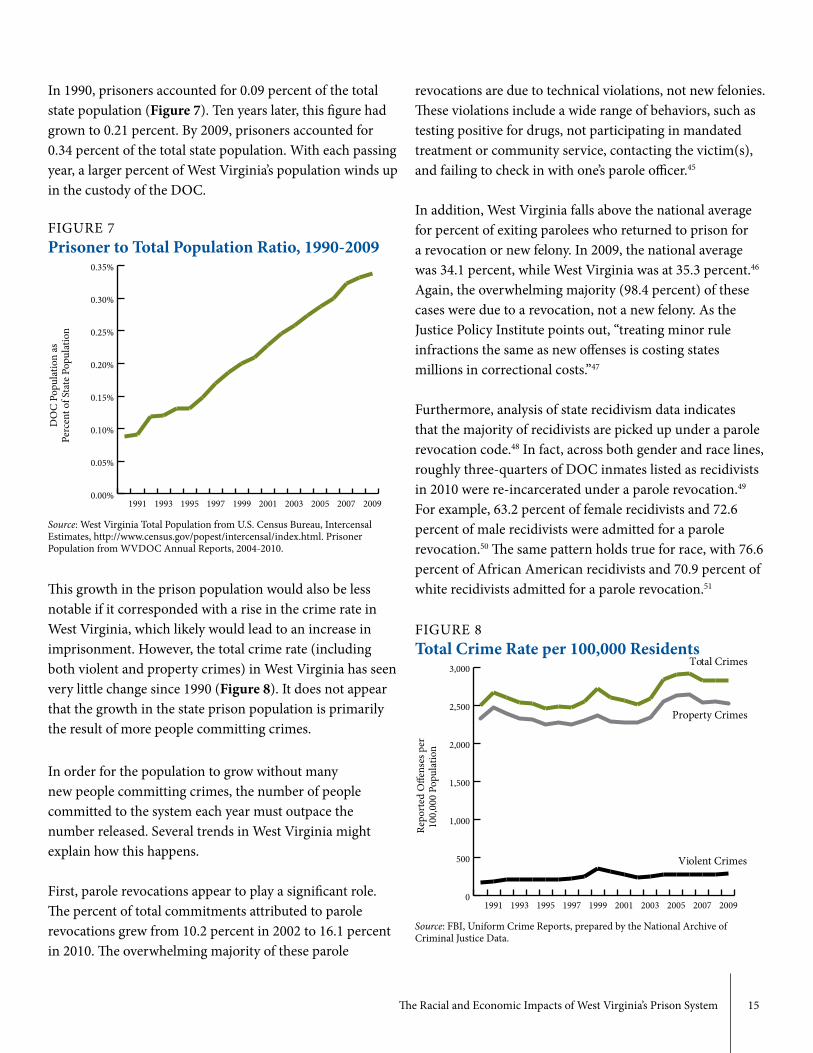
FIGURE 8Total Crime Rate per 100,000 Residents
Source: FBI, Uniform Crime Reports, prepared by the National Archive of Criminal Justice Data.
Rep
orte
d O
ffens
es p
er
100,
000
Popu
latio
n
0
500
1,000
1,500
2,000
2,500
3,000Total Crimes
Property Crimes
Violent Crimes
2009200720052003200119991997199519931991
In 1990, prisoners accounted for 0.09 percent of the total state population (Figure 7). Ten years later, this figure had grown to 0.21 percent. By 2009, prisoners accounted for 0.34 percent of the total state population. With each passing year, a larger percent of West Virginia’s population winds up in the custody of the DOC.
This growth in the prison population would also be less notable if it corresponded with a rise in the crime rate in West Virginia, which likely would lead to an increase in imprisonment. However, the total crime rate (including both violent and property crimes) in West Virginia has seen very little change since 1990 (Figure 8). It does not appear that the growth in the state prison population is primarily the result of more people committing crimes.
In order for the population to grow without many new people committing crimes, the number of people committed to the system each year must outpace the number released. Several trends in West Virginia might explain how this happens.
First, parole revocations appear to play a significant role. The percent of total commitments attributed to parole revocations grew from 10.2 percent in 2002 to 16.1 percent in 2010. The overwhelming majority of these parole
revocations are due to technical violations, not new felonies. These violations include a wide range of behaviors, such as testing positive for drugs, not participating in mandated treatment or community service, contacting the victim(s), and failing to check in with one’s parole officer.45
In addition, West Virginia falls above the national average for percent of exiting parolees who returned to prison for a revocation or new felony. In 2009, the national average was 34.1 percent, while West Virginia was at 35.3 percent.46 Again, the overwhelming majority (98.4 percent) of these cases were due to a revocation, not a new felony. As the Justice Policy Institute points out, “treating minor rule infractions the same as new offenses is costing states millions in correctional costs.”47
Furthermore, analysis of state recidivism data indicates that the majority of recidivists are picked up under a parole revocation code.48 In fact, across both gender and race lines, roughly three-quarters of DOC inmates listed as recidivists in 2010 were re-incarcerated under a parole revocation.49 For example, 63.2 percent of female recidivists and 72.6 percent of male recidivists were admitted for a parole revocation.50 The same pattern holds true for race, with 76.6 percent of African American recidivists and 70.9 percent of white recidivists admitted for a parole revocation.51
FIGURE 7Prisoner to Total Population Ratio, 1990-2009
Source: West Virginia Total Population from U.S. Census Bureau, Intercensal Estimates, http://www.census.gov/popest/intercensal/index.html. Prisoner Population from WVDOC Annual Reports, 2004-2010.
DO
C P
opul
atio
n as
Pe
rcen
t of S
tate
Pop
ulat
ion
0.00%
0.05%
0.10%
0.15%
0.20%
0.25%
0.30%
0.35%
2009200720052003200119991997199519931991

16 Stemming the Tide
Second, the rate at which the West Virginia Parole Board granted parole fell from approximately 65 percent in 1990 to a low of 27 percent in 2001 (Figure 9). This matched the national trend, as states like Massachusetts and Virginia strove to be “tough on crime” during the 1990s.52 The rate climbed back above 50 percent in 2008, but remains below its 1990 level. If the grant rate had remained at its 1990 level of 65 percent throughout the two decades, hundreds of prisoners would have been released to parole instead of remaining in prison. Some years this figure would have equaled nearly 800 prisoners.
Third, the sentences handed down for felonies in West Virginia are often much longer than in other states.53 For example, someone convicted of first-degree robbery in West Virginia can serve from 10 years minimum to an unlimited maximum. This sentence applies even if the individual was not successful in the attempt to rob and if the robbery was unarmed.54 More than 100 state inmates have sentences for first degree robbery that are greater than 40 years, and 11 had sentences longer than 100 years.55 This unlimited maximum stands in contrast with the maximum sentence applied in all of the states surrounding West Virginia, except Virginia (Table 2).
TABLE 2Comparison of States’ Maximum Sentences for Most Serious Form of Robbery
State Offense Maximum SentenceWest Virginia first degree robbery UnlimitedKentucky first degree robbery 20 yearsMaryland robbery with
dangerous weapon20 years
Pennsylvania first degree robbery 20 yearsOhio aggravated robbery 10 years
Source: George Castelle, Chief Public Defender for Kanawha County, “Comments to the House Judiciary Committee regarding Committee Substitute for S.B. 196 (amending the sentences for robbery)” (March 2011). Note: Virginia was missing from the original table, so its absence here is not an oversight.
With more inmates serving longer terms, the turnaround of prisoners is low, leading to more people being held in prisons and causing overcrowding and overflow into the regional jails. Longer sentences also mean that inmates remain in prison longer, which increases the cost to the state.
FIGURE 9Paroles Denied and Granted in West Virginia
Source: 1990-2006 data from George Castelle’s “Solution to Jail and Prison Overcrowding in West Virginia” comments to Legislative Oversight Committee on Regional Jail and Correctional Facility Authority, May 21, 2006. 2007-2009 data from West Virginia Parole Board, “55th Annual Report.”
0
500
1,000
1,500
2,000
2,500
3,000
Paroles Granted Paroles Denied
20092007200520032001199919971995199319910%
10%
20%
30%
40%
50%
60%
70%
Percent Granted
“The defendant ... was a scant nineteen years of age at the time of this incident. He had no adult felony or misdemeanor record. ... No knife or other weapon was found on the defendant, even though the police were outside the victim’s apartment when the defendant emerged and apprehended him after a short chase. The victim suffered no physical harm. For this crime, he received a sentence of one hundred years.”
- Justice Miller’s dissenting opinion in State v. Ross, 184 W.Va. 579, 402 S.E.2d 248 (1990)
The Racial and Economic Impacts of West Virginia’s Prison System 17
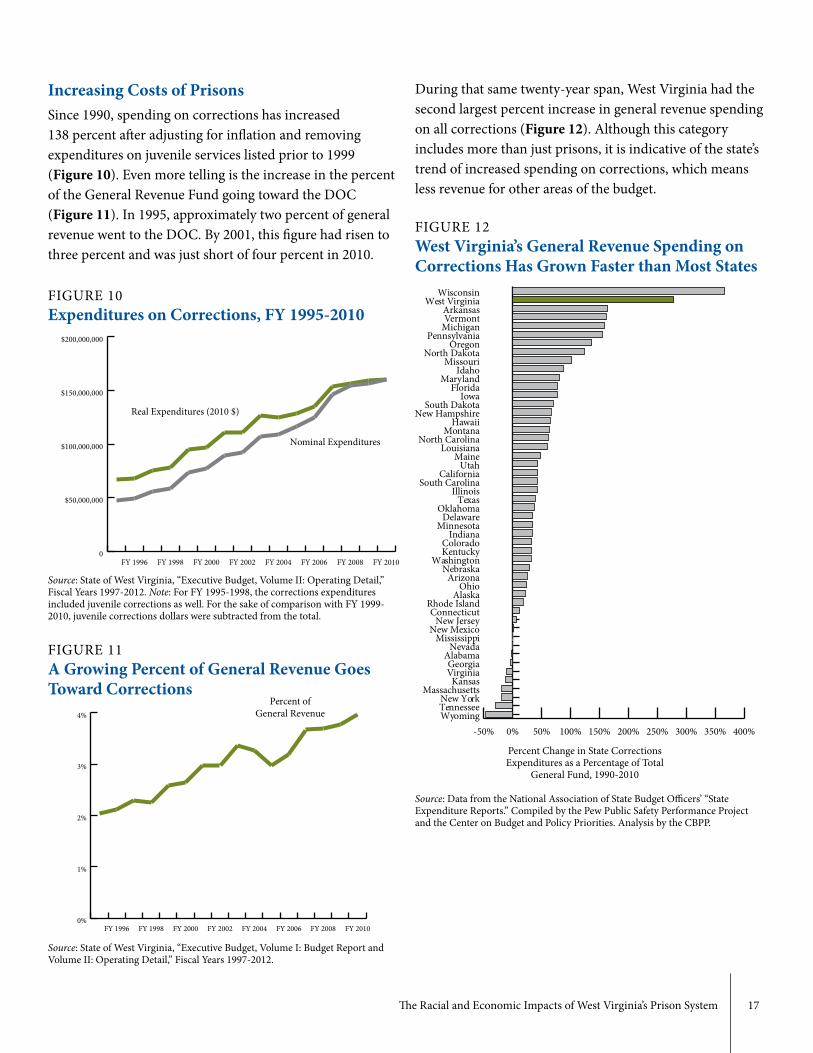
During that same twenty-year span, West Virginia had the second largest percent increase in general revenue spending on all corrections (Figure 12). Although this category includes more than just prisons, it is indicative of the state’s trend of increased spending on corrections, which means less revenue for other areas of the budget.
FIGURE 12West Virginia’s General Revenue Spending on Corrections Has Grown Faster than Most States
Source: Data from the National Association of State Budget Officers’ “State Expenditure Reports.” Compiled by the Pew Public Safety Performance Project and the Center on Budget and Policy Priorities. Analysis by the CBPP.
-50% 0% 50% 100% 150% 200% 250% 300% 350% 400%WyomingTennesseeNew York
MassachusettsKansas
VirginiaGeorgia
AlabamaNevada
MississippiNew Mexico
New JerseyConnecticut
Rhode IslandAlaska
OhioArizona
NebraskaWashington
KentuckyColorado
IndianaMinnesota
DelawareOklahoma
TexasIllinois
South CarolinaCalifornia
UtahMaine
LouisianaNorth Carolina
MontanaHawaii
New HampshireSouth Dakota
IowaFlorida
MarylandIdaho
MissouriNorth Dakota
OregonPennsylvania
MichiganVermontArkansas
West VirginiaWisconsin
Percent Change in State Corrections Expenditures as a Percentage of Total
General Fund, 1990-2010
Increasing Costs of PrisonsSince 1990, spending on corrections has increased 138 percent after adjusting for inflation and removing expenditures on juvenile services listed prior to 1999 (Figure 10). Even more telling is the increase in the percent of the General Revenue Fund going toward the DOC (Figure 11). In 1995, approximately two percent of general revenue went to the DOC. By 2001, this figure had risen to three percent and was just short of four percent in 2010.
FIGURE 10Expenditures on Corrections, FY 1995-2010
Source: State of West Virginia, “Executive Budget, Volume II: Operating Detail,” Fiscal Years 1997-2012. Note: For FY 1995-1998, the corrections expenditures included juvenile corrections as well. For the sake of comparison with FY 1999-2010, juvenile corrections dollars were subtracted from the total.
0
$50,000,000
$100,000,000
$150,000,000
$200,000,000
Real Expenditures (2010 $)
Nominal Expenditures
FY 2010FY 2008FY 2006FY 2004FY 2002FY 2000FY 1998FY 1996
FIGURE 11A Growing Percent of General Revenue Goes Toward Corrections
Source: State of West Virginia, “Executive Budget, Volume I: Budget Report and Volume II: Operating Detail,” Fiscal Years 1997-2012.
0%
1%
2%
3%
4%
FY 2010FY 2008FY 2006FY 2004FY 2002FY 2000FY 1998FY 1996
Percent of General Revenue
18 Stemming the Tide
Section ThreePolicy Ideas and RecommendationsIn order to slow or stop the growth of the prison population, as well as the accompanying growth in corrections expenditures, West Virginia must find ways to reduce the number of prison admissions and reduce the time that most inmates spend in prison.56 To borrow phrasing from Caroline Moser at the Brookings Institution, state policies should seek to “turn [down] the faucet” and “widen the drain.”57 These actions can reduce costs while maintaining public safety.
Turning down the faucet would focus on keeping people from entering the prison system at all. Policies would focus on diverting more low-risk offenders into less expensive alternatives such as community corrections and probation rather than prison.58 In some cases it would also mean committing individuals to treatment facilities for rehabilitative and mental health services. Furthermore, West Virginia could create other means of sanctioning probationers and parolees who commit a technical violation. Instead of sending these people back to prison, the state could impose other sanctions.
Widening the drain would include policies that sought to increase the number of people being granted parole and that provide inmates with programs in prison that reduce the risk of recidivism once they are released.
Reducing Admissions to PrisonIn order to reduce the number of inmates being admitted to the DOC each year, West Virginia could explore several options used by other states to divert some non-violent convicts into cheaper, alternative sentences. One possibility would be to increase the use of drug courts, which blend together supervision and treatment.59 These courts “exert legal pressure on defendants to enter and remain in treatment long enough to realize benefits.”60 Participants receive counseling, provide community service, report to court on a regular basis, and agree to be tested frequently for drugs and alcohol. Currently, these courts serve 29 of West Virginia’s 55 counties.61
Considering the high rates of substance use and abuse among prisoners, the state would benefit by expanding drug courts to all counties and increasing treatment and rehabilitative services for convicts. Former Executive Director of the Regional Jail and Correctional Facility Authority Steve Canterbury said, “Recidivism is lower in cases where individuals are forced to meet the demands of drug courts. It’s also less expensive for taxpayers than sending someone to jail [or prison].”62 West Virginia could also evaluate the effectiveness of existing drug courts in the state, and explore best practices from other states to improve the model.63
Another growing movement across the country is the creation of mental health courts, where the judge and mental health professionals tailor treatment plans to meet the needs of individual offenders. Like drug courts, these mental health courts blend together judicial supervision and community-based treatment.64 West Virginia has one such court, called the Mental Health Court Diversion Program, based in the Northern Panhandle.65 The court is open to non-violent offenders who have an Axis I diagnosis of mental illness, which are clinical disorders like depression, schizophrenia, bipolar disorder, and even ADHD.
“ At some point in time we need to stop locking up people we’re mad at and lock up people we’re afraid of.”
- Gene Johnson, Director of the Virginia Department of Corrections,
Associated Press, 7/27/2010

The Racial and Economic Impacts of West Virginia’s Prison System 19
Although the provision of intensive treatment is not inexpensive, the American Psychiatric Association claims that, “if people with mental illness received the treatment they needed, the cost savings from avoided imprisonment would more than cover the cost of treatment.”66 With nearly a quarter of its inmates struggling with mental illness, West Virginia should consider expanding the Mental Health Court Diversion Program to all counties.67
However, the state must also increase spending for adult mental health treatment, since its per capita spending on mental health was lower than all but seven states in 2009 and was less than half of the national median.68 This means creating additional substance abuse and mental health treatment facilities in the state, since the current number is inadequate.69 By making treatment a greater priority, West Virginia should see reduced recidivism rates, decreased costs, and a stronger, healthier workforce.
Another way to turn down the faucet is to use alternative sanctions for technical parole and probation violators instead of returning them to prison. Alternatives like community service, electronic monitoring, or day report centers not only cost the state less than prison, but they also enable offenders to pay child support, restitution, fees, and so forth while they are serving their sentences. In addition, they keep prison beds free for those who are too dangerous to release into the community or house in a regional jail.
States like Michigan, Kentucky, and New Jersey use intermediate sanctions like “violator centers” or “halfway back centers,” where parole violators spend a few months in residential facilities and receive treatment, supportive services, and other programming as needed.70 Once this stay is complete, they go back to being on parole. Like the other alternatives to prison, these halfway back centers are more efficient and more cost-effective than prisons and provide parolees with the support and treatment needed to reenter society.
Finally, any policy that aims to improve employment and reduce poverty in children and young people, especially among African Americans, could have have a profound impact on reducing the admissions to prison.
Reducing Time Spent in PrisonSince the main reason inmates are remaining in prison for so long is that they were given long sentences, one way to ease this problem is to make changes to sentencing patterns. According to the Committee to Monitor Compliance with the Court’s Directives Concerning the Problem of the Overcrowding of Prisons in the State of West Virginia, the state should conduct a comprehensive review of the criminal code.71 This could include decreasing minimum sentences for certain non-violent offenses to bring them in-line with other states, as well as increasing the use of community corrections and alternative sentencing.72 West Virginia might also want to explore releasing some of its elderly inmates who pose little or no risk to society.
Another possibility, upon which West Virginia has taken some action in recent years, is increasing the number of inmates released on parole. During the 2010 Legislative Session, the West Virginia Legislature passed Senate Bill 218, creating an accelerated parole option for some non-violent offenders who completed a rehabilitation program. The state could also explore ways to ensure that a higher percentage of eligible offenders are granted parole, rather than fulfilling the entirety of their sentences in prison. This would free up beds in prisons, and also would ensure that the majority of inmates are not released directly into society at the end of their full sentence without having had any parole supervision or receiving supportive services.73
Finally, West Virginia could consider following the lead of the 31 states that use earned time credits to reduce sentence lengths.74 West Virginia currently offers “good time credits,” which are awarded for good behavior. For each day of good conduct, an inmate receives a sentence reduction of one day. However, other states offer credits to inmates who participate in education, work, and rehabilitation programs. For example, Maryland offers “good conduct”, “industrial”, “educational”, and “special project” credits.75 Credits can be received and revoked, depending on circumstances and behavior. Some states offer larger one-time credits to inmates who complete certain educational certificate or degree programs.76
20 Stemming the Tide
Earned time credits might be more beneficial than mere good time credits because they not only lower costs by reducing sentences, but they also provide a strong incentive for inmates to take part in programs that will help them to transition back into society with better skills, education, and health. Considering the low levels of education among West Virginia’s prisoners, such programs could prove very beneficial to inmates and to the overall state workforce.
The West Virginia DOC already has much of the infrastructure in place to offer earned time credits. Many of the correctional facilities offer a variety of work, education, and substance abuse rehabilitation programming. For example, Huttonsville Correctional Center, the largest
correctional facility in West Virginia, offers vocational and educational programs through the state’s Department of Education.77 The Anthony Correctional Center actually requires its young adult inmates (ages 18 to 24) to take part in educational programs ranging from skills development to GED classes to vocational training to community college courses.78 Utilizing pre-existing programming to award earned time credits in addition to or instead of good time credits would encourage participation and completion of programs that provide inmates with services/skills needed to be successful upon their return to their community. This in turn should decrease the chance of inmates reoffending and being sent back to prison, which saves the state in the long term.

The Racial and Economic Impacts of West Virginia’s Prison System 21
Section FourConclusionAs West Virginia’s prison population continues to grow, exceeding the capacity of existing prisons, the state’s policymakers face important decisions about how to handle this issue and bring down the cost of corrections. Although some may argue that the best idea is to build yet another prison, this does not appear to be a long-term solution for reducing the rapidly rising costs of corrections. West Virginia cannot simply build its way out of its prison overcrowding problems. Building another prison also fails to address the fact that this population growth does not reflect a rise in crime or state population growth.
By acknowledging that the growth in the prison population is caused by systemic issues, West Virginia’s policymakers can seek to adopt new policies that reduce the number of people entering prison and increase the number exiting the system. These include expanding drug and mental health courts, and increasing the use of alternative sanctions for technical parole violators. They also might include reviewing the state’s criminal code and comparing it to other states, reducing prison terms, increasing the number of individuals released on parole, and allowing prisoners to receive “earned time” credits for completing educational programs and other offerings that will help them to transition back into society.
Adopting some or all of these policies will help West Virginia to move from being tough on crime to being smart on crime. By regaining an emphasis on rehabilitation rather than simply punishment, the state’s corrections system can keep people safe while helping men and women get the treatment, education, and skills development they need for their eventual return to society. These changes will reduce corrections costs in West Virginia, freeing up general revenue funds to be spent in other areas like higher education.
22 Stemming the Tide
1
2
3
4
5
6
7
8
9
10
11
12
13
14
15
16
17
18
19
20
21
22
23
24
25
The overcrowding of prisons, as well as the movement of state prisoners into contracted facilities and regional jails, sparked several lawsuits during the 1990s. In State ex rel. Smith v. Skaff (1992), the West Virginia Supreme Court of Appeals held that the DOC had “a nondiscretionary duty … to incarcerate those inmates who are sentenced to … a state penal facility operated by the Division of Corrections.” The only time that prisoners could be placed into regional jails or other non-DOC facilities was if the latter were at capacity. In State ex rel. Sams v. Kirby (1999), several inmates sought to be transferred from regional jail into prison, where they could receive the full services and programs offered by the DOC. A plan to transfer inmates from jails to prisons was given to the court in 2002.
Supreme Court of Appeals of West Virginia, “Interim Recommendations by the Committee to Monitor Compliance with the Court’s Directives Concerning the Overcrowding of Prisons in the State of West Virginia” (January 12, 2010), downloaded from www.state.wv.us/wvsca/press/jan12_10b_rpt.pdf.
Bureau of Justice Statistics, “Key Facts at a Glance: Imprisonment Rate, 1980-2009,” accessed at http://bjs.ojp.usdoj.gov/content/glance/incrt.cfm.
Bureau of Justice Statistics, “Key Facts at a Glance: Adult Correctional Populations, 1980-2009,” accessed at http://bjs.ojp.usdoj.gov/content/glance/corr2.cfm. Roy Walmsley, “World Prison Population List (eighth edition)” (London: King’s College London, International Centre for Prison Studies, December 2008), downloaded from http://www.kcl.ac.uk/depsta/law/research/icps/publications.php?id=8.
Franklin E. Zimring, “The Scale of Imprisonment in the United States: Twentieth Century Patterns and Twenty-First Century Prospects,” The Journal of Criminal Law and Criminology Vol. 100, No. 3 (2010): 1226, downloaded from www.law.northwestern.edu/jclc/symposium/v100/n3/1003_1225.Zimring.pdf. (quoting from the opening chapter of Democracy in America) Bruce Western, Punishment and Inequality in America (New York: Russell Sage Foundation, 2006), 12. Adam Liptak, “U.S. prison population dwarfs that of other nations,” New York Times, April 23, 2008, accessed at http://www.nytimes.com/2008/04/23/world/americas/23iht-23prison.12253738.html?pagewanted=all.
Michelle Alexander, The New Jim Crow: Mass Incarceration in the Age of Colorblindness (New York: The New Press, 2010).
Ibid. American Civil Liberties Union, “Smart Reform is Possible: States Reducing Incarceration Rates and Costs while Protecting Communities” (August 2011), downloaded from http://www.aclu.org/files/assets/smartreformispossible_web.pdf. For state data, see: Partnership of African American Churches, West Virginia Center on Budget and Policy, and American Friends Service Committee, “Legacy of Inequality: Racial and Economic Disparities in West Virginia” (2010), downloaded from http://www.wvpolicy.org/downloads/Legacy_of_Inequality_WEB.pdf. Western, 55. Carol Sharlip, “Minority Youth and Juvenile Justice in West Virginia” (Charleston, WV: Community Development Outreach Ministries, United Methodist Church, 2001), accessed at https://www.ncjrs.gov/App/publications/Abstract.aspx?id=189335. Ibid. Ibid.
Claudia Goldin and Robert A. Margo, “The Great Compression: The Wage Structure in the United States at Mid-Century,” Quarterly Journal of Economics. Vol. 107, Issue 1 (February 1992): 1-34. See the series “Exploring Income Inequality” in the Center on Budget and Policy Priorities’ “Off the Charts,” accessed at http://www.offthechartsblog.org/exploring-income-inequality-part-1-overview/. Georg Rusche and Otto Kirchheimer, Punishment and Social Structure: Revised Edition (Brunswick, New Jersey: Transaction Publishers, 2003), 207. Western, 78. Western, 20.
Western, 163. Western, 2. Prior to 1997, the Division of Corrections oversaw juveniles as well. A state congressional act in 1997 separated the two institutions. Throughout this paper, all data on juveniles from years prior to 1997 were removed from the totals for continuity with data post-1997.
West Virginia Department of Military & Public Affairs, “Home Page,” accessed at http://www.dmaps.wv.gov/Pages/default.aspx.
Endnotes

The Racial and Economic Impacts of West Virginia’s Prison System 23
26
27
28
29
30
31
32
33
34
35
36
37
38
39
40
41
42
43
44
45
46
47
48
49
50
51
52
West Virginia Code, “Chapter 31. Corporations. Article 20. West Virginia Regional Jail and Correctional Facility Authority,” accessed at http://www.legis.state.wv.us/wvcode/Code.cfm?chap=31&art=20.
West Virginia Division of Corrections, “Annual Report FY 2009-2010” (December 2010), accessed at http://www.wvdoc.com/wvdoc/officeofResearchPlanning/tabid/70/Default.aspx. Heather C. West, William J. Sabol, and Sarah J. Greenman, “Bulletin: Prisoners in 2009” (Washington, D.C.: Bureau of Justice Statistics, December 2010).
Using 2010 Decennial Census data and demographic information from the DOC’s 2010 Annual Report. Note: the DOC only reports race data for those inmates housed in prisons. Since this leaves more than 1,000 prisoners out of the equation, the differences in imprisonment rates could possibly be closer to the national average. This means that African Americans in West Virginia could be upwards of eight times more likely to be incarcerated than whites.
State data from U.S. Census Bureau, “2010 Census: West Virginia Profile” (2011), accessed at http://www.census.gov/geo/www/maps/2010_census_profile_maps/census_profile_2010_main.html. Prison data from WVDOC, “Annual Report FY 2009-2010.”
Lauren Glaze and Thomas P. Bonczar, “Bulletin: Probation and Parole in the United States, 2009” (Washington, D.C.: Bureau of Justice Statistics, December 2010), downloaded from bjs.ojp.usdoj.gov/content/pub/pdf/ppus09.pdf.
Western, 75-76. WVDOC, “Annual Report FY 2009-2010.” U.S. Census Bureau, 2010 American Community Survey 1-Year Estimates, “Table B15001: Sex by Age by Educational Attainment for the Population 18 Years and Over” (Universe: West Virginia).
According to the West Virginia Division of Corrections, Policy Directive #401.01, “Correctional Classification Guidelines” (April 1, 2010), those classified as “community” or “minimum” security can work outside the confines of the facility. Using data from the WVDOC, “Annual Report FY 2009-2010,” one-third of state prisoners fall into these two classifications.
National Alliance on Mental Illness, State Advocacy 2010, “State Statistics: West Virginia,” downloaded from www.nami.org/ContentManagement/ContentDisplay.cfm?ContentFileID=93527.
WVDOC, “Annual Report FY 2009-2010.”
Phil Kabler, “Leaders fail to reach consensus on prison overcrowding,” The Charleston Gazette, July 12, 2011, accessed at http://wvgazette.com/News/201107121101. State of West Virginia, “Executive Budget: Fiscal Year 2012, Volume II: Operating Detail.” downloaded from www.budget.wv.gov/executivebudget/archives/Documents/VIBR2012.pdf. Ibid. WVDOC, “Annual Report FY 2009-2010.” Ibid. Ibid. Ibid. Michael D. White, Jeff Mellow, Kristin Englander, and Marc Ruffinengo, “Halfway Back: An Alternative to Revocation for Technical Parole Violators,” Criminal Justice Policy Review, Vol.22, Issue 2 (June 2011) 140-166, downloaded from www.cecintl.com/pdf/research/Halfway%20Back%20paper%20for%20CJPR.pdf. Glaze and Bonczar. Justice Policy Institute, “Pruning Prisons: How Cutting Corrections Can Save Money and Protect Public Safety” (May 2009), downloaded from www.justicepolicy.org/images/upload/09_05_REP_PruningPrisons_AC_PS.pdf. Data on recidivism with return codes received via personal communication with Rebecca Hildebrand, Research Analyst for the West Virginia Division of Corrections (July 28, 2011). Rebecca Hildebrand, “Recidivism… Inmates Released in 2007,” (Charleston, WV: West Virginia Division of Corrections, May 2011), downloaded from www.wvdoc.com/wvdoc/Portals/0/documents/recidivism2007.pdf.
Personal communication with Rebecca Hildebrand (July 28, 2011). Ibid.
Katherine Bradley and R.B. Michael Oliver, “The Role of Parole” (Boston, MA: Community Resources for Justice, July 2001), accessed at http://crjustice.org/rolparol.htm.

24 Stemming the Tide
53
54
55
56
57
58
59
60
61
62
63
64
65
66
67
68
69
70
71
72
73
74
75
76
77
78
George Castelle, Chief Public Defender for Kanawha County, “Comments to the House Judiciary Committee regarding Committee Substitute for S.B. 196 (amending the sentences for robbery)” (March 2011).
Ibid. He writes of “a 19-year old who unsuccessfully attempted to steal a purse… serving a sentence of 100 years.” Ibid. The Pew Center on the States, “One in 100: Behind Bars in America 2008” (February 2008), accessed at http://www.pewcenteronthestates.org/report_detail.aspx?id=35904. Caroline O. Moser, Reducing Global Poverty: The Case for Asset Accumulation (Washington, DC: The Brookings Institution Press, 2007), 62-63. Moser uses the bathtub metaphor to examine the process of falling into and rising out of poverty (Moser, 2007, p.4, 62-64). She initially presents this framework on page 4 of Reducing Global Poverty; it is covered more heavily on pages 62-63, 68-71, 73, and 75-77. Highlighting the need for policies that “widen the drain” (p. 63) for families to escape poverty and “turn off the faucet” (p.63) to prevent families from slipping into poverty. Here, the metaphor can be applied to the need to both increase the number of low-risk offenders successfully leaving prison and returning to society and slow the flow of offenders into the prison system. Several of these policy recommendations are reflected in the Supreme Court of Appeals of West Virginia, “Interim Recommendations.” U.S. Department of Justice, Office of Justice Programs, “Drug Courts: The Second Decade” (June 2006), downloaded from www.ncjrs.gov/pdffiles1/nij/211081.pdf. Ibid.
“Drug court opens in Romney,” The West Virginia Record, January 24, 2011, accessed at http://www.wvrecord.com/news/232805-drug-court-opens-in-romney. Supreme Court of Appeals of West Virginia, “Justice Davis to sign order establishing Drug Court in West Central W.Va.” (June 29, 2007), accessed at http://www.state.wv.us/wvsca/press/june29_07.htm.
U.S. Department of Justice, Office of Justice Programs, “Drug Courts.” Michael Thompson, Fred Osher, and Denise Tomasini-Joshi, “Improving Responses to People with Mental Illness: The Essential Elements of a Mental Health Court” (New York: Council of State Governments Justice Center, 2007), downloaded from www.ojp.usdoj.gov/BJA/pdf/MHC_Essential_Elements.pdf.
Supreme Court of Appeals of West Virginia, “Mental Health Court Diversion Program: Program Fact Sheet,” accessed at http://www.state.wv.us/wvsca/mentalhyg/MH_Facts.htm.
The American Psychiatric Association, “Mental Illness and the Criminal Justice System: Redirecting Resources Toward Treatment, Not Containment” (May 2, 2004), downloaded from www.psych.org/lib_archives/archives/200401.pdf. During this process, the state should examine the suggestions laid out by Thompson et al., “Improving Responses.”
National Association of State Mental Health Program Directors Research Institute, Inc. (NRI Inc.), “State Mental Health Agency Profiles Systems (Profiles) and Revenues Expenditures Study: Revenues and Expenditures Reports from 2009,” Table: Total State Mental Health Agency Mental Health Expenditures by Age Group and State, accessed at http://www.nri-inc.org/projects/Profiles/Prior_RE.cfm. Supreme Court of Appeals of West Virginia, “Interim Recommendations.” White et al., “Halfway Back.” Supreme Court of Appeals of West Virginia, “Interim Recommendations.” Ibid. Bradley and Oliver, “The Role of Parole.” Alison Lawrence, “Cutting Corrections Costs: Earned Time Policies for State Prisoners” (Washington, D.C.: National Conference of State Legislatures, July 2009), downloaded from www.pewcenteronthestates.org/uploadedFiles/Earned_time_report_%20NCSL.pdf. Maryland General Assembly, Department of Legislative Services, “Diminution of Term Credit: Its Role in the Operation of Correctional Systems in Maryland and Other States,” downloaded from dls.state.md.us/data/polanasubare/polanasubare_coucrijusncivmat/Dimunition-Credits.pdf. Lawrence, “Cutting Corrections Costs.” West Virginia Division of Corrections, “Huttonsville Correctional Center,” accessed at http://www.wvdoc.com/wvdoc/PrisonsandFacilities/HuttonsvilleCorrectionalCenter/tabid/49/Default.aspx. West Virginia Division of Corrections, “Anthony Correctional Center,” accessed at http://www.wvdoc.com/wvdoc/PrisonsandFacilities/AnthonyCorrectionalCenter/tabid/44/Default.aspx.
http://www.wvdoc.com/wvdoc/PrisonsandFacilities/HuttonsvilleCorrectionalCenter/tabid/49/Default.aspx
The West Virginia Center on Budget and Policy is a policy research organization that is nonpartisan, nonprofit, and statewide. It focuses on how policy decisions affect all West Virginians, including low- and moderate-income families, other vulnerable populations, and the important community programs that serve them.
723 Kanawha Blvd, Suite 300Charleston, WV 25301
Tel: 304.720.8682Fax: 304.720.9696www.wvpolicy.org
The American Friends Service Committee, West Virginia Economic Justice Project, works statewide on issues affecting low-income and working families.
P.O. Box 1964 Charleston, WV 25327
Tel: 304.529.3890www.afsc.org/charleston
The Partnership of African American Churches (PAAC) is a collaborative, non-profit, faith-based community development corporation, based in Charleston, WV. While PAAC serves all communities, it intentionally targets African American communities in West Virginia. The PAAC is a specific initiative-driven organization focusing on holistic health, which encompasses education, physical health and absence of disease, economic security, crime prevention and youth development as intrinsic to its core programmatic solutions.
P.O. Box 452Institute, WV 25112-0452
Tel: 304.768.7688www.paac2.org