Stemming the Rising Tide: Racial & Ethnic Disparities in Youth ...
McKinsey Center for Business and Environment
Stemming the Tide: Land-based strategies for a plastic - free ocean
2
Foreword 3
Executive summary 6
Introduction 11
1. What are the origins of ocean plastic debris, 13 and how does it leak into the ocean?
2. What differences across regions require different types 18 of solutions?
3. What leakage-reduction solutions are available, 23 and what are their relevant economics?
4. What can trigger the implementation of leakage-reduction 33 measures in the short, medium, and long term?
5. What are the cornerstones of a concerted program 37 for global action to address this issue?
Glossary 40
Core team and technical advisers 43
Notes 44
Contents
3
Foreword The last century has been a time of unprecedented growth and prosperity. But these advancements have come at a price, including significant strain on the world’s natural systems. In terms of the ocean specifically, the assumption has long been that its vastness (there are 5 hectares of ocean for every living person) means it offers an unlimited capacity for waste and can serve as the planet’s ultimate sink. This assumption is wrong.
Pollution from sources like storm water and waste-treatment systems or nutrient runoff from agriculture has long been known to cause very real economic and environmental damage. But historically, both the causes and the effects of these types of pollution have largely been considered local or regional issues. Because of its longevity, ubiquity, and sheer volume, plastic debris is now emerging as a new, truly global challenge. (It is estimated that some plastic products retain their original recognizable form 400 years after discharge into the ocean.) Recent research, such as a 2015 article in the journal Science,1 has highlighted the urgency of preventing unmanaged plastic waste from reaching the ocean, a problem known as plastic-waste leakage.
Growth in the global use of plastic-intensive consumer goods is projected to increase significantly over the next ten years, especially in markets where waste-management systems are only just emerging. Unless steps are taken to manage this waste properly, by 2025 the ocean could contain one ton of plastic for every three tons of finfish—an unthinkable outcome. We know that at least some of this plastic enters the ocean’s food chain, and evidence suggests that it has the potential to do significant harm.
We also now have research to suggest that the majority of plastic enters the ocean from a small geographic area, and that over half comes from just five rapidly growing economies—China, Indonesia, the Philippines, Thailand, and Vietnam.2 These countries have recently benefited from significant increases in GDP, reduced poverty, and improved quality of life. However, increasing economic power has also generated exploding demand for consumer products that has not yet been met with a commensurate waste-management infrastructure.
With a focus on where quick action would have the greatest impact, this report suggests that coordinated action in just these five countries could significantly reduce the global leakage of plastic waste into the ocean by 2025. Specifically, interventions in these five countries could reduce global plastic-waste leakage by approximately 45 percent over the next ten years. Of course, extending these interventions to other countries could have even more impact on this global issue.
This collective action is most effective if it follows a new, integrated action plan, for several reasons:
• Solutions must be global. Plastic is the workhorse material of the modern economy. It often moves through global supply chains and supports global companies. And while plastic products can have short useful lives, the longevity of plastic molecules themselves means that plastic waste travels far across borders and into our common high seas. We need a global approach to mitigating pollution from plastic waste—an approach that considers region-specific solutions that will prevent this waste from entering the ocean in the first place.
• Solutions will have diverse benefits. There are many motivations for stopping plastic and other waste from leaking into the ocean. Waste constitutes economic loss of valuable materials; creates health and labor concerns, especially for waste pickers; harms overall ocean productivity, with a substantial impact on fishing revenues;3 and dilutes the aesthetic and economic value of beaches and other coastal environments. Any one of these reasons in isolation may not provide sufficient motivation to take collective action, but the ocean is inherently connected, integrated, and global. This perspective can serve as the catalyst to bring a new collaborative approach to the problem at the necessary scale.
4
• Solutions must be effective and fast. The user benefits of plastics are undisputed and will continue to drive massive growth; the ICIS Supply and Demand database projects that plastic production will increase from about 250 million metric tons in 2015 to approximately 380 million metric tons by 2025. The surge is the compound effect of population growth, economic growth, increasing resource intensity, and an unprecedented dominance of plastics as the multipurpose material of our economy. The highest levels of leakage are in regions that also have some of the highest projected growth rates for plastic waste; the quantity of plastic estimated to enter ocean environments in 2025 is double that of 2015. The issue is urgent but not insurmountable; the next ten years are critical.
• Solutions require a full view of the integrated life cycle. There is no perfect plastic material. Its residual value depends on how the plastic is used, which is typically just one of several criteria considered when designing a product. Sometimes less material is better, sometimes different material is better, and sometimes more material is better. This makes it hard for any single player in the value chain to independently drive full-life-cycle improvements. The need for multidimensional decision making means progress requires an unusually high degree of supply-chain cooperation.
• Solutions are path dependent. Many actions we take to address the problem now will dictate the viability of other solutions in the future, because today’s decisions will shape materials markets for decades. Large-scale deployment of waste-to-energy technology (such as gasification, pyrolysis, or incineration with energy recovery4), for example, may help solve the pollution problem associated with today’s plastics, but if not done thoughtfully, it may also hinder the development of plastics that offer higher-residual-value uses at the end of their life cycle. For these reasons, it is important to consider long-term implications of the choices we make today.
While well intentioned, existing efforts to address the leakage of plastic waste into the ocean and other waterways are not being undertaken at scale or with the level of strategic interconnectedness required to meet the scope of the challenge. This report is written to inform discussions about how to significantly reduce and ultimately stop plastic-waste leakage, and to present a view of what successful concerted action could look like.
Throughout this work, in contrast to much of the existing work on plastic in the ocean, we focus on land-based solutions to preventing leakage, rather than studying the transport and fate of plastic once it is in the ocean. We believe this is the best solution to the problem of plastic waste leaking into the ocean—stopping leakage in the first place, rather than treating it after pollution has already occurred. Therefore, this work focuses on five questions:
1. What are the origins of ocean plastic debris, and how does it leak into the ocean?
2. Are there significant differences across regions that require different types of solutions?
3. What leakage-reduction solutions are available, and what are the relative economics and benefits of each?
4. What can be done to trigger the implementation of leakage-reduction measures in the short, medium, and long term?
5. What are the cornerstones of a concerted program for global action to address this issue?
5
Although this report looks at all five questions, the main purpose is to highlight viable improvement opportunities that exist today. Therefore, the analysis of how plastic leaks into the ocean, as well as research on near-term solutions and their economics, are at the heart of this work. We believe a speedy embrace and deployment of these opportunities is as important as a dialogue on the more systemic changes in the way plastic is produced and used.
This work is a signature initiative of the Trash Free Seas Alliance® and was made possible by support from the Coca-Cola Company, the Dow Chemical Company, the American Chemistry Council, the Recycling and Economic Development Initiative of South Africa, and WWF. It was led by Ocean Conservancy; the McKinsey Center for Business and Environment has been the knowledge partner in the creation of this report. Advisers to this project include the Global Ocean Commission, The Prince of Wales’s International Sustainability Unit, the Ellen MacArthur Foundation, government and multilateral funding agencies in our focus countries, and a range of technical advisers with waste-management expertise and experience in the plastics and recycling industries. In addition, Ocean Conservancy gratefully acknowledges the generosity of the following funders who are committed to a trash-free ocean and whose support contributed to the development of this report: Adessium Foundation, 11th Hour Racing, Hollomon Price Foundation, Forrest C. & Frances H. Lattner Foundation and Mariposa Foundation.
We hope this report will set in motion increased efforts to address the global challenge of plastic-waste leakage through concerted action that ensures all major actors are deeply involved. We also hope it can provide a joint fact base that will underpin the discussion and help focus action on high-impact investments. This work entailed significant literature review, interviews with more than 100 experts and decision makers, detailed case studies of over 20 initiatives aimed at improving waste-management systems, and in-depth work in the Philippines and China. We are very grateful for the substantial support this work has received, and are confident that the community of supporters will continue to grow as the effort builds momentum in the months and years to come.
Andreas MerklChief Executive Officer, Ocean Conservancy
Martin StuchteyDirector of the McKinsey Center for Business and Environment
6
Executive summary The amount of unmanaged plastic waste entering the ocean—known as plastic-waste leakage—has reached crisis levels and has caused significant economic and environmental damage. The problem warrants a collective global response. The first step should focus on the five countries that together account for between 55 and 60 percent of the total plastic-waste leakage; this report describes an integrated set of measures (or levers) that together could reduce leakage in these five countries by 65 percent and reduce total global leakage by approximately 45 percent by 2025. This is the prerequisite for successfully ending plastic-waste leakage entirely by 2035. For each lever, the report specifies costs and plastic-waste-leakage reduction potential. Total costs of implementing these levers could be contained at an estimated $5 billion a year—an investment with significant returns to the entire economy. That amount could largely be met through typical project-financing mechanisms involving the public, private, and multilateral sectors. Private industry has an important role to play in catalyzing public and private investment by strategically reducing capital costs and investment risk. Assembling the appropriate financing approach, along with the need for political commitment, location-specific data and analysis, and action to align government policies and regulatory environments, will require coordinated action across public and private stakeholders.
Although each set of actions described in the report has a different lead time—with effects in the short, medium, and long term—they all require an immediate start if we as a society are to move toward peaking and then essentially eliminating the leakage of plastic into the ocean. The agenda described in this report recognizes ongoing efforts such as capital-light improvements to uncontained dump sites located near waterways and heavy penalties for dumping of waste into waterways by waste-transportation systems. But it also suggests new priorities, acceleration of existing initiatives, increased private-sector commitment, and a focus on “ocean-smart” measures geared primarily toward reducing leakage of plastic to the ocean. And while this report focuses on five countries with especially high levels of plastic-waste leakage, we believe it also sets forth a replicable model that can be applied in other countries that would benefit from improved waste-management systems.
An article in the February 13, 2015, issue of the journal Science added to an already robust body of research suggesting that the volume of plastic leaking into the sea—estimated at approximately eight million metric tons a year—greatly exceeds any previous estimates.5 Evidence of the environmental and economic damage is mounting. In a business-as-usual scenario of unchecked plastic-waste leakage, the global quantity of plastic in the ocean would nearly double to 250 million metric tons by 2025.
A broad range of stakeholders from the public and private sectors is aligning on ocean plastic as a major global issue. Capitalizing on this momentum requires a global agenda, underpinned by a strong understanding of the possible solutions and their economics. This report is meant to provide a basis for global action. It is the result of corporate and nongovernmental-organization (NGO) parties coming together on this issue and represents emerging collaborative action across the consumer-goods value chain and between the private, public, and social sectors.
To arrive at our recommendations, we looked at five key questions:
7
1. What are the origins of ocean plastic debris, and how does it leak into the ocean?Less than 20 percent of leakage originates from ocean-based sources like fisheries and fishing vessels. This means over 80 percent of ocean plastic comes from land-based sources; once plastic is discarded, it is not well managed, and thus leaks into the ocean. Over half of land-based plastic-waste leakage originates in just five countries: China, Indonesia, the Philippines, Thailand, and Vietnam,6 referred to in this report as the five focus countries for action. These countries have all succeeded at achieving significant growth in recent years, and they are at a stage of economic growth in which consumer demand for safe and disposable products is growing much more rapidly than local waste-management infrastructure. This creates a dual problem: the scale of collection and the retention of waste within the system itself. Our field research and interviews with public officials have also shown that these countries acknowledge the problem and are actively looking for collaborative solutions.
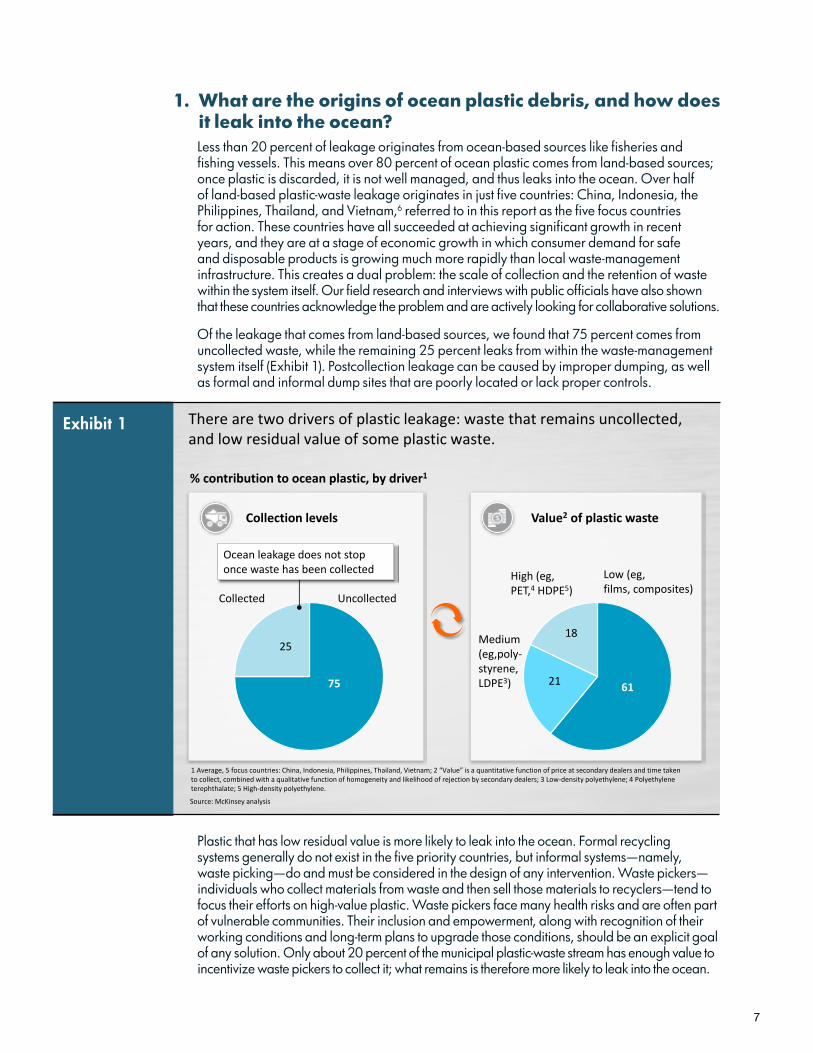
Of the leakage that comes from land-based sources, we found that 75 percent comes from uncollected waste, while the remaining 25 percent leaks from within the waste-management system itself (Exhibit 1). Postcollection leakage can be caused by improper dumping, as well as formal and informal dump sites that are poorly located or lack proper controls.
Plastic that has low residual value is more likely to leak into the ocean. Formal recycling systems generally do not exist in the five priority countries, but informal systems—namely, waste picking—do and must be considered in the design of any intervention. Waste pickers—individuals who collect materials from waste and then sell those materials to recyclers—tend to focus their efforts on high-value plastic. Waste pickers face many health risks and are often part of vulnerable communities. Their inclusion and empowerment, along with recognition of their working conditions and long-term plans to upgrade those conditions, should be an explicit goal of any solution. Only about 20 percent of the municipal plastic-waste stream has enough value to incentivize waste pickers to collect it; what remains is therefore more likely to leak into the ocean.
% contribution to ocean plastic, by driver1
There are two drivers of plastic leakage: waste that remains uncollected, and low residual value of some plastic waste.
Value2 of plastic waste Collection levels
Ocean leakage does not stop once waste has been collected
UncollectedCollected
25
75
18
21 61
Medium(eg,poly-styrene, LDPE3)
Low (eg, films, composites)
High (eg, PET,4 HDPE5)
1 Average, 5 focus countries: China, Indonesia, Philippines, Thailand, Vietnam; 2 “Value” is a quantitative function of price at secondary dealers and time taken to collect, combined with a qualitative function of homogeneity and likelihood of rejection by secondary dealers; 3 Low-density polyethylene; 4 Polyethylene terephthalate; 5 High-density polyethylene.
Source: McKinsey analysis
Exhibit 1
8
2. Are there significant differences across regions that require different types of solutions?Existing leakage pathways and resolution mechanisms vary among countries, depending on the urban/rural makeup (for instance, population levels, the amount of waste generated per square kilometer, and the degree to which waste is aggregated at dump sites), the level of existing investment in waste systems and infrastructure (as it stands, collection rates vary widely), and local incentive policies (for instance, electricity feed-in tariffs). So any portfolio of solutions must take these regional differences into account. For example, in low-collection countries, the priority should be to push collection levels to 80 percent over the next decade (the current average in these countries is about half that). In places that already have high collection rates, post-collection leakage should be reduced to about 1 percent.
3. What leakage-reduction solutions are available, and what are the relevant economics of each?Programs and interventions in the five high-opportunity countries would require a ten-year effort that starts immediately and takes advantage of the economic leverage points identified in this report. Specifically, we compiled and evaluated 33 different solutions, creating—for the first time—an approximate ocean-plastic-mitigation cost curve. This cost curve measures solutions in terms of estimated cost (dollars per metric ton of leakage avoided) and potential impact (metric ton of leakage avoided), and is accompanied by further analysis on ease of implementation.
Based on this analysis, several levers are most effective:
• Closing leakage points within the collection system by optimizing transport systems to eliminate illegal dumping, and closing or improving dump sites located near waterways.
• Increasing waste-collection rates by expanding collection service, as plastic waste is more than twice as likely to leak into the ocean if it remains uncollected. Stopping the growth in absolute metric tons of leaked plastic would require that the weighted average collection rate in the five focus countries be doubled, from roughly 40 percent to nearly 80 percent.
• Using a variety of waste-to-fuel (e.g., gasification) or waste-to-energy (e.g., incineration with energy recovery) technologies to treat waste in areas with high waste density. The choice of waste treatment should, of course, align with local priorities, local regulations, and electricity tariffs. (Using these technologies does not preclude a portion of high-residual-value plastics being recovered by the informal sector for recycling.) Pyrolysis also is an option in the medium term; if the cost structure for this technology improves by 25 to 35 percent over the next five years, it could become even more widely used as a substitute treatment option.
• Manually sorting high-value plastic waste and converting much of the remainder to refuse-derived fuel (RDF). This lever, which is specific to areas with low waste density, entails extracting for recycling the 20 percent of plastic waste that has high residual value and converting a substantial portion of the remaining 80 percent to refuse-derived fuel for use in the cement industry. This RDF could replace 3 percent of total coal consumption.
The results of these analyses dispelled some commonly held misconceptions. For example, analysis suggests that recycling alone is not a solution, as about 80 percent of the plastic-waste stream is too low in value to incentivize extraction, and almost 30 percent cannot be distinguished at a polymer level without additional investment in optical sorting equipment.
9
Bans on plastic bags can be effective, but only in specific retail channels and heavily regulated locations. Lightweighting, or reducing the quantity of plastic in packaging, reduces the growth rate of plastic consumption by only a few percentage points while also reducing the incentive for waste workers to manually extract some items, since items will contain less material that can be resold.
4. What can be done to trigger the implementation of leakage-reduction measures in the short, medium, and long term?Based on our findings, three sets of actions are needed. The first two will help reduce plastic-waste leakage in the five focus countries by 65 percent over ten years of implementation (i.e., by 2025, assuming a launch in 2015), which is roughly equivalent to reducing global leakage by 45 percent), and together with the third would help ensure that plastic-waste leakage peaks before 2030 and then continues to decline until the problem is essentially eliminated.
1. Short term. Accelerated development of collection infrastructure and plugging of postcollection leakage to create an almost 50 percent annual leakage reduction by 2020, which would also help ensure availability of sufficient waste feedstock to support waste treatment at scale.
2. Medium term. Development and rollout of commercially viable treatment options to convert over 60 percent of plastic waste to material or energy, using technologies that are already viable or can be developed at an accelerated pace. This would reduce leakage by nearly 16 percent by 2025, for a total reduction of 65 percent by that year.
3. Long term. Innovations in recovery and treatment technologies, development of new materials, product designs that better facilitate reuse or recycling, adoption of alternative food- and beverage-dispensing concepts, and adherence to the broader principles of circularity to ensure a more sustainable plastic life cycle. Together with the short- and medium-term initiatives, these longer-term actions have the potential to essentially eliminate plastic-waste leakage from the priority countries by 2035.
Time to impact will differ significantly, but all three sets of actions should be initiated now to achieve the full potential impact by 2035. The first set, which focuses on improving collection and plugging postcollection sources of leakage, can be done fastest, as the mechanisms to do so are well established. Given the high economic growth and the emergence of a consuming class in the focus countries, we believe it is critical to get this first set of actions to deliver outcomes soon. The solutions will need to move faster than the growth in the problem.
This study focuses on the first two sets of actions because we believe they make it possible to achieve dramatic improvements in the short and medium term. Moreover, these two sets of levers are not plastic specific; they target the entire waste stream and as such can be a solution for land-sourced marine debris in general. If executed today, the total program would cost about $5 billion a year but would largely overlap with existing efforts to improve waste management in these booming economies. (For example, China is already in the process of expanding its capacity for incineration with energy recovery.)
An accelerated program in the five countries, however, will require high-performing public-private partnerships launched in conjunction with appropriate enabling national and local policies and effective enforcement once policies are in place. Capital-investment plans, waste-management budgets, and existing donor/multilateral project spending can be leveraged toward the program’s goals; however, private-sector investments will likely be required to reach the reduction targets. The chemical and consumer-goods industries could help catalyze public and private investments by strategically reducing capital costs through, for example, equity participation, first-loss positions, offtake agreements, and price guarantees. The third set of actions is critical to sustaining decreased plastic-waste leakage in the long term, but as the impact would be predominately beyond 2025, these actions have received less focus in this report.
10
5. What are the cornerstones of a concerted program for global action?Because of the scale of the problem, the next ten years will be critical. Current international momentum around this issue has created a window of opportunity for developing a global agenda that can resolve this tremendous challenge. The architecture of such a global program will have to reflect the local nature of waste management, secondary material markets, and consumer and waste-worker communities. It will also have to recognize the role of the largest producers of resin, packaging, and consumer goods.
Bringing together these different stakeholders and interests will require a coalition, which must have a central mechanism for creating alignment and harnessing the unique abilities of each constituency to contribute to the global solution. This coalition should develop and execute an implementation plan along the following six areas for action:
1. Political leadership and commitment. Obtain real and meaningful commitments from national governments, governors, and mayors to set and achieve ambitious waste-management targets.
2. On-the-ground wins. Provide local “proofs of concept” for integrated waste-management approaches in carefully selected beta cities (chosen based on the joint economics of good waste management and local co-benefits). This will require global expertise in waste-management engineering, innovative on-the-ground delivery mechanisms, and formal project financing.
3. Critical mass. Using lessons learned in beta cities, build a best-practice transfer mechanism that can accelerate the transfer of global expertise to high-priority cities and regions.
4. Prerequisites for funding. Ensure that required project-investment conditions are met in the private, public, and multilateral sectors alike. Work with industry (likely the plastic-resin, packaging, consumer-goods, retail, and waste-management sectors) on mechanisms to de-risk waste-management project-finance investments.
5. Technology-implementation support. Provide state-of-the-art waste-management technology providers with detailed data on waste composition, volume, and pathways; local infrastructure; wage structure; waste-picker systems; feedstock-supply security; energy prices; feed-in tariffs; and offtake agreements.
6. Issue prioritization. Bring leadership and strategic focus on solutions to the ocean-plastic challenge as part of the global policy agenda on the ocean.
Increasing clarity about plastic-waste leakage volumes and the waste’s effects on the ecosystem, as well as new information about solution economics and action levers—together with emerging private-sector, government, and multilateral support—makes this a good time to elevate the agenda for reducing leakage from the global plastic value chain. This study outlines a path that can generate considerable benefits to communities, preserve the bioproductivity of the ocean, and reduce risks for industry. It shows that, over the next ten years, concerted action in the form of a $5 billion annual ramp-up in waste-management spending could create a vibrant secondary resource market, trigger investment in packaging and recovery systems, and let the ocean thrive. The drivers of the ocean plastic-reduction agenda should convene and jointly define the architecture of such a global program, the actors who should be involved, and the funds required to drive a flagship initiative that stands for a new, collaborative, and effective way of addressing this global challenge.
11
Introduction Plastic is one of the most versatile inventions of our time and has unrivaled application at a material level. But it has become evident that in the absence of basic waste management and advanced recovery systems, the single-use nature of plastic increases the likelihood that unmanaged plastic waste will reach the ocean, which acts as the planet’s ultimate sink. Plastic has been identified as a major component of marine debris, because of its prevalence in the waste stream and its longevity.7 While there are currently no widely accepted scientific estimates of the ocean’s absorptive capacity of plastics, the issue is of high importance. Once in the ocean, plastic particles are highly persistent. Persistence varies by polymer as well as the form and use of the plastic itself, but in many cases, the plastic is believed to exist in recognizable forms for hundreds of years. After the form is no longer recognizable, it is unclear how long the smaller particles continue to circulate. This poses a challenge to ecosystems, especially given that plastic is known to absorb other pollutants and is consistently found in nearly all forms of marine life.
The Joint Group of Experts on the Scientific Aspects of Marine Environmental Protection (GESAMP), a UN-sponsored advisory body, concluded that microplastics can affect the physiology of host organisms and potentially compromise their health. Studies have also linked plastics to physiological stress, liver cancer, and endocrine dysfunction in fish that ingest them.8 And there are indications that ingesting plastic can affect fertility in female fish as well as the growth of reproductive tissue in male fish.9 This is a problem not just for marine life, but also for the global fishing industry, which employs 55 million people, is valued at approximately $220 billion,10 and provides 15 percent of the world’s dietary protein. Some studies have shown that plastic even affects lugworms, amphipods, and other organisms at the very base of the marine food web.11 The complex toxicology of plastic and its associated substances and the ways they affect the oceanic food chain, including humans, will require further study.
There has long been a vacuum in what is an increasingly global, increasingly vocal debate about the health of the ocean. Specifically, there has been little quantitative analysis of either the sources or the amount of plastic that leaks into the ocean. Therefore, no holistic, phased solution set has been proposed to address this problem. Recently, however, a series of analytical endeavors, including the analysis represented in this report, have begun to fill this void.
A paper published in early 2015 in Science estimates that approximately 8 million metric tons of plastic leaks out of the global economy and into the ocean each year.12 This suggests that in the absence of meaningful interventions, the world’s ocean will contain nearly 250 million metric tons of plastic by 2025. But like an iceberg, the visible manifestation of the plastic problem is very small. Both the vast quantities of waste such as the North Pacific gyre—sometimes referred to as the “Great Pacific Garbage Patch”—and the considerable quantities of waste routinely found during annual beach cleanups around the world are likely less than 5 percent of the plastic that enters the ocean every year.13 The remaining 95 percent is not at the surface and is essentially impossible to extract at scale once it has entered the ocean, which suggests that efforts to control this issue must address the land-based sources of waste, rather than symptoms of pollution once it reaches the ocean.
The massive growth to date in plastic-waste leakage stems from a substantial—and entirely predictable—increase in the overall use of plastic. This increase is correlated primarily with decreasing poverty, growing incomes, and rising consumption in fast-growing emerging markets, coupled with underdeveloped waste-management systems in these countries. To date, a significant portion of global leakage (estimated by Science to be between 55 and 60 percent) comes from five emerging markets where growth is particularly fast: China, Indonesia, the Philippines, Thailand, and Vietnam.14 However, it must also be noted that more than 25 percent of leakage originates outside Asia, so the struggle to reduce plastic-waste leakage into the ocean remains a global effort.
12
The analysis in Science was based on the rate of generation of waste, the composition of plastic within that waste, and the effectiveness of local waste-management systems when collecting and processing it. The analysis assumes population growth rates as well as growth rates for the percentage of waste that is plastic, but is based on a business-as-usual scenario, which may for many countries be a best-case situation. In some places, new pressures could create even higher levels of leakage. For example, continued urbanization could drive up per capita waste-generation growth rates in some countries, and the shift toward disposable consumer goods will continue.15 Also, the assumptions in Science were based on leakage primarily from coastal communities (populations living within 50 kilometers of the coast), but there is some evidence that rivers and waterways also can contribute significantly to leakage by transporting waste from communities much further inland. To develop a more granular understanding of plastic-waste leakage, our research included field visits to two countries—China and the Philippines. The goal was to identify the sources and pathways of leakage, assess the relative benefits (in economic and leakage-reduction terms) of different solutions, and ultimately lay the foundations for an implementation plan to address the challenge of controlling leakage across all five focus nations.
With 48 million metric tons of plastic waste and 5 million metric tons of plastic-waste leakage per year, China generates relatively little waste per capita but was identified by the researchers behind the Science article as the largest source of global leakage. It is also important to note that China is home to the world’s largest recycling industry, importing over 50 percent of the global trade for end-of-life plastic, and could therefore be a major driver of solutions. The Philippines (with 2.7 million metric tons of plastic waste and half a million metric tons of plastic-waste leakage per year) was the site of our second set of field visits. This choice was based on early evidence of high collection rates and positive momentum toward the commercial treatment options we had hypothesized would be a linchpin around which to build a solution set.
In addition to field visits in China and the Philippines, we consulted more than 100 experts from more than 50 organizations (a full list is available online with the electronic version of this report). In many cases, the public data we wished to gather were either unavailable or of insufficient quality to complete our analysis. In these instances, we made assumptions using case studies and expert input. Some of our assumptions will therefore be qualitative, and we hope that as the technical ability to assess the movement of plastic into the ocean improves, analysts will be able to further refine these numbers. We accept that the accuracy of the results is based upon the relative strength or weakness of the assumptions made, and details on the calculation methodology (along with all numbers and assumptions used) are available online with this report. For this reason, our key outputs are ranged and should be used as indicative rather than precise metrics. We took great care to make transparent all the assumptions and numbers we used. With this caveat, this report offers a number of new-to-the-world insights that we hope will underpin future debate around and understanding of plastic-waste leakage. We also hope this report will mobilize a diverse set of stakeholders to start down an accelerated path to substantive reductions in plastic-waste leakage.
13
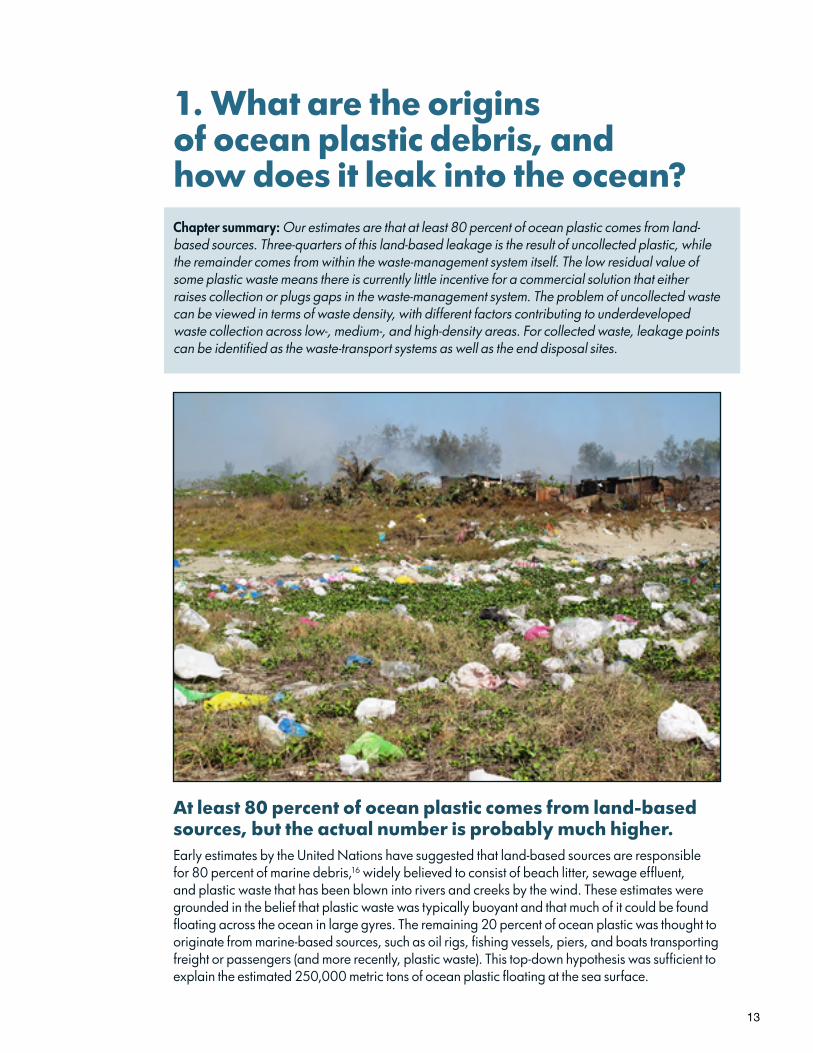
1. What are the origins of ocean plastic debris, and how does it leak into the ocean? Chapter summary: Our estimates are that at least 80 percent of ocean plastic comes from land-based sources. Three-quarters of this land-based leakage is the result of uncollected plastic, while the remainder comes from within the waste-management system itself. The low residual value of some plastic waste means there is currently little incentive for a commercial solution that either raises collection or plugs gaps in the waste-management system. The problem of uncollected waste can be viewed in terms of waste density, with different factors contributing to underdeveloped waste collection across low-, medium-, and high-density areas. For collected waste, leakage points can be identified as the waste-transport systems as well as the end disposal sites.
At least 80 percent of ocean plastic comes from land-based sources, but the actual number is probably much higher.Early estimates by the United Nations have suggested that land-based sources are responsible for 80 percent of marine debris,16 widely believed to consist of beach litter, sewage effluent, and plastic waste that has been blown into rivers and creeks by the wind. These estimates were grounded in the belief that plastic waste was typically buoyant and that much of it could be found floating across the ocean in large gyres. The remaining 20 percent of ocean plastic was thought to originate from marine-based sources, such as oil rigs, fishing vessels, piers, and boats transporting freight or passengers (and more recently, plastic waste). This top-down hypothesis was sufficient to explain the estimated 250,000 metric tons of ocean plastic floating at the sea surface.
14
It is now generally accepted that only a fraction of ocean plastic is visible, and that ill-designed and -operated waste-management systems—not just beach litter, sewage, or blowing plastic—contribute substantially to ocean plastic, particularly in the developing world. An evaluation of the propensity of waste-collection systems to leak plastic waste into the ocean suggests a figure close to 8 million metric tons of leakage per year. In fact, we estimate that the ocean may already contain upward of 150 million metric tons of plastic, based on global plastic production since 1950. This suggests that, in fact, the contribution of land-based sources to ocean plastic may be an even larger share of the problem than originally believed.
Three-fourths of land-sourced ocean plastic comes from uncollected waste or litter, while the remainder comes from gaps in the collection system itself.Finding ways to stem land-sourced plastic-waste leakage requires first an understanding of where it occurs and what pathways the plastic waste follows to the ocean. Early hypotheses pose a wide range of possibilities—everything from beach litter to typhoons. Analysis suggests that while uncollected waste was certainly the major contributor, another driver of this problem was leakage from underdeveloped collection systems.
Large amounts of waste or litter are abandoned in public places, where it awaits decomposition, burning, or use as animal feed. Much of this uncollected waste is directly deposited into and around rivers and other water bodies that present direct pathways into the marine ecosystem; on average, roughly a tenth of waste deposited in or near waterways is plastic. Making assumptions about waste-leakage rates based on geographic proximity to rivers and the coast at the level of provinces, we were able to estimate that in the priority countries, for every metric ton of uncollected waste near waterways, almost 18 kilograms of plastic enter the ocean—equivalent to the weight of more than 1,500 PET bottles.17
Plastic waste is much less likely to leak into the ocean once it is within a collection system. However, because collection systems aggregate large quantities of waste, even a few points of post-collection leakage create avenues for substantial amounts of plastic waste to escape into the ocean and other waterways. Making assumptions about waste-leakage rates based on the geographic proximity of disposal sites to waterways, as well as comparing the quantities of waste received at those disposal sites with the quantities estimated to have entered the collection system, we calculated that in the priority countries, for every metric ton of plastic waste that is collected, as much as 7 kilograms of plastic waste are leaked to the ocean between collection and disposal—less than half the amount leaked from uncollected waste.
In short, simply collecting waste into a management system significantly reduces its chances of leaking into the ocean. But waste-management systems are not yet an airtight way to prevent plastic-waste leakage.
Low-residual-value plastic waste is more likely to leak than high-value plastic.Eighty percent of plastic waste has low residual value, and these plastics are a large percentage of the waste at the disposal facilities from which much ocean plastic originates. Higher-residual-value plastics are more likely to be collected from disposal sites and then resold. This means that products or packaging with low residual value (plastic shopping bags, for instance) are less likely to be collected; they therefore become a particularly significant contributor to ocean plastic. This is perhaps the first time a study has identified the main sources of marine plastic at the level of individual products.18
15
In general, more than 85 percent of plastic extraction for recycling in the focus countries takes place at points of aggregation, rather than within individual households.19 But almost 60 percent of plastic waste is not collected and therefore never aggregated.20 And because the average material value of plastic waste is often not high enough to support the collection and transportation costs associated with either a mechanical or a manual process of aggregating just the plastic waste, places that do not have publicly funded waste collection are even less likely to have plastic waste collected.
For the just over 40 percent of plastic waste that is collected in the five focus countries, waste pickers are relatively efficient at extracting high-residual-value plastic materials; in some cases (for example, the Philippines), extraction rates for polyethylene bottles reach 90 percent. Low-residual-value plastics, in contrast, are neglected; collection rates are close to 0 percent. Waste pickers simply cannot generate enough wages from low-value plastics to warrant the time spent collecting them.
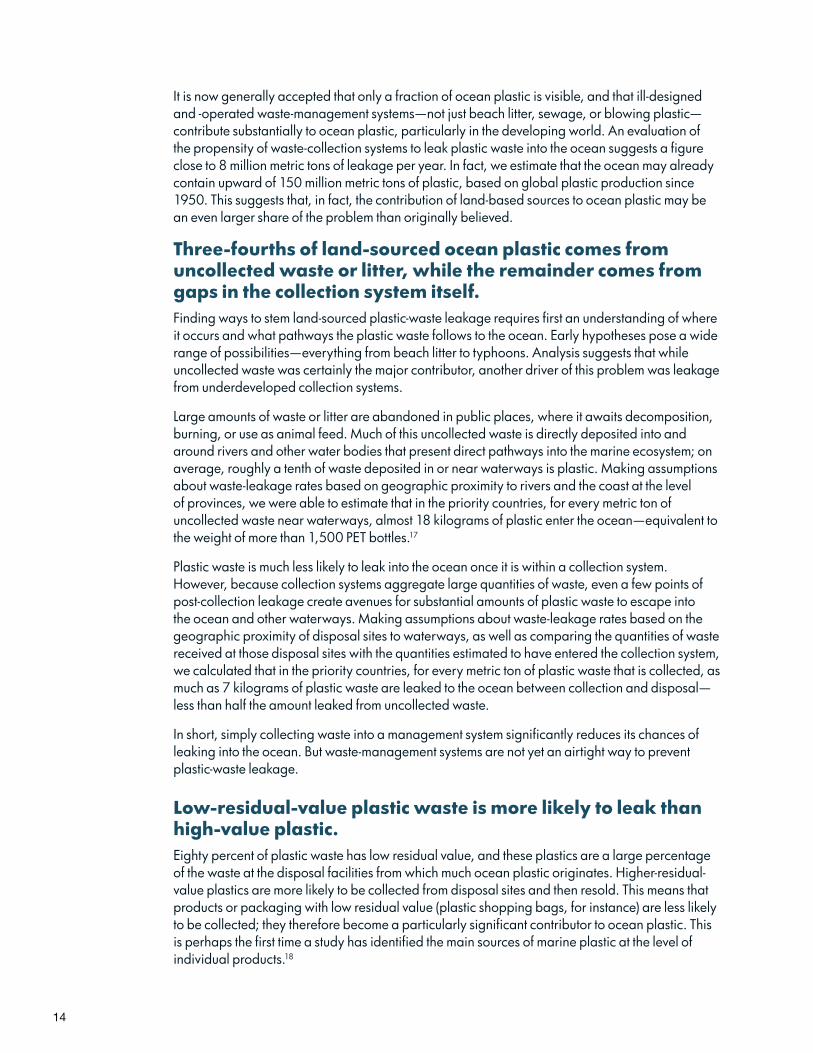
We calculated the earnings for waste pickers using two metrics: the material value of the plastic waste in terms of the price paid for it by primary buyers (“junk shops”), and the average amount of time taken to extract the item from the waste stream. Over a ten-hour collection day focused exclusively on plastic bags, a waste picker might earn as little as $.50 (Exhibit 2).21 Were the waste picker to focus on PET bottles, however, he or she might earn more than seven times that amount.
Interestingly, certain products, such as those made from HDPE, have collection rates that are lower than expected when viewed in the context of the potential earnings from their extraction. These products are either less homogeneous (chemically, for instance), more difficult to recognize, or less likely to be high-purity polymers (meaning free of material contamination). Any of these factors make them a more risky focus of waste pickers’ time.
Exhibit 2 Waste pickers are less likely to collect low-value, high-bulk plastic waste.
1 Assuming 10-hour collection day of waste type specified; 2 Polypropylene; 3 Polyethylene terephthalate; 4 Not all high-density-polyethylene products will fetch the same price at a junk shop or be easily recognizable by waste pickers.
Source: Expert interviews; field visits; National Solid Waste Management Commission (Philippines); McKinsey analysis
37
Plastic bag 61
HDPE4 21
PET3 37
PP2
0.5
3.7
4.6
2.0
Price paid/ kilogram$
.05
.12
.16
.23
Day’s1 wages$
Time needed to collect 1 kilogram of waste (minutes)
16
Waste-picker communities tend to be fairly well defined. From our interviews with local experts, we know that they are often elderly (as in Hong Kong and China) or members of a particular ethnic, religious, or caste group (as in South Asia) or migrants (as in the Philippines), and tend to be a closed society. They operate in extremely hazardous conditions, surrounded by waste that spontaneously combusts in extreme heat, and they are highly exposed to disease agents. There is substantial research suggesting that the life spans of waste-picker communities are significantly below the population average.22 In the countries we studied, the main economic focus appears to be subsistence, and there are self-imposed limits on individual capacity as well as socially defined limits on the community’s numbers. With a plastic-waste growth rate that exceeds any estimate of the growth rate of waste pickers, it is unlikely that waste pickers will have any incentive to start extracting low-residual-value plastics. Further, waste picking is characterized by low wages and poor working conditions, and is not a preferred long-term solution. While we don’t suggest taking away livelihoods, we also don’t want to suggest that the solution to the world’s waste-management problems is to train a new generation of waste pickers. As discussed in this report, longer-term solutions naturally include more aggregation and collection, which will facilitate technology deployment for automated sorting of recyclables, which will likely reduce the dependence on manual sorting over the long term.
Collected and uncollected plastic waste enters the ocean from five physical locations.Our in-depth studies in China and the Philippines included a comprehensive analysis of leakage sources. Based on our findings, we concluded that plastic enters the ocean from five places:
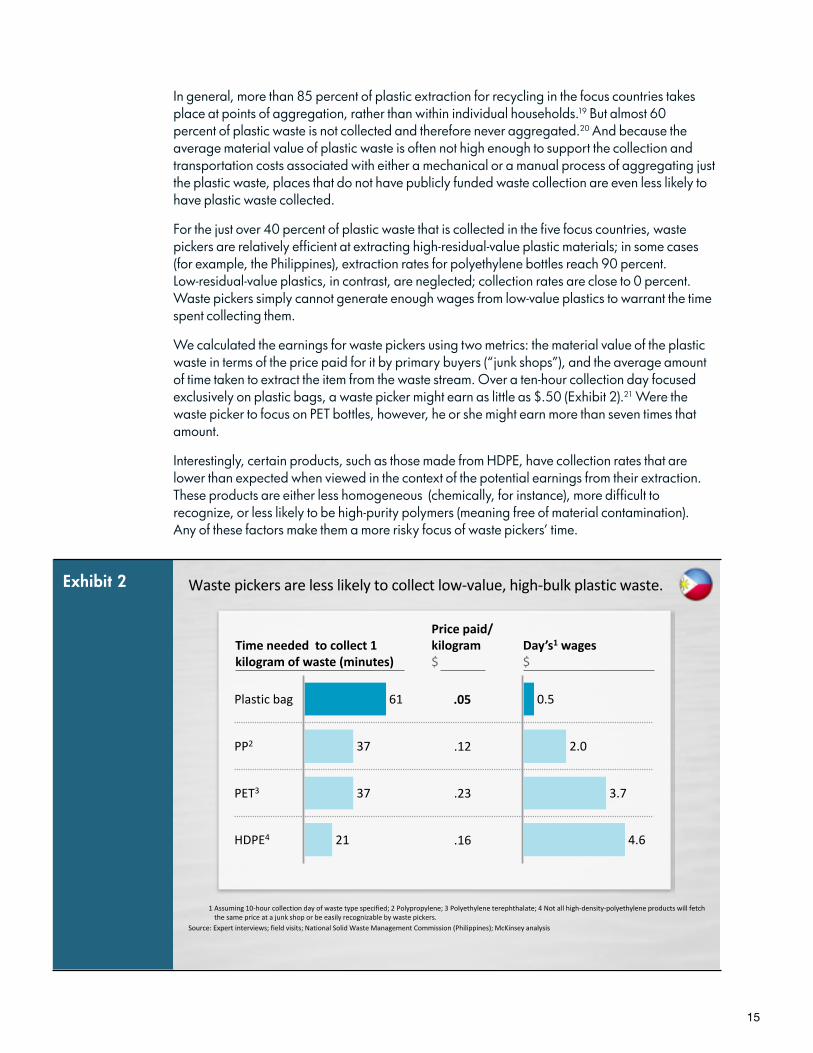
1. Low-waste-density rural areas that do not have collection services.23 In most rural areas around the world, waste-collection rates are lower than in urban areas; this is particularly true in rural areas of China and the Philippines, where collection rates were frequently lower than 10 percent in individual districts. Even in low-waste-density areas, there is a cumulative effect across the vast rural populations. In our five focus countries, uncollected waste from these sources contributes between 1.7 million and 2.1 million metric tons of plastic to the ocean per year.
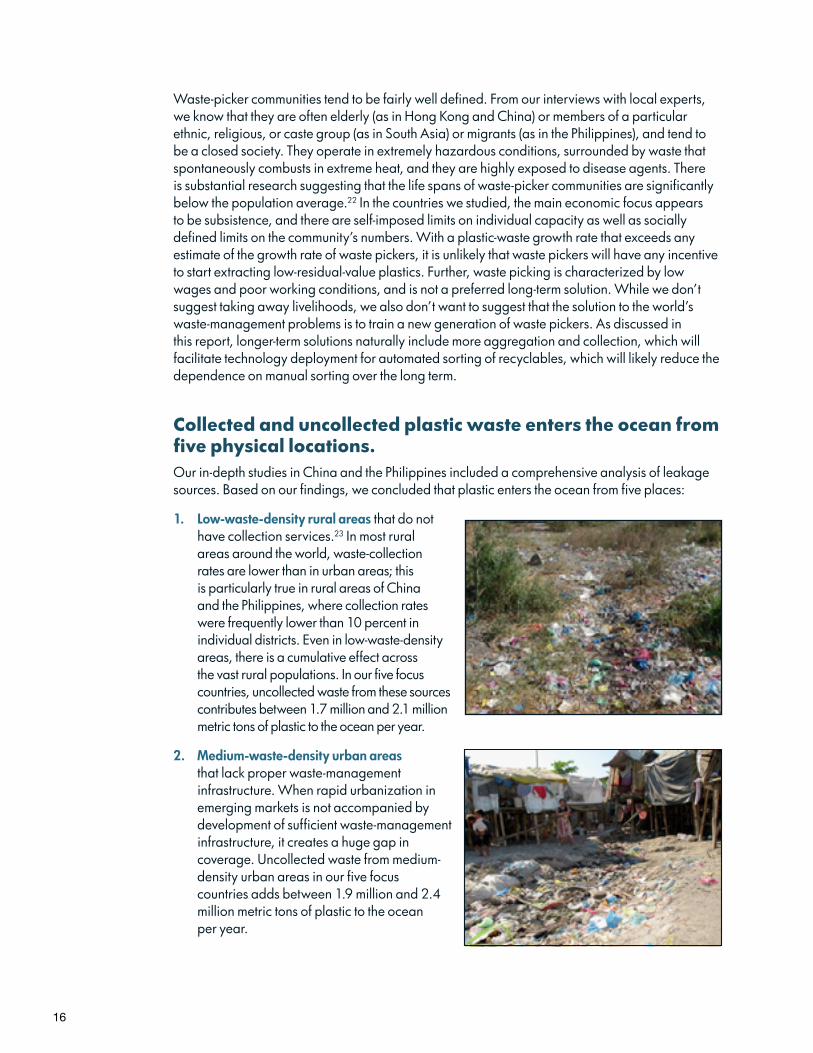
2. Medium-waste-density urban areas that lack proper waste-management infrastructure. When rapid urbanization in emerging markets is not accompanied by development of sufficient waste-management infrastructure, it creates a huge gap in coverage. Uncollected waste from medium-density urban areas in our five focus countries adds between 1.9 million and 2.4 million metric tons of plastic to the ocean per year.
17
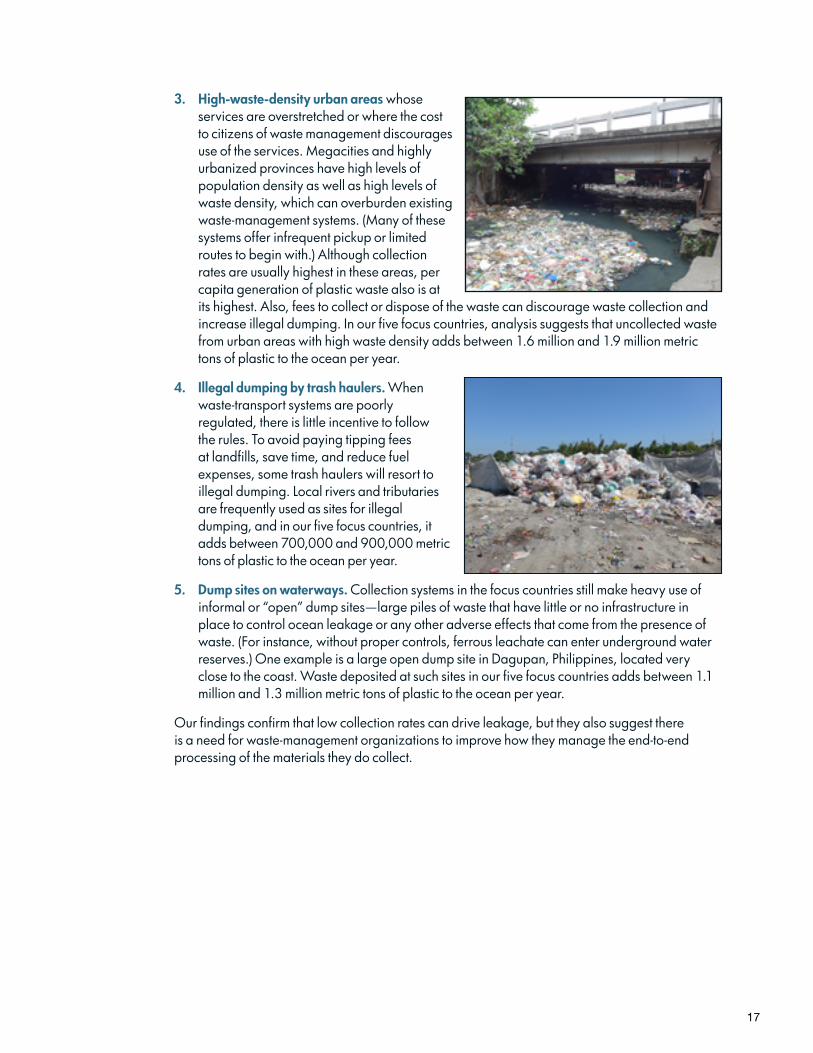
3. High-waste-density urban areas whose services are overstretched or where the cost to citizens of waste management discourages use of the services. Megacities and highly urbanized provinces have high levels of population density as well as high levels of waste density, which can overburden existing waste-management systems. (Many of these systems offer infrequent pickup or limited routes to begin with.) Although collection rates are usually highest in these areas, per capita generation of plastic waste also is at its highest. Also, fees to collect or dispose of the waste can discourage waste collection and increase illegal dumping. In our five focus countries, analysis suggests that uncollected waste from urban areas with high waste density adds between 1.6 million and 1.9 million metric tons of plastic to the ocean per year.
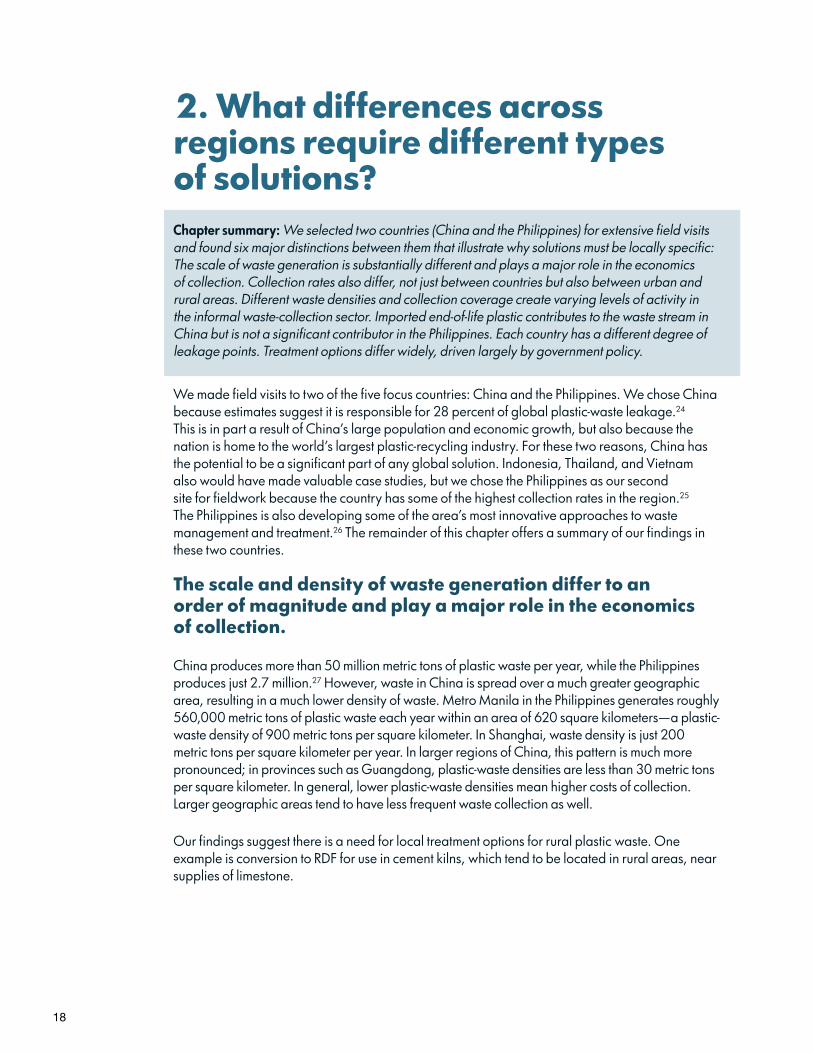
4. Illegal dumping by trash haulers. When waste-transport systems are poorly regulated, there is little incentive to follow the rules. To avoid paying tipping fees at landfills, save time, and reduce fuel expenses, some trash haulers will resort to illegal dumping. Local rivers and tributaries are frequently used as sites for illegal dumping, and in our five focus countries, it adds between 700,000 and 900,000 metric tons of plastic to the ocean per year.
5. Dump sites on waterways. Collection systems in the focus countries still make heavy use of informal or “open” dump sites—large piles of waste that have little or no infrastructure in place to control ocean leakage or any other adverse effects that come from the presence of waste. (For instance, without proper controls, ferrous leachate can enter underground water reserves.) One example is a large open dump site in Dagupan, Philippines, located very close to the coast. Waste deposited at such sites in our five focus countries adds between 1.1 million and 1.3 million metric tons of plastic to the ocean per year.
Our findings confirm that low collection rates can drive leakage, but they also suggest there is a need for waste-management organizations to improve how they manage the end-to-end processing of the materials they do collect.
18
2. What differences across regions require different types of solutions? Chapter summary: We selected two countries (China and the Philippines) for extensive field visits and found six major distinctions between them that illustrate why solutions must be locally specific: The scale of waste generation is substantially different and plays a major role in the economics of collection. Collection rates also differ, not just between countries but also between urban and rural areas. Different waste densities and collection coverage create varying levels of activity in the informal waste-collection sector. Imported end-of-life plastic contributes to the waste stream in China but is not a significant contributor in the Philippines. Each country has a different degree of leakage points. Treatment options differ widely, driven largely by government policy.
We made field visits to two of the five focus countries: China and the Philippines. We chose China because estimates suggest it is responsible for 28 percent of global plastic-waste leakage.24 This is in part a result of China’s large population and economic growth, but also because the nation is home to the world’s largest plastic-recycling industry. For these two reasons, China has the potential to be a significant part of any global solution. Indonesia, Thailand, and Vietnam also would have made valuable case studies, but we chose the Philippines as our second site for fieldwork because the country has some of the highest collection rates in the region.25 The Philippines is also developing some of the area’s most innovative approaches to waste management and treatment.26 The remainder of this chapter offers a summary of our findings in these two countries.
The scale and density of waste generation differ to an order of magnitude and play a major role in the economics of collection.
China produces more than 50 million metric tons of plastic waste per year, while the Philippines produces just 2.7 million.27 However, waste in China is spread over a much greater geographic area, resulting in a much lower density of waste. Metro Manila in the Philippines generates roughly 560,000 metric tons of plastic waste each year within an area of 620 square kilometers—a plastic-waste density of 900 metric tons per square kilometer. In Shanghai, waste density is just 200 metric tons per square kilometer per year. In larger regions of China, this pattern is much more pronounced; in provinces such as Guangdong, plastic-waste densities are less than 30 metric tons per square kilometer. In general, lower plastic-waste densities mean higher costs of collection. Larger geographic areas tend to have less frequent waste collection as well.
Our findings suggest there is a need for local treatment options for rural plastic waste. One example is conversion to RDF for use in cement kilns, which tend to be located in rural areas, near supplies of limestone.
19
Collection rates differ, not just between countries but also between urban and rural areas.
The Philippines has remarkably high collection rates; the nationwide average is roughly 85 percent—and near 90 percent in some dense urban areas, such as metro Manila.28 Rates are 80 percent or lower in less dense areas, such as the autonomous region in Muslim Mindanao, but even some very rural areas have collection rates above 40 percent. (Rates are close to zero for similar locations in other parts of Asia, including Indonesia.) High rates of collection might be due to the extensive involvement of local communities, or barangay, in waste-collection services, with key legislation such as the Ecological Solid Waste Management Act of 2000 (Republic Act 9003) formally delegating many waste-management services to these groups.
In China, overall collection rates are much lower: just under 40 percent of the approximately 440 million metric tons of waste generated each year.29 Urban areas in China collect almost 65 percent of waste; rural collection rates, which are under 5 percent, pull down the average significantly. Residents of rural areas have traditionally resorted to informal waste disposal, such as burning or river dumping, and many of these practices are still the most common method of waste management in these areas.
Higher collection rates in urban locations (coupled with higher waste-generation rates) would make it possible for these locations to meet the high, consistent levels of throughput required by capital-intensive waste treatments such as gasification and incineration with energy recovery.
Differences in waste density and collection coverage create varying levels of activity in the informal waste-collection sector.
Waste density and collection coverage drive overall levels of waste aggregation, which is an important factor to consider when attempting to scale either informal or formal collection systems. For example, in the Philippines, waste pickers sometimes recover elements of the waste stream that have high residual value (such as metals) at rates close to 100 percent. The plastic component of the Philippines’ waste stream has a recovery rate of only about 25 percent.30 But within this number, a distinction can be made between high-residual-value plastics, such as PET bottles (90 percent recovery) and some HDPE products (40 percent recovery), and low-residual-value plastics, such as composite materials, plastic bags, and most thin films (less than 5 percent recovery). The residual value is a function of product homogeneity, time to collect, and resale price. For example, PET bottles are easy to recognize, can be physically picked up quickly, and are easy to sell at numerous local junk shops.
In the Philippines, waste picking takes place at four distinct points in the waste-management system: precollection at the household or street level; during the hauling process, with waste pickers extracting waste while riding on trucks as they move; at material-recovery facilities (MRFs), with waste pickers providing the human engine behind what is essentially an entirely manual system in most of the Philippines; and at the landfill or dump site.31 The second and third points in the system—hauling and MRFs—appear to be the most profitable for waste pickers, who are prepared either to pay for access or to provide a service (such as the manual MRF function) in exchange for the right to operate at these sites.
While China also has a substantial waste-picker population (reports indicate as many as 5 million), they are fewer per capita than in many other countries, and they work from fewer waste-aggregation points. Some parts of the collection system are much harder for waste pickers to
20
penetrate; roughly 80 percent of China’s collected waste is treated at incinerators or sanitary landfills, rather than open dumps.32 As a result of more restricted operations, waste pickers at the precollection stage seem to focus much more narrowly on the highest-value segments of the waste stream, such as metals or even paper and cardboard, while those working at open dump sites often also feed cattle on the organic portion of the waste. Of the plastic component of waste, only around 11 percent appears to be extracted by waste pickers,33 although China has the largest waste-recycling industry in the world.
We believe that in locations where the full waste stream cannot be treated together (as would be the case for gasification), manual waste picking can continue to be an effective way to recover high-residual-value plastic waste, but that recovering low-residual-value plastic would require an alternative treatment option, such as conversion to RDF.
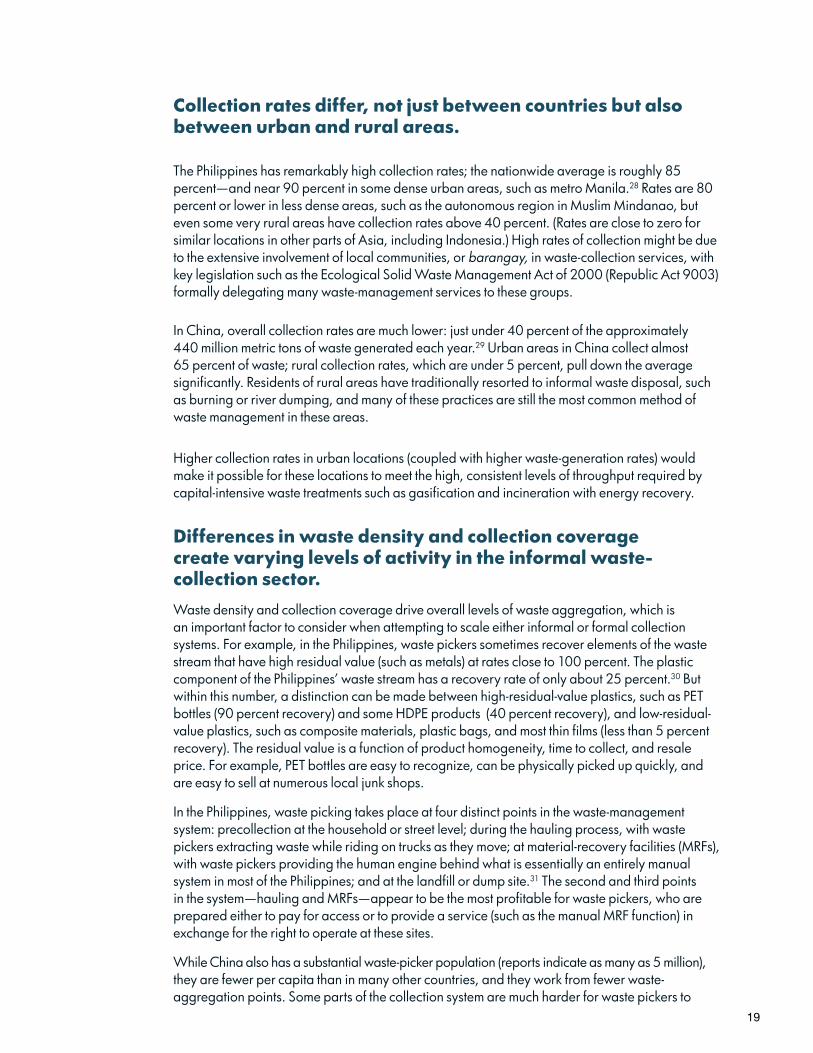
It should be noted that waste picking in its current form is an extremely hazardous profession for several reasons: significant health risks are associated with working in constant proximity to materials that have high levels of toxicity (for instance, bacterial household waste and ferrous leachate), there is a constant threat of “junk slides” at dump sites, and waste can at any time combust—even catching fire just from sunlight. Therefore, important parts of any waste-system improvements should include bettering the working conditions of waste pickers as dump-site improvements are made and in the long term helping these workers build useful skills as automated sorting technology gets deployed.
Imported end-of-life plastic contributes to the waste stream in China but is not a significant contributor in the Philippines.
Plastic-waste leakage in the Philippines comes primarily from local plastic consumption. In contrast, China is a net importer of plastic waste, bringing in almost 9 million metric tons a year, according to the International Solid Waste Association. The bulk of this plastic ends up in just 6 of China’s 31 provinces.34 Historically, the bulk of China’s plastic-waste imports came from the United States and Europe, but China has also become an attractive market for plastic-waste exports from countries in its own region, including the Philippines.
21
Still, the import of plastic waste into China appears to have declined as a result of the “Green Fence,” a policy intended to curb the import of low-residual-value plastic waste that is rejected by recyclers and burdens the local waste stream.35 Estimates of recycling yields suggest that as much as 20 percent of imported plastic may still enter the waste stream, accounting for roughly 4 percent of total plastic waste in China.
Our findings suggest that a separate solution is not required for imported plastic waste. Rather, its contribution to ocean plastic can be mitigated using general solutions aimed at reducing plastic-waste leakage from the local waste stream.
Each country has different leakage points.
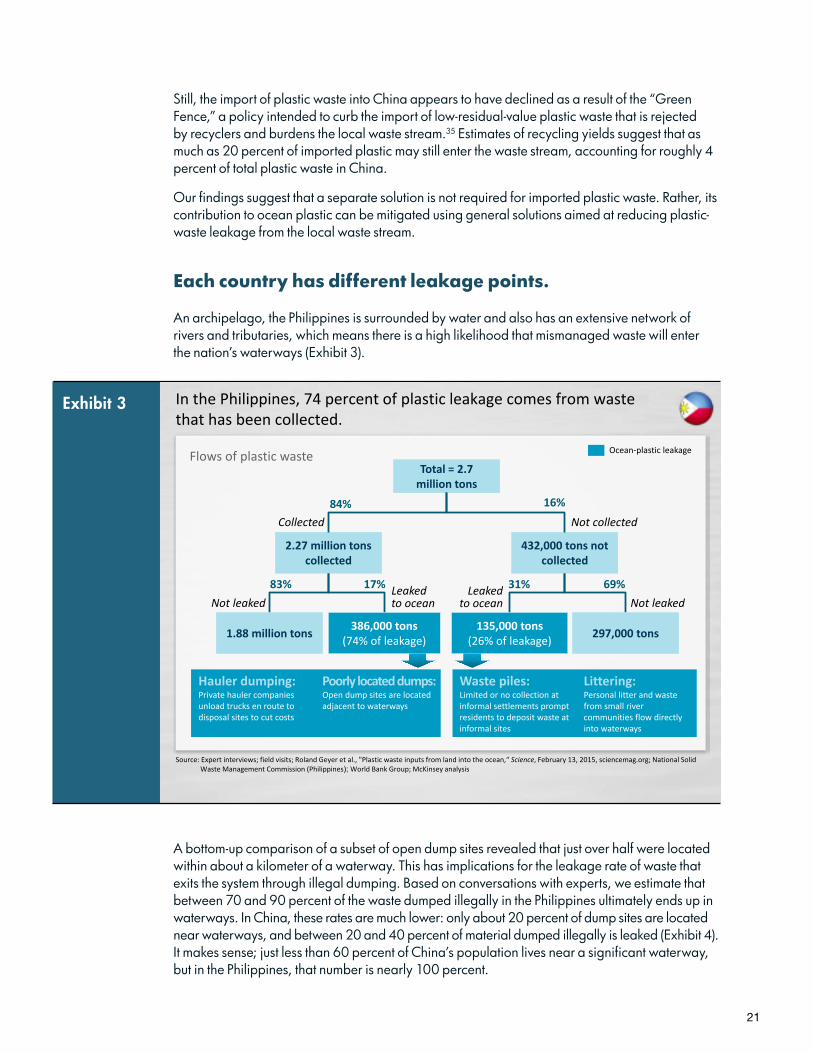
An archipelago, the Philippines is surrounded by water and also has an extensive network of rivers and tributaries, which means there is a high likelihood that mismanaged waste will enter the nation’s waterways (Exhibit 3).
A bottom-up comparison of a subset of open dump sites revealed that just over half were located within about a kilometer of a waterway. This has implications for the leakage rate of waste that exits the system through illegal dumping. Based on conversations with experts, we estimate that between 70 and 90 percent of the waste dumped illegally in the Philippines ultimately ends up in waterways. In China, these rates are much lower: only about 20 percent of dump sites are located near waterways, and between 20 and 40 percent of material dumped illegally is leaked (Exhibit 4). It makes sense; just less than 60 percent of China’s population lives near a significant waterway, but in the Philippines, that number is nearly 100 percent.
In the Philippines, 74 percent of plastic leakage comes from waste that has been collected.
Source: Expert interviews; field visits; Roland Geyer et al., "Plastic waste inputs from land into the ocean,“ Science, February 13, 2015, sciencemag.org; National Solid Waste Management Commission (Philippines); World Bank Group; McKinsey analysis
Flows of plastic waste Ocean-plastic leakage
Total = 2.7 million tons
2.27 million tons collected
432,000 tons not collected
Not leakedLeaked to ocean
84% 16%
83% 17%Not leaked
1.88 million tons 386,000 tons (74% of leakage) 297,000 tons135,000 tons
(26% of leakage)
31% 69%Leaked to ocean
Hauler dumping: Private hauler companies unload trucks en route to disposal sites to cut costs
Poorly located dumps: Open dump sites are located adjacent to waterways
Waste piles:Limited or no collection at informal settlements prompt residents to deposit waste at informal sites
Littering:Personal litter and waste from small river communities flow directly into waterways
Collected Not collected
Exhibit 3

22
We believe that policy and regulatory measures, such as improved monitoring of waste-transport systems or closing of open dump sites, can be focused on specific areas or provinces in some locations (such as China), but in archipelagos, it is imperative that these measures be implemented virtually everywhere. And, of course, if improved policy and regulatory measures are to drive change, they must be accompanied by effective enforcement.
Treatment options differ widely, driven largely by government policy.
Treatments that convert waste to energy need to take into account the constraints of the regulatory environment in which they are implemented. Regulatory policy ultimately dictates waste-treatment feasibility (through prohibition) and commercial viability (through feed-in tariffs).
In the Philippines, most waste that is formally collected is disposed of at one of just over 600 open or controlled dump sites;36 the remainder is sent to one of the country’s approximately 70 sanitary landfills. Sophisticated treatment options are rare; incineration is banned (although some low-grade pyrolysis takes place), and a few gasification projects are currently being developed. In China, however, incineration is a significant and growing industry.37 About 140 incinerators are operational, and an additional 230 incinerators are in development.
Our findings make it clear that there is no “one size fits all” approach to preventing plastic-waste leakage, and that neither China nor the Philippines serves as a perfect model for other nations. The five focus countries are at different stages of economic development, have varying levels of sensitivity to marine leakage, have different waste-management practices, and provide different degrees of incentives for entrepreneurial commercial waste treatment. We have made cautious assumptions about each of the five countries in order to model plastic-waste leakage—and solutions to the problem—across the five countries based on the data collected from the Philippines and China. The findings are presented in the next chapter.
Ocean-plastic leakage
In China, 84 percent of plastic leakage comes from waste that has not been collected.
Flows of plastic wasteTotal = 48.1 million tons
18.8 million tons collected
29.3 million tons not collected
40%1 60%1
18 million tons 0.8 million tons (16% of leakage) 25.1 million tons4.2 million tons
(84% of leakage)
96% 4% 14% 86%Not leaked
Leaked to ocean Not leaked
Leaked to ocean
Waste piles:Plastic waste from rural communities routinely disposed of into waterways
Littering:Personal litter and waste from small river communities flow directly into waterways
Source: China Statistical Yearbook, 2014; expert interviews; Roland Geyer et al., "Plastic waste inputs from land into the ocean,“ Science, February 13, 2015, sciencemag.org; World Bank Group; McKinsey analysis,
1 Not including residual waste from imported plastic, estimated at between 1.0 million and 1.5 million metric tons per year.2 Based on aggregate of urban and rural waste.
Hauler dumping: Private hauler companies unload trucks en route to disposal sites to cut costs
Poorly located dumps: Open dump sites are located adjacent to waterways
Not collectedCollected
Exhibit 4
23
3. What leakage-reduction solutions are available, and what are their relevant economics? Chapter summary: We cataloged 33 potential solutions to the ocean-plastic problem and analyzed 21 of them in detail. We found that maximum impact can be achieved from six solutions: Expand collection service and ultimately increase waste-collection rates (plastic waste is more than twice as likely to leak if it remains uncollected). Close leakage points within the collection system (7 percent of collected waste currently leaks into the ocean). Keep leakage points in the system closed by using commercial treatment that increases the value of plastic waste. Convert waste to fuel or electricity in areas that have high waste density. Manually sort waste in areas with low waste density to extract for recycling the 20 percent of plastic waste that has a high residual value. Convert the 80 percent that is of low residual value to refuse-derived fuel (RDF) for industrial application.
Leakage reduction requires a full view of the life cycle for plastics, recognizing its many different types and uses (see sidebar “The plastics paradox”). With that in mind, this study first identified potential solutions with as broad a canvas as possible. Through discussions with experts from nearly every segment of the value chain, as well as insights from both international and local NGOs and government officials, we assembled a comprehensive set of 33 potential levers for reducing plastic-waste leakage.38
The plastics paradox
Over the past several decades, plastic’s unique properties have made it nearly ubiquitous. It has replaced previously used materials and enabled the creation of new products. However, the evolution of waste-management and recycling systems globally has not kept pace with the evolution in materials. The result is that plastic, with its generally low recovery and recycling rates, has in many cases displaced metal, glass, and other materials that are much more likely to be recycled. And herein lies the “plastics paradox”: the inevitable forces of innovation and cost optimization mean that companies that manufacture and use plastic resin are constantly seeking to dematerialize their products. This dematerialization makes plastic an even more compelling material with even more uses. But it also has an unintended consequence: at the end of each product’s current use, there simply is not enough economic value to make collection of the material for conventional recycling financially viable.
Further, many NGOs, regulators, and other stakeholders interested in plastics recycling often look to ma-terial substitution and product redesign as significant parts of the solution to the global waste problem. To understand the potential impact of these levers, we looked at over 1,000 product-redesign efforts that used a design-to-value approach. Design to value is an integrated redesign effort that seeks simultaneously to optimize three lenses: consumer preference, competitor benchmarks, and efficiency of the manufacturing and supply base behind the product—all without compromising the quality of the product. Design-to-value programs that are aimed at weight reduction of packaging material typically yield plastic reductions in the range of 10 to 15 percent.1 Further, product-development experts say that while product-redesign cycles vary in length, an every-five-years rule of thumb is reasonable. Combining these two numbers—a potential 10 to15 percent dematerialization on 20 percent of products per year—a high-level estimate is that the reductive force in play amounts to just 2 to 3 percent.
The catch is twofold. First, in many high-leakage markets, growth in the plastics market far exceeds the impact of reducing plastic through product redesign (annual growth in the plastics industry across ASEAN countries ranges from 4 to 10 percent, according to the ICIS Supply and Demand database). Second, as just described, these redesign efforts actually decrease the weight-to-value ratio of the waste stream, exacerbating the overall challenge of collecting waste in an economically viable way. Thus, while redesign initiatives are likely to create a slight reduction in plastic’s growth trajectory, the impact will not be anywhere near the scale necessary for meaningfully contributing to an overall solution for plastic-waste leakage.1 Our research indicates 10 to 15 percent of packaging reduction is typically achievable; some of this will
be nonplastic material.
24
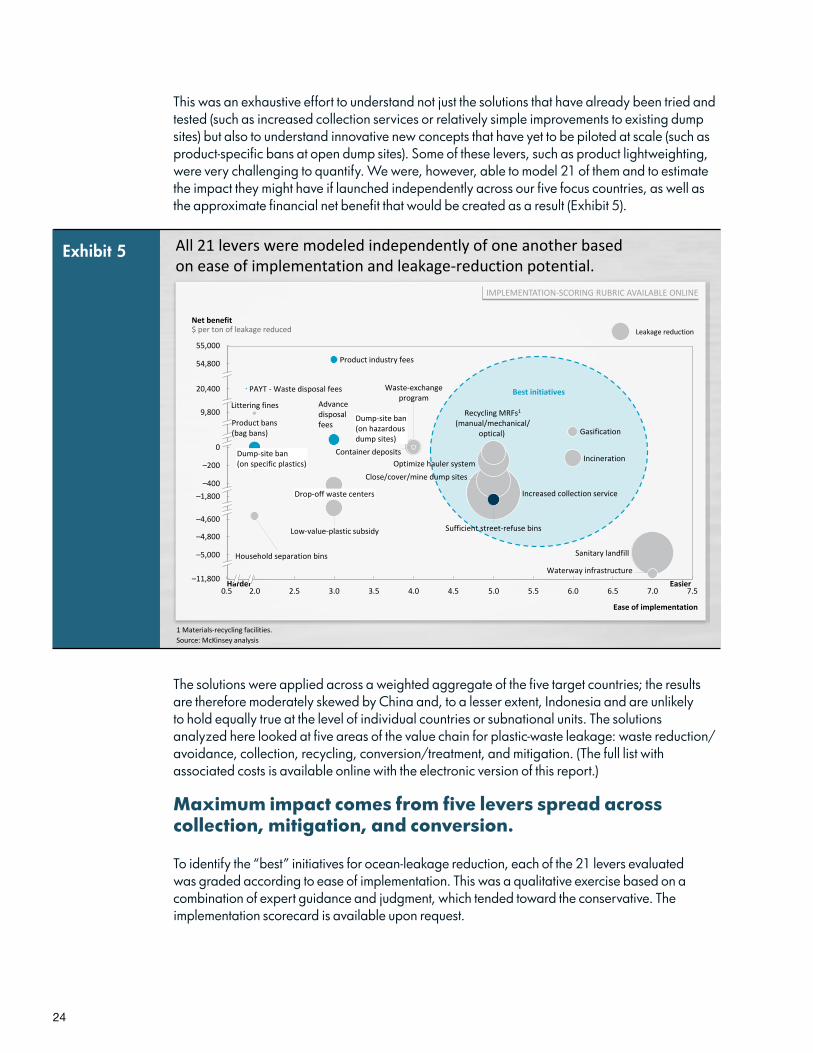
This was an exhaustive effort to understand not just the solutions that have already been tried and tested (such as increased collection services or relatively simple improvements to existing dump sites) but also to understand innovative new concepts that have yet to be piloted at scale (such as product-specific bans at open dump sites). Some of these levers, such as product lightweighting, were very challenging to quantify. We were, however, able to model 21 of them and to estimate the impact they might have if launched independently across our five focus countries, as well as the approximate financial net benefit that would be created as a result (Exhibit 5).
The solutions were applied across a weighted aggregate of the five target countries; the results are therefore moderately skewed by China and, to a lesser extent, Indonesia and are unlikely to hold equally true at the level of individual countries or subnational units. The solutions analyzed here looked at five areas of the value chain for plastic-waste leakage: waste reduction/avoidance, collection, recycling, conversion/treatment, and mitigation. (The full list with associated costs is available online with the electronic version of this report.)
Maximum impact comes from five levers spread across collection, mitigation, and conversion.
To identify the “best” initiatives for ocean-leakage reduction, each of the 21 levers evaluated was graded according to ease of implementation. This was a qualitative exercise based on a combination of expert guidance and judgment, which tended toward the conservative. The implementation scorecard is available upon request.
All 21 levers were modeled independently of one another based on ease of implementation and leakage-reduction potential.
Source: McKinsey analysis
Leakage reduction
Harder Easier
IMPLEMENTATION-SCORING RUBRIC AVAILABLE ONLINE
Best initiatives
7.04.5–11,800
54,800
20,400
55,000
6.5 7.50.5 6.05.55.04.03.53.02.52.0
9,800
0
–200
–400–1,800
–4,600
–5,000
–4,800
Littering fines
Net benefit$ per ton of leakage reduced
Waste-exchangeprogram
Container deposits
Household separation bins
Advance disposalfees
Waterway infrastructure
Close/cover/mine dump sitesOptimize hauler system
Dump-site ban(on hazardousdump sites)
Dump-site ban(on specific plastics)
Recycling MRFs1
(manual/mechanical/optical) Gasification
Incineration
Ease of implementation
Sanitary landfill
Low-value-plastic subsidy
Drop-off waste centers
Sufficient street-refuse bins
Product bans(bag bans)
Product industry fees
PAYT - Waste disposal fees
Increased collection service
1 Materials-recycling facilities.
Exhibit 5
25
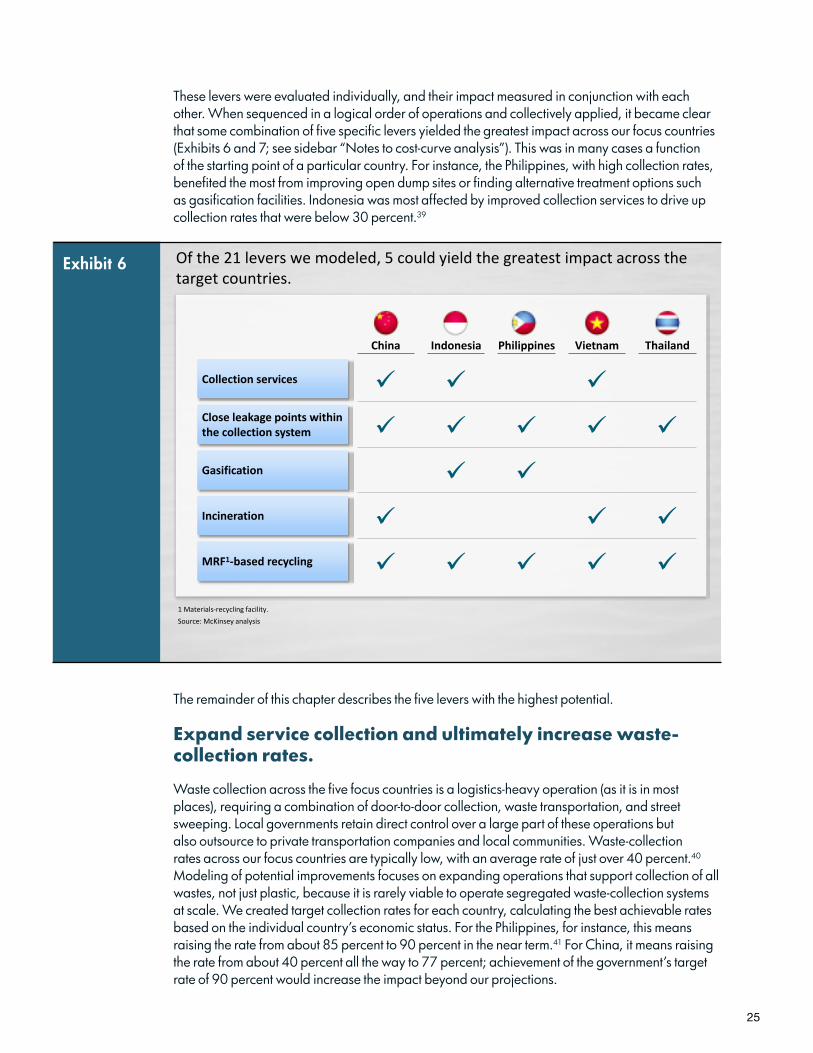
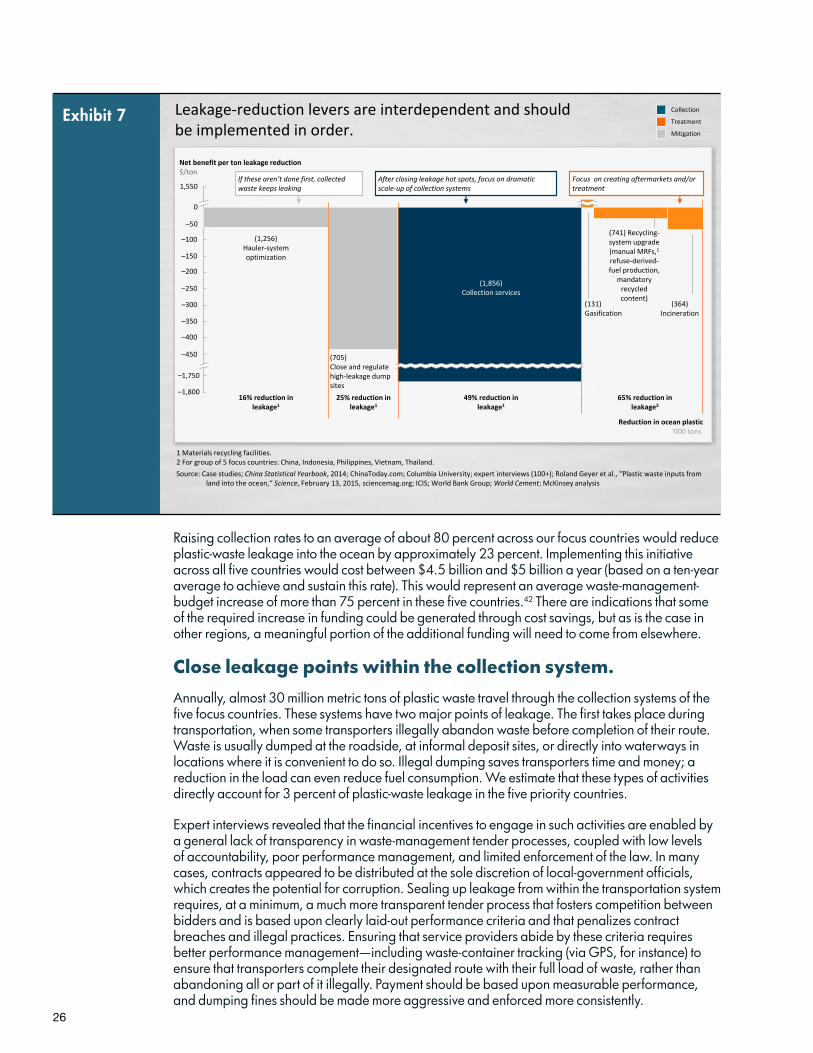
These levers were evaluated individually, and their impact measured in conjunction with each other. When sequenced in a logical order of operations and collectively applied, it became clear that some combination of five specific levers yielded the greatest impact across our focus countries (Exhibits 6 and 7; see sidebar “Notes to cost-curve analysis”). This was in many cases a function of the starting point of a particular country. For instance, the Philippines, with high collection rates, benefited the most from improving open dump sites or finding alternative treatment options such as gasification facilities. Indonesia was most affected by improved collection services to drive up collection rates that were below 30 percent.39
The remainder of this chapter describes the five levers with the highest potential.
Expand service collection and ultimately increase waste-collection rates.
Waste collection across the five focus countries is a logistics-heavy operation (as it is in most places), requiring a combination of door-to-door collection, waste transportation, and street sweeping. Local governments retain direct control over a large part of these operations but also outsource to private transportation companies and local communities. Waste-collection rates across our focus countries are typically low, with an average rate of just over 40 percent.40 Modeling of potential improvements focuses on expanding operations that support collection of all wastes, not just plastic, because it is rarely viable to operate segregated waste-collection systems at scale. We created target collection rates for each country, calculating the best achievable rates based on the individual country’s economic status. For the Philippines, for instance, this means raising the rate from about 85 percent to 90 percent in the near term.41 For China, it means raising the rate from about 40 percent all the way to 77 percent; achievement of the government’s target rate of 90 percent would increase the impact beyond our projections.
Of the 21 levers we modeled, 5 could yield the greatest impact across the target countries.
Source: McKinsey analysis
Gasification
Collection services
Close leakage points within the collection system
Incineration
MRF1-based recycling
China Indonesia Philippines Vietnam Thailand
1 Materials-recycling facility.
Exhibit 6
26
Raising collection rates to an average of about 80 percent across our focus countries would reduce plastic-waste leakage into the ocean by approximately 23 percent. Implementing this initiative across all five countries would cost between $4.5 billion and $5 billion a year (based on a ten-year average to achieve and sustain this rate). This would represent an average waste-management-budget increase of more than 75 percent in these five countries.42 There are indications that some of the required increase in funding could be generated through cost savings, but as is the case in other regions, a meaningful portion of the additional funding will need to come from elsewhere.
Close leakage points within the collection system.
Annually, almost 30 million metric tons of plastic waste travel through the collection systems of the five focus countries. These systems have two major points of leakage. The first takes place during transportation, when some transporters illegally abandon waste before completion of their route. Waste is usually dumped at the roadside, at informal deposit sites, or directly into waterways in locations where it is convenient to do so. Illegal dumping saves transporters time and money; a reduction in the load can even reduce fuel consumption. We estimate that these types of activities directly account for 3 percent of plastic-waste leakage in the five priority countries.
Expert interviews revealed that the financial incentives to engage in such activities are enabled by a general lack of transparency in waste-management tender processes, coupled with low levels of accountability, poor performance management, and limited enforcement of the law. In many cases, contracts appeared to be distributed at the sole discretion of local-government officials, which creates the potential for corruption. Sealing up leakage from within the transportation system requires, at a minimum, a much more transparent tender process that fosters competition between bidders and is based upon clearly laid-out performance criteria and that penalizes contract breaches and illegal practices. Ensuring that service providers abide by these criteria requires better performance management—including waste-container tracking (via GPS, for instance) to ensure that transporters complete their designated route with their full load of waste, rather than abandoning all or part of it illegally. Payment should be based upon measurable performance, and dumping fines should be made more aggressive and enforced more consistently.
1 Materials recycling facilities.2 For group of 5 focus countries: China, Indonesia, Philippines, Vietnam, Thailand.
Leakage-reduction levers are interdependent and should be implemented in order.
1,550
0
Net benefit per ton leakage reduction$/ton
Reduction in ocean plastic‘000 tons
(1,256)Hauler-system optimization
(705)Close and regulate high-leakage dump sites
(1,856)Collection services
(131)Gasification
(364)Incineration
16% reduction in leakage1
25% reduction in leakage1
49% reduction in leakage1
65% reduction in leakage2
(741) Recycling-system upgrade (manual MRFs,1
refuse-derived-fuel production,
mandatory recycled content)
If these aren’t done first, collected waste keeps leaking
After closing leakage hot spots, focus on dramatic scale-up of collection systems
Focus on creating aftermarkets and/or treatment
Collection
Mitigation
Treatment
Source: Case studies; China Statistical Yearbook, 2014; ChinaToday.com; Columbia University; expert interviews (100+); Roland Geyer et al., "Plastic waste inputs from land into the ocean,“ Science, February 13, 2015, sciencemag.org; ICIS; World Bank Group; World Cement; McKinsey analysis
–200
–150
–100
–50
–250
–300
–350
–400
–450
–1,750
–1,800
Exhibit 7
27
The second leakage point is open dump sites. Annually, over 15 million metric tons of plastic waste (roughly half of all plastic waste collected) reaches these sites, which are an integral part of end-waste disposal in many waste-management systems. But open dump sites have long been considered an environmental and health hazard, as they contribute toxic leachate to the soil and groundwater, are a constant source of greenhouse-gas emissions, and are responsible for hundreds of deaths among the waste pickers who depend upon them as a source of livelihood. Frequently, open dump sites are located near waterways; the dump site at Dagupan in the Philippines is situated directly on the coast. Across our priority countries, locating a dump site near a waterway often has a financial rationale. Land adjacent to rivers tends to be cheaper than in other parts of the country, and waste will intermittently be carried away by heavy rains or currents, refreshing the capacity of the dump site to receive more waste. As the largest waste-aggregation points, these sites attract waste pickers (many of whom live close by), who strip incoming waste of any materials that have sufficient value, leaving low-value plastic waste to either wash into the waterway or compact under the weight of ever more waste. Almost 4 percent of all plastic waste collected (net of any losses in the transportation system) is leaked to the ocean, primarily from these dump sites.
Legislative measures to ban dump sites have been largely unsuccessful at solving the problem entirely. However, there are relatively simple, fast, and inexpensive measures that have been shown to decrease leakage from dump sites substantially.43 For instance, creating a perimeter around the dump and its access road (often using old tires, concrete rubble, or even discarded appliances) can help define the size of the dump. This makes it possible to designate an area for waste picking, put in place rules and penalties for the setting of fires (a technique that helps waste pickers uncover new layers of trash), and perform basic shaping and compacting of the waste and periodic covering of the waste layers with soil. The landfill in Gyor, Hungary, is an example of implementing these practices well.44
Notes to cost-curve analysis
Impact measurement. The challenge in this analysis was to find a metric by which to compare both the cost and the potential to reduce plastic waste for the 33 different potential solutions. This analysis uses “metric tons of plastic-waste leakage reduced,” as it was measu-rable across all the solutions tested. The net financial benefit (often negative) of individual solutions was then combined with the amount of plastic-waste leakage reduced to arrive at the economic implications (in linear terms) of each initiative. The average expected cost of the five levers selected was $550 per ton of leakage prevented. Four of these measures had a net cost, and one (gasification) had a net benefit.Some of our findings were surprising. The net cost of consumer-recycling campaigns, for instance, was calculated at $190,000 per metric ton of plastic-waste leakage reduced and would reduce leakage by only 2,000 metric tons across a plastic-waste pool of 60 million metric tons.1 There are two primary reasons for the modest impact of this type of initiative. First, examination of prior consumer-recycling acceleration efforts in our focus countries clearly showed that without a full optimization of the waste-management system (separation bins as well as adjustments at the transport level), almost no impact was achieved. Second, much of the consumer-education effort is spread over a wide pool of consumers, many of whom will be in areas of very low waste density, further diluting the impact and reducing return on investment.Treatment of subsidies. Our treatment options account for several built-in subsidies, most notably assuming that none of the upstream costs of providing waste material for treatment would be passed on to the treatment facility. Where we found commercially viable treatment options being managed or developed, this was considered the norm.Sequential application. We have assumed that the five levers will need to follow a parti-cular sequence, with gaps in the collection system fixed before investment is made to expand collection capacity. Likewise, for treatment options to be commercially viable, collection levels need to be high enough to guarantee a consistent supply of sufficient raw material (i.e., waste) to meet throughput requirements.1 Analysis based on data from the World Bank, National Solid Waste Commission of the Philippines,
China Environmental Statistics Yearbook, and expert input.
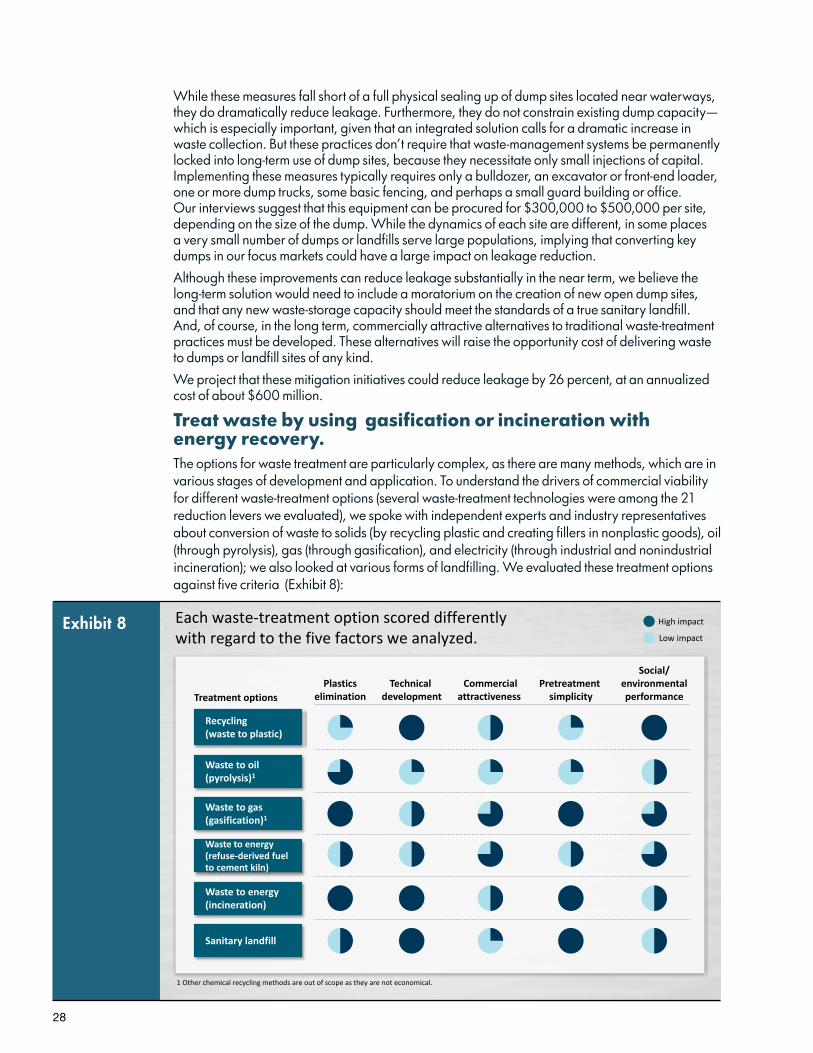
28
While these measures fall short of a full physical sealing up of dump sites located near waterways, they do dramatically reduce leakage. Furthermore, they do not constrain existing dump capacity—which is especially important, given that an integrated solution calls for a dramatic increase in waste collection. But these practices don’t require that waste-management systems be permanently locked into long-term use of dump sites, because they necessitate only small injections of capital. Implementing these measures typically requires only a bulldozer, an excavator or front-end loader, one or more dump trucks, some basic fencing, and perhaps a small guard building or office. Our interviews suggest that this equipment can be procured for $300,000 to $500,000 per site, depending on the size of the dump. While the dynamics of each site are different, in some places a very small number of dumps or landfills serve large populations, implying that converting key dumps in our focus markets could have a large impact on leakage reduction.
Although these improvements can reduce leakage substantially in the near term, we believe the long-term solution would need to include a moratorium on the creation of new open dump sites, and that any new waste-storage capacity should meet the standards of a true sanitary landfill. And, of course, in the long term, commercially attractive alternatives to traditional waste-treatment practices must be developed. These alternatives will raise the opportunity cost of delivering waste to dumps or landfill sites of any kind.
We project that these mitigation initiatives could reduce leakage by 26 percent, at an annualized cost of about $600 million.
Treat waste by using gasification or incineration with energy recovery.The options for waste treatment are particularly complex, as there are many methods, which are in various stages of development and application. To understand the drivers of commercial viability for different waste-treatment options (several waste-treatment technologies were among the 21 reduction levers we evaluated), we spoke with independent experts and industry representatives about conversion of waste to solids (by recycling plastic and creating fillers in nonplastic goods), oil (through pyrolysis), gas (through gasification), and electricity (through industrial and nonindustrial incineration); we also looked at various forms of landfilling. We evaluated these treatment options against five criteria (Exhibit 8):
Each waste-treatment option scored differently with regard to the five factors we analyzed. Low impact
High impact
1 Other chemical recycling methods are out of scope as they are not economical.
Treatment options
Recycling (waste to plastic)
Waste to oil (pyrolysis)1
Waste to energy (incineration)
Waste to gas (gasification)1
Waste to energy (refuse-derived fuel to cement kiln)
Sanitary landfill
Technical development
Plasticselimination
Commercialattractiveness
Pretreatment simplicity
Social/environmental performance
Exhibit 8
29
1. Capacity for eliminating plastic-waste leakage from dump sites. All technologies were evaluated in terms of cost per metric ton of leakage avoided.
2. Level of development of the technology. This measure helped identify the risks associated with each option and the time frame in which its cost structure might become viable. We found that pyrolysis, the least developed of the technologies we looked at, would require an additional three to four years for its cost structure to drop by the 25 to 35 percent necessary for it to be viable in the context of the focus countries.
3. Commercial attractiveness in terms of the overall capital cost. For instance, we found that technologies such as gasification and incineration with energy recovery have capital costs of $50 million or higher and throughput needs of 70,000 to 300,000 metric tons of mixed waste, and must be located in high-waste-density areas to achieve maximum utilization. We also studied commercial attractiveness in terms of the technology’s ability to be viable without extensive subsidies.
4. Simplicity of pretreatment required to make the waste into suitable feedstock. RDF, for instance, requires preextraction of polyvinyl chloride (PVC) and other chlorine-containing materials. Therefore, this treatment is viable only at a manual recovery facility, where individual components of the plastic-waste stream can be sorted, or at a very large facility where automated sorting to remove PVC would be viable.
5. Social and environmental consequences of new treatment options. Pyrolysis, for instance, is capable of producing a low-grade, unrefined diesel, but the environmental consequences of this treatment method, such as through combustion of the unrefined diesel output, limit the viability of this treatment option in many locations at this time. However, if agreements with local oil refineries can be made, this could become a high-value feedstock that can be fully refined into acceptable fuels.
For the purposes of creating a cost curve, recycling and waste to energy (RDF) were combined, as this can be an effective way to extract the maximum value from both high-residual-value products (such as PET bottles, which would be recycled) and low-residual-value products (such as LDPE bags, which would be converted to RDF). Our analysis demonstrated that the most proven treatment option across all five metrics is incineration with energy recovery, followed by gasification.
Gasification is the partial oxidation of plastic waste to produce syngas (synthesis gas), which can potentially be used for electricity generation and the production of chemical fuels. In the Philippines, gasification can generate roughly $50 of operating profit per metric ton of treated mixed waste; in Indonesia, that number is closer to $40. Making gasification profitable requires high local-market prices for electricity, government-set feed-in tariffs for electricity, or high tipping fees for traditional waste disposal—conditions that are sometimes but certainly not always present (Exhibit 9). But gasification can process very large quantities of mixed waste with relatively little pretreatment or sorting, so it has potential to be utilized at scale.
As with gasification, we found that incineration with energy recovery could be economically attractive for a subset of our focus countries (China, Thailand, and Vietnam). This is based on local electricity prices or feed-in tariffs, and incineration’s ability to consume large quantities of mixed waste even at low specifications. While incineration with energy recovery has received some favorable momentum in terms of government policies in many countries, it was one of the most controversial treatment options considered in this study. Modern incinerators that have the right controls on combustion conditions are capable of meeting very stringent emissions standards. However, in places where older technology that lacks appropriate controls is deployed, there are significant problems with combustion efficiency and emissions including dioxin, heavy metals, and other contaminants. As a result, in many places, there is strong public opposition to incineration. Recognizing that the overall acceptability of incineration depends very much on
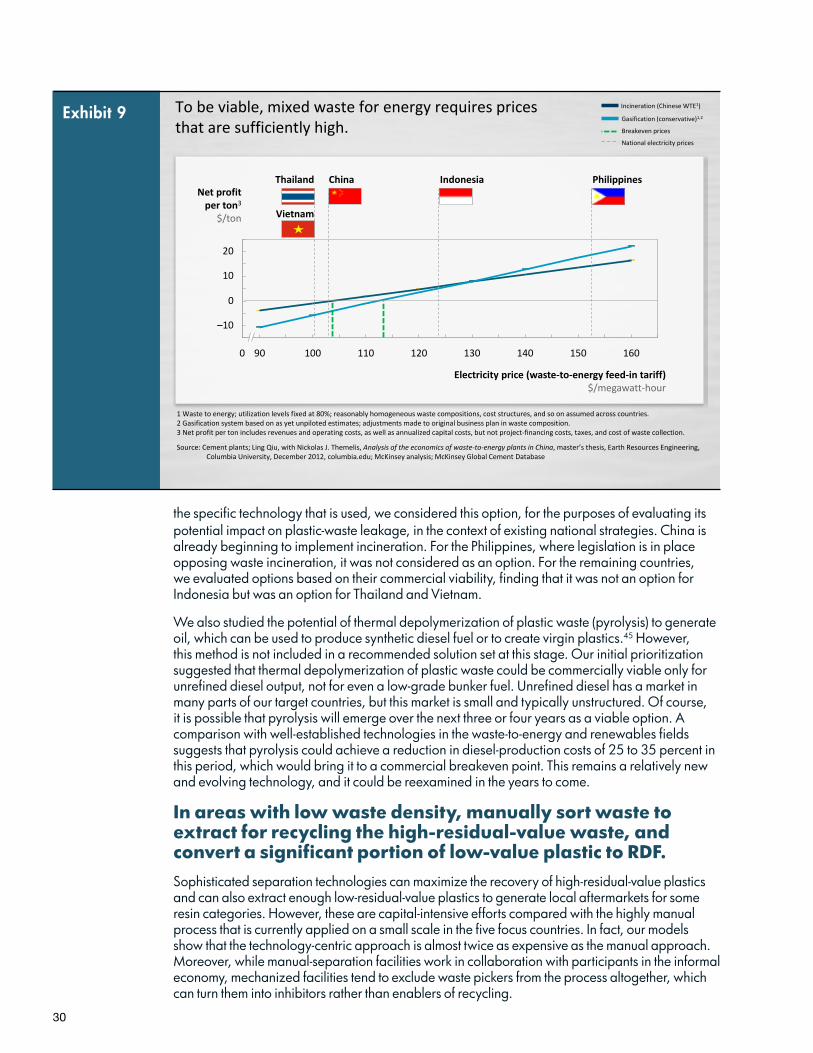
30
the specific technology that is used, we considered this option, for the purposes of evaluating its potential impact on plastic-waste leakage, in the context of existing national strategies. China is already beginning to implement incineration. For the Philippines, where legislation is in place opposing waste incineration, it was not considered as an option. For the remaining countries, we evaluated options based on their commercial viability, finding that it was not an option for Indonesia but was an option for Thailand and Vietnam.
We also studied the potential of thermal depolymerization of plastic waste (pyrolysis) to generate oil, which can be used to produce synthetic diesel fuel or to create virgin plastics.45 However, this method is not included in a recommended solution set at this stage. Our initial prioritization suggested that thermal depolymerization of plastic waste could be commercially viable only for unrefined diesel output, not for even a low-grade bunker fuel. Unrefined diesel has a market in many parts of our target countries, but this market is small and typically unstructured. Of course, it is possible that pyrolysis will emerge over the next three or four years as a viable option. A comparison with well-established technologies in the waste-to-energy and renewables fields suggests that pyrolysis could achieve a reduction in diesel-production costs of 25 to 35 percent in this period, which would bring it to a commercial breakeven point. This remains a relatively new and evolving technology, and it could be reexamined in the years to come.
In areas with low waste density, manually sort waste to extract for recycling the high-residual-value waste, and convert a significant portion of low-value plastic to RDF.Sophisticated separation technologies can maximize the recovery of high-residual-value plastics and can also extract enough low-residual-value plastics to generate local aftermarkets for some resin categories. However, these are capital-intensive efforts compared with the highly manual process that is currently applied on a small scale in the five focus countries. In fact, our models show that the technology-centric approach is almost twice as expensive as the manual approach. Moreover, while manual-separation facilities work in collaboration with participants in the informal economy, mechanized facilities tend to exclude waste pickers from the process altogether, which can turn them into inhibitors rather than enablers of recycling.
To be viable, mixed waste for energy requires prices that are sufficiently high.
Source: Cement plants; Ling Qiu, with Nickolas J. Themelis, Analysis of the economics of waste-to-energy plants in China, master’s thesis, Earth Resources Engineering, Columbia University, December 2012, columbia.edu; McKinsey analysis; McKinsey Global Cement Database
1 Waste to energy; utilization levels fixed at 80%; reasonably homogeneous waste compositions, cost structures, and so on assumed across countries. 2 Gasification system based on as yet unpiloted estimates; adjustments made to original business plan in waste composition. 3 Net profit per ton includes revenues and operating costs, as well as annualized capital costs, but not project-financing costs, taxes, and cost of waste collection.
Incineration (Chinese WTE1)
Gasification (conservative)1,2
National electricity prices
Breakeven prices
110100900
0
20
10
–10
150140130 160120
Electricity price (waste-to-energy feed-in tariff)$/megawatt-hour
Net profitper ton3
$/ton Vietnam
Thailand China Indonesia Philippines
Exhibit 9
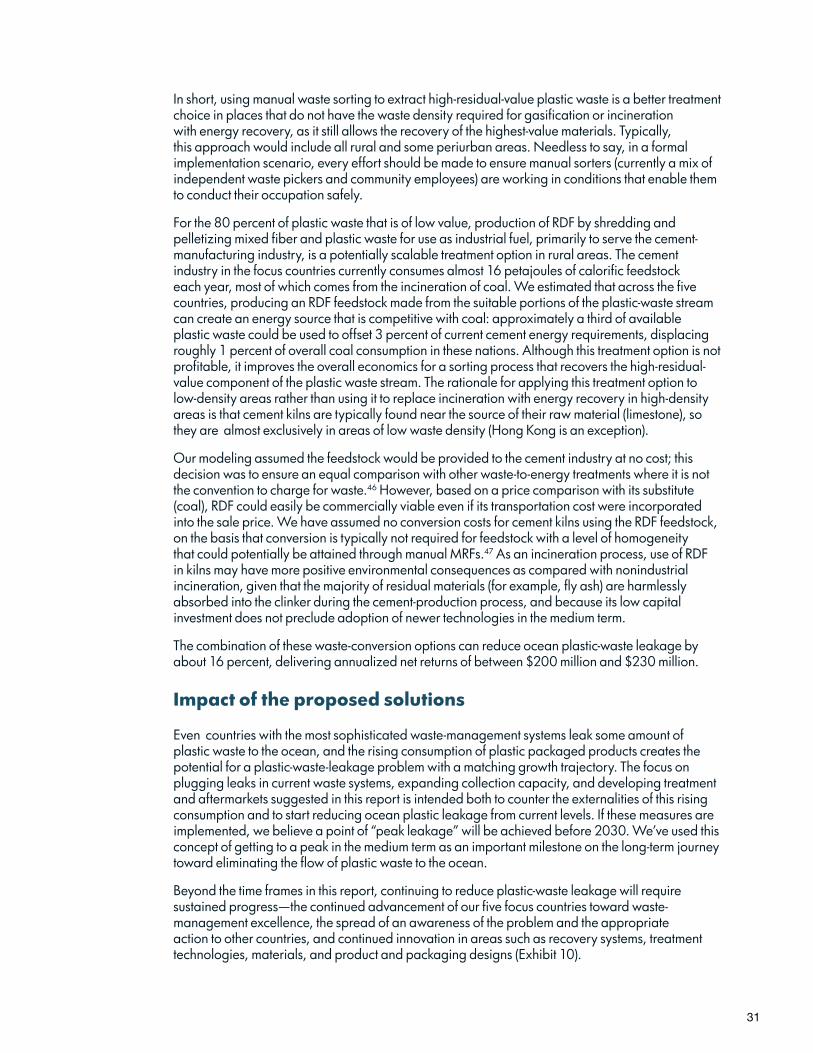
31
In short, using manual waste sorting to extract high-residual-value plastic waste is a better treatment choice in places that do not have the waste density required for gasification or incineration with energy recovery, as it still allows the recovery of the highest-value materials. Typically, this approach would include all rural and some periurban areas. Needless to say, in a formal implementation scenario, every effort should be made to ensure manual sorters (currently a mix of independent waste pickers and community employees) are working in conditions that enable them to conduct their occupation safely.
For the 80 percent of plastic waste that is of low value, production of RDF by shredding and pelletizing mixed fiber and plastic waste for use as industrial fuel, primarily to serve the cement-manufacturing industry, is a potentially scalable treatment option in rural areas. The cement industry in the focus countries currently consumes almost 16 petajoules of calorific feedstock each year, most of which comes from the incineration of coal. We estimated that across the five countries, producing an RDF feedstock made from the suitable portions of the plastic-waste stream can create an energy source that is competitive with coal: approximately a third of available plastic waste could be used to offset 3 percent of current cement energy requirements, displacing roughly 1 percent of overall coal consumption in these nations. Although this treatment option is not profitable, it improves the overall economics for a sorting process that recovers the high-residual-value component of the plastic waste stream. The rationale for applying this treatment option to low-density areas rather than using it to replace incineration with energy recovery in high-density areas is that cement kilns are typically found near the source of their raw material (limestone), so they are almost exclusively in areas of low waste density (Hong Kong is an exception).
Our modeling assumed the feedstock would be provided to the cement industry at no cost; this decision was to ensure an equal comparison with other waste-to-energy treatments where it is not the convention to charge for waste.46 However, based on a price comparison with its substitute (coal), RDF could easily be commercially viable even if its transportation cost were incorporated into the sale price. We have assumed no conversion costs for cement kilns using the RDF feedstock, on the basis that conversion is typically not required for feedstock with a level of homogeneity that could potentially be attained through manual MRFs.47 As an incineration process, use of RDF in kilns may have more positive environmental consequences as compared with nonindustrial incineration, given that the majority of residual materials (for example, fly ash) are harmlessly absorbed into the clinker during the cement-production process, and because its low capital investment does not preclude adoption of newer technologies in the medium term.
The combination of these waste-conversion options can reduce ocean plastic-waste leakage by about 16 percent, delivering annualized net returns of between $200 million and $230 million.
Impact of the proposed solutions
Even countries with the most sophisticated waste-management systems leak some amount of plastic waste to the ocean, and the rising consumption of plastic packaged products creates the potential for a plastic-waste-leakage problem with a matching growth trajectory. The focus on plugging leaks in current waste systems, expanding collection capacity, and developing treatment and aftermarkets suggested in this report is intended both to counter the externalities of this rising consumption and to start reducing ocean plastic leakage from current levels. If these measures are implemented, we believe a point of “peak leakage” will be achieved before 2030. We’ve used this concept of getting to a peak in the medium term as an important milestone on the long-term journey toward eliminating the flow of plastic waste to the ocean.
Beyond the time frames in this report, continuing to reduce plastic-waste leakage will require sustained progress—the continued advancement of our five focus countries toward waste-management excellence, the spread of an awareness of the problem and the appropriate action to other countries, and continued innovation in areas such as recovery systems, treatment technologies, materials, and product and packaging designs (Exhibit 10).
32
Assuming that local waste-management systems can sustain this reduction and continue to increase collection (at levels in line with their individual economic growth), plastic-waste leakage will continue to decline over the subsequent years. These gains are the result of a positive impact on collection and treatment that more than offsets the growth in plastic consumption. However, even a 98 percent collection rate and sophisticated waste disposal are not sufficient to reduce plastic-waste leakage to zero or to prevent its growth (as demonstrated by the example of the United States). This is primarily because the overall quantity of plastic—and therefore also the 2 percent that is uncollected—will continue to rise in line with growth in consumption. Actually reducing plastic-waste leakage to zero, or even achieving a lasting reduction, requires that the decline achieved by the measures evaluated in this report be accompanied by innovation in the material design and usage of plastic or in the treatment technologies that valorize its post-consumer form.
Exhibit 10 If interventions are not sustained, plastic-waste leakage levels will rise again starting in 2025.
Source: McKinsey analysis
Sustained intervention
Business as usualUnsustained intervention
2015 2020 2025 2030 2035
30
25
20
15
10
5
0
Annual plastic leakageMillion tons per year
33
4. What can trigger the implementation of leakage-reduction measures in the short, medium, and long term? Chapter summary: A business-as-usual scenario would result in an estimated 300 million tons of plastic leakage from the five priority countries over the next 20 years—an unthinkable outcome in the light of the damage plastic causes to marine ecosystems. We offer the following recommendations: Improve the current waste-management system to increase collection and plug postcollection leakage, which together can reduce leakage by nearly 50 percent. Develop commercially viable waste treatment to reduce leakage by an additional 16 percent. Implement these measures aimed at creating a point of peak leakage by 2030 and sustaining the improvement trajectory in the future through continued innovation to move toward an almost complete solution to the problem.
If we do nothing, over the next 20 years the five countries will likely leak 300 million metric tons of plastic into our ocean. This figure is based on projected growth in plastic consumption.48 There are several engines of consumption growth, including the following:
• Rapid urbanization, which will increase per capita waste generation and levels of plastic within the waste stream. Across the five-country group, urban waste-generation rates are roughly 40 percent higher than in rural areas.49 Similarly, the level of plastic in the waste stream tends to be about 15 percent higher for urban populations than their rural counterparts. With urban populations in the five focus countries still below 50 percent, according to World Bank, sizable growth in both their waste generation and the share of plastic in their waste stream can be expected as a result of rural-to-urban migration alone.
• Trends in the consumer-packaged-goods industry. Specifically, plastic packaging is increasingly used to promote food safety and preserve freshness and quality as products move over greater distances and have longer shelf-life requirements. Also, in an effort to cater to lower-income consumers, companies are shrinking product-distribution sizes, creating more units of packaging per gram of product.
• Lightweighting of packaging, as consumer-packaged-goods companies routinely attempt to optimize the amount of plastic per unit of packaging. This can be environmentally beneficial in terms of resource efficiency and reduction in transportation emissions. However, it also makes the packaging less valuable to recycling systems—particularly the informal, market-driven systems that operate in countries similar to the five-country focus group in this study.
• Ongoing differentiation of packaging materials and formats to better reflect messaging and product requirements.
Given the realities of this projected growth in plastic consumption and, therefore, plastic waste, an aggressive time line for action will be needed to reduce the leakage of plastic waste into the ocean in absolute terms. This study outlines a set of short-, medium-, and long-term priorities to peak plastic leakage to the ocean by 2025 and then continue the effort to reduce leakage to essentially zero by 2035 and beyond. This 20-year time frame is used in part to better quantify costs and to determine appropriate phasing but also to reflect a sense of urgency that is appropriate, given the cumulative nature of plastics in the ocean (plastic isn’t absorbed by the ocean, it simply accumulates), the many co-benefits of better waste management (e.g., lower sanitation-related healthcare costs, improved water quality, and higher land values), and the need to motivate bold action amidst many competing policy agendas.
34
We have aligned each of our recommendations to one of three different time frames, to create a sequenced series of potential actions over the coming decades that prioritizes simpler, less capital-intense, or less technologically challenging actions in the near term while simultaneously painting the picture of what must happen in the longer term to ensure that growth in the use of plastic does not erode the early gains this plan would achieve.
In the short term (by 2020), improving collection infrastructure and plugging postcollection gaps reduce annual leakage by nearly 50 percent.
Achieving increased collection rates requires expanding collection services and infrastructure, particularly in rural areas that cover vast swaths of territory where institutional waste management has never been a strong presence. There are many reasons why governments are acting to expand their waste-collection capacity. At least 20 epidemical diseases have been linked to waste, and poor waste practices result in more than four million deaths a year. Exposure to waste also reduces life expectancies of the six million to eight million waste pickers who operate across the focus countries. For countries that value their fisheries economy, there are other payoffs: higher quality and productivity of the catch, as well as reduced maintenance cost of fishing equipment. Moreover, effective waste management does not only have to be seen in terms of the negatives it overcomes. It is also a potential engine of job growth and could result in the creation of hundreds of thousands of jobs across our priority countries while creating secondary industries for waste treatment and playing a role in the development of a robust renewable-energy sector.
Despite these incentives, improved waste management tends to be low on the priority list of most countries, even though a significant share of public spending at a municipal level goes toward this service.50 As illustrated in this report, the current rate of reform does not address the rapid growth of waste levels. But the magnitude of the ocean-plastic problem provides an incentive for rapid acceleration of the pace of infrastructure improvement so as to bring collection rates up to nearly 80 percent by 2020. In addition, to achieve maximum leakage reduction, administrations should make their waste-management systems “ocean smart” by improving or closing dump sites located near waterways and establishing performance-monitoring mechanisms across the system to ensure that waste does not leak from the collection system.
These changes would require an accelerated development of local-government capabilities. Together, according to World Bank data, the focus countries now spend roughly $6 billion on waste management per year. Meeting the 80 percent collection goal requires that number to increase substantially, to approximately $11 billion annually. Some of this additional $5 billion could come from cost savings; experience shows that optimization can reduce spending by 10 to 20 percent, through increased transparency in the tender process or performance-based payments for transporters, for instance.
The remainder of the budget increase would need to come from financing mechanisms. In the developing world, waste-management financing typically involves a combination of private, public, and multilateral funding. We estimate that multilateral lenders and major donors currently fund up to $2 billion annually in sanitation and water-related projects in our five priority countries, and that some of this funding could be put toward increased and improved waste collection. Private investment capital is typically available once solid project-finance structure and risk-management mechanisms are in place. This includes strong public-financing structures and policies such as long-term supply and offtake agreements and properly structured bond financing.
In many cases, mechanisms that further reduce capital costs and investment risk will be necessary. This is where international corporations may play a helpful role. There are many well-tested “derisking” project-finance mechanisms, such as first-loss insurance pools, equity partnerships with multilateral lenders and equity providers, and market-entry supports for US and European waste-technology providers. Existing industry-led initiatives such as the Closed Loop Fund and the
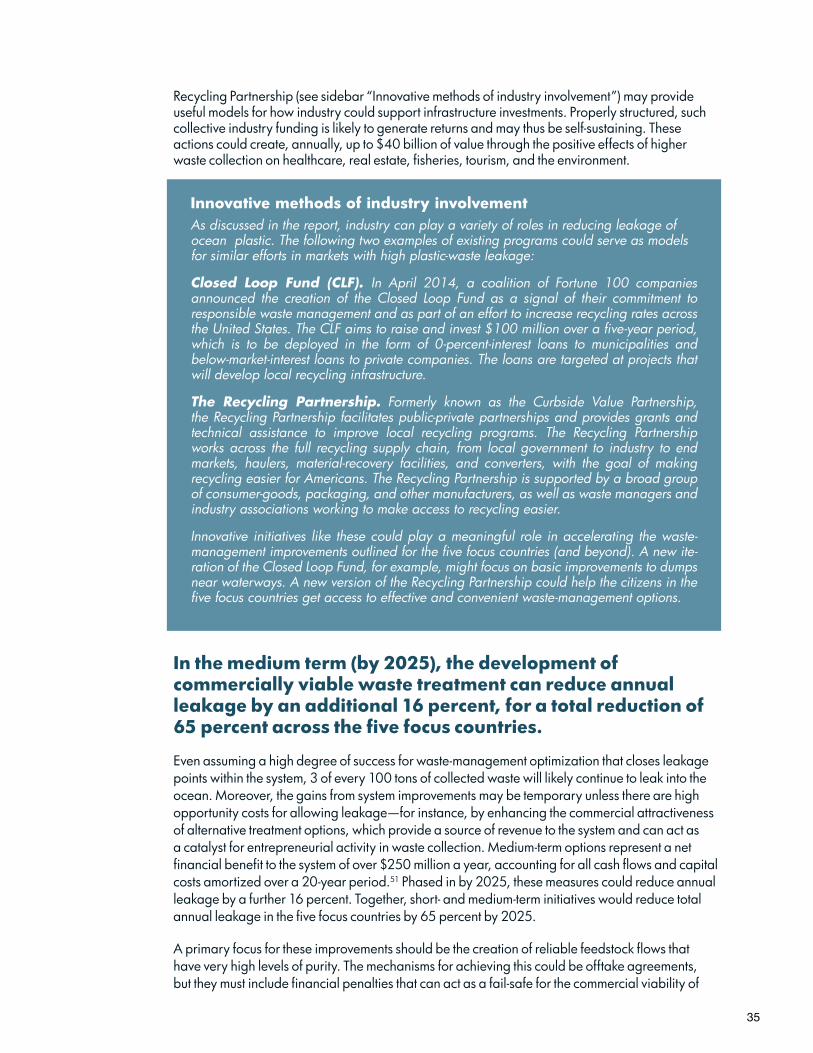
35
Recycling Partnership (see sidebar “Innovative methods of industry involvement”) may provide useful models for how industry could support infrastructure investments. Properly structured, such collective industry funding is likely to generate returns and may thus be self-sustaining. These actions could create, annually, up to $40 billion of value through the positive effects of higher waste collection on healthcare, real estate, fisheries, tourism, and the environment.
In the medium term (by 2025), the development of commercially viable waste treatment can reduce annual leakage by an additional 16 percent, for a total reduction of 65 percent across the five focus countries.
Even assuming a high degree of success for waste-management optimization that closes leakage points within the system, 3 of every 100 tons of collected waste will likely continue to leak into the ocean. Moreover, the gains from system improvements may be temporary unless there are high opportunity costs for allowing leakage—for instance, by enhancing the commercial attractiveness of alternative treatment options, which provide a source of revenue to the system and can act as a catalyst for entrepreneurial activity in waste collection. Medium-term options represent a net financial benefit to the system of over $250 million a year, accounting for all cash flows and capital costs amortized over a 20-year period.51 Phased in by 2025, these measures could reduce annual leakage by a further 16 percent. Together, short- and medium-term initiatives would reduce total annual leakage in the five focus countries by 65 percent by 2025.
A primary focus for these improvements should be the creation of reliable feedstock flows that have very high levels of purity. The mechanisms for achieving this could be offtake agreements, but they must include financial penalties that can act as a fail-safe for the commercial viability of
Innovative methods of industry involvementAs discussed in the report, industry can play a variety of roles in reducing leakage of ocean plastic. The following two examples of existing programs could serve as models for similar efforts in markets with high plastic-waste leakage:
Closed Loop Fund (CLF). In April 2014, a coalition of Fortune 100 companies announced the creation of the Closed Loop Fund as a signal of their commitment to responsible waste management and as part of an effort to increase recycling rates across the United States. The CLF aims to raise and invest $100 million over a five-year period, which is to be deployed in the form of 0-percent-interest loans to municipalities and below-market-interest loans to private companies. The loans are targeted at projects that will develop local recycling infrastructure.
The Recycling Partnership. Formerly known as the Curbside Value Partnership, the Recycling Partnership facilitates public-private partnerships and provides grants and technical assistance to improve local recycling programs. The Recycling Partnership works across the full recycling supply chain, from local government to industry to end markets, haulers, material-recovery facilities, and converters, with the goal of making recycling easier for Americans. The Recycling Partnership is supported by a broad group of consumer-goods, packaging, and other manufacturers, as well as waste managers and industry associations working to make access to recycling easier.
Innovative initiatives like these could play a meaningful role in accelerating the waste-management improvements outlined for the five focus countries (and beyond). A new ite-ration of the Closed Loop Fund, for example, might focus on basic improvements to dumps near waterways. A new version of the Recycling Partnership could help the citizens in the five focus countries get access to effective and convenient waste-management options.
36
the treatment option. This is an unusual structure for a public-private partnership and is a reminder of the high level of ownership and initiative that governments will need to undertake if they are to succeed. The good news is that these treatment options can be profitable, particularly when considered in light of opportunity cost (for instance, tipping fees charged by sanitary landfills). Furthermore, they can help meet the growing energy needs across the focus countries. In China, for instance, the planned capacity increase of incinerators (from approximately 140 to around 350) could generate over 25 terawatt-hours of electricity, while conversion of waste to RDF along the lines suggested in this report would replace 15 million tons of (potentially imported) coal with 22 million tons of locally produced RDF.
In the long term (by 2035), additional measures ensure that total leakage is not rebounding on the basis of higher base volumes.
Versus a business-as-usual scenario, the short- and medium-term actions discussed in this chapter can reduce leakage across the five focus countries by 65 percent by the year 2025. Innovations in recovery and treatment technology, new materials, designs that facilitate reuse or recycling, and in alternative food- and beverage-dispensing concepts as well as the adoption of the broader principles of circularity can help ensure that plastic-waste leakage actually declines by optimizing the underlying volumes of plastics used in the global economy and improving end-of-use management.
The time lines given in this report are indicative of what it would take to resolve this issue as swiftly as possible. Applied not only to our focus countries but also to an ever-widening pool of adopters, the measures suggested would create a point of peak plastic-waste leakage, after which plastic leakage begins to decline to a level that is eventually negligible. When exactly this peak point will occur depends on the rate at which action is taken by a global society that is committed to start shrinking the size of this problem.
37
5. What are the cornerstones of a concerted program for global action to address this issue? Chapter summary: Achieving the impact goals laid out in the previous chapter will require a six-point plan: (1) commitment by government at all levels to set and achieve ambitious waste-management targets; (2) on-the-ground wins that provide proofs of concept for integrated waste-management approaches in “beta” cities; (3) expansion of proofs of concept to a critical mass of cities/regions through a best-practice-transfer mechanism; (4) establishment of the necessary project-investment conditions to pave the way for private, public, and multilateral funding; (5) facilitation of technology implementation; and (6) prioritization of the ocean-plastic challenge as part of the global policy agenda on the ocean.
The issue of ocean plastic represents a classic case for collective action. There is a ten-year path toward meaningful change, and we found clear indications of what is required in the longer term for a complete solution. In addition to the social and environmental returns mentioned in the preceding chapters, industry also stands to benefit. Specifically, industry would gain increased resilience from price fluctuations in virgin materials. And reducing leakage serves to mitigate some of the long-term liability for environmental damage from plastic and plastic packaging. There are also important returns in the form of reduction in the consumption of virgin material (whether for plastic or energy), the protection of marine flora and fauna, lower rates of landfill methane, improved quality of groundwater, and reduced exposure to materials that can be hazardous to people or livestock.
We recognize that these solutions are far from implementation and that movement forward requires leadership and support from national and especially local governments in the countries where the impact is sought. We also recognize that further analysis is needed on the institutional and financial structures that would support an effective, multiyear campaign on this issue.
We believe action requires a holistic set of activities, many of which should run in parallel:
1. Leadership and commitment by government at all levels. Real and meaningful commitments are needed from national government, local authorities, governors, and mayors to set ambitious waste-management targets and to accelerate the installation of effective waste-management systems. In practice this is a three-step process. The first step required is facilitation (at the level of global/regional forums, such as the United Nations, Group of Seven, Group of Twenty, Association of Southeast Asian Nations [ASEAN], and Asia-Pacific Economic Cooperation [APEC]) of a common recognition of the scale of the marine-plastic problem, its economic consequences, and the ways in which existing agendas can be leveraged to design a solution that involves comparatively little additional financing while yielding short-, medium-, and long-term benefits that can be measured in both “hard” (transaction) and “soft” (social) terms. The second step is winning support from local officials, mayors, and governors of key cities and regions in the five focus countries for the launch of integrated waste-management proof-of-concept programs. Third is rollout of broader initiatives across the priority countries, while preparing a blueprint for similar action in a wider set of countries —for instance, the rest of the top 20 countries from the Science article, which together are responsible for more than 25 percent of annual global plastic-waste leakage.
38
2. Provide local proof of concept for integrated waste-management approaches in carefully selected beta cities. Develop pragmatic, on-the-ground approaches to integrated waste management in carefully selected beta cities or regions, chosen based on the joint economics of good waste management and local co-benefits. This will require focusing global expertise and resources on the specific local context in these cities and regions. It will also require an innovative approach capable of significantly accelerating the pace of on-the-ground program design and implementation. This approach would require providing global and local expertise in engineering, project finance, and project delivery to governments in a highly focused fashion. Combined with a strong mandate and cross-agency cooperation, this allows development of a detailed, fully supported and aligned action plan, with targeted assignments cascaded down to the front lines. This is critical to ensure that implementation is as smooth as possible in a field that straddles multiple sectors.
3. Expand to a critical mass of cities/regions. With lessons learned in beta communities, stakeholders must build a best-practice mechanism that can accelerate the transfer of global expertise to a growing list of high-priority cities and regions in Asia. For example, one model for which there is considerable precedent is that of a best-practice network. Institutions like Embarq and ITDP (urban transportation), CGIAR (agricultural reform), GGGI (green growth), RAP (utility reform), and many others are focusing global expertise and best practice on locations that have expressed strong interest in reform. Typically funded by philanthropic foundations or bilateral aid organizations and governed in part by strong representation from recipient countries, these institutions concentrate on pragmatic, technical, and project-specific advice and can greatly accelerate the pace of reform.
4. Pave the way for funding. The initiative must promote favorable project-finance investment conditions for the private, public, and multilateral sectors. Private investment capital is essential and requires public operating guarantees that address price, supply, and offtake; provide sound public financing such as revenue bonds; and include generous leverage from multilateral development banks. Collective action on the part of industry and other private-sector actors could help promote investment by strategically reducing capital costs and investment risk. Existing models may provide useful examples for how industry might support infrastructure investments (see sidebar “Innovative methods of industry involvement”). A classic suite of risk-management mechanisms also can be considered, including first-loss provisions, shared equity pools with (multilateral) lenders, and insurance pools, among others. Creating these conditions will require ensuring that the ocean-plastic and waste-management agendas are carefully prioritized across multilateral institutions and regional bodies (e.g., ASEAN, APEC, UN), aid organizations and development banks (ADB, World Bank, GEF ), national and city governments, convening institutions, and of course, major corporate players in the chemicals, plastics, and consumer-goods industries.
5. Facilitate technology implementation. Over the next five years, new technologies for valorizing low-value plastic, such as pyrolysis, must become commercially viable, which means high-leakage countries should provide the conditions that enable it. Therefore, change initiatives must promote market access for and the ability to deploy state-of-the-art waste-management technology providers. Most importantly, this will require providing companies with secure feedstock, defined by waste composition and mass, and creating clear investment parameters in areas such as energy prices and feed-in tariffs, offtake agreements, and local public-finance options. Thus, expanding technology markets will also help bring down treatment costs. For example, based on the experience of the ethanol fuel sector, we found that investing in the expansion of pyrolysis capacity could reduce its annualized costs by 25 to 35 percent, making it commercially viable in a broad range of countries (including those studied for this report).
6. Prioritize the ocean-plastic challenge as part of the global policy agenda on the ocean. A 2014 United Nations Environment Programme report identified the need for “global action” against plastic debris in the marine environment.52 Waste management—today often not a high-priority policy issue—must be recognized as an international obligation.
39
Often when waste management is prioritized, tremendous results can be achieved; in South Korea, waste disposal dropped by 40 percent (through waste reduction at source), and recycling rates increased by 60 percent over the 1990s, and in Taiwan, recycling rates increased from 2 percent to 52 percent over the early 2000s. Focusing global attention on the marine-plastics issue could yield similar waste-management improvements in other focus countries. This will include more systematic inclusion of marine plastics in global forums such as the UN’s Sustainable Development Goals, Convention and Conference of the Parties on Biological Diversity, and recently announced efforts to develop a binding treaty on high-seas biodiversity, among others.
Such a diverse and ambitious agenda will be achieved neither by aggregating local initiatives nor as the result of impending changes in the global plastic supply chain. Rather, success requires central measurement and coordination, along with lateral learning and reinforcement. Over the next year, a global coalition of relevant stakeholders must emerge; this coalition must create maximum alignment and generate support from all the actors who own the solution to the pressing issue.
There are many additional components of the agenda that can still be shaped to maximize the social and economic value it creates. And there are clear health concerns that waste-management solutions can address, employment opportunities it can generate, and social equity it can create. Moreover, effective waste management is only a small step from new sources of renewable energy and reusable materials—both of which move the system toward harnessing the waste’s economic value.
Plastic-waste leakage is an enormous (and unintended) consequence of our attempt to provide a better material existence to millions of people through a constant series of innovations. But no one feels untouched by the sight of ocean litter, strangled sea animals, or starved albatrosses, and no one can escape the facts that emerging research has brought to light.
This study suggests a way forward that can generate significant benefits to communities, preserve the bioproductivity of the ocean, and derisk industry. It suggests that concerted action and a focus on the most effective levers would entail an increase of $5 billion in waste-management spending. This seed investment could create a vibrant secondary resource market, trigger investment in packaging and recovery systems, and let the ocean thrive.
40
Glossary of acronyms, words, and phrases used
Advance disposal fee – A fee or tax levied on specific plastic products (e.g., plastic bags) to cover all or a portion of the cost of their extraction from the waste stream for treatment
Aftermarket – Market for the purchase, sale or reuse of waste after it has completed a usage cycle
Anaerobic digestion – Process of converting organic waste to biogas in the absence of oxygen
Biodegradable – Capable of breaking down into its chemical constituents in the natural environment
Capex – Capital expenditure
Circularity – The principle wherein all biological materials used reenter the biosphere without causing damage, and technical materials circulate continuously in production processes
Close or cover or mine dump sites – Infrastructure used either to seal open dump sites or to extract material value from them
Co-benefit – Benefit that occurs as the result of improvements in managing waste and accrues to one or more sectors outside of the waste-management sector.
Composite – Having a mix of different plastics (and potentially other materials) in the design of a product
Container deposit – Charge for packaging material that is levied at purchase and then returned upon receipt of the material from the original consumer
Drop-off waste center – Center where waste can be delivered in exchange for payment to the deliverer
Dump or dump site – Open waste pile, which may be a formal or informal end repository of waste
Dump-site ban – Legislative action to close open dump sites, in particular those located near waterways, with supporting implementation to curtail their ongoing use
Dump-site ban (on specific plastics) – Legislative action with supporting implementation to prevent specific items of waste (e.g., recognizable categories of low-value plastic) from entering dump sites located on or adjacent to waterways
Gasification – Waste-treatment technology used to convert municipal waste with high calorific content (e.g., plastics) to synthetic gas
Hauler or hauler truck or hauler system – Waste transporter operating truck(s) that haul waste from point of collection to MRF, from MRF to dump site, or both. Services are typically contracted by local governments but often managed directly by public authorities
Hauler dumping – Waste-dumping practices (typically informal and sometimes illegal) taking place as part of the transportation of waste by hauler systems
Hazardous dump or hazardous dump site – Dump site or unsanitary landfill located on or adjacent to a waterway
HDPE – High-density polyethylene, a type of plastic
41
Household separation bin – Bin used to separate different waste elements at the household level, before they enter the formal waste stream (which will also necessitate corresponding alterations in the waste-transportation and -treatment systems)
Incineration – Waste-treatment technology used to burn mixed municipal waste and generate electricity
Increased-collection service – Higher collection service, utilizing additional waste-aggregation and transportation systems
Inert – Nonreactive
Landfilling – Disposal of waste in a waste pile that is usually underground and may be sanitary (i.e., measures taken to prevent leachate) or unsanitary (no prevention measures taken)
LDPE – Low-density polyethylene, a type of plastic
Littering fine – A fine levied for disposing of waste outside formal waste-management channels
LLDPE – Linear low-density polyethylene, a type of plastic
Low-value-plastic subsidy – A subsidy for the extraction of low-value plastic materials from the waste stream (typically performed by the informal economy, e.g., waste pickers)
Mandatory recycled content – Minimum requirement for use of recycled content in products
Marine leakage – Movement of plastic from land-based sources into the ocean
Material design specification – Redesign of products to meet specifications intended to make the products either more attractive for material- or energy-extraction markets or less likely to leak into the ocean
Mixed waste – Unseparated or unsorted waste
MRF – Material-recovery facility, used for separating different materials from the waste stream
MSW – Municipal solid waste (usually includes streams of commercial and industrial waste)
NGO – Nongovernmental organization
Ocean plastic-waste leakage – Movement of plastic from land-based sources into the ocean
Optimize hauler system – Improve a waste-transportation system, through a combination of transparent tendering, GPS monitoring, and performance-based payments, in order to reduce waste-dumping practices
PAYT – Pay as you throw. Describes a program that involves charging a fee per trash bag used as an incentive to reduce overall waste
Periurban – Type of municipality or part of a municipality that is in the process of developing from a small-scale town to a large-scale urban center
PET – Polyethylene terephthalate, a type of plastic
Plastic-waste leakage – Movement of plastic from land-based sources into the ocean
Polymer – Chemical combination of smaller particles, typically plastics
PP – Polypropylene, a type of plastic
Presorting – Separation of different components of waste at the household level
Pretreatment – Preparation of waste streams for material- or energy-output treatment technologies
42
Product ban – Legislative action with supporting implementation to forbid the use of certain types of products (e.g., plastic bags)
Product-industry fee – A government-imposed charge on plastic products , using a system similar to a value-added tax (VAT)
PS – Polystyrene, a type of plastic
PVC – Polyvinyl chloride, a type of plastic
Pyrolysis – Waste-treatment technology used to convert plastic into diesel
RDF – Refuse-derived fuel, as shredded or pelletized waste that is primarily plastics or paper or cardboard, used in industrial ovens or kilns
Recycling MRF – Material-recovery facility that separates different waste components; process may be manual, mechanical, and/or optical
Residual PP – Polypropylene form without a ready recycling market
Sando bag – Plastic bag
Sufficient street refuse bins – Quantity of street refuse bins that is in line with system needs based on waste-generation projections
Thin film – Mixed-plastic film, typically constructed of some variation of polyethylene
Throughput – Feedstock, or material designated for a particular process
TPA – Metric tons per annum
Trash surface boom or interceptor – Floating infrastructure (e.g., netting) used to catch floating articles of waste and prevent them from flowing out to sea
Waste aggregation – Collection of waste, which may occur at multiple points (such as waste trucks, MRFs, or dump sites)
Waste-exchange program – A system set up to allow for the exchange of specific articles of waste with recycling value for monetary equivalents (e.g., food vouchers or supermarket tokens)
Waterway – Large marine body, such as an ocean, river, and tributaries
Waterway infrastructure – Infrastructure such as trash traps or booms used to intercept articles of waste that are already in the waste stream and prevent them from moving farther out to sea
WTE – Waste to energy (e.g., incineration, gasification)
WTE treatment option – Waste-to-energy technology
43
Andreas MerklChief Executive OfficerOcean Conservancy
Martin StuchteyDirector of the McKinsey Center for Business and Environment
Steve RussellVice PresidentPlastics Department American Chemistry Council
April CrowGlobal Sustainability DirectorCoca-Cola
Erin SimonManager, Material Science and PackagingWorld Wildlife Fund
Jeff WoosterGlobal Sustainability LeaderDow Chemical
Hermann ErdmannChief Executive OfficerREDISA
Steering committee
Core team and technical advisers
Working team
Emily Woglom Vice PresidentConservation Policy and ProgramsOcean Conservancy
Steven SwartzExpert Principal McKinsey & Company
Joi Danielson Project ManagerMcKinsey & Company
Nick MallosDirector Trash Free Seas ProgramOcean Conservancy
Jörg Leib Senior AssociateMcKinsey & Company
Adam Al-Said Business AnalystMcKinsey & Company
Saif HameedProject ManagerMcKinsey & Company
Technical advisors
Tony KingsburyPresident and Founder TKingsbury Consulting
Ted SieglerPrincipalDSM Environmental Services
Sally YozellSenior AdvisorUS Department of State
Jill BoughtonPresident and Chief Executive OfficerWaste 2 Worth Innovations
Andrew MorletChief Executive OfficerEllen MacArthur Foundation
The conclusions in this report are strictly those of the authors
44
Notes
1 J. R. Jambeck, R. Geyer, C. Wilcox, T. R. Siegler, M. Perryman, A. Andrady, R. Narayan, and K. L. Law, “Plastic waste inputs from land into the ocean,” Science, 2015, Volume 347, Number 6223.
2 This is largely based on the findings of the article in Science, ibid., with a modification that substitutes Thailand for Sri Lanka, which our methodology suggests contributes a lower quantity of ocean plastic than that originally reported. Further, the methodological adjustments made to Sri Lanka, if applied to India, imply that India would likely rise to be a top-five source for ocean plastic-waste leakage. While we believe India likely is a major source of plastic-waste leakage, we have chosen here to focus on the five Asian countries, for the simple reason of creating more geographic proximity in our initial priority countries.
3 Analysis conducted for this study compared estimates collected by the US Environmental Protection Agency (EPA) on potential revenue loss per vessel due to marine debris and share of fishing vessels experiencing damage linked to marine debris against the global fishing industry, and estimated that annual losses could be in the range of $20 billion.
4 Unless specified, this report uses the term incineration to mean combustion with energy recovery, rather than simple waste burning. The report also uses the term incineration to refer to a modern incineration plant with state-of-the-art emission control and energy recovery (rather than the simple act of burning waste).
5 Jambeck et al., “Plastic waste inputs.”
6 This is largely based on the findings of the article in Science, ibid., with a modification that substitutes Thailand for Sri Lanka, which our methodology suggests contributes a lower quantity of ocean plastic than that originally reported. Further, the methodological adjustments made to Sri Lanka, if applied to India, imply that India would likely rise to be a top-five source for ocean plastic-waste leakage. While we believe India likely is a major source of plastic-waste leakage, we have chosen here to focus on the five Asian countries, for the simple reason of creating more geographic proximity in our initial focus countries.
7 A. A. Koelmans, E. Besseling, and E. M. Foekema, “Leaching of plastic additives to marine organisms,” Environmental Pollution, 2014, Volume 187, pp. 49–54; C. K. Pham, E. Ramirez-Llodra, C. H. S. Alt, T. Amaro, M. Bergmann, M. Canals, J. B. Company, J. Davies, G. Duineveld, F. Galgani, K. L. Howell, V. A. I. Huvenne, E. Isidro, D. O. B. Jones, G. Lastras, T. Morato, J. N. Gomes-Pereira, A. Purser, H. Stewart, I. Tojeira, X. Tubau, D. V. Rooij, and P. A. Tyler, “Marine litter distribution and density in European seas, from the shelves to deep basins,” PLoS ONE, 2014, Volume 9, Number 4; Y. C. Jang, J. Lee, S. Hong, J. Y. Mok, K. S. Kim, Y. J. Lee, H. W. Choi, H. Kang, and S. Lee, “Estimation of the annual flow and stock of marine debris in South Korea for management purposes,” Marine Pollution Bulletin, 2014, Volume 86, Numbers 1–2, pp. 505–11; Trash free seas report: Every piece, every person, every community matters; Results from the 2014 International Coastal Cleanup, Ocean Conservancy, 2015, oceanconservancy.org.
45
8 C. M. Rochman, E. Hoh, T. Kurobe, and S. J. Teh, “Ingested plastic transfers hazardous chemicals to fish and induces hepatic stress,” Scientific Reports, 2013, Volume 3; C. M. Rochman, T. Kurobe, I. Flores, and S. J. Teh, “Early warning signs of endocrine disruption in adult fish from the ingestion of polyethylene with and without sorbed chemical pollutants from the marine environment,” Science of the Total Environment, 2014, Volume 493, pp. 656–61.
9 Rochman et al., “Ingested plastic transfers hazardous chemicals.”
10 A. J. Dyck and U. R. Sumaila, “Economic impact of ocean fish populations in the global fishery,” Journal of Bioeconomics, 2010, Volume 12, Number 3, pp. 227–43; The state of world fisheries and aquaculture, UN Food and Agriculture Organization (FAO), 2008 and 2012, fao.org; The sunken billions: The economic justification for fisheries reform, World Bank, 2009, worldbank.org; Hidden harvests: The global contribution of capture fisheries, World Bank, 2012, worldbank.org.
11 E. Chua, J. Shimeta, D. Nugegoda, P. D. Morrison, and B. O. Clarke, “Assimilation of polybrominated diphenyl ethers from microplastics by the marine amphipod, Allorchestes compressa,” Environmental Science and Technology, 2014, Volume 48, Number 14, pp. 8127–34; M. A. Browne, S. J. Niven, T. S. Galloway, S. J. Rowland, and R. C. Thompson, “Microplastic moves pollutants and additives to worms, reducing functions linked to health and biodiversity,” Current Biology, 2013, Volume 23, pp. 2388–92.
12 Based on estimates from Jambeck et al., “Plastic waste inputs,” assuming a flat 27.5 percent leakage rate across mismanaged plastic for 192 markets.
13 M. Eriksen, L. C. M. Lebreton, H. S. Carson, M. Thiel, C. J. Moore, J. C. Borerro, F. Galgani, P. G. Ryan, and J. Reisser, “Plastic pollution in the world’s oceans: More than 5 trillion pieces weighing over 250,000 tons afloat at sea,” PLoS ONE, 2014, Volume 9, Number 12; annual beach cleanup efforts to yield about 6,000 metric tons further (based on data available from the Ocean Conservancy’s international coastal-cleanup efforts). Cumulatively, these represent approximately 3.0 to 3.5 percent of annual leakage estimates.
14 Jambeck et al.’s Science paper includes Sri Lanka in its estimates of top-five countries (at rank 5); our findings in China and the Philippines suggest that a reevaluation of plastic-waste leakage quantity for Sri Lanka might reveal a lower quantity than originally believed, with Thailand replacing Sri Lanka in the top five countries. Moreover, a reevaluation of further countries (e.g., India) may result in additional shifts within the rankings of the top 20 countries.
15 Conversely, the addition of waste-management systems, such as China’s planned expansion of collection services and build-out of combustion with energy-recovery facilities, may reduce leakage.
16 Microplastics in the ocean: A global assessment, United Nations Joint Group of Experts on the Scientific Aspects of Marine Pollution (GESAMP), Working Group 40, 2015, gesamp.org.
17 Single-serve 0.5 liter PET bottles of current material specifications, weighing approximately 12 grams per bottle.
18 Some characterization attempts have previously been made, but these focus on floating ocean plastic (e.g., in the five gyres), which tends to be only a small portion of overall marine plastic.
19 Based on analysis provided by the National Solid Waste Management Commission of the Philippines.
20 Assuming a collection rate of 42 percent, based on our analysis of overall waste systems across target countries.
46
21 Based on interviews of waste pickers and junk-shop managers, combined with direct estimates of the amount of time taken to extract individual items of waste from a standard waste pool.
22 Based on interviews of experts who have spent extensive time working with waste-picker communities.
23 Low-, medium-, and high-density classifications applied population-density rates relative to national population density for each of the five target countries.
24 Jambeck et al., “Plastic waste inputs.”
25 Not including Hong Kong, Singapore, Taiwan, or South Korea.
26 We were able to study in detail the “Waste to Worth” initiative, which has partnered with Procter & Gamble and the Asian Development Bank to develop five pilot plans for waste treatment in the Philippines.
27 Analysis based on National Solid Waste Commission data, in conjunction with World Bank data. The number for China may appear much larger than waste figures frequently cited, which place overall waste generation at 225 million to 275 million metric tons per year. This number relates to urban waste in China, whereas our total waste figure of 400 million to 450 million metric tons per year includes both urban and rural segments.
28 Analysis based on National Solid Waste Commission data, in conjunction with World Bank data and expert input.
29 Analysis based on World Bank data, in conjunction with the China Environmental Statistics Yearbook and expert input.
30 Analysis based on National Solid Waste Commission data, in conjunction with expert input and waste-characterization studies.
31 This becomes more challenging for waste pickers to do at sanitary landfills, where the presence of infrastructure may act as an inhibiting factor; however, proper operation of the sanitary landfill will itself prevent leakage into the ocean.
32 Analysis based on 2014 estimates using data from the China Environmental Statistics Yearbook; 2012 estimates cited in the global press placed this figure at 60 percent. Our analysis has proceeded on the basis of available data; substantial footage and eyewitness indications attest that while statistically only 20 percent of China’s collected waste may be destined for dump sites, this still represents over 30 million metric tons of collected waste annually, which could be supplemented by uncollected waste deposited by households directly.
33 Analysis based on expert input for urban waste, with variation across urban or rural waste and waste inside or outside the collection system.
34 Expert input; provinces are Zhejiang, Guangdong, Jiangsu, Shandong, Fujian, and Hebei.
35 Refers to policy shifts by the government of China to restrict the import of foreign waste in an effort to limit net waste entering the local waste pool. Based on expert input; year-on-year estimates for recent years were not readily available.
36 Number available in documentation by the National Solid Waste Commission; it may be lower than the true number.
47
37 While we are not aware of the specific technology being employed, our suggested impact is predicated on the use of modern technology with energy reclamation and emission controls; no assumptions made in this report should be taken to propose otherwise.
38 Certain levers (e.g., material redesign, transition to circular resource flows) were not quantified, as they require ongoing innovation with a long-term perspective and cannot be used in a short- to medium-term horizon to stabilize current leakage.
39 Estimates based on United Nations Sanitation Country Profile for Indonesia, which is more conservative than our estimates (assuming 40 percent of urban waste is collected, versus 1.02 percent of rural waste in 2000, as compared with our estimates of 50 percent and 5 percent to allow for moderate system improvements over the past 15 years).
40 Analysis based on China Environmental Statistics Yearbook data, in conjunction with World Bank data; this includes both rural and urban waste.
41 Analysis based on National Solid Waste Commission data, in conjunction with World Bank data.
42 Analysis based on data from World Bank and press sources.
43 Based on interviews with waste-management experts and data from the World Bank, EPA, and United Nations Environment Programme (UNEP).
44 Based on interviews with waste-management experts.
45 Other chemical-recycling methods were considered to be out of scope, as they were not economically viable for our target countries.
46 On the contrary, in developed markets, the convention is for the waste supplier to pay a “tipping fee” for waste disposal.
47 On the basis of a mixed municipal-solid-waste (MSW) feedstock, conversion costs are required, but these are offset by the absence of a refuse-derived fuel (RDF) production stage in the supply of feedstock.
48 This does not account for the potential strain on existing waste-management systems that could result in lower collection rates than currently experienced, with even higher levels of plastic waste entering the ocean, compared with business as usual.
49 Based on World Bank, UN, and country-level sources in conjunction with expert input.
50 This is why countries that choose to prioritize it must do so in the form of national campaigns, e.g., “Clean India.”
51 Output takes the form of electricity, RDF, and plastic waste for other recycling (e.g., remolding). Feedstock is assumed to be free of charge, which is either cost-neutral to the waste-management system (which would otherwise be covering the cost of transportation to disposal sites without any revenue) or potentially beneficial (in the event that existing disposal sites charge a tipping fee).
52 “Plastic debris in the ocean,” Chapter 8 of UNEP Year Book 2014: Emerging issues in our global environment, United Nations Environment Programme, unep.org.

September 2015 Designed by USDC Copyright © McKinsey & Company and Ocean Conservancywww.mckinsey.com www.oceanconservancy.org