Stem cells, radiation response, tissue kinetics and ...
30
Stem cells, radiation response, tissue kinetics and carcinogenesis Ohtsura Niwa, NIRS, Chiba, Japan Ohtsura Niwa, NIRS, Chiba, Japan Current ICRP carcinogenesis model and its limitation Cellular aspect based model combined with epidemiological data Target cells not defined Target cells not defined Need considering tissue aspect of target cells Tissue aspect may improve the model for dose rate independence of the linear term age dependent sensitivity to carcinogenesis age dependent sensitivity to carcinogenesis risk of in utero exposures mechanistic insight of tissue specific sensitivity and more
Transcript of Stem cells, radiation response, tissue kinetics and ...

Stem cells, radiation response, tissue kinetics and carcinogenesisOhtsura Niwa, NIRS, Chiba, JapanOhtsura Niwa, NIRS, Chiba, Japan
Current ICRP carcinogenesis model and its limitationCellular aspect based model combined withepidemiological data
Target cells not definedTarget cells not definedNeed considering tissue aspect of target cells
Tissue aspect may improve the model fordose rate independence of the linear termage dependent sensitivity to carcinogenesisage dependent sensitivity to carcinogenesisrisk of in utero exposures
mechanistic insight of tissue specific sensitivityg p yand more

ICRP Risk model
LNT i t t d f l t l f di ti t tiLNT: an important and useful tool of radiation protectionRisk = dose x risk value x DDREF x WR x WT
dose: measurements + estimationsdose: measurements + estimationsrisk value: cross population risk transferDDREF: varies with biological endpointsg pWR: varies with biological endpointsWT: rounded-up values
Much of the data are from A bomb survivorsThose in blue all have uncertaintyU i i l l l f L d /dUncertainty particularly large for Low dose/dose rate
The model is cellular process basedpThe data comes from human epidemiology on whole body

Limitation of the cellular aspect based modelas shown in the DDREF issue
D βD2
as shown in the DDREF issueer
risk
high dose rate = αD + βD2
DDREF = αD + βD2
αD
= 1 + β/α D
ed c
ance
g dose a e α β 1 β/α D
DDREF equation assumes
tion
rela
te The linear term is dose rate independent. This comes from the
Rad
iat
low dose rate = αD
This comes from the consideration on the cellular repair process
dose

A study of simple chromosome exchanges violate the rule
High dose rate H l i thHigh dose rateα = 0.18 +/- 0.04β = 0.05 +/- 0.02
How can we explain the dose rate sensitive
linear term, even for the cell based effect ?
Low dose rate
cell based effect ?
Whole body can have Low dose rateα = 0.06 +/- 0.01β = 0
more exceptions
Cornforth, DNA Repair, 5,1182. 2006

The target: stem and progenitor cells in a tissue
stem cells apoptosisprogenitor cells
transit amplifying p p
niche
functional cellsterminally differentiated
Blood circulation RepopulationBlood circulation p pWound healing
W h ld k f ll l f llWe should know more of cellular aspect of stem cellsWe should know tissue aspect of stem cells

Major features of tissue stem cells and progenitors
stem cells progenitorsniche required, for stemness Take hold of niche q
and for protection sometimeresidence life-long residence limited residencedivision capacity large limiteddivision status dormant, but not always rapiddivision type asymmetric and
symmetricsymmetric
DNA li i i l d d l l li iDNA replication immortal strand model controversial
regular replication
specific genes variable by tissues and by stagesspecific genes variable by tissues,side population yes, but not always no
and by stages

Hematopoietic stem cell niche
Sinusoidal endothelial cells
Non specialized osteoblastsSpecialized N cadherin+ osteoblasts
Arai and Suda. Ann N Y Acad Sci. 1106, 41-53, 2007
Non specialized osteoblastsSpecialized N-cadherin+ osteoblasts

Niche is required for dormancy and protection
Stem cells< 1%
Divisioncapacity
O2conc. capacity
Differentiatedll
< 1%
Nature 434, 843, 2005
cells
Hierarchical organization of hematopoietic stem cells?

Asymmetric division and asymmetric replication in stem cells- Cairns’ hypothesis (Nature 1975) -stem chromosomeste
transitDNA chromosome
OK
No
No
immortalll
mortalll No random segregationNo SCE allowed
No
cell cell No random segregationNo SCE allowed
No definite proof, disproved for hematopoietic and hair follicle stem cells

Side population phenotype
on/1
06ce
lls
blue
Ho33342
lony
form
atio
Hoc
hest
5 & 10 min
BM & thymus
co
Hochest redDays in culture
FACS analysis 7 day colony formation35 day colony formation
Low Ho33342 cellsw/ high colony formation
Parmar et al. PNAS 104, 5431, 2007
w/ high colony formation

Powerful lineage tagging method for stem cell studyER-Cre knock-in alleleER Cre knock in allele
ER Cre
Cre + T if +Lac tagged cells
Stem specific promoter
Promoter +Cre + Tamoxifen +
Cre to nucleus
loxPselectable gene
stop lacZ geneselectable gene
lacZ gene
LacZ reporter transgene
loxP
general promoter
stop
general promoter
LacZ reporter transgene Use of a cell specific gene promoter to tag the cells
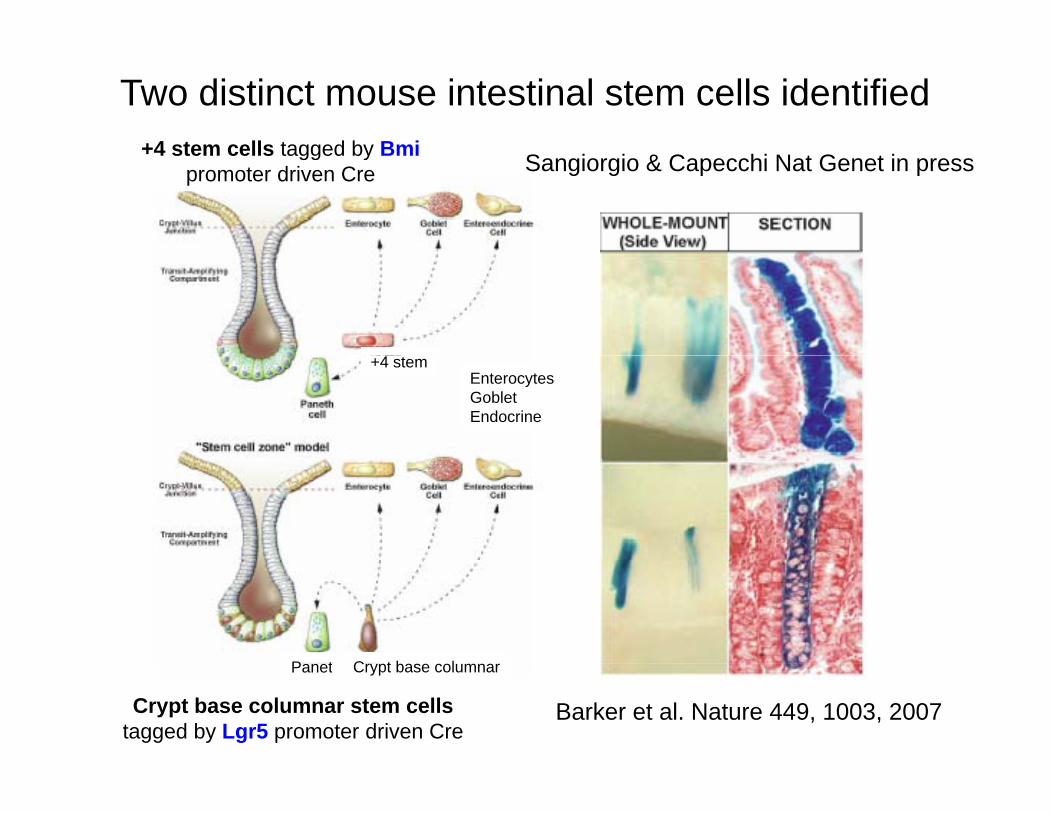
+4 stem cells tagged by Bmi
Two distinct mouse intestinal stem cells identified+4 stem cells tagged by Bmi
promoter driven Cre Sangiorgio & Capecchi Nat Genet in press
EnterocytesGobletEndocrine
+4 stem
P t C t b l
Crypt base columnar stem cellstagged by Lgr5 promoter driven Cre
Barker et al. Nature 449, 1003, 2007
Panet Crypt base columnar

stem cells
Reversibility of progenitors in mouse testiscommitted spermatogoniastem cells
niche
committed spermatogonia
Lineage tagging of mouse testicular spermatogoniag gg g p g
Buslfan treatmentBuslfan treatment
Nakagawa et al. Developmental Cell, 2007

Many cellular aspect to be studied on tissue stem cellsγH2AXPI
3 Gy to 8 hrembryos
H2AX phosphorylation and p21 activation only after 3 day embryosembryos y y
Many weird damage3 Gy to 3 day
embryos
Many weird damage response are wailting to be discovered in tissue t ll
Day 1.5 Day 2.5 Day 3.5
stem cells
p21β-actin

Tissue aspects of stem cells
Potten & Wilson, in “Principles of Tissue Engineering”, 2007
Long lineage tissues: progenitors by themselves are the targetShort lineage tissues: stem and reverted progenitors are the target

Tissue aspect and possible decline of relative riskb ti iby time since exposure
entire lifeTissue specific turnover time
Target of radiation carcinogenesisIn the case of stem cells, dose can accumulate infinitely,In the case of stem cells, dose can accumulate infinitely,
unless stem compartment has a hierarchyIn the case of progenitors, dose can accumulate
only for a limited duration of the turnover timeonly for a limited duration of the turnover time

The rate of relative risk decline
120000 100000
expected from the Armitage Doll model
When radiation
80000
100000
1000
10000
ence
2
Incidence byage related accumulation
When radiation gives one hit
40000
60000
10
100inci
de
11
2of mutation
1 = α (age)52 = (age)4
0
20000
0 2 4 6 8 10 121
10
1 10
2 = α (age)4
number of hit or age
Relative risk = line 2/ line 1Relative risk line 2/ line 1 Relative risk declines at 1/age

Relative risk declines in the LSS population
1.5
40 - 9
k pe
r Sv
ERRD = αD ERRAA = β/(age)1.7
1.0
ativ
e R
isk
2
3
10 - 19s R
elat
ive
Ris
k
0.5
Exce
ss R
ela
1
40+
20 - 39Exce
ss
0.0 0.5 1.0 1.5 2.0 2.5 3.0 3.50.0
Weighted Colon Dose (Sv)
30 40 50 60 70 80 900
40
Age at Diagnosis
Linear increase means 1 hit The real decline rate = 1/(age)2
Pierce & Vaeth, Biostatistics 4, 231, 2003
howeverLinear increase means 1 hitERR should decline by 1/age
The real decline rate 1/(age)loss of initiated cells?

Lung cancer among uranium minors
M3 model fitting to lung cancer SMR of French and Czech minors
0% f
9
8
7ERR decreases 50% for each10-year increase in time since exposure
ER
R
6
5
44
3
2
ERR = (β W + β W ) exp [ (AE 30) + θ(TE 20)]
BEIRVI
Age 30 40 50 60 70 80
1
0
Tomasek et al.R d R 2008ERR = (βMWM + βEWE) exp [α(AE – 30) + θ(TE – 20)]
ERR decreases 50% for Th d li t 1/( )3Rough calculation
Rad Res 2008
ERR decreases 50% for each 10-year increase in time since exposure
The decline rate = 1/(age)3loss of initiated cells?
Rough calculationfor age 40 to 50

Loss of initiated cells? An example of rat mammary cancerAn example of rat mammary cancer
Neutron Tumor per rat Tumor per rat Tumor per ratdose
pNo prolactin
pProlactin immediately
pProlactin 12 mo. later
0 rad 2/24(8 3%)
0/14(0%)
-(8.3%) (0%)
4.1 rad 1/16(6.5%)
6/16(38%)
4/15(27%)
7.3 rad 0/16(0%)
5/15(33%)
3/15(20%)
16 6 0/16 9/17 4/1516.6 rad
0/16(0%)
9/17(53)
4/15(27%)
total 1/48(2%)
20/48(42%)
11/45(24%)(2%) (42%) (24%)
Kamiya et al. Jpn J Cancer Res. 76, 449, 1985

Loss of pre-neoplastic lesions after PhIP treatmentC
olon
Aberrant crypt foci (ACF) induced by PhIP
567
rypt
Foc
i/C
234
Abe
rran
t C
01
0 20 40 60 80
No.
A
R t ( k)
PhIP treatment (3 – 10 weeks)
Rat age (week)
Tsukamoto et al. Jpn J Cancer Res 90, 720, 1999

Tissue aspect and the risk of fetal exposures
13 mothers
Ohtaki et al. Rad. Res. 161, 373, 2004150 in utero survivors
181 survivors

Thirteen pairs of the mother and the child
1st trimester
mothers
2nd trimester
3rd trimester
children
Ohtaki et al. Rad. Res. 161, 373, 2004

Hematopoietic stem cells from fetal to perinatal transition
progenitor cellsstem cells
progenitor cellstransit amplifying
Unstable
functional cells
Unstablestem
terminally differentiated
nicheBlood circulation
Stable stem
Bone marrow niche is established after birthStem cells can be stable only in the niche
Precancerous cells in fetus are rapidly eliminated during postnatal development?

Rapid decline of childhood cancer incidence by year after birth
ALL incidence rate and age in Japan Neuroblastoma in situ in a necropsy case
B k ith & P i 1963
ALL translocation carrier: 1/100 newborn 1/10,000 with ALLSilent neuroblastoma carrier: 1/100 newborn 1/10 000 with NB
Nakamura Rad Res 163, 2005 Beckwith & Perrin, 1963
Silent neuroblastoma carrier: 1/100 newborn 1/10,000 with NB
Elimination by tissue turnover, apoptosis and terminal differentiation

Risk of in utero and childhood exposures
Follow-up of 1958 -1999 on solid tumors2,452 in utero exposed: ERR = 1.0 /Sv 15,388 childhood exposed:ERR = 1.7 /Sv
JNCI 100, 428-436, 2008
OSCC d th t l t diOSCC and other case control studiesleukemia : RR = 1.49/10 mGysolid tumors : RR = 1 45/10 mGysolid tumors : RR 1.45/10 mGyall malignancies : RR = 1.47/10 mGy
ERR of in utero exposure = 50/Gyp y
Brit J Radiol 70, 130-139, 1997

Induction of cancer by fetal and perinatal irradiation in mice
3.8 Gy30) 50 30
ovary
li t l h
liverpituitary20
ncre
ase
(%)
30
40
50
20
30
malignant lymphomabone
myeloid leukemia lung0 10 20 30 40
0
10
Net
in
0 10 20 30 400
10
20
0 10 20 30 400
10
Sasaki J Radiat Res Suppl. 2, 73-85 (1991)17-d fetus
0 10 20 30 40Age at exqposure (days)
0 10 20 30 40Age at exposure (days)
0 10 20 30 40Age at exposure (days)
Not many tissues exhibit high risk by in utero exposureSensitivity related to the establishment of tissue nicheSensitivity related to the establishment of tissue niche

Stem cell kinetics and radiation risk- A case of Min mouse model -A case of Min mouse model
Tumor number
Small intestine Large intestine
Tumor number
200
250 1 Gy2 Gy
16
20 1 Gy2 Gy
Small intestine Large intestine
100
150
8
12
50
100
4
8
02 10 24 42 48
02 10 24 42 48
Age of mice at irradiation
no IR no IR
Age of mice at irradiation
M. Okamoto and H.YonekawaJ Radiat. Res. 46, 83-91 (2005)No induction after certain ages

Radiation sensitive window coinside withstem cells division
S BB B
Ad lt t t t t t f ft bi th
Tsukamoto
Adult type crypts start to form after birthBifurcation of crypts is in its peak on 12 days after birth

Stem cell radiobiology and the future of the radiation carcinogenesis modelthe radiation carcinogenesis model
stem cells apoptosisprogenitor cells
transit amplifying
f ti l ll
niche
functional cellsterminally differentiated
Importance of stem cell researchCellular aspect of stem cellsTissue aspect of stem cells