Stellar Properties of Embedded Protostars
16
Stellar Properties of Embedded Protostars R. J. White University of Alabama in Huntsville T. P. Greene National Aeronautics and Space Administration at Ames Research Center G. W. Doppmann Gemini Observatory K. R. Covey University of Washington L. A. Hillenbrand California Institute of Technology Protostars are precursors to the nearly fully assembled T-Tauri and Herbig Ae/Be type stars undergoing quasi-static contraction towards the zero-age main sequence; they are in the process of acquiring the majority of their stellar mass. Although numerous young stars with spatially extended envelope-like structures appear to fit this description, their high extinction has inhibited observers from directly measuring their stellar and accretion properties and confirming that they are in fact in the main phase of mass accretion (i.e., true protostars). Recently, however, high dispersion spectrographs on large aperture telescopes have allowed observers to begin studying the stellar and accretion properties of a subset of these stars, commonly referred to as Class I stars. In this Chapter, we summarize the newly determined properties of Class I stars and compare them with observations of Class II stars, which are the more optically revealed T Tauri stars, to better understand the relative evolutionary state of the two classes. Class I stars have distributions of spectral types and stellar luminosities that are similar to those of Class II stars, suggesting similar masses and ages. The stellar luminosity and resulting age estimates, however, are especially uncertain given the difficulty in accounting for the large extinctions, scattered light emission and continuum excesses typical of Class I stars. Several candidate Class I brown dwarfs are identified. Class I stars appear to rotate somewhat more rapidly than T Tauri stars, by roughly a factor of 2 in the mean. Likewise, the disk accretion rates inferred from optical excesses and Brγ luminosities are similar to, but larger in the mean by a factor of a few than, the disk accretion rates of T Tauri stars. There is some evidence that the disk accretion rates of Class I stars are more distinct from T Tauri stars within the ρ Ophiuchi star forming region than in others (e.g., Taurus-Auriga), suggesting a possible environmental influence. The determined disk accretion rates are nevertheless 1-2 orders of magnitude less than the mass infall rates predicted by envelope models. In at least a few cases the discrepancy appears to be caused by T Tauri stars being misclassified as Class I stars because of their edge-on disk orientation. In cases where the envelope density and infall velocity have been determined directly and unambiguously, the discrepancy suggests that the stellar mass is not acquired in a steady-state fashion, but instead through brief outbursts of enhanced accretion. If the ages of some Class I stars are in fact as old as T Tauri stars, replenishment may be necessary to sustain the long-lived envelopes, possibly via continued dynamical interactions with cloud material. 1. THE DISCOVERY AND CLASSIFICATION OF PROTOSTARS The early phases of star and planet formation are difficult to observe because this process occurs while the protostar is buried within its natal molecular cloud material. Nev- ertheless, infrared and submillimeter observations, which are able to penetrate this high extinction material, have re- vealed much about the bolometric luminosities, spectral en- ergy distributions (SEDs), and circumstellar material of em- bedded young stars (e.g., Lada and Wilking, 1984; Myers et al., 1987; Wilking et al., 1989; Kenyon et al., 1990; Andr´ e and Montmerle, 1994; Motte and Andr´ e, 2001; Onishi et al., 2002; Andrews and Williams, 2005). The earliest of these observations spurred development of the theory of isolated 1
Transcript of Stellar Properties of Embedded Protostars

Stellar Properties of Embedded Protostars
R. J. WhiteUniversity of Alabama in Huntsville
T. P. GreeneNational Aeronautics and Space Administration at Ames Research Center
G. W. DoppmannGemini Observatory
K. R. CoveyUniversity of Washington
L. A. HillenbrandCalifornia Institute of Technology
Protostars are precursors to the nearly fully assembled T-Tauri and Herbig Ae/Be typestars undergoing quasi-static contraction towards the zero-age main sequence; they are in theprocess of acquiring the majority of their stellar mass. Although numerous young stars withspatially extended envelope-like structures appear to fit this description, their high extinction hasinhibited observers from directly measuring their stellarand accretion properties and confirmingthat they are in fact in the main phase of mass accretion (i.e., true protostars). Recently, however,high dispersion spectrographs on large aperture telescopes have allowed observers to beginstudying the stellar and accretion properties of a subset ofthese stars, commonly referred to asClass I stars. In this Chapter, we summarize the newly determined properties of Class I starsand compare them with observations of Class II stars, which are the more optically revealed TTauri stars, to better understand the relative evolutionary state of the two classes. Class I starshave distributions of spectral types and stellar luminosities that are similar to those of Class IIstars, suggesting similar masses and ages. The stellar luminosity and resulting age estimates,however, are especially uncertain given the difficulty in accounting for the large extinctions,scattered light emission and continuum excesses typical ofClass I stars. Several candidateClass I brown dwarfs are identified. Class I stars appear to rotate somewhat more rapidly thanT Tauri stars, by roughly a factor of 2 in the mean. Likewise, the disk accretion rates inferredfrom optical excesses and Brγ luminosities are similar to, but larger in the mean by a factor of afew than, the disk accretion rates of T Tauri stars. There is some evidence that the disk accretionrates of Class I stars are more distinct from T Tauri stars within theρ Ophiuchi star formingregion than in others (e.g., Taurus-Auriga), suggesting a possible environmental influence. Thedetermined disk accretion rates are nevertheless 1-2 orders of magnitude less than the massinfall rates predicted by envelope models. In at least a few cases the discrepancy appears tobe caused by T Tauri stars being misclassified as Class I starsbecause of their edge-on diskorientation. In cases where the envelope density and infallvelocity have been determineddirectly and unambiguously, the discrepancy suggests thatthe stellar mass is not acquired in asteady-state fashion, but instead through brief outburstsof enhanced accretion. If the ages ofsome Class I stars are in fact as old as T Tauri stars, replenishment may be necessary to sustainthe long-lived envelopes, possibly via continued dynamical interactions with cloud material.
1. THE DISCOVERY AND CLASSIFICATION OFPROTOSTARS
The early phases of star and planet formation are difficultto observe because this process occurs while the protostaris buried within its natal molecular cloud material. Nev-ertheless, infrared and submillimeter observations, whichare able to penetrate this high extinction material, have re-
vealed much about the bolometric luminosities, spectral en-ergy distributions (SEDs), and circumstellar material of em-bedded young stars (e.g.,Lada and Wilking, 1984;Myers etal., 1987;Wilking et al., 1989;Kenyon et al., 1990;Andreand Montmerle, 1994;Motte and Andre, 2001;Onishi et al.,2002;Andrews and Williams, 2005). The earliest of theseobservations spurred development of the theory of isolated
1

low mass star formation, advancing initial considerationsof the collapse of a singular isothermal sphere (e.g.,Shu,1977) to include circumstellar disks and envelopes (Cassenand Moosman, 1981; Terebey et al., 1984; Adams et al.,1987).
An easy marriage of observation and theory was foundby equating different stages of this theoretical evolutionaryprocess with observed differences in the spectral energy dis-tributions of very young stars. Four classes have been pro-posed (Class 0, I, II, and III), and are now commonly used toclassify young stars. In this proposed scheme, Class 0 starsare cloud cores that are just beginning their protostellar col-lapse, Class I stars are embedded within an “envelope” ofcircumstellar material, which is infalling, accumulatingina disk, and being channeled onto the star, Class II stars arenearly fully assembled stars undergoing pure disk accretionwith perhaps some evidence for tenuous amounts of enve-lope material and, finally, Class III stars are post-accretionbut still pre-main sequence stars. The Class II and ClassIII stars are also known as classical T Tauri stars and weak-lined T Tauri stars, respectively. It is believed that the ma-jority of the stellar mass is acquired prior to the Class IIphase; these younger stars are thus considered to be the true“protostars.”
Despite the discretization of the Class classificationscheme, there is a continuum of circumstellar evolution-ary states and thus a continuum of observational propertiesexhibited by young stars. Fig. 1 illustrates two popularcriteria used to segregate the Classes, bolometric tempera-ture (Tbol, defined as the temperature of a blackbody withthe same mean frequency as the observed SED;Myers andLadd, 1993) and infrared spectral slope (α = dlog[λFλ] /[dlogλ], typically determined over the wavelength interval2 to 25µm; Lada and Wilking, 1984;Lada, 1987), plottedagainst one another. Class I stars are distinguished fromClass II stars as havingα > 0.0 or Tbol < 650 K; theirSEDs rise into the infrared. A subsample of “flat spectrum”or “transitional Class I/II” stars are often distinguishedasthose with−0.3 < α < 0.3 or 650 < Tbol < 1000 K.However, since these criteria are based on observationswhich typically do not spatially resolve the circumstellarstructures, it is not clear that the observed SED differencestruly correspond to distinct evolutionary stages. Line ofsight orientation or unresolved companions, as examples,can significantly alter the observed SED.
Studies of the emergent SEDs at wavelengths& 10µmhave provided important, albeit ambiguous, constraints onthe circumstellar dust distributions for Class I stars. Al-though existing data are based on relatively low spatial reso-lution observations from IRAS and ISO, with the promise ofthe Spitzer Space Telescope (Werner et al., 2004) currentlybeing realized, a single generic representation of Class Iand some I/II stars has been developed. Models incorpo-rating infalling, rotating envelopes with mass infall rateson the order of10−6 M⊙/yr predict SEDs that are con-sistent with observations (Adams et al., 1987; Kenyon etal., 1993a;Whitney et al., 1997, 2003). However, only in
a few cases are these mass infall rates supported by kine-matic measurements of spatially resolved envelope struc-tures (e.g.,Gregerson et al., 1997). For some young starswhose SEDs can be explained by spherically-symmetricdust distributions, it has been suggested that nearly edge-on flared disk models may also be able to reproduce theSEDs (e.g.,Chiang and Goldreich, 1999;Hogerheijde andSandell, 2000). One additional complication
Fig. 1. Spectral index versus bolometric temperature for youngstars observed spectroscopically (White and Hillenbrand, 2004;Doppmann et al., 2005) in Taurus andρ Ophiuchi and which haveboth evolutionary diagnostics determined. Open symbols corre-spond to stars with detected photospheric features from whichstellar properties can be extracted; filled symbols are too heavilyveiled to extract these features. Class I stars are bolometricallycold (Tbol < 650 K) and have rising mid-infrared energy distribu-tions (α > 0.0). The new spectroscopic observations extend wellinto the Class I regime.
Whether the observable diagnostics trace distinct evolu-tionary states bears directly on the issue of whether Class Istars are in fact younger than Class II stars, as is often as-sumed, or whether they are simply less environmentally de-veloped; they could be T Tauri age stars still (or perhaps justcurrently) embedded within circumstellar material. What isneeded is an understanding of thestellarproperties of thesesystems. To date, stellar properties such as mass and agehave been derived for Class I stars predicated on the as-sumption that they are in the main stage of infall (see e.g.,Evans, 1999), that this material is accumulating in a cir-cumstellar disk, and then accretes onto the star at a rate suf-ficient to match the bolometric luminosity (defined as theluminosity of a star’s entire energy distribution). Given anassumed mass, the age of the star is then simply the massdivided by the mass infall rate (0.6 M⊙ / 3 × 10⁻⁶ M⊙/yr= 2 × 10⁵ yr). Buttressing the argument for the extremeyouth of Class I stars is the relative number of Class I, II,and III stars in clouds such as Tau-Aur. As discussed by
2

Benson and Myers(1989) andKenyon et al.(1990), the rel-ative ages of stars in different stages can be inferred fromtheir relative numbers, assuming a constant star formationrate. For Taurus-Auriga, there are 10 times fewer Class Istars than Class II and Class III stars, implying the Class Iphase must be 10 times shorter, leading to age estimates of∼ 2× 10⁵ yr assuming typical ages of∼ 2× 10⁶ yr for theClass II/III population, as inferred from the Hertzsprung-Russell diagram (e.g.,Kenyon and Hartmann, 1995).
A more robust confirmation that Class I stars are bona-fide protostars would be an unambiguous demonstrationthat they are acquiring mass at a much higher rate thanClass II stars. Although the mass infall rates inferred (in-directly, in most cases) for Class I stars are roughly 2 ordersof magnitude larger than the disk accretion rates determinedfor Class II stars (∼ 10−8 M⊙/yr; e.g., Gullbring et al.,1998), it has not yet been shown that the infalling materialis channeled through the disk and onto the star at this sameprodigious rate. Under the assumption that these two ratesare the same leads to a historical difficulty with the ClassI paradigm - the so-called “luminosity problem.” As firstpointed out byKenyon et al. (1990), if the material infallingfrom the envelope is channeled through the disk via steady-state accretion and onto the star, the accretion luminositywould be dominant at roughly 10 times the luminosity emit-ted from the photosphere. However, Class I stars, at least inTau-Aur, do not have integrated luminosities substantiallydifferent from those of neighboring T Tauri stars. Severalreconciliations have been proposed, including disk accre-tion which is not steady-state, very low mass (i.e., substel-lar) central masses, or simply erroneously large mass infallrates. Direct measurement, rather than indirect inference,of both the stellar and the accretion luminosities of Class Istars is needed to distinguish between these.
The most straightforward way to unambiguously deter-mine the stellar and accretion properties of young stars atany age is to observe their spectra at wavelengths shorterthan∼ 3µm where the peak flux from the stellar photo-sphere is emitted. While this has been possible for over fivedecades for Class II stars, the faintness of Class I stars atoptical and near-infrared wavelengths have made it difficultto obtain high resolution, high signal-to-noise observationsnecessary for such measurements. The development of sen-sitive spectrographs mounted on moderate to large aperturetelescopes now allow direct observations of Class I and I/IIphotospheres via light scattered through circumstellar en-velopes. These observational windows provide an opportu-nity to study Class I stars with the same tools and techniquesdeveloped for the study of Class II stars.
2. PHOTOSPHERES AND ACCRETION
Detailed spectroscopic studies of young stars much lessembedded than protostars (e.g., T Tauri stars) have pro-vided much of the observational basis for theories of howstars are assembled and how they interact with their en-vironment. The spectrum of the canonical young, accret-
ing, low-mass star consists of a late-type photosphere withstrong emission-lines and excess continuum emission (i.e.,veiling) at optical and infrared wavelengths. At opticalwavelengths, measurement of this excess emission, whichis attributed to high temperature regions generated in theaccretion flow, provides a direct estimate of the mass ac-cretion rate and constrains physical conditions of accretionshock models (see the chapter byBouvier et al.). At infraredwavelengths, measurement of the excess thermal emissionfrom warm circumstellar dust reveals structural informationof the inner accretion disk (Najita, 2004;Muzerolle et al.,2004;Johns-Krull et al., 2003). Additionally, the strengthsand profile shapes of permitted emission-lines delimit howcircumstellar material is channeled onto the stellar surface(Calvet and Hartmann, 1992;Muzerolle et al., 1998, 2001),while density-sensitive forbidden emission lines trace howand how much mass is lost in powerful stellar jets (e.g.,Hartigan et al., 1995). Perhaps most importantly, extractionof the underlying photospheric features permit the determi-nation of precise stellar properties (Teff , log g, [Fe/H]),which can be compared to evolutionary models to deter-mine stellar masses and ages. Doppler broadening of thesefeatures also provides a measure of the stellar rotation rate(vsini), which is important for tracing the evolution of an-gular momentum. Spectroscopic observations at visible andnear-infrared wavelengths are 2 powerful tools for studyinga young star’s photospheric properties and its circumstellaraccretion, if realizable.
2.1. Visible Light
Although observations at visible or optical wavelengths(. 1µm) are especially challenging for highly extinctedstars, there are nevertheless two motivations for pursuingthis. First, visible light is dominated by emission from boththe photosphere and high temperature accretion shocks; ittherefore offers the most direct view of stellar propertiesand accretion luminosity. Second, for small dust grains(. 1µm), visible light scatters more efficiently than in-frared light. Thus, even if the direct line-of-sight extinctionis too large for an embedded star to be observed directly, thecavities commonly seen in the envelopes surrounding ClassI stars (e.g.,Padgett et al., 1999) may permit observations ofthe photosphere and inner accretion processes through scat-tered light. This is only feasible in low column density starforming environments like Taurus-Auriga where the youngstars are not deeply embedded within the large-scale molec-ular cloud.
Recognition of faint but nevertheless detectable emissionfrom these embedded stars inspired several low resolutionspectroscopic studies with the aim of putting the first solidconstraints on the stellar and accretion properties of sus-pected protostars. This work began even prior to the nowestablished Class classification scheme; some of the firstembedded young stars were identified by the strong stellarjets which they powered (e.g.,Cohen and Schwartz, 1983;Graham, 1991). These stars typically had nearly featurelesscontinua with strong emission lines superimposed.Mundt
3

et al. (1985)obtained an optical spectra of the Class I starL1551 IRS 5 in Taurus-Auriga and identified the star as aG or K spectral type (but seeOsorio et al, 2003); the emis-sion line features showed P Cygni-like profiles suggestiveof a strong outflowing wind. More recently,Kenyon et al.(1998) reported spectroscopic observations for 10 of theClass I stars in Taurus-Auriga, detecting M spectral typefeatures (i.e., TiO bands) in several and strong emission linefeatures in all. These initial spectroscopic studies suggestedthat at least some Class I stars resemble their more evolvedT Tauri star counterparts (Class II stars), but with heavilyveiled spectra and strong emission lines. Unfortunately, thelimited numbers of stars with revealed spectroscopic fea-tures, due in part to the low spectral resolution of the obser-vations, precluded accurate determination of stellar proper-ties and specific mass accretion and mass outflow rates forunbiased comparisons with the more optically revealed TTauri stars.
2.2. Near-Infrared Light
The development of infrared detector technology duringthe 1980s and 90s has provided another valuable tool for thestudy of protostars. Since many stars form in high extinc-tion clouds that block nearly all visible light (e.g.,ρ Ophi-uchi, Serpens), they are not amenable to study at visiblewavelengths. It has been recognized for some time that late-type stellar photospheres exhibit a number of atomic andmolecular features in the 2 – 2.4µm wavelength region (Kband) which are diagnostic of effective temperatures andsurface gravities (Kleinmann and Hall, 1986;Wallace andHinkle, 1996), and can be used to measure stellar projectedrotational and radial velocities. Interstellar dust is also rela-tively transparent in this wavelength region,AK ≃ 0.1 AV(in magnitudes), permitting spectroscopic observations ofeven highly extinguished young stars in nearby dark cloudsto be obtained. However, the near-infrared spectra of em-bedded young stars are frequently complicated by the pres-ence of thermal emission from warm dust grains in theirinner circumstellar disks or inner envelope regions. Thisexcess circumstellar emission can be several times greaterthan the photospheric flux of an embedded young star in theK band wavelength region, causing an increased continuumlevel that veils photospheric features.
Initial near-infrared observations at low resolution foundthat the CO absorption features at2.3µm could be identi-fied less often for Class I stars than Class II stars (Casaliand Matthews, 1992;Casali and Eiroa, 1996). This was in-terpreted as Class I stars having larger near-infrared excessemission than Class II stars, possibly because of more lu-minous circumstellar disks caused by larger mass accretionrates or alternatively, envelope emission (Greene and Lada,1996;Calvet et al., 1997).Muzerolle et al.(1998) demon-strated that the Brγ (2.166µm) luminosity correlates wellwith the total accretion luminosity, and used this relationto measure the the first accretion luminosities for Class Istars. The determined accretion luminosities were only a
small fraction (∼ one-tenth) of the bolometric luminosity;assuming a typical T Tauri star mass and a radius, these ac-cretion luminosities correspond to mass accretion rates thatare overall similar to those of T Tauri stars (∼ 10−8M⊙/yr).With regard to stellar features,Greene and Lada(1996) andLuhman and Rieke(1999) showed that at least∼ 25% ofClass I and flat-spectrum stars exhibited temperature sensi-tive photospheric features, suggesting that stellar propertiescould potentially be determined directly (see also Ishii etal., 2004). As with early optical observations, however, lowspectral resolution and large infrared excesses preventedac-curate extraction of these properties. More recently,Nisiniet al. (2005) presented spectra of 3 Class I stars in R CrAat moderate resolution (R ∼ 9000), sufficient to measurethe amount of continuum excess and assign spectral types(i.e., temperatures), but (in this case) insufficient to measureradial and rotational velocities.
2.3. The Promise of High Resolution Spectra
Fortunately, high dispersion spectrographs on large aper-ture telescopes have allowed observers to begin studyingthe stellar and accretion properties of embedded low massprotostars in detail, at both optical and near-infrared wave-lengths. Initial measurements demonstrated that the keyto spectroscopically resolving faint photospheric features,given the large continuum excess emission, is high signal-to-noise, high dispersion spectroscopy (Greene and Lada,1997, 2000, 2002;Doppmann et al., 2003). This pioneer-ing work showed that fundamental photospheric diagnos-tics (temperatures, surface gravities, rotational velocities)and circumstellar features (continuum excesses, emissionline luminosities) could be measured nearly as precisely forClass I stars as for Class II stars. The small number of ClassI stars “revealed” however, inhibited statistically meaning-ful comparisons with T Tauri stars to search for evolution-ary differences.
Very recently the situation changed dramatically withtwo large surveys of embedded stars.White and Hillen-brand(2004; hereafterWH04) conducted a high resolution(R ≃ 34, 000) optical spectroscopic study of 36 “environ-mentally young” stars in Taurus-Auriga (Tau-Aur). WH04classify stars as “environmentally young” if they are eitherClass I stars or power a Herbig-Haro flow. Their sampleconsisted of 15 Class I stars and 21 Class II stars; they de-tected photospheric features in 11 of the Class I stars and allof the Class II stars. Fig. 2 shows three optical spectra fromthis survey.Doppmann et al.(2005; hereafterD05) con-ducted a complementary high resolution (R ≃ 18, 000) Kband study of 52 Class I and flat-SED stars, selected from5 nearby star forming regions - Taurus-Auriga (Tau-Aur),ρOphiuchi (ρOph), Serpens, Perseus, and R Corona Australi(R CrA). Forty-one of the 52 stars were found to have pho-tospheric absorption features from which stellar propertiesand excess emission could be measured. Fig. 3 shows 3near-infrared spectra from this survey.
4

Fig. 1.—Fig. 2. Portions of the Keck/HIRES spectra fromWhite and Hillenbrand(2004). IRAS 04158+2805 (α = +0.71) has a verycool spectral type (∼M6) and possibly a substellar mass. The two epochs of IRAS 04303+2240 (α = −0.35) show dramatic variationsin the veiling and the inferred mass accretion rate; the heavily veiled spectrum is less noisy because the star was also much brighter.Spectra of the best fit dwarf stars, veiled and rotationally broadened, are shown as dotted lines.
3. SPECTROSCOPIC PROPERTIES OFPROTOSTARS REVEALED
In this section, we present a combined assessment of thestellar and accretion properties of Class I and transitionalClass I/II stars as inferred in theWH04andD05 studies,including other results when applicable. We note that thetwo primary studies were able to determine astrophysicalproperties for 6 of the same stars, permitting a direct com-parison of the two techniques. Agreement is good for 5of the 6 overlapping stars (invsini and effective tempera-ture); the 1 discrepancy occurs in a heavily veiled, very lowsignal-to-noise (optical) observation; the infrared propertiesare adopted in this case.
To identify how stellar and circumstellar propertieschange as a star evolves through the proposed evolution-ary scheme, we present the inferred properties as a functionof the evolutionary diagnosticα, the infrared spectral index.We adopt this diagnostic simply because it is available formost of the stars observed. In addition to the primary sam-ples ofWH04andD05, we include a sample of accretingClass II stars from Tau-Aur (as assembled inWH04) andρOphiuchi (assembled inGreene and Lada, 1997 andDopp-mann et al., 2003), whose properties have been determinedfrom high dispersion spectra as well. When available, weselected values ofα calculated from observations at 2 and25 µm; when such measurements are not available, weuseα values calculated over a smaller wavelength interval(typically based on ISO observations extending to 14µm).Specifically, stars in Tau-Aur, NGC 1333 and R CrA have2-25µm α values determined from IRAS observations byKenyon and Hartmann(1995), Ladd et al. (1993), andWilking et al.(1992), respectively. Serpens andρ Oph starshave 2-14µm α values from the work ofKaas et al(2004)
andBontemps et al(2001). As emphasized in the introduc-tion, however, all evolutionary diagnostics are subject tosignificant biases, which can mask subtle trends. Thus, wewill primarily make ensemble comparisons between starsclassified as Class I stars (α > 0.0) and stars classified asClass II stars.
3.1. Stellar Masses
Historically, the masses of embedded young stars havebeen poorly determined by observations, since in mostcases, the only measurable property was the bolometric lu-minosity from the (often poorly determined) SED. IRASsurveys of the Tau-Aur,ρ Oph, R CrA, and Chamaeleon Idark clouds revealed populations of Class I embedded starsin each region with bolometric luminosities spanning frombelow 0.1L⊙ to approximately 50L⊙, with a median valuenear 1L⊙. (Kenyon et al., 1990; Wilking et al., 1989,1992;Prusti et al., 1992). Converting these luminosities tomass estimates requires an assumed mass-luminosity rela-tion, which strongly depends upon age, and an assumed ac-cretion luminosity. If the embedded Class I stars in these re-gions have luminosities dominated by accretion, then theirmasses can be approximated by applying the spherical ac-cretion luminosity relationLbol = Lacc = GM∗M/R∗.Adopting an infall rate of 2×10⁻⁶ M⊙/yr and an protostel-lar mass–radius relation (e.g.,Adams et al., 1987; Hart-mann, 1998) leads to a mass of 0.5 M⊙ (at a radius of 3R⊙) for a 10L⊙ star. Thus, only the most luminous Class Istars would have inferred masses consistent with those of TTauri stars (0.1 - a fewM⊙; Kenyon and Hartmann, 1995;Luhman and Rieke, 1999); the majority would have masses. 0.1 M⊙. Although there remain considerable uncertain-ties in the calculated bolometric luminosities and the pre-scription for accretion for Class I stars, the emerging census
5

WL 17
04158+2805
EC92
Fig. 2.—Fig. 3. High resolution near-infrared spectra of the embedded protostars fromDoppmann et al.(2005). WL 17 (α = +0.42)is heavily veiled, IRAS 04158+2805 (α = +0.71) has a very cool spectral type (∼ M6) and possibly a substellar mass, and EW 92 ismoderately rapidly rotating (vsini = 47 km/s).
suggests a ”luminosity problem” as described in Section 1;the typical Class I star is under-luminous relative to whatis expected for a canonical T Tauri size star (in mass andradius) accreting at the predicted envelope infall rates. Theluminosity problem is most severe in the Tau-Aur star form-ing region (Kenyon et al., 1990); there is tentative evidencefor a regional dependence upon the distribution of bolomet-ric luminosities of Class I stars. One proposed solution tothe luminosity problem is that Class I stars are in fact muchlower in mass than T Tauri stars (i.e., brown dwarfs), eitherbecause they are forming from less massive cores/envelopesor because they have yet accreted only a small fraction oftheir final mass. These possible solutions introduce yet ad-ditional problems, however. If almost all Class I ”stars”are producing brown dwarfs, then ”star” formation in mostregions must have already ceased, implying an unexpectedmass dependent formation time-scale. Alternatively, the hy-pothesis that Class I stars have accreted only a small frac-tion of their final mass is inconsistent with their relativelylow envelope masses (∼ 0.1M⊙), estimated from millime-ter wavelength observations (e.g.,Motte and Andre, 2001).Accurately determined stellar mass estimates are needed totest this proposed yet problematic solution to the luminosityproblem.
One direct way to estimate the mass of a young star is toobservationally determine its stellar effective temperatureand luminosity and then compare them with the predictionsof pre-main sequence (PMS) evolutionary models. The re-cent optical and near-IR spectroscopic studies of WH04 andD05 have been able to achieve this for the first time for sev-eral dozen embedded young stars in nearby dark clouds.Since low mass, fully-convective stars primarily evolve inluminosity while young (e.g.,Baraffe et al., 1998), temper-ature is especially important in determining a young star’smass. In most cases, the temperature estimates for the Class
I stars are as precisely determined as those for T Tauri stars(∼ 150 K), which translates into similar uncertainties in theinferred stellar masses (a few tens of percent), but large sys-tematic uncertainties remain (e.g., temperature scale - seethe chapter byMathieu et al.; effects of accretion -Siess etal., 1999;Tout et al., 1999). The uncertainties in the stel-lar luminosities of embedded stars are, on the other hand,typically much larger than those for T Tauri stars.WH04estimated stellar luminosities by performing a bolometriccorrection from near-infraredJ-band (λ ≃ 1.25µm) photo-metric data, which is expected to be least contaminated bycircumstellar excesses (see, however,Cieza et al. 2005);extinctions were determined by comparing the observedJ −H colors to that expected for a dwarf-like photosphere.D05estimated luminosities by performing a bolometric cor-rection to near-infraredK-band (λ ≃ 2.3µm) photomet-ric data, after accounting forK-band veilings determinedfrom their spectra; extinctions were determined by compar-ing theH − K colors to a typical value for a T Tauri star.However, much of the flux detected from embedded youngstars at visible and near-infrared wavelengths has been scat-tered from their circumstellar environments. The physicalnature of circumstellar dust grains (sizes, shape, composi-tion), distribution of material in disks and envelopes, andsystem inclination all change how the photospheric flux isscattered into our line of sight, changing both a star’s bright-ness and color. Comparisons of luminosities determined viadifferent techniques differ by factors of 2-3, and we suggestthis as a typical uncertainty. In addition to this, stars withedge-on disk orientations often have calculated luminosi-ties that can be low by factors of 10 to 100; the preferentialshort-wavelength scattering leads to artificially low extinc-tion estimates. With these uncertainties and possible sys-tematic errors in mind, in Fig. 4 are shown all the ClassI and flat-spectrum stars (α > −0.3) in Tau-Aur,ρ Oph,
6

and Serpens observed in theD05 and theWH04surveyson a Hertzprung-Russell diagram. The PMS evolutionarymodels ofBaraffe et al.(1998) are shown for comparison.
Several points can be extracted from Fig. 4 regardingthe masses of Class I and flat-spectrum stars. First, the starsgenerally span a similar range of effective temperatures andstellar luminosities in all regions, though there is a slightlynarrower range of temperatures inρ Oph. Second, basedon comparisons with theBaraffe et al.(1998) PMS evolu-tionary models, the combined distribution of stellar massesspan from substellar to several solar masses. This is sim-ilar to the distributions of Class II stellar masses in Tau-Aur andρ Oph (Kenyon and Hartmann, 1995;Luhman andRieke, 1999), while little has been reported on the masses ofClass II stars in the Serpens clouds. Other studies corrobo-rates these findings.Nisini et al. (2005) determine massesspanning from 0.3 to 1.2 M⊙ for 3 Class I stars in R CrA,based on spectral types determined from moderate resolu-tion spectra.Brown and Chandler(1999) determine massesof 0.2 - 0.7 M⊙ for 2 Class I stars in Tau-Aur based on diskkinematics under the assumption of Keplerian rotation.
Fig. 4. Stellar luminosities and effective temperatures ofClass Iand flat-SED stars (α > −0.3) in ρ Oph, Tau-Aur, and Serpensare shown on an H-R diagram. Filled symbols are from D05 andunfilled symbols are from WH04. The evolutionary models ofBaraffe et al.(1998) are also shown for comparison.
Apparently the majority of Class I stars have stellarmasses that are similar to those of T Tauri stars. Thepresent spectroscopic data does not support the notion thatthe majority of the low luminosity (L < 1L⊙) Class I starsare substellar. This proposed resolution to the luminosityproblem can now be excluded. Nevertheless, it is particu-larly notable that there are several Class I stars which havemasses that are close to or below the substellar boundary(0.075 M⊙; Baraffe et al., 1998).WH04identified 3 ClassI stars with spectral types of M5.5 or M6, and consideredthem candidate Class I brown dwarfs. Two of these stars,
IRAS 04158+2805 and IRAS 04489+3042 were also ob-served and analyzed byD05. TheD05 infrared spectra alsoindicate a M6 spectral type for IRAS 04158+2805, but yielda slightly earlier M4 spectral type for IRAS 04489+3042.It is very encouraging that both optical and infrared spec-tra are yielding very similar results for these stars, andstrengthens the case for the existence of a Class I objectat or below the substellar boundary.
On the other hand, some Class I stars which had beenpreviously interpreted as accreting brown dwarfs from pho-tometric data are now revealed to be low mass stars instead.For example,Young et al.(2003) interpreted the very com-plete photometric data on the Class I star IRAS 04385+2250as evidence that it is a brown dwarf of only 0.01M⊙ (∼ 10MJup) by assuming an accretion rate of2 × 10−6M⊙/yr.As pointed out byKenyon et al.(1990; 1994), such an as-sumption implies that all low luminosity (L < 1L⊙) Class Istars are actually substellar. However,WH04find that IRAS04385+2250 (also known as Haro 6-33) has a spectral typeof M0, placing it squarely in the regime of low mass starsand not brown dwarfs.
3.2. Stellar Ages
In addition to providing stellar masses, comparisons ofobservationally determined stellar properties with the pre-dictions of evolutionary models can provide useful age esti-mates. Comparisons of Class II stars in nearby dark cloudsconsistently yield ages spanning from less than 1 to a fewmillion years (e.g., seeKenyon and Hartmann, 1995;Luh-man and Rieke, 1999). If Class I stars are really the pre-cursors to Class II stars, as their less evolved circumstellarenvironments suggest, then they should have younger ages.
As emphasized above, the calculated luminosities ofClass I stars are especially uncertain given the large ex-tinctions, uncertain scattered light contributions, and con-tinuum excesses; they are also occasionally subject to largesystematic errors caused by orientation effects. These largeuncertainties bear directly upon how well the stellar agescan be determined, since low mass stars evolve primaryalong vertical evolutionary tracks at ages less than a few×107 yr. Nevertheless, comparisons of the observed lumi-nosities and temperatures with the predictions of pre-mainsequence evolutionary models, as shown in Fig. 4, providea large ensemble of ages estimates. The range of ages isbroadest for Tau-Aur and narrowest for Serpens, thoughthese regions have the largest and smallest samples mea-sured, respectively. Several stars in Tau-Aur appear to haveunrealistically old ages (below the main-sequence), likelya consequence of the stellar luminosity being severely un-derestimated because of an edge-on disk orientation (seeWH04). The absence of low luminosity stars inρ Oph andSerpens suggests they may be more difficult to identify inregions of high extinction.
Despite these possible regional differences and large un-certainties, calculating a median age in all 3 regions yieldsa consistent value of∼ 1Myr. This is remarkably similar to
7
the average age of Class II stars inρ Oph and Tau-Aur; feware known in Serpens. This suggests that most Class I starsare not systematically younger than Class II stars. Unfor-tunately the large uncertainties in the luminosity estimatesof Class I stars, as well as current evolutionary models atearly ages (Baraffe et al., 2002), limits the robustness ofthis comparison at this time.
Finally, we note that a comparison of the inferred stel-lar luminosities with calculated bolometric luminositiesforClass I stars suggests that in most cases studied here, thestellar luminosity is the dominant source of luminosity inthe system (LStar/LBol > 0.5). Most Class I stars withdetected photospheric features do not have accretion domi-nated luminosities as had been initially proposed. We cau-tion, however, that the observational biases in the samplestudied here (revealed at< 3µm, with moderate veiling orless) prevent extrapolation of this finding to Class I stars ingeneral. The most bolometrically luminous stars for whichphotospheric features are detected are IRS 43 (Lbol = 7.2L⊙) and YLW 16A (Lbol = 8.9L⊙; seeD05). Thus it isnot yet known if the most luminous Class I stars (Lbol > 10L⊙) have accretion dominated luminosities or are simplymore massive stars.
3.3. Stellar Rotation
Studies of stellar rotation at very young ages have re-vealed clues regarding the evolution of angular momentumfrom the epoch of star formation through to the young mainsequence. Conservation of angular momentum during thecollapse of a molecular core to form a low-mass star shouldlead to rotation velocities near break-up (vbreak−up =√
(GMstar/Rstar) ∼ 200 km/s). However, the small pro-jected rotation velocities of Class II stars (vsini . 20km/sec;Bouvier et al., 1986, 1993;Hartmann et al., 1986;Stassun et al., 1999; Rhode et al., 2001; Rebull et al.,2002; see the chapter byHerbst et al.) show that angu-lar momentum must be extracted quickly, on time scalesof < 1 − 10 Myr. A number of theories have been pro-posed to rotationally “brake” young stars. One favoredmodel for involves magnetic linkage between the star andslowly rotating disk material at a distance of several stellarradii (Konigl, 1991;Collier Cameron and Campbell, 1993;Shu et al., 1994;Armitage and Clarke, 1996). Initial ob-servational evidence supported this picture. T Tauri starswithout disks were found to rotate somewhat more rapidlythan stars with disks (Edwards et al., 1993;Bouvier et al.,1993, 1995), which was interpreted as evidence that diskpresence keeps stars rotating at fixed angular velocity whiledisk absence allows stars to conserve angular momentumand spin up as they contract towards their main sequenceradii. Since then, the observational case for disk lockinghas become less clear-cut (e.g.,Stassun et al., 2001; but seeRebull et al., 2004), while detailed theoretical and magneto-hydrodynamical considerations suggest that disk locking inand of itself is unable to extract sufficient amounts of angu-lar momentum (Safier, 1998). Strong stellar winds are one
possible alternative (e.g.,Matt et al., 2005).
Fig. 5. Projected rotational velocity (vsini) versus spectral in-dex. Triangles are stars inρ Oph, squares are stars in Tau-Aur anddiamonds are stars in Serpens.vsini measurements are shown asopen symbols while upper limits are shown as filled symbols. Thedashed vertical line separates Class I stars from Class II stars. Dataoriginally presented inWH04, Covey et al.(2005) and referencestherein.
The uncertainties in our understanding ofhow angularmomentum is extracted from young stars provide motiva-tion for determiningwhenit is extracted, since knowing theappropriate time scale could help distinguish between pro-posed models. The rotation velocities of Class I stars asrevealed by spectroscopic studies provide the earliest mea-surements of stellar angular momentum; Fig. 5 shows thedistribution of vsini values for Class I and Class II starsin Tau-Aur,ρ Oph, and R CrA versus the evolutionary di-agnosticα. The largestvsini value observed for a ClassI star is 77 km/s, while the remainder havevsini ≤ 56km/s. These values are only a few tenths of the typicalbreak-up velocity. Comparing Class I (α > 0.0) to ClassII (α < 0.0) stars, Class I stars have slightly higher rota-tion rates. Although the distributions of rotation rates arestatistically different (Covey et al., 2005), the difference inthe mean is only a factor of two. The distributions are lessdistinct for any particular region (e.g., Tau-Aur,WH04),likely from smaller number statistics, though global prop-erties of a region could lead to correlated biases (e.g., age).Although the distributions of Class II rotational velocitiesin some star forming regions have been shown to be sta-tistically different (e.g., Orion versus Tau-Aur;Clarke andBouvier, 2000; White and Basri, 2003), the evidence forthis at the Class I stage is still tentative (∼ 2σ); Covey etal. (2005) found Tau-Aur to have the lowest mean observedrotation velocity for the three regions in their study (30.1km/s versus 31.1 km/s inρ Oph and 36.8 km/s in Serpens).These comparisons are likewise limited by small numberstatistics. Overall, the observational evidence demonstratesthat Class I stars are rotating somewhat more rapidly than
8

Class II stars, but at rates that are well below break-up ve-locities. If Class I stars are indeed in the main phase of massaccretion (Section 4.3), this implies that angular momentumis removed concurrently with this process.
3.4. Circumstellar Accretion
If Class I stars are to acquire the majority of their mass(e.g., 0.6 M⊙) on a timescale of∼ 2 × 10⁵ yr, they musthave time-averaged mass accretion rates that are∼ 3×10⁻⁶
M⊙/yr, assuming a simple spherical infall model (e.g.,Hartmann, 1998). For comparison, this mass accretion rateis at least 2 orders of magnitude larger than what is typicallyobserved for T Tauri stars (e.g.,Gullbring et al., 1998).The newly available high dispersion spectra of Class I starspermit measurements of the mass accretion rate (from thedisk onto the star), by 2 independent methods. The first ofthese comes from measurements of optical excess emissionin high dispersion optical spectra under the assumption thatthe liberated energy is gravitational potential energy (seethe chapter byBouvier et al.). Unfortunately there remainconsiderable uncertainties in measuring the total liberatedenergy, which typically requires a large bolometric correc-tion from an optical measurement; the majority of the accre-tion luminosity is emitted at ultra-violet wavelengths. Addi-tionally, estimating the potential energy requires estimatesof stellar and inner disk properties, which have large un-certainties themselves. Nevertheless, by calculating massaccretion rates for Class I stars following the same assump-tions used for T Tauri stars, many of these systematic uncer-tainties can be removed, thereby permitting a more robustcomparison if the same accretion mechanism applies.
WH04have measured optical excess emission at 6500Afor 11 Class I stars, and several borderline Class I/II stars,all within the Tau-Aur star forming region. These measure-ments, along with a sample of excess measurements of ac-creting T Tauri stars fromHartigan et al. (1995; as com-piled in WH04), are shown in Fig. 6. Similar to the T Tauristars, the Class I stars have continuum excesses that rangefrom not detected (< 0.1) to several times the photosphere;in the general case, their optical emission is not dominatedby accretion luminosity. Class I stars have veiling valuesthat are only modestly larger in the mean (×1.3) than thoseof Class II stars.WH04proceed to convert these continuumexcesses to mass accretion rates, and find values of a few×10−8 M⊙/yr, which are again similar to those of ClassII stars. Further, by accounting for other components tothe star’s luminosity, they find that the accretion luminosityonly accounts for∼ 25% of the bolometric luminosity, onaverage.
A second measure of the mass accretion rate comes fromemission line luminosities. Emission-line studies, in com-bination with radiative transfer models of circumstellar ac-cretion, suggest that many of the permitted lines originateinthe infalling magnetospheric flow (Hartmann et al., 1994;Muzerolle et al., 1998), and that the line strengths are pro-portional to the amount of infalling mass.Muzerolle et al.
(1998a, 1998b) demonstrated this to be true for the Ca II in-frared triplet and Brγ by correlating these emission-line lu-minosities with mass accretion rates determined from blueexcess emission. As emphasized by the authors, accuratecorrections for extinction and scattered light are critical forthis. The near-infrared emission-line Brγ is of special in-terest in the study for Class I stars since the high extinctionoften inhibits observations at shorter wavelengths. Usingthe Brγ correlation,Muzerolle et al.(1998) found that theBrγ luminosities of Class I stars, with assumed stellar prop-erties, are similar to those of Class II stars. The implicationis that they have similar mass accretion rates.
Fig. 6. Optical veiling versus spectral index for stars in Tau-Aur.Measurements are fromWH04andHartigan et al.(1995). Veilingmeasurements are shown as open symbols while upper limits areshown as filled symbols. The dashed vertical line separates ClassI stars from Class II stars.
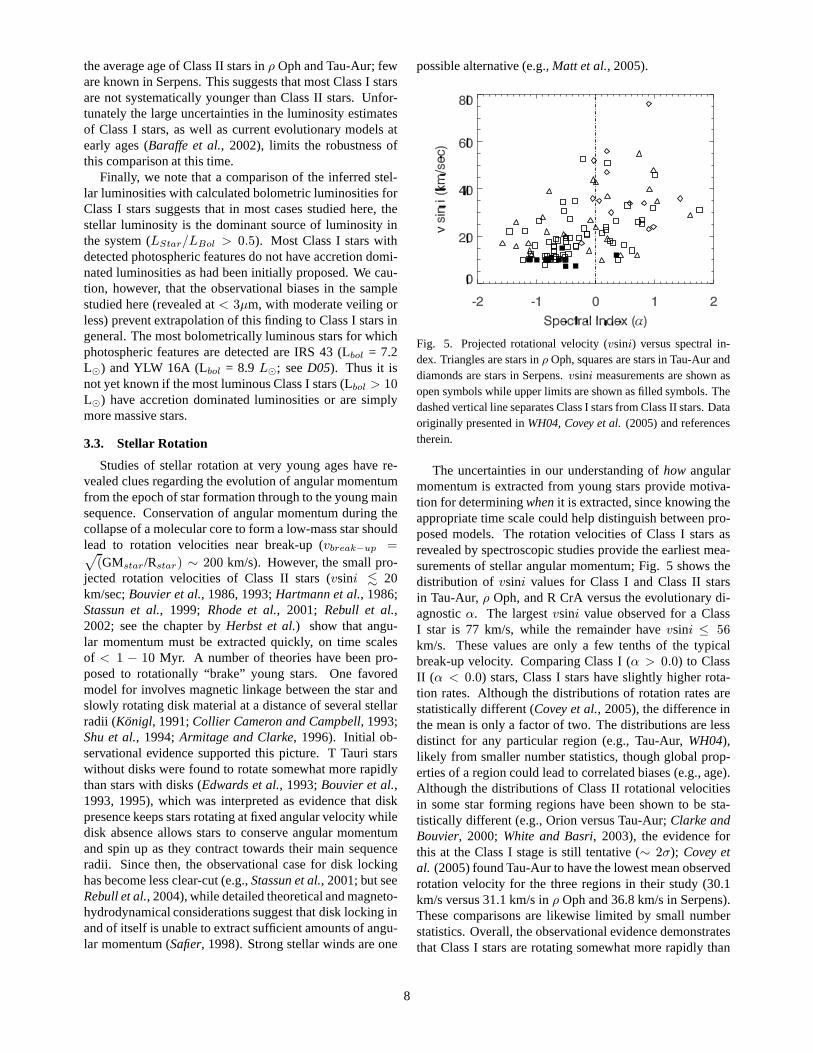
Fig. 7 shows a compilation of logarithmic Brγ luminosi-ties fromMuzerolle et al. (1998) and D05 (also includesmeasurements fromLuhman and Rieke, 1999; Folha andEmerson, 1999; Doppmann et al., 2003), plotted versusspectral index. As with optical excess emission, the Brγluminosities of Class I stars span a similar, though slightlybroader range than the Class II stars, but are larger in theaverage by a factor of a few; the distributions are differentat approximately the 3σ level according to a K-S test. Muchof the difference between the Class I and Class II stars ap-pears to be driven by stars in theρ Oph region, where theBrγ luminosities of Class I stars are systematically largerthan those of Class II stars by a factor of∼ 5 in the mean;the distributions are different at the∼ 2σ level, or& 3σif the low Brγ luminosity (-4.58),α = 0.0 star GY21 isconsidered a Class II. Stars in Tau-Aur show no differencebetween the 2 classes (< 1σ).
Conversion of these luminosities to mass accretion ratesleads to values for Class I stars that are similar to ClassII stars, and corroborates the initial study ofMuzerolle etal. (1998). The largest mass accretion rates are∼ 10−7
M⊙/yr, and many of these are in theρ Oph star formingregion. The larger mean accretion luminosities inρ Ophis consistent with its larger mean near-infrared excess forClass I stars relative to Class II stars (< rK >= 2.2 versus0.94), compared with other regions. Overall it appears thatthe mass accretion rate during the majority of the Class Iphase is similar to that of T Tauri stars, and1− 2 orders ofmagnitude less than the envelope infall rates inferred from
9
SED modeling (few×10−6 M⊙/yr). We note that there istentative evidence that the mass accretion rate is extremelytime variable during the embedded phase. As one example,the borderline Class I/II star IRAS 04303+2240 changed itsmass accretion rate dramatically (> 4×) during 2 observa-tional epochs (Fig. 2). Little observational work has beendone to characterize the amplitudes or timescales of candi-date protostar variability.
Fig. 7. Brγ luminosity versus spectral index. Triangles are starsin ρ Oph, squares are stars in Tau-Aur and Diamonds are stars inSerpens. Filled symbols are fromD05 while open symbols arefrom Muzerolle et al.(1998). The dashed vertical line separatedClass I stars from Class II stars.
3.5. Jet Emission
Optically thin forbidden emission-lines are believed tooriginate in an outflowing jet or wind. Their intensity is ex-pected to be directly proportional to the amount of materialbeing funneled along the jet, as viewed through the slit ofthe spectrograph. The luminosity of these emission linescan therefore be used to estimate the mass outflow rate in ayoung stellar jet (see the chapter byBally et al.). Since jetsare believed to be powered by circumstellar accretion, themass outflow rate should correlate with the mass accretionrate.
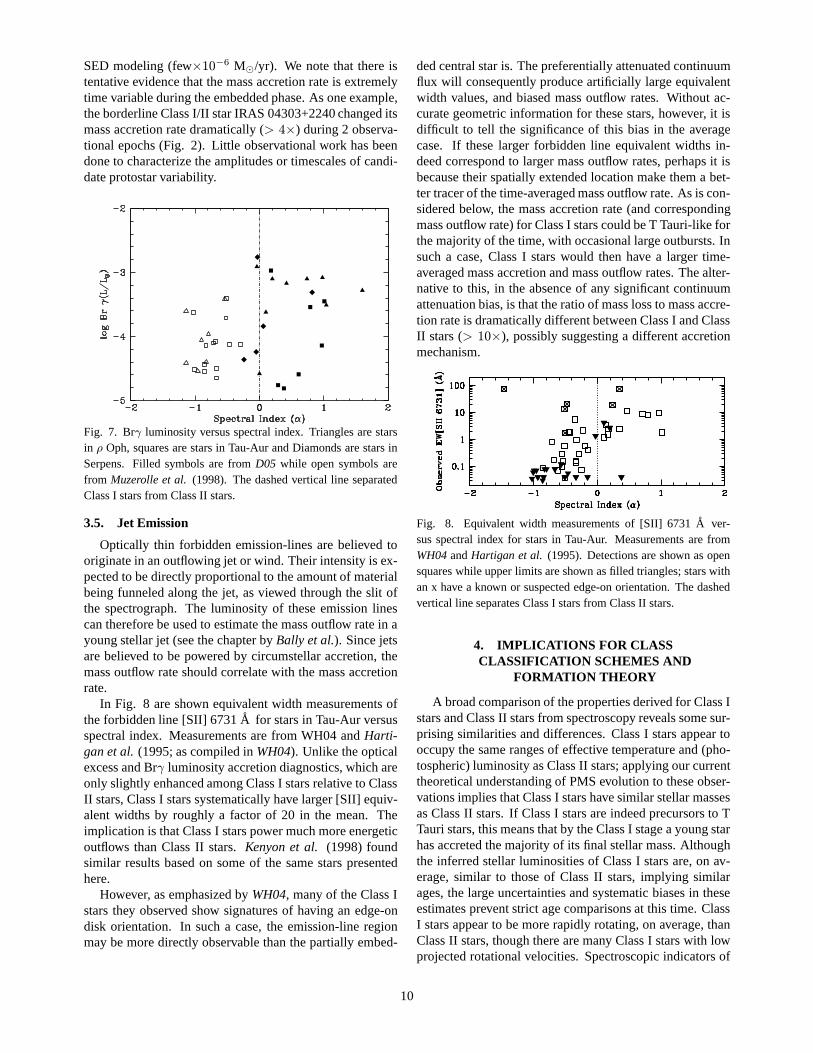
In Fig. 8 are shown equivalent width measurements ofthe forbidden line [SII] 6731A for stars in Tau-Aur versusspectral index. Measurements are from WH04 andHarti-gan et al.(1995; as compiled inWH04). Unlike the opticalexcess and Brγ luminosity accretion diagnostics, which areonly slightly enhanced among Class I stars relative to ClassII stars, Class I stars systematically have larger [SII] equiv-alent widths by roughly a factor of 20 in the mean. Theimplication is that Class I stars power much more energeticoutflows than Class II stars.Kenyon et al. (1998) foundsimilar results based on some of the same stars presentedhere.
However, as emphasized byWH04, many of the Class Istars they observed show signatures of having an edge-ondisk orientation. In such a case, the emission-line regionmay be more directly observable than the partially embed-
ded central star is. The preferentially attenuated continuumflux will consequently produce artificially large equivalentwidth values, and biased mass outflow rates. Without ac-curate geometric information for these stars, however, it isdifficult to tell the significance of this bias in the averagecase. If these larger forbidden line equivalent widths in-deed correspond to larger mass outflow rates, perhaps it isbecause their spatially extended location make them a bet-ter tracer of the time-averaged mass outflow rate. As is con-sidered below, the mass accretion rate (and correspondingmass outflow rate) for Class I stars could be T Tauri-like forthe majority of the time, with occasional large outbursts. Insuch a case, Class I stars would then have a larger time-averaged mass accretion and mass outflow rates. The alter-native to this, in the absence of any significant continuumattenuation bias, is that the ratio of mass loss to mass accre-tion rate is dramatically different between Class I and ClassII stars (> 10×), possibly suggesting a different accretionmechanism.
Fig. 8. Equivalent width measurements of [SII] 6731A ver-sus spectral index for stars in Tau-Aur. Measurements are fromWH04andHartigan et al. (1995). Detections are shown as opensquares while upper limits are shown as filled triangles; stars withan x have a known or suspected edge-on orientation. The dashedvertical line separates Class I stars from Class II stars.
4. IMPLICATIONS FOR CLASSCLASSIFICATION SCHEMES AND
FORMATION THEORY
A broad comparison of the properties derived for Class Istars and Class II stars from spectroscopy reveals some sur-prising similarities and differences. Class I stars appeartooccupy the same ranges of effective temperature and (pho-tospheric) luminosity as Class II stars; applying our currenttheoretical understanding of PMS evolution to these obser-vations implies that Class I stars have similar stellar massesas Class II stars. If Class I stars are indeed precursors to TTauri stars, this means that by the Class I stage a young starhas accreted the majority of its final stellar mass. Althoughthe inferred stellar luminosities of Class I stars are, on av-erage, similar to those of Class II stars, implying similarages, the large uncertainties and systematic biases in theseestimates prevent strict age comparisons at this time. ClassI stars appear to be more rapidly rotating, on average, thanClass II stars, though there are many Class I stars with lowprojected rotational velocities. Spectroscopic indicators of
10

mass accretion, such as optical veiling and Brγ luminos-ity, do appear slightly elevated in Class I stars relative toClass II stars, but still well below predicted mass infall rates(∼ 10−6 M⊙/yr). Although Class I stars have larger forbid-den line emission strengths, implying larger mass outflowrates, there is a yet unaccounted for continuum attenuationbias in these measurements. Here we use the combinedresults to investigate possible regional differences amongClass I stars, to assess whether Class I stars are being prop-erly classified, and to improve our understanding of howmass is acquired during the main phase of mass accretion.
4.1. Are There Regional Differences Among Class IStars?
Initial studies of Class I stars suggested that their prop-erties may differ in different regions.Kenyon et al.(1990)noted that although the Tau-Aur andρOph clouds both con-tain similar numbers of Class I stars,ρ Oph contains manymore withLbol > 10L⊙. If stars in both regions have sim-ilar stellar masses, then this luminosity difference shouldtranslate intoρ Oph stars having mass accretion rates 3 –10 times higher than those in Tau-Aur (and correspondinglylarger mass infall rates, if the accretion is steady-state).This is expected according to classical star formation theory(Shu, 1977), which predicts that the infall rate should scaleas the cube of the isothermal sound speed. The warmer gasin ρ Oph, relative to Tau-Aur (Myers and Benson, 1983),should consequently yield large mass infall rates, and largertime-averaged mass accretion rates. However, more recentwork suggests that cloud turbulence may primarily set theinitial infall rates (e.g.,Mac Low and Klessen, 2004), andpossibly even the initial mass function (e.g.,Goodwin et al.,2004), and the resulting binary fraction and rotational distri-bution (Jappsen and Klessen, 2004). Searching for possibledifferences in the stellar and accretion properties of starsproduced in regions with different global properties (tem-perature, turbulence, density) can therefore help distinguishbetween proposed scenarios for mass assembly and earlyevolution.
The distributions of effective temperatures shown in Fig.4 indicate that there are no significant differences in themasses of Class I stars in either the Tau-Aur,ρ Oph, orSerpens star forming regions (< 1σ, according to K-Stests). While the stellar luminosities and ages are also sim-ilar among the 3 regions (given their large uncertainties),Serpens is somewhat distinct in that all of its Class I andflat-SED members appear coeval at an age younger than 1Myr, as would be expected for bona-fide protostars. Thelarger scatter in stellar luminosity inρ Oph and Tau-Aur isnot well understood, though some apparently low luminos-ity stars are a consequence of their edge-on disk orientation(Section 3.2).
The analysis of accretion diagnostics in Section 3.4 par-tially supports a scenario in which Class I stars inρ Ophare accreting at higher rates than those in Tau-Aur. TheBrγ luminosities of Class I stars inρ Oph are systemat-ically larger than those in Tau-Aur, implying larger mass
accretion rates. This is also supported, though less directly,with the larger near-IR veiling and higher bolometric lumi-nosities of Class I stars inρ Oph relative to Tau-Aur (D05).In a case study of the luminous (Lbol = 10 L⊙) protostarYLW 15, Greene and Lada, (2002) determine that 70% ofthe star’s luminosity is due to mass accretion and infer arate of2 × 10−6M⊙/yr. At least in this one case, the diskaccretion rate appears consistent with the mass infall ratein-ferred from envelope models (though these infall rates arederived primarily from Class I stars in Tau-Aur, because ofless confusion with cloud material in that region). Giventhe small number and broad range of Brγ luminosities forClass I stars in Serpens, this distribution is consistent withthe distributions of eitherρ Oph or Tau-Aur Class I stars.
Finally, the present data do not reveal any notable dif-ferences in the distributions of rotation velocities, or angu-lar momenta, of embedded protostars in different regions.Covey et al. (2005) found that Class I and flat spectrumstars in Serpens had a somewhat larger meanvsini rotationvelocity than those in Tau-Aur orρ Oph, but this differenceis not statistically significant (< 2σ). We caution that anyorientation bias present in the samples studied (e.g., edge-on disk systems), will also bias the distribution of projectedrotational velocities.
4.2. Are Class I Stars Properly Classified?
In the traditional classification scheme, Class I stars aretrue protostars – stellar embryos surrounded by an infallingenvelope – while Class II stars are pre-main sequence starssurrounded by circumstellar disks only. Here we considerthe ability of popular evolutionary diagnostics to unambigu-ously distinguish between these 2 classes. Radiative trans-fer models of still-forming stars find that the SED shapetypically used to distinguish Class I and Class II stars (asparametrized by Tbol andα) has an important dependenceon the orientation of the disk and envelope relative to theobserver’s line of sight (Kenyon et al., 1993a, 1993b;Yorkeet al., 1993;Sonnhalter et al., 1995;Whitney et al., 2003,2004). As an example, the models ofWhitney et al.(2003)show that mid-latitude (i ∼ 40◦) Class I stars have opti-cal, near- and mid-infrared characteristics similar to thoseof more edge-on disk (i ∼ 75◦) Class II stars. The effectsof edge-on disk orientation are most severe for evolutionarydiagnostics determined in the near- and mid-infrared suchas the2 − 25µm spectral index. Bolometric temperaturesare also biased, but less so, while diagnostics based at muchlonger wavelengths, such as the ratio of sub-millimeter tobolometric luminosity (Andre et al., 1993), are the least af-fected. Unfortunately longer wavelength SEDs are not yetavailable for Class I stars in many star forming region. Con-sequently, we conclude that current samples of Class I starsdefined by either spectral index or bolometric temperatureare contaminated with at least a few edge-on disk Class IIstars.
Other observable characteristics, however, can be help-ful in identifying Class II stars that have been mistakenly
11

classified as Class I stars due to orientation effects. Theradiative transfer models ofWhitney et al. (2003) showthat edge-on Class II stars are nearly 5 times fainter than‘true’ Class I stars with the same value ofα, suggestingthat misclassified edge-on systems should appear signifi-cantly lower in an H-R diagram.WH04 identified severallikely disk edge-on systems in their sample of optically re-vealed Class I stars in Tau-Aur, several of which (but notall) appear under-luminous relative to other cluster mem-bers. Unfortunately the large luminosity spread of Class Istars inhibit identifying edge-on disk systems based on thiscriterion alone, unless the system is almost precisely edge-on (e.g. HH 30). Column-density sensitive spectral features(e.g., Si at9.7µm; Kessler-Silacci et al., 2005) or high spa-tial resolution imaging may provide less ambiguous orien-tation information.
The presence of spatially extended envelope material, asdetermined from image morphology at infrared and mil-limeter wavelengths, has been proposed as a more directway to constrain the evolutionary Class. Such features areonly expected during the main accretion phase. Based oncriteria put forth byMotte and Andre(2001), only 58%(15/26) of the Class I stars in Tau-Aur are true protostars.The remaining 42% (11 stars) have envelope masses. 0.1M⊙ and are spatially unresolved at 1.3 mm wavelengths(referred to as “unresolved Class I sources” inMotte andAndre, 2001). Motte and Andre(2001) suggest that thesestars are more likely transitional Class I/II stars or highlyreddened Class II stars (e.g., edge-on disk systems). Thecomplementary near-infrared morphology survey byParkand Kenyon(2002) supports the claim that these stars arenot bona fide Class I stars. However, we note that the mor-phological criteria used in these studies do not account forthe luminosity and mass of the central star. For example,IRAS 04158+2805 may appear more evolved and point-likebecause it is a lower luminosity Class I brown dwarf with asmaller disk and envelope.
Andre and Montmerle(1994) present a similar mor-phological study based 1.3 mm continuum observations ofClass I and Class II stars in theρ Oph star forming region.They found that Class I and Class II stars, as classified bythe 2.2 − 10µm spectral index, have similar 1.3 mm fluxdensities. Class I stars, however, were more often spatiallyextended, consistent with a significant envelope component,though of relatively low mass (. 0.1M⊙). Thus, it appearsthat a much smaller fraction of Class I stars inρ Oph, rela-tive to Tau-Aur, are candidate misclassified Class II stars.Nevertheless, their low envelope masses imply that theyhave already acquired the majority of their stellar mass (dis-cussed below), like Class II stars. Complementary compar-isons of Class I and Class II stars in the Serpens and R CrAstar forming region have not yet been carried out.
Based on this mostly indirect evidence, we conclude thatbetween one-third and one-half of the Class I stars in Tau-Aur are candidate misclassified Class II stars; the emission-line profiles and image morphology suggests that in somecases the misclassification is caused by a nearly edge-on
orientation. There is less evidence for significant misclassi-fication in other regions (e.g.,ρ Oph).
4.3. Are Class I Stars in the Main Accretion Phase?
Although the absolute values of the circumstellar diskaccretion rates have large systematic uncertainties, the ratesinferred for Class I stars and Class II stars, under the sameassumptions, are similar. However, these values are typi-cally 1-2 orders of magnitude less than both the envelopeinfall rates inferred from SED modeling of Class I stars(e.g., few×10−8 M⊙/yr vs. few×10−6 M⊙/yr) and thetime-averaged accretion rate necessary to assemble a solarmass star in a few×105 years. Here we explore possibleways to reconcile this apparent discrepancy.
The first possibility to consider is that either the disk ac-cretion rates or the mass infall rates are wrong, or both.Given the large uncertainty in determining the total accre-tion luminosity from an observed excess, which is roughlyan order of magnitude (see e.g.,Gullbring et al., 1998;WH04), the average disk accretion rate could be as largeas10−7 M⊙/yr. Much larger disk accretion rates would in-voke statistical problems since classical T Tauri stars areaccreting at this rate as well, for 1-10 Myr, and would con-sequently produce a much more massive population thanwhat is observed. Larger rates would also be inconsistentwith emission-line profile analyses (Hartmann et al., 1994;Muzerolle et al., 1998). Assessing possible errors in themass infall rates is more challenging since most are not de-termined directly from kinematic infall signatures. Instead,they are primarily set by the density of the envelope ma-terial; denser envelopes yield higher mass infall rates andredder SEDs. However, effects such as orientation (Whitneyet al., 2003) and disk emission (Kenyon et al., 1993a;Wolfet al., 2003) can also shift the SED towards redder wave-lengths, if unaccounted for. Using sophisticated envelopeplus disk models combined with spatially resolved imagesto constrain orientation,Eisner et al.(2005) andTerebey etal. (2006) nevertheless find that mass infall rates of a few×10−6 M⊙/yr still provide the best fits to the SED and im-age morphology. How low these infall rates could be andstill provide reasonable fits is unclear; a factor of∼ 10 de-crease in the assumed infall rate could potentially reconcilethe discrepancy, if disk accretion rates are correspondinglyincreased by a factor of 10. It is important to keep in mind,as highlighted byTerebey et al.(2006), that the amount ofenvelope material which actually reaches the star may beonly one-forth of the infalling mass because of mass lost tostellar jets/winds and companions. With all this in mind,we conclude that it is possible to reconcile the infall/diskaccretion rate discrepancy based on systematic errors andmodel assuptions alone. However, since the current bestestimates strongly favor values that are∼ 2 orders of mag-nitude descrepant, we will also consider other possibilitiesfor reconciling these rates.
One possibility, as first suggested byKenyon et al.(1990), is that the infalling envelope material is not trans-
12

ferred to the star via disk accretion in a steady-state fashion.Instead, the accreting envelope mass accumulates in the cir-cumstellar disk until it becomes gravitationally unstable(e.g., Larson, 1984) and then briefly accretes at a prodi-gious rate (∼ 10−5 M⊙/yr; seeCalvet et al., 2000). Thisscenario is consistent with the small population of young,often embedded stars which dramatically increase their lu-minosity for a few years to a few centuries (e.g., FU Ori,Hartmann and Kenyon, 1987; V1647 Ori,Briceno et al.,2004). If Class I stars intermittently accrete at this rate,they must spend 5-10% of their lifetime in the high accre-tion state to achieve typical T Tauri masses within 1 Myr.Statistically, 5-10% of Class I stars should then be accretingat this rate. The sample of Class I stars with mass accretionrates is now becoming large enough to suggest a possi-ble problem with these expected percentages; none appearto accrete at this high of a rate (Section 3.4). However,there is a strong observational bias in that stars accretingatthis rate are likely to be too heavily veiled, at both opticaland infrared wavelengths, to identify photospheric featuresfrom which the amount of excess can be measured. Indeed,several stars observed byWH04andD05 are too veiled tomeasure mass accretion rates. L1551 IRS 5, for example,which is the most luminous Class I star in Tau-Aur, hasbeen proposed to be a young star experiencing an FU Ori-like outburst (Hartmann and Kenyon, 1996;Osorio et al.,2003). Without a more accurate measure of its stellar prop-erties this is difficult to confirm; its larger luminosity couldbe a consequence of it being a somewhat more massive star.
An independent test of the episodic accretion hypoth-esis is the relative masses of Class I disks compared toClass II disks. If the envelope material of Class I stars isaccumulating in their circumstellar disks, they should bemore massive than Class II stars.WH04 investigated thisusing 1.3 mm continuum observations fromBeckwith etal. (1990),Osterloh and Beckwith(1995), andMotte andAndre (2001), and restricted to beam sizes of11 − 12 ′′
to avoid contamination from envelope emission of Class Istars. This comparison showed that the 1.3 mm flux den-sities of Class I and Class II stars in Tau-Aur are indis-tinguishable, implying similar disk masses if the Class Iand Class II disks have similar dust opacity and dust tem-perature (Henning et al., 1995). However,Andrews andWilliams (2005) drew a different conclusion based on sub-millimeter observations at 450µm and 850µm (with beamsizes of 9” and 15”, respectively). They showed that the dis-tribution of sub-millimeter flux densities and disk masses ofClass I stars are statistically different from those of Class IIstars (being more massive), though Class I and Class II sam-ples nevertheless span the same range of disk masses. Un-fortunately biases introduced by stellar mass, multiplicity,envelope emission, and low spatial resolution evolutionarydiagnostics, inhibit robust comparisons of these samples.We conclude there is at most marginal evidence for ClassI stars having more massive disks than Class II stars, aswould be expected if they undergo FU Ori-like outburstsmore often than Class II stars.
Given the overall similarities of Class I and Class II stars,WH04put forth the still controversial suggestion that many(but not all) Class I stars are no longer in the main accre-tion phase and are much older than traditionally assumed;WH04focus their study on Class I stars in Tau-Aur, wherethe case for this is most compelling. This proposal doesnot eliminate the luminosity problem for bona-fide Class Istars, but minimizes the statistical significance of it in gen-eral. Support for this idea originates in the known biasesintroduced by current classification criteria which are inad-equate to unambiguously identify young stars with infallingenvelopes. The two largest biases are the low spatial resolu-tion mid-infrared measurements upon which most SEDs arebased and the effects of an unknown orientation on the SED.These biases likely explain why∼ 42% of stars classified asClass I stars in Tau-Aur do not appear to be bona fide proto-stars (Section 4.2). Indeed, some authors have claimed thatClass I stars like IRAS 04016+2610 and IRAS 04302+2247have morphologies and kinematics that are better describedby a rotating disk-like structure (Hogerheijde and Sandell,2000; Boogert et al., 2002; Wolf, 2003) than a collaps-ing envelope model (Kenyon et al., 1993b;Whitney et al.,1997), though more recent work still favors massive en-velopes (e.g.,Eisner et al., 2005). However, the limitationof all of these models is that they only account for the spa-tial distribution of circumstellar material, which can be con-fused with diffuse cloud emission (Motte and Andre, 2001)or companion stars with∼ 103 AU separations (Haisch etal., 2004;Duchene et al., 2004). A convincing case for amassive infalling envelope can only be established by spa-tially mapping molecular line profiles and accounting forthe effects of outflows and rotations (Evans, 1999). Cur-rently the Class 0 star IRAS 04368+2557 (L1527) is theonly star in Tau-Aur that has been shown to retain a mas-sive extended envelope with unambiguous evidence for in-fall (Gregersen et al., 1997).
In regions outside Tau-Aur, there is less evidence as wellas less motivation for Class I stars being older than pre-sumed and past the main phase of mass accretion. As dis-cussed in Section 3.4, the higher disk accretion rates ofmany Class I stars inρOph, for example, are within a factorof∼ 10 of predicted mass infall rates, and thus easier to rec-oncile given current uncertainties in observations and mod-els assumptions. Additionally, there is less evidence thatthese Class I stars are misclassified Class II stars, comparedwith Tau-Aur Class I stars. However, we strongly cautionthat it is not yet possible to tell if the apparent differencesbetween the Class I population in Tau-Aur and other regionsreflects real differences in their evolutionary state or is sim-ply a consequence of Tau-Aur being a lower density en-vironment and its members being more optically revealed.One important similarity of Class I stars in all star formingregions is their relatively low mass envelopes (e.g.Andreand Montmerle, 1994;Motte and Andre, 2001), suggestingthat at this phase they have already acquired the majority oftheir stellar mass.
If the ages of Class I stars are indeed as old as T Tauri
13

stars (& 1 Myr) as the comparisons tentatively suggest(Section 3.2), there is a potential dynamical timescale prob-lem. In such a case the envelope is surviving nearly a factorof 10 longer than its dynamical collapse timescale, whichseems unlikely. However, it is well known that there isnearly an order of magnitude spread in thedisk dispersaltimescale of Class II stars (e.g.,Hillenbrand et al., 1998);a similar spread in the envelope dispersal timescale seemsplausible. One possibility for generating a large spread inthe envelope dispersal timescale is that in some cases theenvelopes are replenished. Recent simulations of clusterformation (e.g.,Bate et al., 2003) suggest that even afterthe initial phase of mass accretion, a young star continues todynamically interact with the cloud from which it formed,and in some cases even significantly increase its mass. Thussome embedded stars could in fact come from an olderpopulation. These would be difficult to distinguish fromyounger stars in their initial main accretion phase based oncircumstellar properties alone. More accurately determinedage estimates is likely the best way to test this intriguinghypothesis.
Summarizing, we find that in most cases the disk accre-tion rates of Class I stars are well below predicted envelopeinfall rates. In some cases this may be a consequence ofmisclassification. In the more general case, it implies thatif the envelope material is indeed infalling, it is not trans-ferred to the star efficiently (e.g.,Terebey et al., 2006) orat a steady rate (e.g.,Kenyon et al., 1990), or both. Whileit is known that some young stars dramatically increase inbrightness, presumably due to enhanced accretion (e.g., FUOri), the idea that this is process by which stars acquirethe majority of their mass is still unconfirmed. If the agesof some Class I stars are indeed as old as T Tauri stars,the long-lived envelope lifetimes may stem from envelopereplenishment, possibly caused by continued interactionswith the cloud after formation. Overall, it appears that mostof Class I stars, as currently defined, have already acquiredthe majority of their final stellar mass.
5. FUTURE PROSPECTS
The ensemble of newly determined stellar and disk ac-cretion properties of Class I stars offer powerful constraintson how and when young stars (and brown dwarfs) are as-sembled. However, many unknowns still remain. Here wehighlight 7 key areas of research that would help resolvethe remaining uncertainties and advance our understandingof the earliest stages of star formation.More Accurately Determined Circumstellar Properties -Much of the suspected misclassification of Class I starscould be confirmed or refuted with more accurately deter-mined SEDs based on observations over a broad wavelengthrange which spatially resolve features (e.g., edge-on disks)and nearby neighbors. In concert with this, more accurateand less orientation dependent criteria for identifying ClassI stars needs to be established.Extensive Surveys for Class I Stars -Larger, more complete
(and less flux limited) surveys for Class I stars in multi-ple star forming regions will help confirm or refute ten-tative trends identified with the small samples studied sofar, and may likewise reveal real environmental (e.g., turbu-lence, gas temperature) and/or (sub)stellar mass dependen-cies upon the formation process.Improved Models of the Circumstellar Environment -Withlarger, more accurately determined samples of Class I stars,there will be a need for more sophisticated envelope-plus-disk models of embedded stars which can fit the observedSED and scattered light and polarization images (e.g.,Os-orio et al., 2003;Whitney et al., 2005;Eisner et al., 2005;Terebey et al., 2006). This work is important for directlydetermining the density of the envelope material (whichconstrains the mass infall rate), estimating the extinction tothe central star (which is often in error because of scatteredlight), and can potentially determine the system orientation.Detailed Kinematic Mapping -The case for massive in-falling envelopes can be unambiguously resolved using in-terferometric techniques that kinematically map the sur-rounding envelope-like material. In addition, these tech-niques offer the most direct and accurate way to deter-mine the envelope infall rate, which can be compared tothe newly determined disk accretion rates.Improved Models of Disk Accretion -Unfortunately thereremain considerable uncertainties in observationally deter-mining disk accretion rates (e.g. bolometric correction),and these uncertainties are magnified for embedded starswith high extinction and scattered light. Consequently theabsolute value of the disk accretion rates and their agree-ment with infall model predictions are difficult to assess.Observations of emission-line profiles and continuum ex-cess measurements over a broad range of wavelengths arepromising methods to help resolve this. Additionally, ob-servational monitoring to determine the timescale and mag-nitude of variations in the mass accretion rate may yield im-portant constraints on how and how quickly mass is acquireduring this stage.More Sensitive Spectroscopic Surveys -While the recentspectroscopic observations focused upon here have revealedmuch about the pre-T Tauri evolutionary stage, the datasuffer from rather severe observational biases. These in-clude biases in flux, extinction, and mass accretion rate.More sensitive spectrographs and/or larger aperture tele-scopes may be needed to address the first two biases, whilehigher signal-to-noise observations of ”featureless” Class Istars may help reveal their stellar and accretion properties.Specifically, particular attention should be paid to the mostluminous Class I stars in a given region, to establish bet-ter if they are more luminous because they have accretiondominated luminosities, or if they are simply more massivestars (e.g., L1551 IRS 5).Comparisons with Synthetically Generated Spectra -For-tunately in the last decade there has been considerableprogress in the area of synthetically generated spectra ofstars. The implication is that stellar properties (e.g., tem-perature and surface gravity), can be directly extracted from
14

the spectra (e.g.,Johns-Krull et al., 1999, 2004;Doppmannet al., 2003, 2005), as opposed to indirectly determined byhistoric spectral-comparison techniques. The most excitingapplication is the determination of surface gravities, as theinferred stellar radii from these measurements can be usedto establish more precise age estimates, and perhaps unam-biguously determine the age of Class I stars, even if onlyrelative to T Tauri stars.
Acknowledgments.We thank Charles Lada for his sub-stantial contributions to many of the papers which constitutemuch of the work discussed in this chapter. This work waspartially supported by the NASA Origins of Solar Systemsprogram. We have appreciated the privilege to observe onthe revered summit of Mauna Kea.
REFERENCES
Adams F. C., Lada C. J., and Shu F. J. (1987).Astrophys. J., 312,788–806.
Andre P. and Montmerle T. (1994).Astrophys. J., 420, 837–862.Andre P., Ward-Thompson D., and Barsony M. (1993).Astrophys.
J., 406, 122–141.Andrews S. and Williams J. (2005).Astrophys. J., 631, 1134-
1160.Armitage P. J. and Clarke C. J. (1996).Mon. Not. R. Astron. Soc.,
280, 458–468.Baraffe I., Chabrier G., Allard F., and Hauschildt P. H. (1998).
Astron. Astrophys., 337, 403–412.Baraffe I., Chabrier G., Allard F., and Hauschildt P. H. (2002).
Astron. Astrophys., 382, 563–572.Bate M. R., Bonnell I. A., and Volker B. (2003).Mon. Not. R.
Astron. Soc., 339, 577-599Beckwith S. V. W., Sargent A. I., Chini R. S., and Gusten R.
(1990).Astrophys. J., 99, 924–945.Benson P. J. and Myers P. C. (1989).Astrophys. J. Suppl., 71,
89–108.Bontemps S., Andre P., Kaas A. A., Nordh L., Olofsson G., et al.
(2001).Astron. Astrophys., 372, 173–194.Boogert A. C. A., Blake G. A., and Tielens A. G. G. M. (2002).
Astrophys. J., 577, 271–280.Bouvier J., Bertout C., Benz W., and Mayor M. (1986).Astron.
Astrophys., 165, 110–119.Bouvier J., Cabrit S., Fernandez M., Martin E. L., and Matthews
J. M. (1993).Astron. Astrophys., 272, 176–206.Bouvier J., Covino E., Kovo O., Martin E. L., Matthews J. M., et
al. (1995).Astron. Astrophys., 299, 89–107.Briceno C., Vivas A., Hernandez J., Calvet N., Hartmann L.et al.
(2004).Astrophys. J., 606, L123–126.Brown D. W. and Chandler C. J. (1999).Mon. Not. R. Astron.
Soc., 303, 855–863.Calvet N. and Hartmann L. (1992).Astrophys. J., 386, 239–247.Calvet N., Hartmann L., and Strom S. E. (1997).Astrophys. J.,
481, 912–917.Calvet N., Hartmann L., and Strom S. E. (2000). InProtostars and
Planets IV(V. Mannings et al., eds.), pp. 377–399. Univ. ofArizona, Tucson.
Casali M. M. and Eiroa C. (1996).Astron. Astrophys., 306, 427–435.
Casali M. M. and Matthews H. E. (1992).Mon. Not. R. Astron.Soc., 258, 399–403.
Cassen P. and Moosman A. (1981).Icarus, 48, 353–376.Chiang E. I. and Goldreich P. (1999).Astrophys. J., 519, 279–284.Cieza, L. A., Kessler-Silacci, J. E., Jaffe, D. T., Harvey P.M., and
Evans N. J. II (2005).Astrophys. J., 635, 422–441.Clarke C. J. and Bouvier J. (2000).Mon. Not. R. Astron. Soc.,
319, 457–466.Cohen M. and Schwartz R. D. (1983).Astrophys. J., 265, 877–
900.Collier Cameron A. and Campbell C. G. (1993).Astron. Astro-
phys., 274, 309–318.Covey K. R., Greene T. P., Doppmann G. W., and Lada C. J.
(2005).Astron. J., 129, 2765–2776.D’Antona F. and Mazzitelli I. (1997).Mem. Soc. Astron. Ital., 68,
807–822.Doppmann G. W., Jaffe D. T., and White R. J. (2003).Astron. J.,
126, 3043–3057.Doppmann G. W., Greene T. P., Covey K. R., and Lada C. J.
(2005).Astron. J., 130, 1145–1170.Duchene G., Bouvier J., Bontemps S., Andre P., and Motte F.
(2004).Astron. Astrophys., 427, 651–665.Edwards S., Strom S., Hartigan P., Strom K., Hillenbrand L.,et al.
(1993).Astron. J., 106, 372–382.Eisner J. A., Hillenbrand L. A., Carpenter J. M., and Wolf S.
(2005).Astrophys. J., 635, 396–421.Evans N. J. (1999).Ann. Rev. Astron. Astrophys., 37, 311-362.Folha D. F. M. and Emerson J. P. (1999).Astron. Astrophys., 352,
517–531.Goodwin S. P., Whitworth A. P., and Ward-Thompson D. (2004).
Astron. Astrophys., 423, 169–182Graham J. A. (1991).Publ. Astron. Soc. Pac., 103, 79–84.Greene T. P. and Lada C. J. (1996).Astron. J., 112, 2184–2221.Greene T. P. and Lada C. J. (1997).Astron. J., 114, 2157–2165.Greene T. P. and Lada C. J. (2000).Astron. J., 120, 430–436.Greene T. P. and Lada C. J. (2002).Astron. J., 124, 2185–2193.Gregersen E. M., Evans N. J., Zhou S., and Choi M. (1997).As-
trophys. J., 484, 256–276.Gullbring E., Hartmann L., Briceno C., Calvet N. (1998).Astro-
phys. J., 492, 323–341.Haisch K. E. Jr., Greene T. P., Barsony M., and Stahler S. W.
(2004).Astrophys. J., 1271747–1754.Hartigan P., Edwards S., and Ghandour L. (1995).Astrophys. J.,
452, 736-768.Hartmann L. (1998). Accretion Processes in Star Formation,
(Cambridge: Cambridge Univ. Press), chap. 4.Hartmann L., and Kenyon S. J. (1987).Astrophys. J., 312, 243–
253.Hartmann L., and Kenyon S. J. (1996).Ann. Rev. Astron. Astro-
phys., 34, 207–240.Hartmann L., Hewett R., Stahler S., and Mathieu R. D. (1986).
Astrophys. J., 309, 275–293.Hartmann L., Hewett R. and Calvet N. (1994).Astrophys. J., 426,
669–687.Henning T., Begemann B., Mutschke H., and Dorshner J. (1995).
Astron. Astrophys. Suppl., 112, 143Hillenbrand L. A., Strom S. E., Calvet N., Merrill K. M., Gatley,
I. et al. (1998).Astron. J., 116, 1816–1841.Hogerheijde M. R. and Sandell G. (2000).Astrophys. J., 534,
880–893.Ishii M., Tamura M., and Itoh, Y. (2004).Astrophys. J., 612, 956–
965
15

Johns-Krull C. M., Valenti J. A., and Koresko C. (1999).Astro-phys. J., 516, 900–915.
Johns-Krull C. M., Valenti J. A., and Gafford A. D. (2003).Rev.Mex. Astron. Astrofys., 18, 38–44.
Johns-Krull C. M., Valenti J. A., and Saar S. H. (2004).Astrophys.J., 617, 1204–1215.
Kaas A. A., Olofsson G., Bontemps S., Andre P., Nordh L., et al.(2004).Astron. Astrophys., 421, 623–642.
Kenyon S. J., Calvet N., and Hartmann L. (1993a).Astrophys. J.,414, 676–694.
Kenyon S. J., Whitney B. A., Gomez M., and Hartmann L.(1993b).Astrophys. J., 414, 773-792.
Kenyon S. J., Gomez M., Marzke R. O., and Hartmann L. (1994).Astron. J., 108, 251–261.
Kenyon S. J. and Hartmann L. (1995).Astrophys. J. Suppl., 101,117–171.
Kenyon S. J., Hartmann L. W., Strom K. M., and Strom S. E.(1990).Astron. J., 99, 869–887.
Kenyon S. J., Brown D. I., Tout C. A., and Berlind P. (1998).As-tron. J., 115, 2491–2503.
Kessler-Silacci J. E., Hillenbrand L. A., Blake G. A., and MeyerM. R. (2005).Astrophys. J., 622, 404–429
Kleinmann S. G. and Hall D. N. B. (1986).Astrophys. J. Suppl.,62, 501–517.
Konigl A. (1991).Astrophys. J., 370, L39–43.Lada C. J. (1987). InIAU Symp. 115: Star Forming Regions(M.
Peimbert and J. Jugaku, eds.), pp. 1–18., D. Reidel PublishingCo., Dordrecht.
Lada C. J. and Wilking, B. A (1984).Astrophys. J., 287, 610–621.Ladd E. F., Lada E. A., and Myers P. C. (1993).Astrophys. J.,
410, 168–178.Larson R. B. (1984).Mon. Not. R. Astron. Soc., 206, 197–207.Luhman K. L. and Rieke G. H. (1999).Astrophys. J., 525, 440–
465.Mac Low M. and Klessen R. S. (2004).Rev. Mod. Phys., 76,
125–194.Matt S. and Pudritz R. (2005).Astrophys. J., 632, L135–138.Motte F. and Andre P. (2001).Astron. Astrophys., 365, 440–464.Mundt R., Stocke J., Strom S. E., Strom K. M., and Anderson E.
R. (1985).Astrophys. J., 297, L41–45.Muzerolle J., Calvet N., and Hartmann L. (1998).Astrophys. J.,
492, 743–753.Muzerolle J., Hartmann L., and Calvet N. (1998).Astron. J., 116,
455–468.Muzerolle J., Hartmann L., and Calvet N. (1998).Astron. J., 116,
2965–2974.Muzerolle J., Calvet N., and Hartmann L. (2001).Astrophys. J.,
550, 944-961.Muzerolle J., D’Alessio P., Calvet N., and Hartmann L. (2004).
Astrophys. J., 617, 406.Myers P. C. and Benson P. (1983).Astrophys. J., 266, 309–320.Myers P. C. and Ladd E. F. (1993).Astrophys. J., 413, L47–50.Myers P. C., Fuller G. A., Mathieu R. D., Beichman C. A., Benson
P. J., et al. (1987).Astrophys. J., 319, 340–357.Najita J. (2004). inStar Formation in the Interstellar Medium:
In Honor of David Hollenbach, Chris McKee and Frank Shu(Johnstone D., Adams F. C., Lin D. N. C., Neufeld D. A., andOstriker E. C., eds.) pp. 271–277. ASP, Provo.
Nisini B., Antoniucci S., Giannini T., and Lorenzetti D. (2005).Astron. Astrophys., 429, 543–557.
Onishi R., Mizuno A., Kawamura A., Tachihara K., and Fukui Y.(2002).Astrophys. J, 575, 950–973
Osorio M., D’Alessio P., Muzerolle J., Calvet N., and HartmannL. (2003). /it Astrophys. J., 586, 1148–1161.
Osterloh M. and Beckwith S. V. W. (1995).Astrophys. J., 439,288–302.
Padgett D. L., Brandner W., Stapelfeldt K. R., Strom S. E., Tere-bey S., et al. (1999).Astron. J., 117, 1490–1504.
Park S. and Kenyon S. J. (2002).Astron. J., 123, 3370–3379.Prusti T., Whittet D. C. B., and Wesselius P. R. (1992).Mon. Not.
R. Astron. Soc., 254, 361–368.Rebull L. M., Wolff S. C., Strom S. E., and Makidon R. B. (2002).
Astron. J., 124, 546–559.Rebull L. M., Wolff S. C., and Strom S. E. (2004).Astron. J., 127,
1029–1051.Rhode K. L., Herbst W., and Mathieu R. D (2001).Astron. J., 122,
3258–3279.Safier P. N. (1998).Astrophys. J., 494, 336–341.Shu F. H. (1977).Astrophys. J., 214, 488–497.Shu F., Najita J., Ostriker E., Wilkin F., Ruden S., et al. (1994).
Astrophys. J., 429, 781–796.Siess L., Forestini M., and Bertout C. (1999).Astron. Astrophys.,
342, 480–491.Sonnhalter C., Preibisch T., and Yorke H. W. (1995).Astron. As-
trophys., 299, 545–556.Stassun K. G., Mathieu R. D., Mazeh T., and Vrba F. (1999).As-
tron. J., 117, 2941–2979.Stassun K., Mathieu R., Vrba J., Mazeh T., and Henden A. (2001).
Astron. J., 121, 1003–1012.Terebey S., Shu F. H., and Cassen P. (1984).Astrophys. J., 286,
529–551.Terebey S., Van Buren D., and Hancock T. (2006).Astrophys. J.,
637, 811–822Tout C. A., Livio M., and Bonnell I. A. (1999).Mon. Not. R.
Astron. Soc., 310, 360–376.Wallace L. and Hinkle K. (1996).Astrophys. J. Suppl., 107, 312–
390.Werner, M. W., Roellig T. L., Low F. J., Rieke G. H., Rieke M., et
al. (2004).Astrophys. J. Suppl., 154, 154–162.White R. J. and Basri G. (2003).Astrophys. J., 582, 1109–1122.White R. J. and Hillenbrand L. A. (2004).Astrophys. J., 616,
998–1032.Whitney B. A., Kenyon S. J., and Gomez M. (1997).Astrophys.
J., 485, 703–734.Whitney B. A., Wood K., Bjorkman J. E., and Cohen M. (2003).
Astrophys. J., 598, 1079–1099.Whitney B. A., Indeebetouw R., Bjorkman J. E., and Wood K.
(2004).Astrophys. J., 617, 1177-1190.Whitney B. A., Robitaille T. P., Wood K., Denzmore P. and Bjork-
man J. E. (2005) inPPV Poster Proceedingshttp://www.lpi.usra.edu/meetings/ppv2005/pdf/8460.pdf
Wilking B. A., Lada C. J., and Young E. T. (1989).Astrophys. J.,340, 823–852.
Wilking b. A., Greene T. P., Lada C. J., Meyer M. R., and YoungE. T. (1992).Astrophys. J., 397, 520-533
Wolf S., Padgett D. L., and Stapelfeldt K. R. (2003).Astrophys.J., 588, 373–386.
Yorke H. W., Bodenheimer P., and Laughlin G. (1993).Astrophys.J., 411, 274–284.
Young C. H., Shirley Y. L., Evans N. J., and Rawlings J. M. C.(2003).Astrophys. J. Suppl., 145, 111–145.
16