Stefan Burschka Tranalyzer Feel the packets, be the packets.
44
Stefan Burschka Tranalyzer Feel the packets, be the packets
-
Upload
edmund-matthews -
Category
Documents
-
view
265 -
download
1
Transcript of Stefan Burschka Tranalyzer Feel the packets, be the packets.
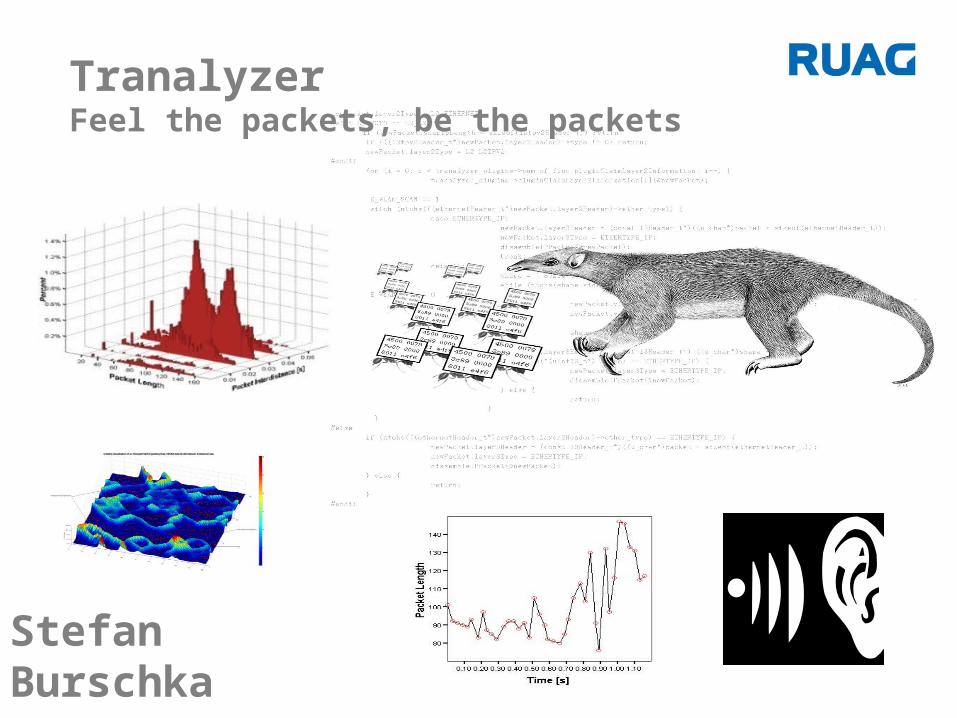
Stefan Burschka
TranalyzerFeel the packets, be the packets
2
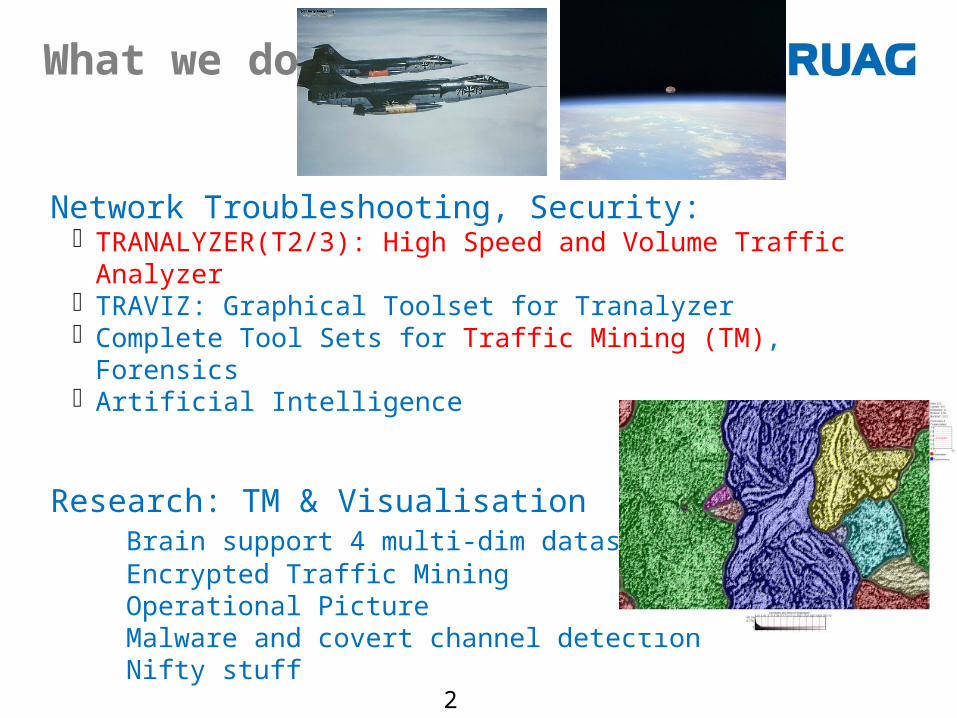
Network Troubleshooting, Security:
l TRANALYZER(T2/3): High Speed and Volume Traffic Analyzerl TRAVIZ: Graphical Toolset for Tranalyzerl Complete Tool Sets for Traffic Mining (TM), Forensicsl Artificial Intelligence
Research: TM & VisualisationBrain support 4 multi-dim datasetsEncrypted Traffic MiningOperational PictureMalware and covert channel detectionNifty stuff
What we do:
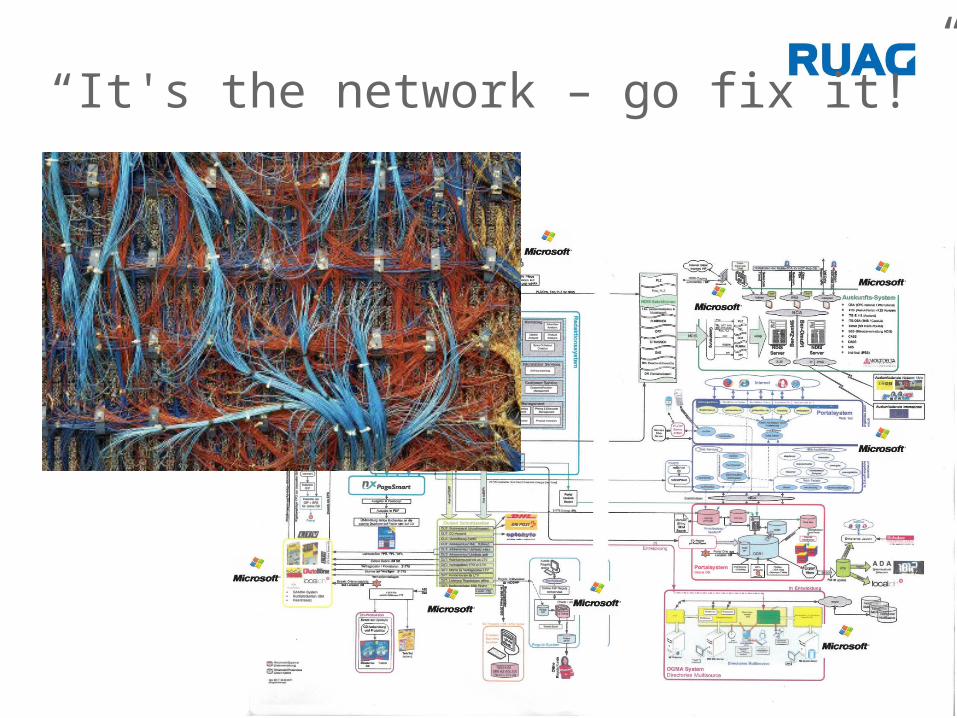
“It's the network – go fix it!”
l3
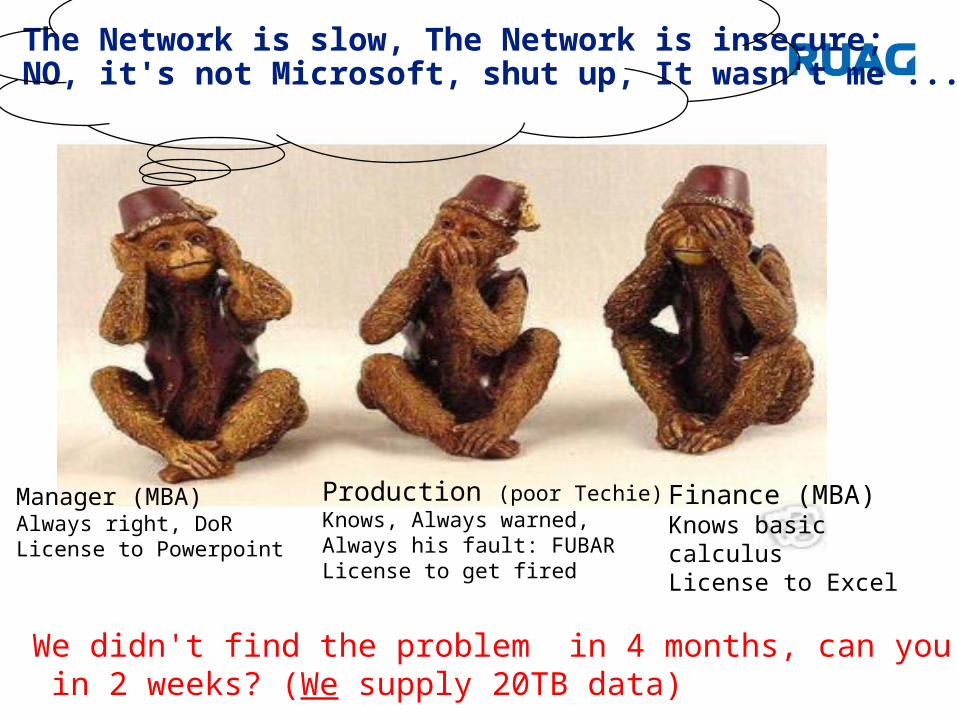
The Network is slow, The Network is insecure; NO, it's not Microsoft, shut up, It wasn't me ...
We didn't find the problem in 4 months, can you do the job in 2 weeks? (We supply 20TB data)
Manager (MBA)Always right, DoR License to Powerpoint
Production (poor Techie)Knows, Always warned, Always his fault: FUBARLicense to get fired
Finance (MBA)Knows basic calculusLicense to Excel
Troubleshooting, SecurityTraffic Mining: Change your perspective
5
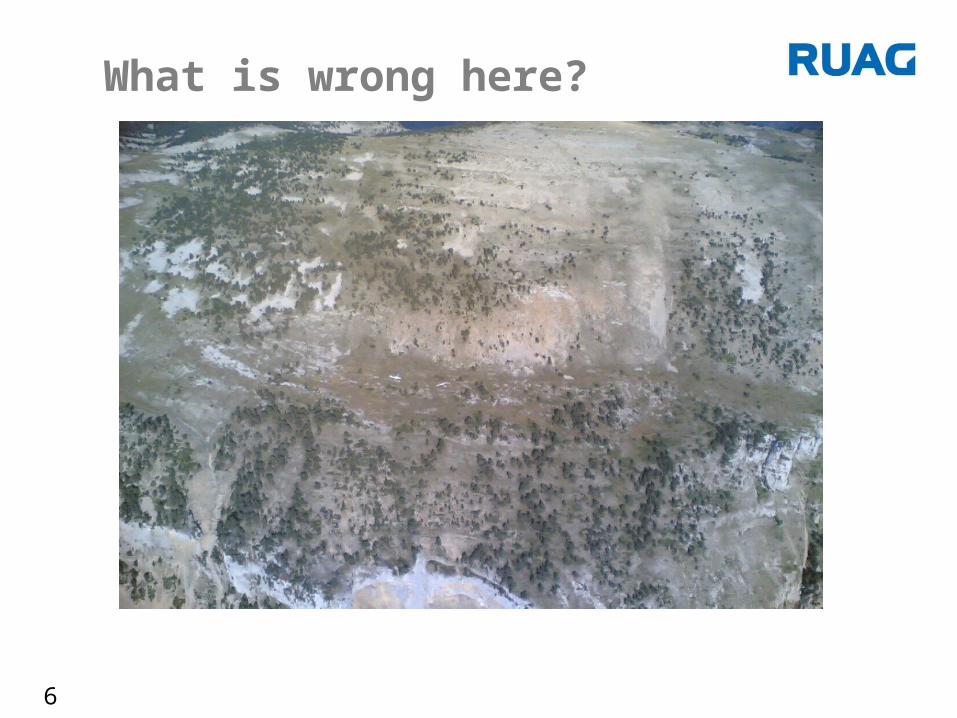
What is wrong here?
6
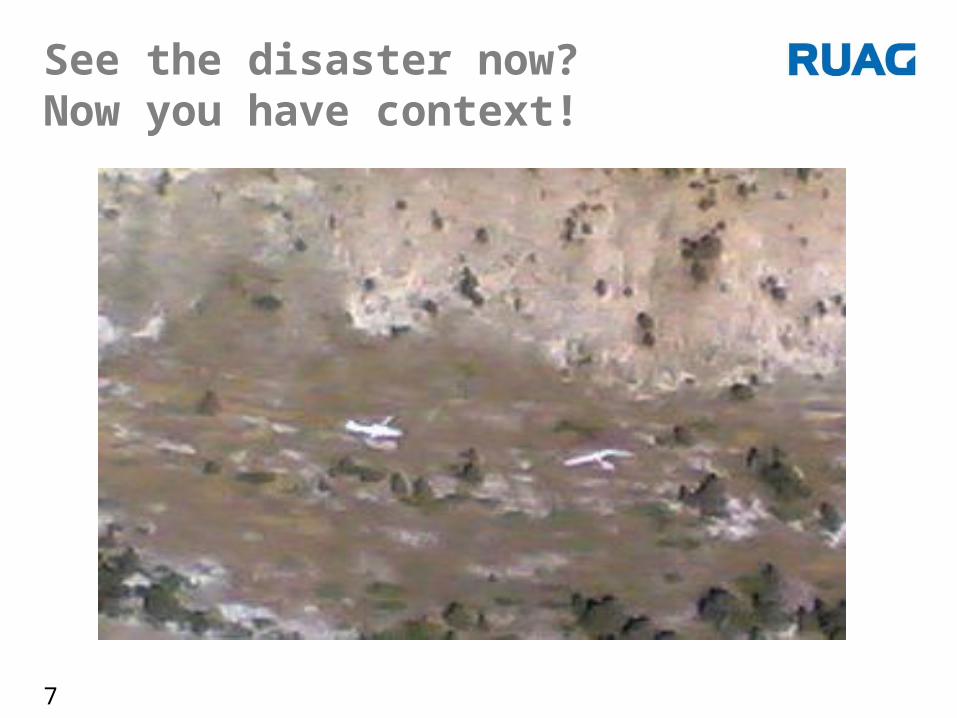
See the disaster now? Now you have context!
7
8
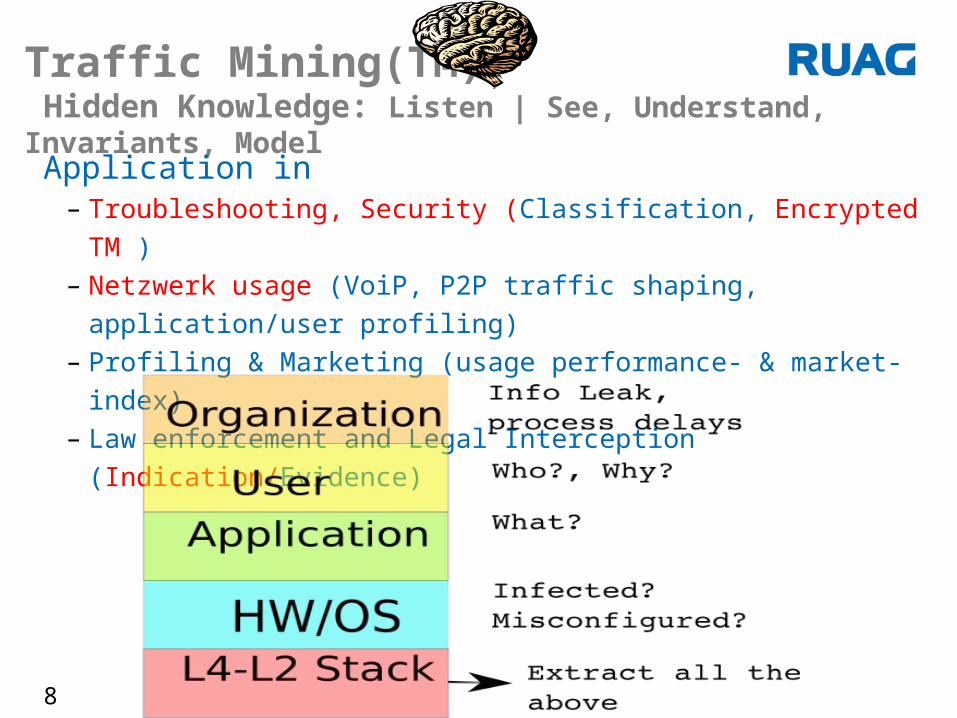
Traffic Mining(TM): Hidden Knowledge: Listen | See, Understand, Invariants, Model
Application in– Troubleshooting, Security (Classification, Encrypted TM )– Netzwerk usage (VoiP, P2P traffic shaping, application/user profiling)– Profiling & Marketing (usage performance- & market- index)– Law enforcement and Legal Interception (Indication/Evidence)
9
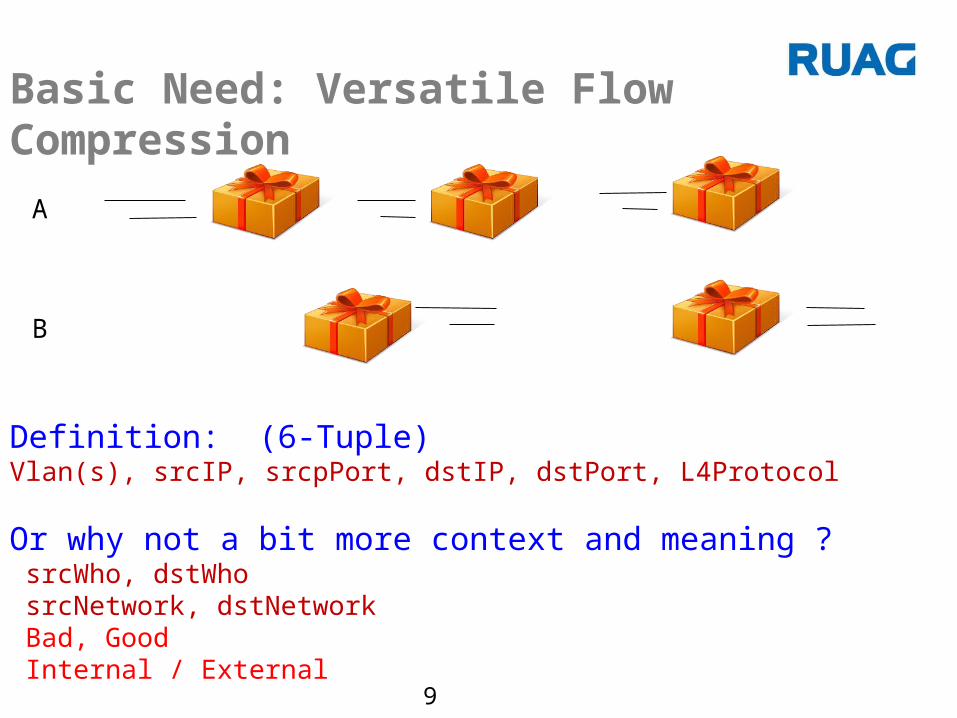
Basic Need: Versatile Flow Compression
A
B
Definition: (6-Tuple)Vlan(s), srcIP, srcpPort, dstIP, dstPort, L4Protocol
Or why not a bit more context and meaning ? srcWho, dstWho srcNetwork, dstNetwork Bad, Good Internal / External

Netflow (Sometimes not so loud, comes with routers)Pro: Good hands-on tool, flow statistics, header parameters, standard
Cons: Not all statistics we need, no developer support
GigaStor (Horrible loud and exceptional expensive HW)
Pro: heuristic expert system, Graphics, reports, whatever is in the DB
Cons: What we needed is not in the DB, no developer support
DPI (Elacoya, Sandvine,..) (Terrible loud and expensive HW) Pro: good protocol resolution, nice reports
Cons: Its a DPI not a verstile flow engine with developer support
Closed source loud Tools
10
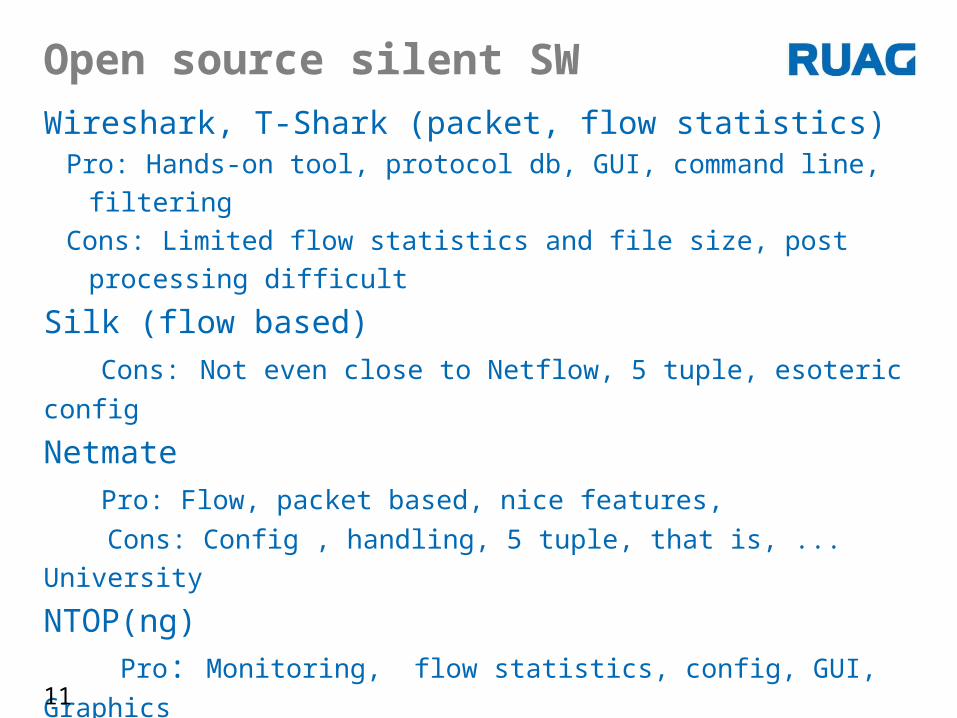
Wireshark, T-Shark (packet, flow statistics)Pro: Hands-on tool, protocol db, GUI, command line, filtering
Cons: Limited flow statistics and file size, post processing difficult
Silk (flow based)
Cons: Not even close to Netflow, 5 tuple, esoteric config
Netmate
Pro: Flow, packet based, nice features,
Cons: Config , handling, 5 tuple, that is, ... University
NTOP(ng)
Pro: Monitoring, flow statistics, config, GUI, Graphics
Cons: not really flow based as we need it, protocol encapsulation?
IDS (SNORT, BRO)
Pro: Alarming, regex, flexible
Cons: Alarming, no Flows, BRO: memory leaks, university stuff
Open source silent SW
11

2006: Somebody has to develop me !!
Need an Allrounder, script friendly between Wireshark, Netflow and
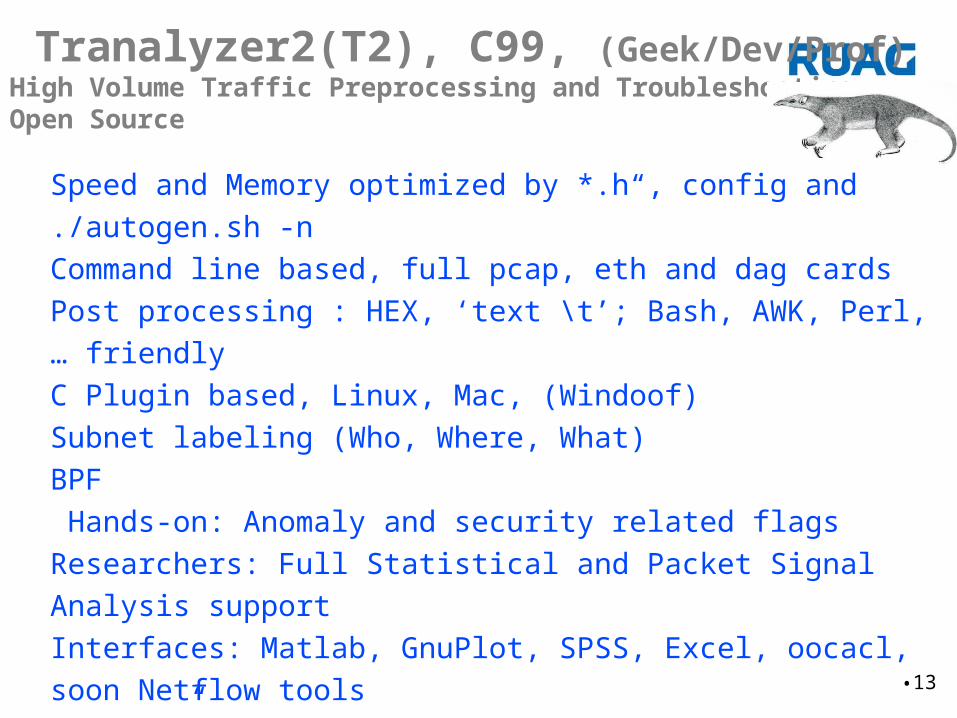
Speed and Memory optimized by *.h“, config and ./autogen.sh -n
Command line based, full pcap, eth and dag cards
Post processing : HEX, ‘text \t’; Bash, AWK, Perl, … friendly
C Plugin based, Linux, Mac, (Windoof)
Subnet labeling (Who, Where, What)
BPF
Hands-on: Anomaly and security related flags
Researchers: Full Statistical and Packet Signal Analysis support
Interfaces: Matlab, GnuPlot, SPSS, Excel, oocacl, soon Netflow tools
The “-s” option: The command line AWK, Perl friendly packet mode
GUI: Traviz (http://sourceforge.net/projects/traviz)
Easy to use but, You have to know your shit•
Tranalyzer2(T2), C99, (Geek/Dev/Prof)High Volume Traffic Preprocessing and TroubleshootingOpen Source
•13
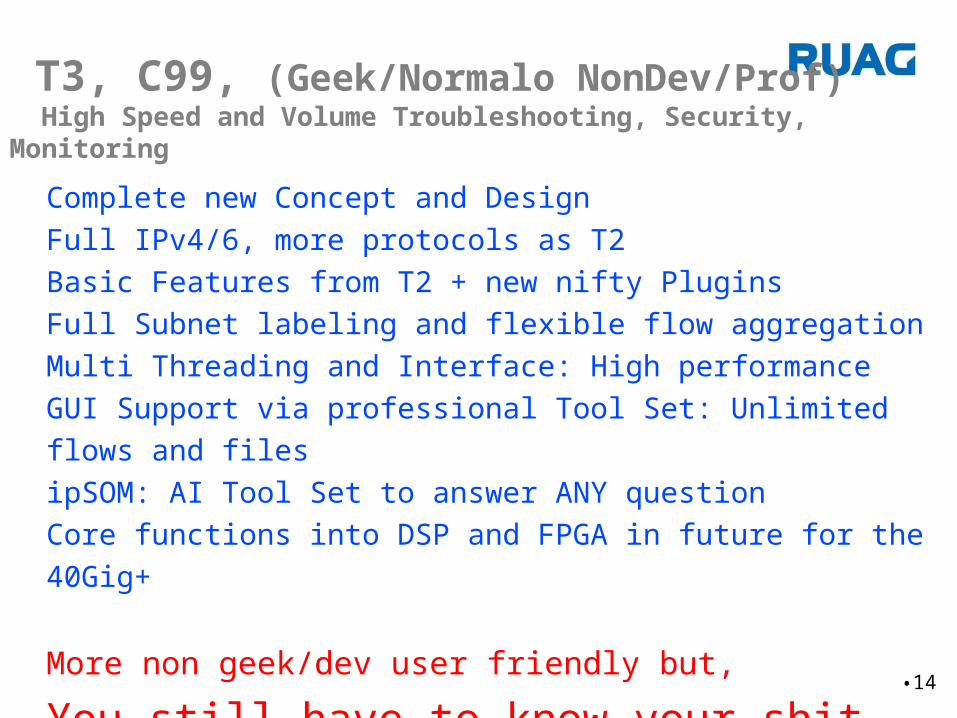
Complete new Concept and Design
Full IPv4/6, more protocols as T2
Basic Features from T2 + new nifty Plugins
Full Subnet labeling and flexible flow aggregation
Multi Threading and Interface: High performance
GUI Support via professional Tool Set: Unlimited flows and files
ipSOM: AI Tool Set to answer ANY question
Core functions into DSP and FPGA in future for the 40Gig+
More non geek/dev user friendly but,
You still have to know your shit
T3, C99, (Geek/Normalo NonDev/Prof) High Speed and Volume Troubleshooting, Security, Monitoring
•14
•15
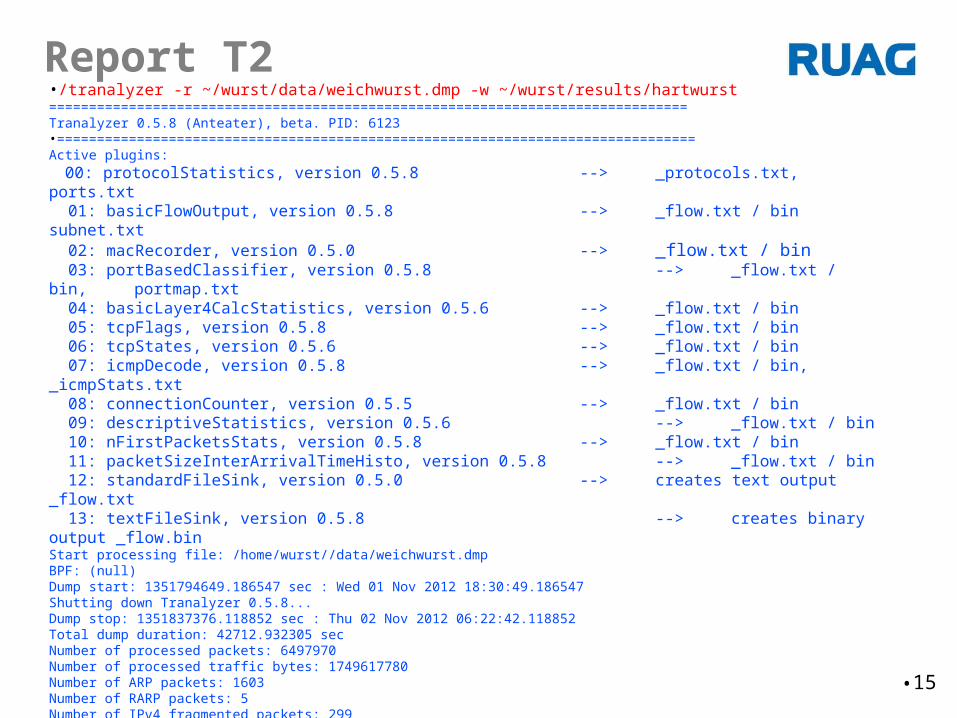
Report T2•/tranalyzer -r ~/wurst/data/weichwurst.dmp -w ~/wurst/results/hartwurst================================================================================Tranalyzer 0.5.8 (Anteater), beta. PID: 6123•================================================================================Active plugins:
00: protocolStatistics, version 0.5.8 --> _protocols.txt, ports.txt 01: basicFlowOutput, version 0.5.8 --> _flow.txt / bin subnet.txt 02: macRecorder, version 0.5.0 --> _flow.txt / bin 03: portBasedClassifier, version 0.5.8 --> _flow.txt / bin, portmap.txt 04: basicLayer4CalcStatistics, version 0.5.6 --> _flow.txt / bin 05: tcpFlags, version 0.5.8 --> _flow.txt / bin 06: tcpStates, version 0.5.6 --> _flow.txt / bin 07: icmpDecode, version 0.5.8 --> _flow.txt / bin, _icmpStats.txt 08: connectionCounter, version 0.5.5 --> _flow.txt / bin 09: descriptiveStatistics, version 0.5.6 --> _flow.txt / bin 10: nFirstPacketsStats, version 0.5.8 --> _flow.txt / bin 11: packetSizeInterArrivalTimeHisto, version 0.5.8 --> _flow.txt / bin 12: standardFileSink, version 0.5.0 --> creates text output _flow.txt 13: textFileSink, version 0.5.8 --> creates binary output _flow.binStart processing file: /home/wurst//data/weichwurst.dmpBPF: (null)Dump start: 1351794649.186547 sec : Wed 01 Nov 2012 18:30:49.186547Shutting down Tranalyzer 0.5.8...Dump stop: 1351837376.118852 sec : Thu 02 Nov 2012 06:22:42.118852Total dump duration: 42712.932305 secNumber of processed packets: 6497970Number of processed traffic bytes: 1749617780Number of ARP packets: 1603Number of RARP packets: 5Number of IPv4 fragmented packets: 299Number of IPv6 packets: 0Number of IPv4 flows: 3395325
Average snapped Bandwidth: 327.634 KBit/sAverage full IP Bandwidth: 326.386 Kbit/sWarning: IPv4 Fragmentation header packet missing
T2 Protocol File
•16
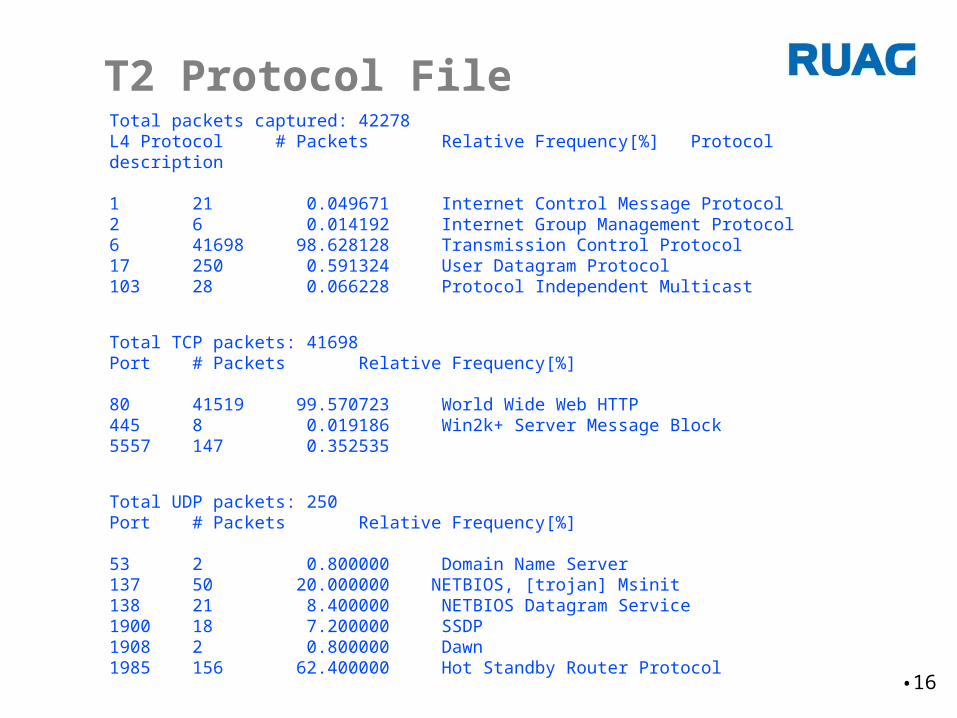
Total packets captured: 42278L4 Protocol # Packets Relative Frequency[%] Protocol description
1 21 0.049671 Internet Control Message Protocol 2 6 0.014192 Internet Group Management Protocol 6 41698 98.628128 Transmission Control Protocol 17 250 0.591324 User Datagram Protocol103 28 0.066228 Protocol Independent Multicast
Total TCP packets: 41698Port # Packets Relative Frequency[%]
80 41519 99.570723 World Wide Web HTTP 445 8 0.019186 Win2k+ Server Message Block 5557 147 0.352535
Total UDP packets: 250Port # Packets Relative Frequency[%]
53 2 0.800000 Domain Name Server 137 50 20.000000 NETBIOS, [trojan] Msinit 138 21 8.400000 NETBIOS Datagram Service 1900 18 7.200000 SSDP 1908 2 0.800000 Dawn 1985 156 62.400000 Hot Standby Router Protocol
T2 ICMP Stats File
•17
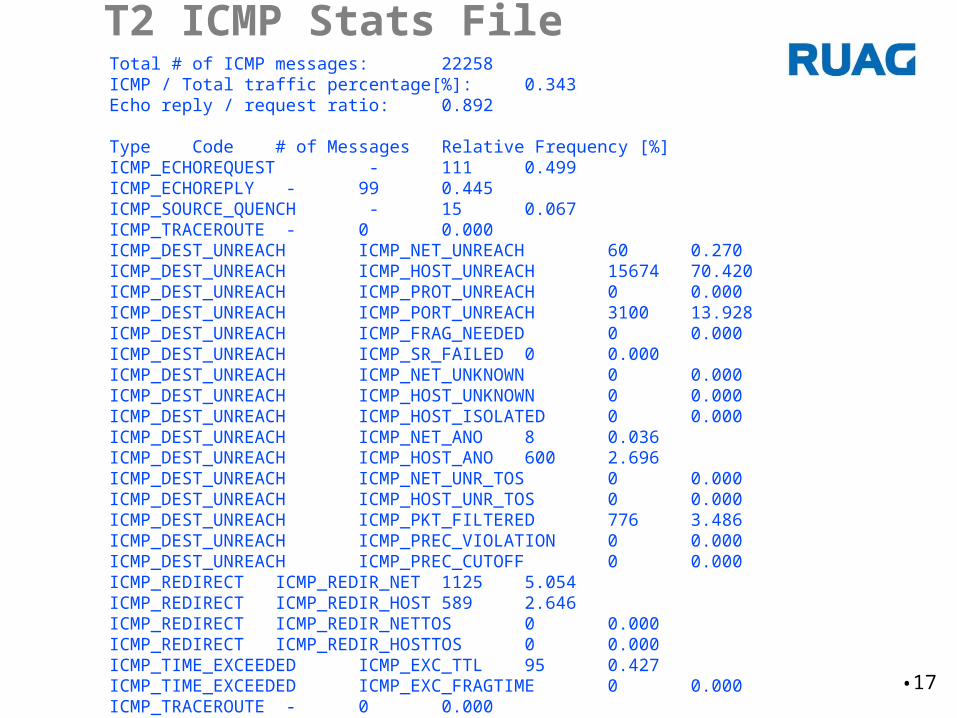
Total # of ICMP messages: 22258ICMP / Total traffic percentage[%]: 0.343Echo reply / request ratio: 0.892
Type Code # of Messages Relative Frequency [%]ICMP_ECHOREQUEST - 111 0.499ICMP_ECHOREPLY - 99 0.445ICMP_SOURCE_QUENCH - 15 0.067ICMP_TRACEROUTE - 0 0.000ICMP_DEST_UNREACH ICMP_NET_UNREACH 60 0.270ICMP_DEST_UNREACH ICMP_HOST_UNREACH 15674 70.420ICMP_DEST_UNREACH ICMP_PROT_UNREACH 0 0.000ICMP_DEST_UNREACH ICMP_PORT_UNREACH 3100 13.928ICMP_DEST_UNREACH ICMP_FRAG_NEEDED 0 0.000ICMP_DEST_UNREACH ICMP_SR_FAILED 0 0.000ICMP_DEST_UNREACH ICMP_NET_UNKNOWN 0 0.000ICMP_DEST_UNREACH ICMP_HOST_UNKNOWN 0 0.000ICMP_DEST_UNREACH ICMP_HOST_ISOLATED 0 0.000ICMP_DEST_UNREACH ICMP_NET_ANO 8 0.036ICMP_DEST_UNREACH ICMP_HOST_ANO 600 2.696ICMP_DEST_UNREACH ICMP_NET_UNR_TOS 0 0.000ICMP_DEST_UNREACH ICMP_HOST_UNR_TOS 0 0.000ICMP_DEST_UNREACH ICMP_PKT_FILTERED 776 3.486ICMP_DEST_UNREACH ICMP_PREC_VIOLATION 0 0.000ICMP_DEST_UNREACH ICMP_PREC_CUTOFF 0 0.000ICMP_REDIRECT ICMP_REDIR_NET 1125 5.054ICMP_REDIRECT ICMP_REDIR_HOST 589 2.646ICMP_REDIRECT ICMP_REDIR_NETTOS 0 0.000ICMP_REDIRECT ICMP_REDIR_HOSTTOS 0 0.000ICMP_TIME_EXCEEDED ICMP_EXC_TTL 95 0.427ICMP_TIME_EXCEEDED ICMP_EXC_FRAGTIME 0 0.000ICMP_TRACEROUTE - 0 0.000
•18
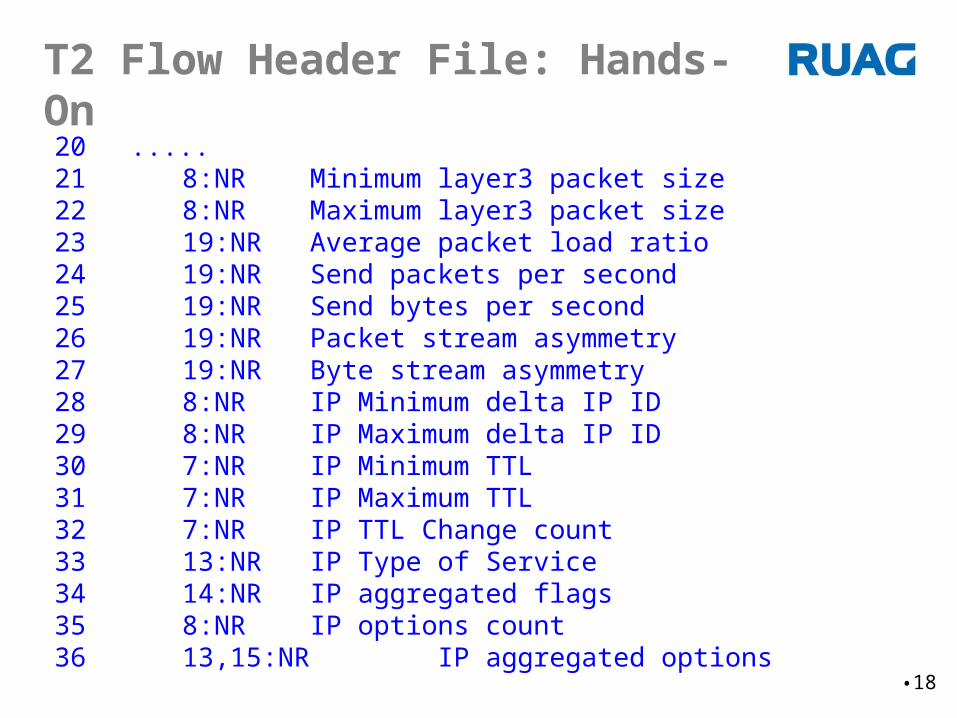
T2 Flow Header File: Hands-On
20 .....21 8:NR Minimum layer3 packet size22 8:NR Maximum layer3 packet size23 19:NR Average packet load ratio24 19:NR Send packets per second25 19:NR Send bytes per second26 19:NR Packet stream asymmetry27 19:NR Byte stream asymmetry28 8:NR IP Minimum delta IP ID29 8:NR IP Maximum delta IP ID30 7:NR IP Minimum TTL31 7:NR IP Maximum TTL32 7:NR IP TTL Change count33 13:NR IP Type of Service34 14:NR IP aggregated flags35 8:NR IP options count36 13,15:NR IP aggregated options
•19
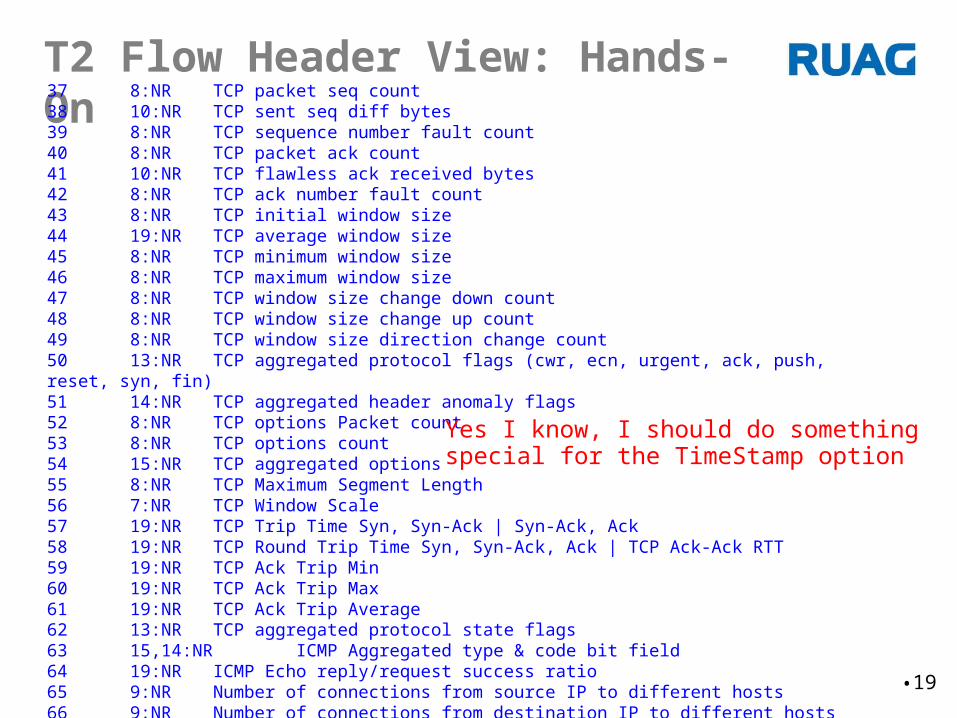
T2 Flow Header View: Hands-On37 8:NR TCP packet seq count38 10:NR TCP sent seq diff bytes39 8:NR TCP sequence number fault count40 8:NR TCP packet ack count41 10:NR TCP flawless ack received bytes42 8:NR TCP ack number fault count43 8:NR TCP initial window size44 19:NR TCP average window size45 8:NR TCP minimum window size46 8:NR TCP maximum window size47 8:NR TCP window size change down count48 8:NR TCP window size change up count49 8:NR TCP window size direction change count50 13:NR TCP aggregated protocol flags (cwr, ecn, urgent, ack, push, reset, syn, fin)51 14:NR TCP aggregated header anomaly flags52 8:NR TCP options Packet count53 8:NR TCP options count54 15:NR TCP aggregated options55 8:NR TCP Maximum Segment Length56 7:NR TCP Window Scale57 19:NR TCP Trip Time Syn, Syn-Ack | Syn-Ack, Ack58 19:NR TCP Round Trip Time Syn, Syn-Ack, Ack | TCP Ack-Ack RTT59 19:NR TCP Ack Trip Min60 19:NR TCP Ack Trip Max61 19:NR TCP Ack Trip Average62 13:NR TCP aggregated protocol state flags63 15,14:NR ICMP Aggregated type & code bit field64 19:NR ICMP Echo reply/request success ratio65 9:NR Number of connections from source IP to different hosts66 9:NR Number of connections from destination IP to different hosts67 9:NR Number of connections between source IP and destination IP
Yes I know, I should do something special for the TimeStamp option
•20
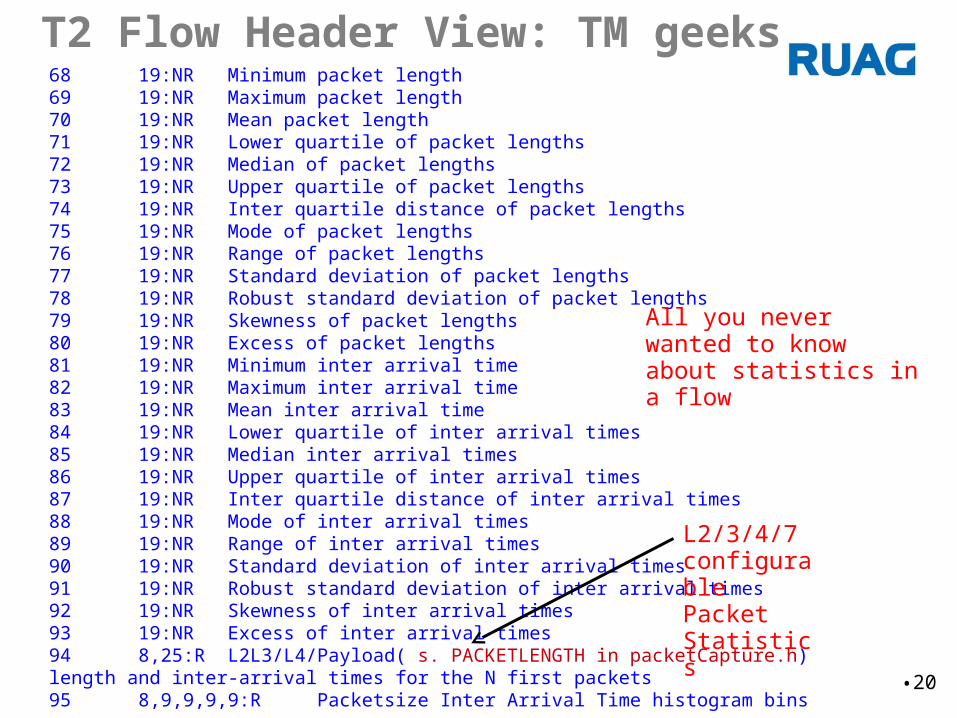
T2 Flow Header View: TM geeks68 19:NR Minimum packet length69 19:NR Maximum packet length70 19:NR Mean packet length71 19:NR Lower quartile of packet lengths72 19:NR Median of packet lengths73 19:NR Upper quartile of packet lengths74 19:NR Inter quartile distance of packet lengths75 19:NR Mode of packet lengths76 19:NR Range of packet lengths77 19:NR Standard deviation of packet lengths78 19:NR Robust standard deviation of packet lengths79 19:NR Skewness of packet lengths80 19:NR Excess of packet lengths81 19:NR Minimum inter arrival time82 19:NR Maximum inter arrival time83 19:NR Mean inter arrival time84 19:NR Lower quartile of inter arrival times85 19:NR Median inter arrival times86 19:NR Upper quartile of inter arrival times87 19:NR Inter quartile distance of inter arrival times88 19:NR Mode of inter arrival times89 19:NR Range of inter arrival times90 19:NR Standard deviation of inter arrival times91 19:NR Robust standard deviation of inter arrival times92 19:NR Skewness of inter arrival times93 19:NR Excess of inter arrival times94 8,25:R L2L3/L4/Payload( s. PACKETLENGTH in packetCapture.h) length and inter-arrival times for the N first packets95 8,9,9,9,9:R Packetsize Inter Arrival Time histogram bins
All you never wanted to know about statistics in a flow
L2/3/4/7 configurable Packet Statistics

HOW TO find the needle in the flow stack?Have a break have aHEX & ¦ scripting!
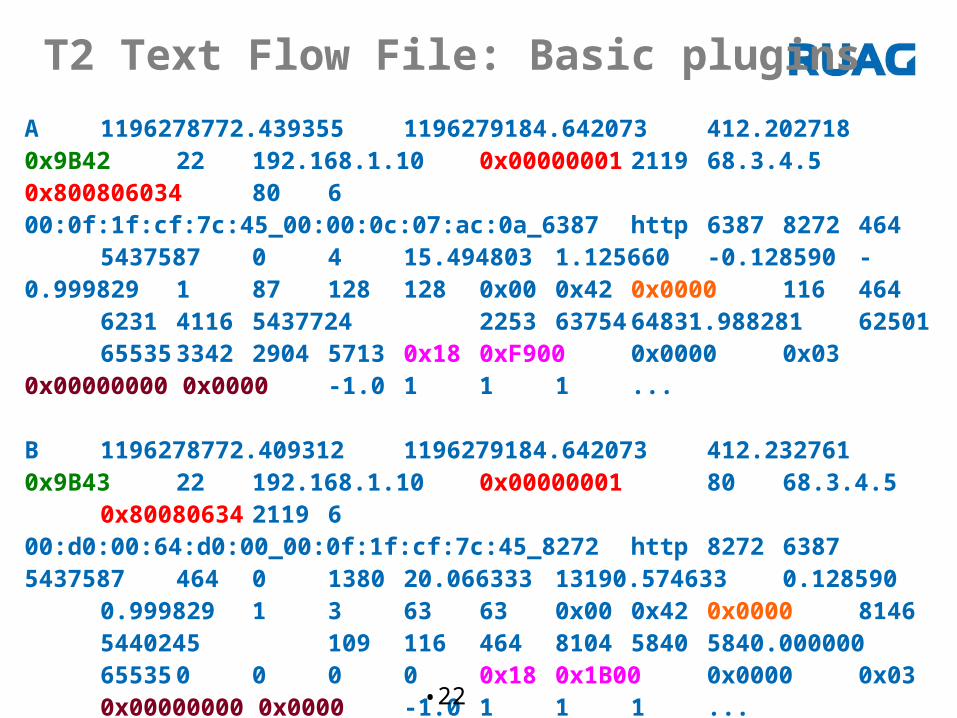
A 1196278772.439355 1196279184.642073 412.202718 0x9B42 22192.168.1.10 0x00000001 2119 68.3.4.5 0x800806034 80 600:0f:1f:cf:7c:45_00:00:0c:07:ac:0a_6387 http 6387 8272 4645437587 0 4 15.494803 1.125660 -0.128590 -
0.999829 1 87 128 128 0x00 0x42 0x0000 116 4646231 4116 5437724 2253 63754 64831.988281 6250165535 3342 2904 5713 0x18 0xF900 0x0000 0x03
0x00000000 0x0000 -1.0 1 1 1 ...
B 1196278772.409312 1196279184.642073 412.232761 0x9B43 22192.168.1.10 0x00000001 80 68.3.4.5 0x80080634 2119 600:d0:00:64:d0:00_00:0f:1f:cf:7c:45_8272 http 8272 6387
5437587 464 0 1380 20.066333 13190.574633 0.1285900.999829 1 3 63 63 0x00 0x42 0x0000 81465440245 109 116 464 8104 5840 5840.000000 655350 0 0 0 0x18 0x1B00 0x0000 0x03
0x00000000 0x0000 -1.0 1 1 1 ...
T2 Text Flow File: Basic plugins
•22
•23
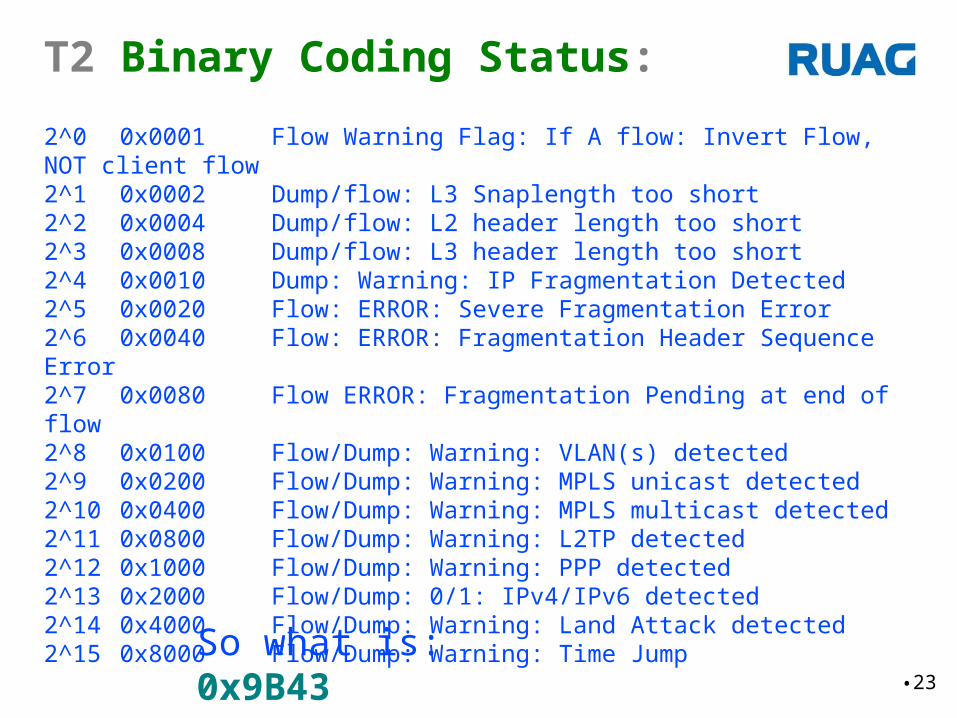
T2 Binary Coding Status:
2^0 0x0001 Flow Warning Flag: If A flow: Invert Flow, NOT client flow 2^1 0x0002 Dump/flow: L3 Snaplength too short 2^2 0x0004 Dump/flow: L2 header length too short2^3 0x0008 Dump/flow: L3 header length too short2^4 0x0010 Dump: Warning: IP Fragmentation Detected2^5 0x0020 Flow: ERROR: Severe Fragmentation Error2^6 0x0040 Flow: ERROR: Fragmentation Header Sequence Error2^7 0x0080 Flow ERROR: Fragmentation Pending at end of flow2^8 0x0100 Flow/Dump: Warning: VLAN(s) detected2^9 0x0200 Flow/Dump: Warning: MPLS unicast detected2^10 0x0400 Flow/Dump: Warning: MPLS multicast detected2^11 0x0800 Flow/Dump: Warning: L2TP detected2^12 0x1000 Flow/Dump: Warning: PPP detected2^13 0x2000 Flow/Dump: 0/1: IPv4/IPv6 detected2^14 0x4000 Flow/Dump: Warning: Land Attack detected2^15 0x8000 Flow/Dump: Warning: Time Jump
So what is: 0x9B43
•24
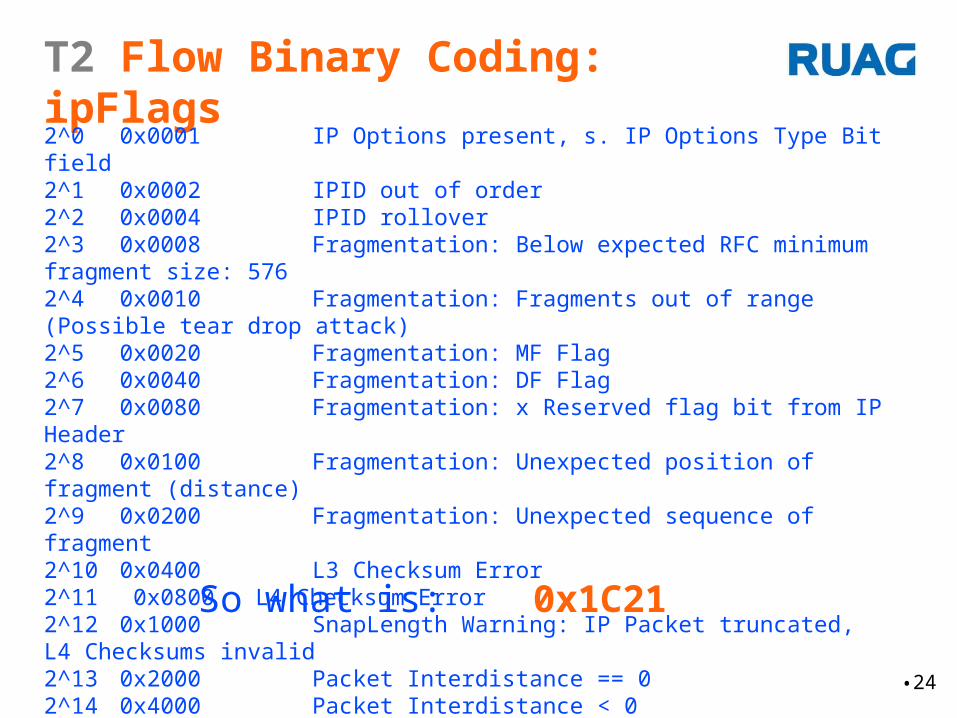
T2 Flow Binary Coding: ipFlags
2^0 0x0001 IP Options present, s. IP Options Type Bit field2^1 0x0002 IPID out of order2^2 0x0004 IPID rollover2^3 0x0008 Fragmentation: Below expected RFC minimum fragment size: 5762^4 0x0010 Fragmentation: Fragments out of range (Possible tear drop attack)2^5 0x0020 Fragmentation: MF Flag2^6 0x0040 Fragmentation: DF Flag2^7 0x0080 Fragmentation: x Reserved flag bit from IP Header2^8 0x0100 Fragmentation: Unexpected position of fragment (distance)2^9 0x0200 Fragmentation: Unexpected sequence of fragment2^10 0x0400 L3 Checksum Error2^11 0x0800 L4 Checksum Error2^12 0x1000 SnapLength Warning: IP Packet truncated, L4 Checksums invalid2^13 0x2000 Packet Interdistance == 02^14 0x4000 Packet Interdistance < 02^15 0x8000 Internal State Bit for Interdistance assessment
So what is: 0x1C21
•25
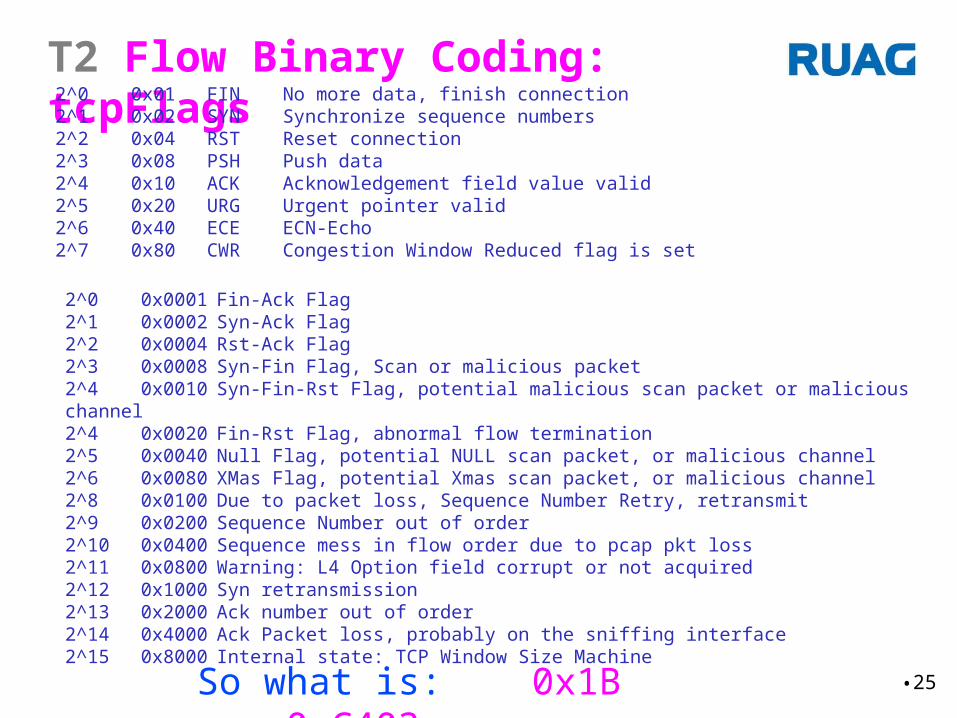
T2 Flow Binary Coding: tcpFlags
2^0 0x0001 Fin-Ack Flag2^1 0x0002 Syn-Ack Flag2^2 0x0004 Rst-Ack Flag2^3 0x0008 Syn-Fin Flag, Scan or malicious packet2^4 0x0010 Syn-Fin-Rst Flag, potential malicious scan packet or malicious channel2^4 0x0020 Fin-Rst Flag, abnormal flow termination2^5 0x0040 Null Flag, potential NULL scan packet, or malicious channel2^6 0x0080 XMas Flag, potential Xmas scan packet, or malicious channel2^8 0x0100 Due to packet loss, Sequence Number Retry, retransmit2^9 0x0200 Sequence Number out of order2^10 0x0400 Sequence mess in flow order due to pcap pkt loss2^11 0x0800 Warning: L4 Option field corrupt or not acquired2^12 0x1000 Syn retransmission2^13 0x2000 Ack number out of order2^14 0x4000 Ack Packet loss, probably on the sniffing interface2^15 0x8000 Internal state: TCP Window Size Machine
So what is: 0x1B 0xC403
2^0 0x01 FIN No more data, finish connection2^1 0x02 SYN Synchronize sequence numbers2^2 0x04 RST Reset connection2^3 0x08 PSH Push data2^4 0x10 ACK Acknowledgement field value valid2^5 0x20 URG Urgent pointer valid2^6 0x40 ECE ECN-Echo2^7 0x80 CWR Congestion Window Reduced flag is set
•26
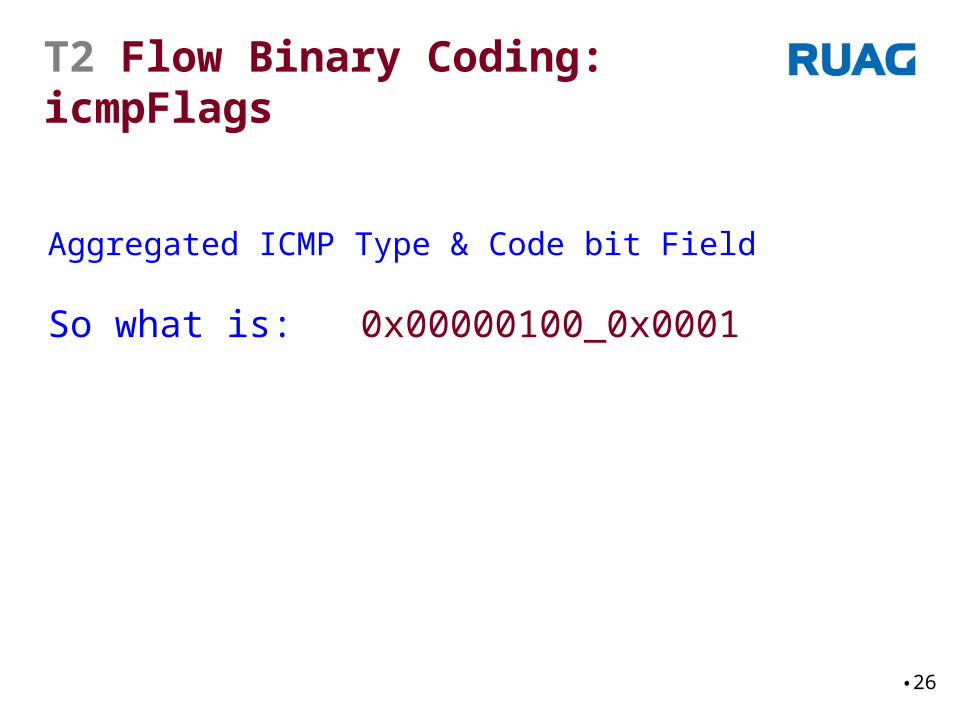
T2 Flow Binary Coding: icmpFlags
Aggregated ICMP Type & Code bit Field
So what is: 0x00000100_0x0001
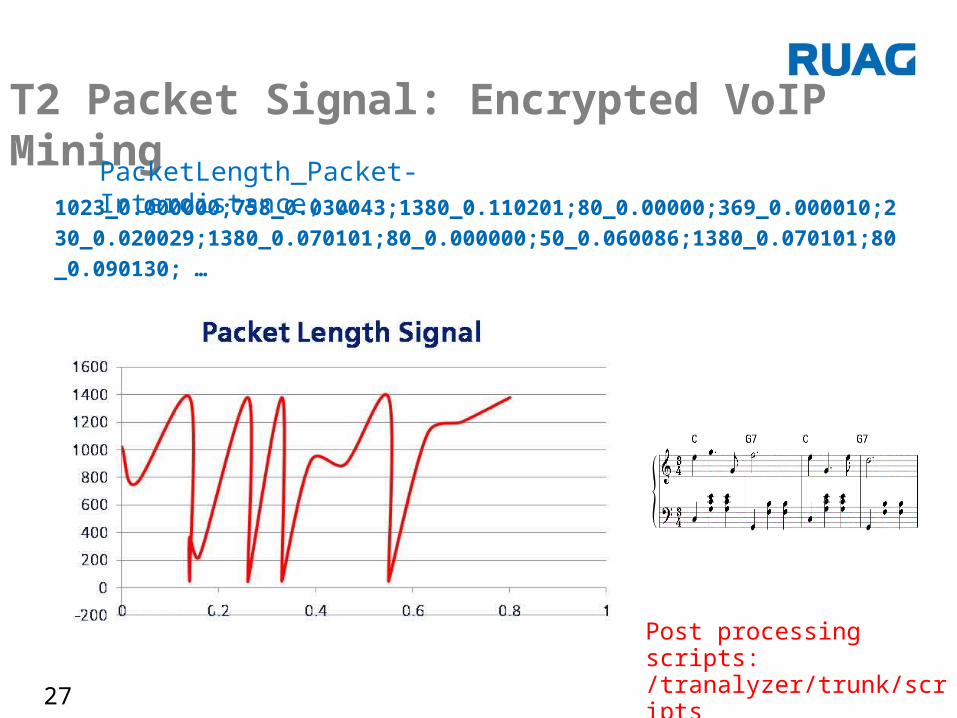
1023_0.000000;758_0.030043;1380_0.110201;80_0.00000;369_0.000010;230_0.02002
9;1380_0.070101;80_0.000000;50_0.060086;1380_0.070101;80_0.090130; …
T2 Packet Signal: Encrypted VoIP Mining
27time
Packet Length
PacketLength_Packet-Interdistance; …
Post processing scripts: /tranalyzer/trunk/scripts
•28
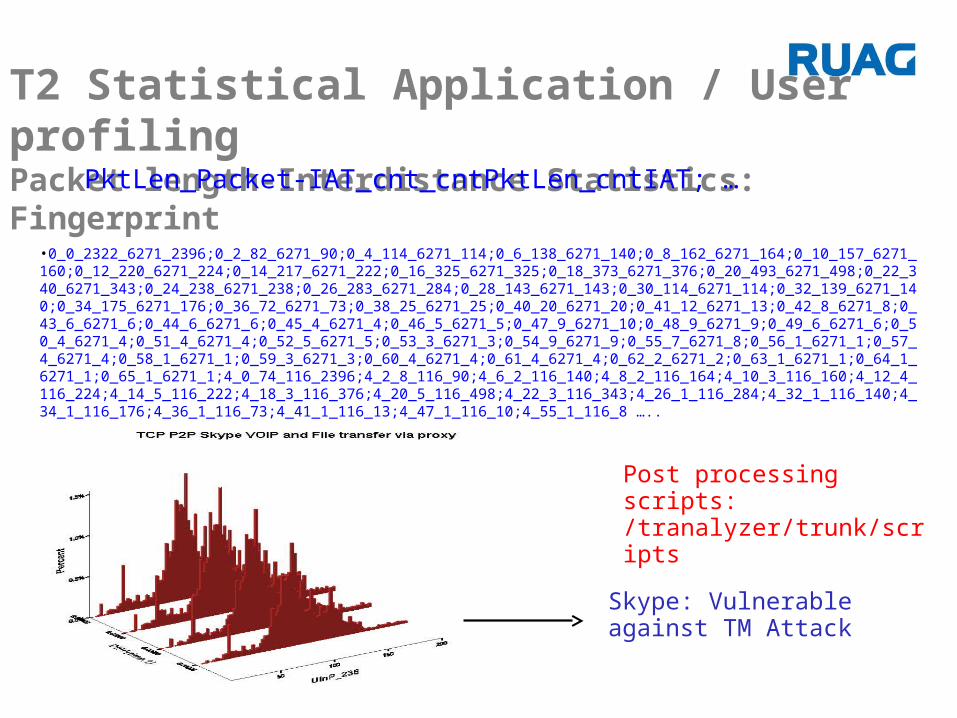
T2 Statistical Application / User profilingPacket length-Interdistance Statistics: Fingerprint
•0_0_2322_6271_2396;0_2_82_6271_90;0_4_114_6271_114;0_6_138_6271_140;0_8_162_6271_164;0_10_157_6271_160;0_12_220_6271_224;0_14_217_6271_222;0_16_325_6271_325;0_18_373_6271_376;0_20_493_6271_498;0_22_340_6271_343;0_24_238_6271_238;0_26_283_6271_284;0_28_143_6271_143;0_30_114_6271_114;0_32_139_6271_140;0_34_175_6271_176;0_36_72_6271_73;0_38_25_6271_25;0_40_20_6271_20;0_41_12_6271_13;0_42_8_6271_8;0_43_6_6271_6;0_44_6_6271_6;0_45_4_6271_4;0_46_5_6271_5;0_47_9_6271_10;0_48_9_6271_9;0_49_6_6271_6;0_50_4_6271_4;0_51_4_6271_4;0_52_5_6271_5;0_53_3_6271_3;0_54_9_6271_9;0_55_7_6271_8;0_56_1_6271_1;0_57_4_6271_4;0_58_1_6271_1;0_59_3_6271_3;0_60_4_6271_4;0_61_4_6271_4;0_62_2_6271_2;0_63_1_6271_1;0_64_1_6271_1;0_65_1_6271_1;4_0_74_116_2396;4_2_8_116_90;4_6_2_116_140;4_8_2_116_164;4_10_3_116_160;4_12_4_116_224;4_14_5_116_222;4_18_3_116_376;4_20_5_116_498;4_22_3_116_343;4_26_1_116_284;4_32_1_116_140;4_34_1_116_176;4_36_1_116_73;4_41_1_116_13;4_47_1_116_10;4_55_1_116_8 …..
PktLen_Packet-IAT_cnt_cntPktLen_cntIAT; …
Post processing scripts: /tranalyzer/trunk/scripts
Skype: Vulnerable against TM Attack
•29
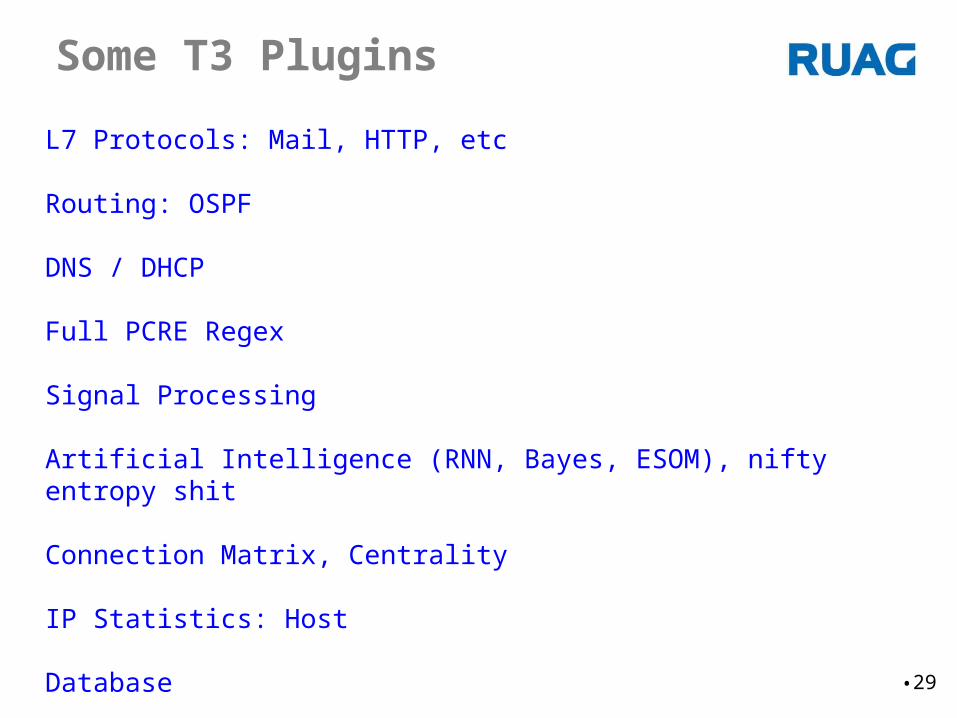
Some T3 Plugins
L7 Protocols: Mail, HTTP, etc
Routing: OSPF
DNS / DHCP
Full PCRE Regex
Signal Processing
Artificial Intelligence (RNN, Bayes, ESOM), nifty entropy shit
Connection Matrix, Centrality
IP Statistics: Host
Database

So what?Some Examples
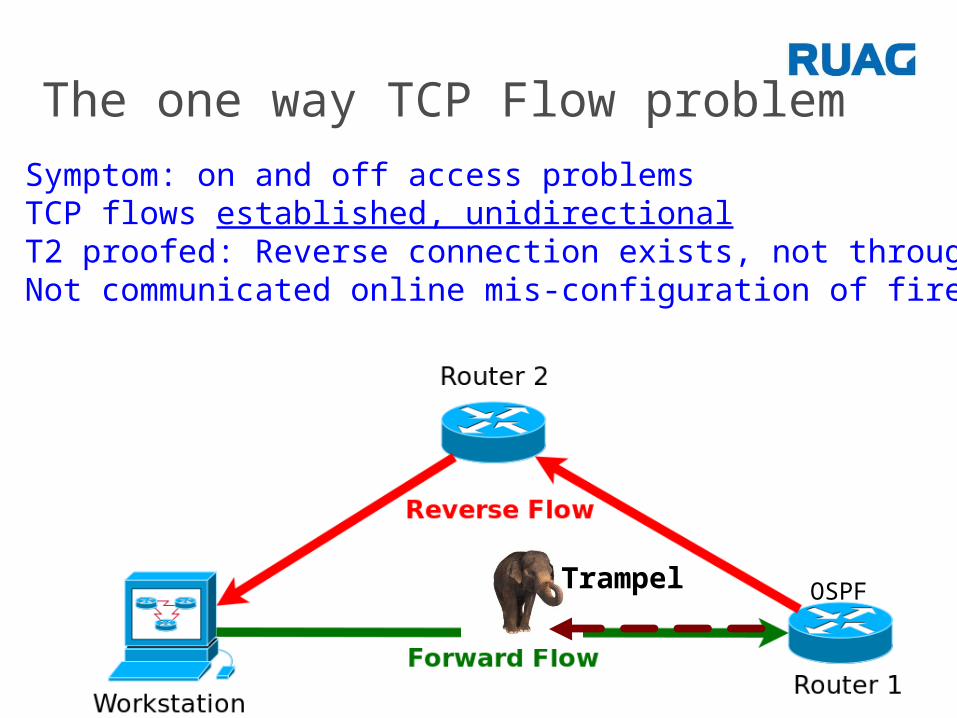
The one way TCP Flow problem
Symptom: on and off access problems TCP flows established, unidirectionalT2 proofed: Reverse connection exists, not through firewallNot communicated online mis-configuration of firewall
OSPFTrampel
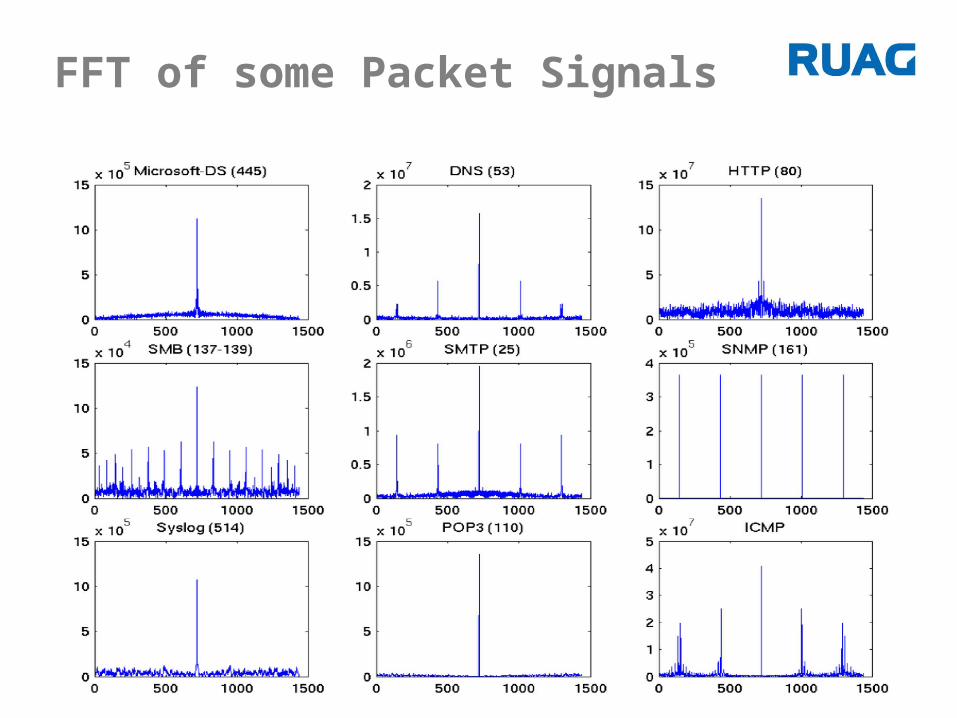
FFT of some Packet Signals
•32
•time
•P
acket Length
33
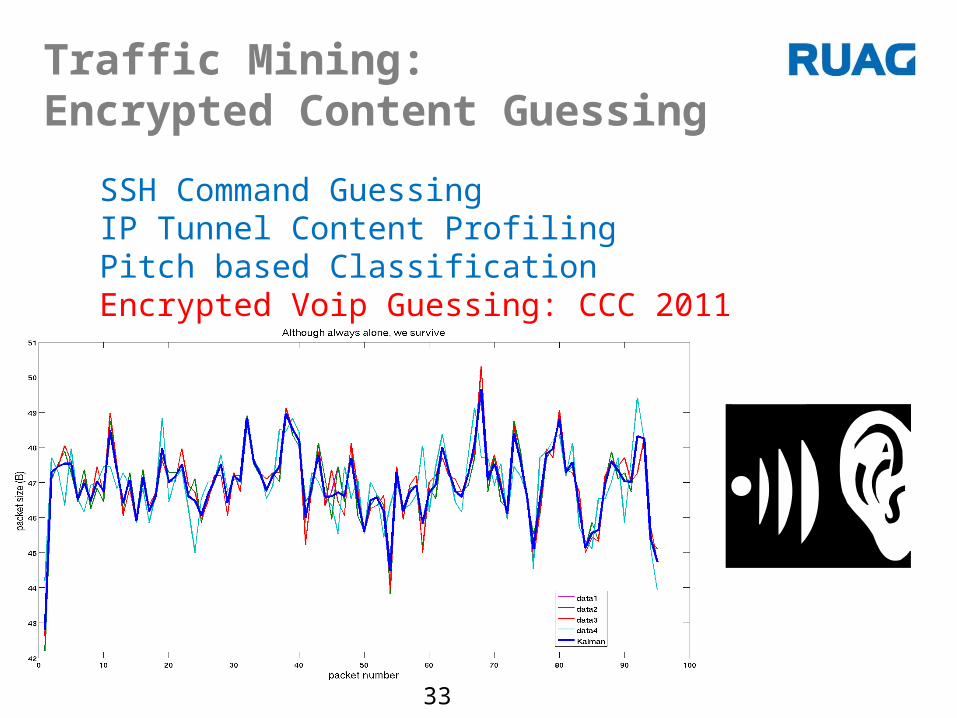
Traffic Mining:Encrypted Content Guessing
SSH Command GuessingIP Tunnel Content ProfilingPitch based ClassificationEncrypted Voip Guessing: CCC 2011
34
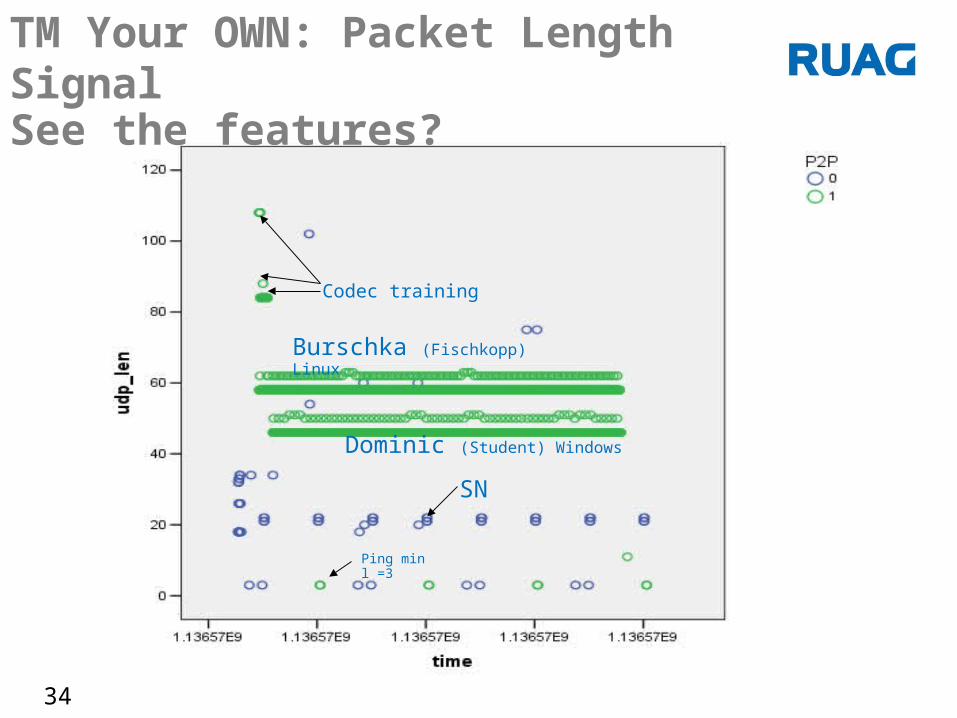
Burschka (Fischkopp) Linux
Dominic (Student) Windows
Codec training
Ping min l =3
SN
TM Your OWN: Packet Length SignalSee the features?
•35
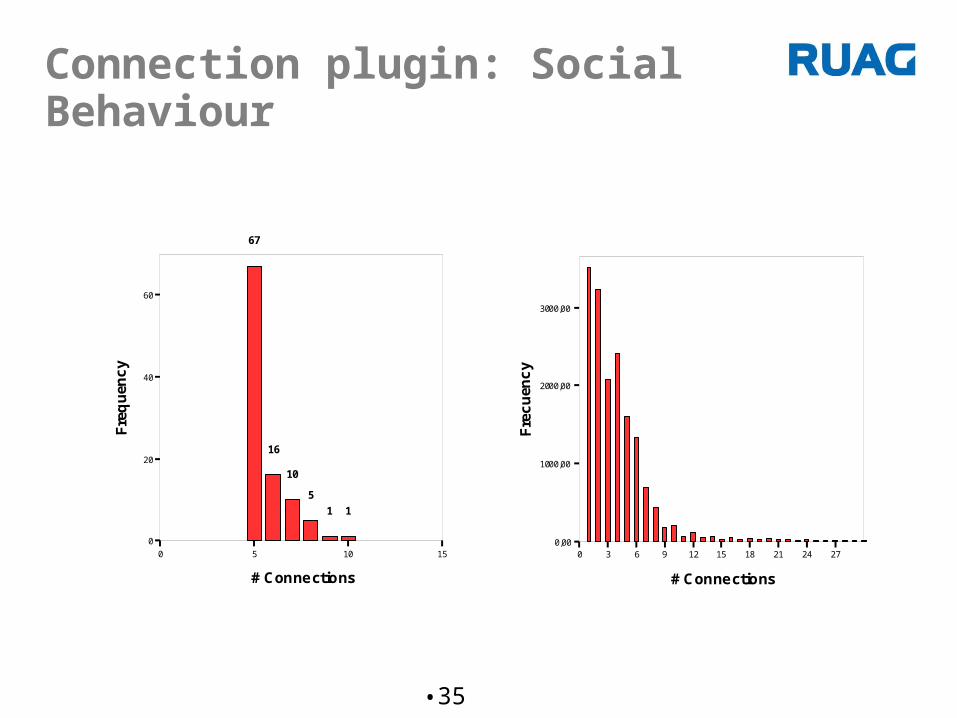
Connection plugin: Social Behaviour
0 5 10 15
# Connections
0
20
40
60
Fre
qu
enc
y
67
16
10
5
1 1
0 3 6 9 12 15 18 21 24 27
# Connections
0,00
1000,00
2000,00
3000,00
Fre
cu
enc
y
•36
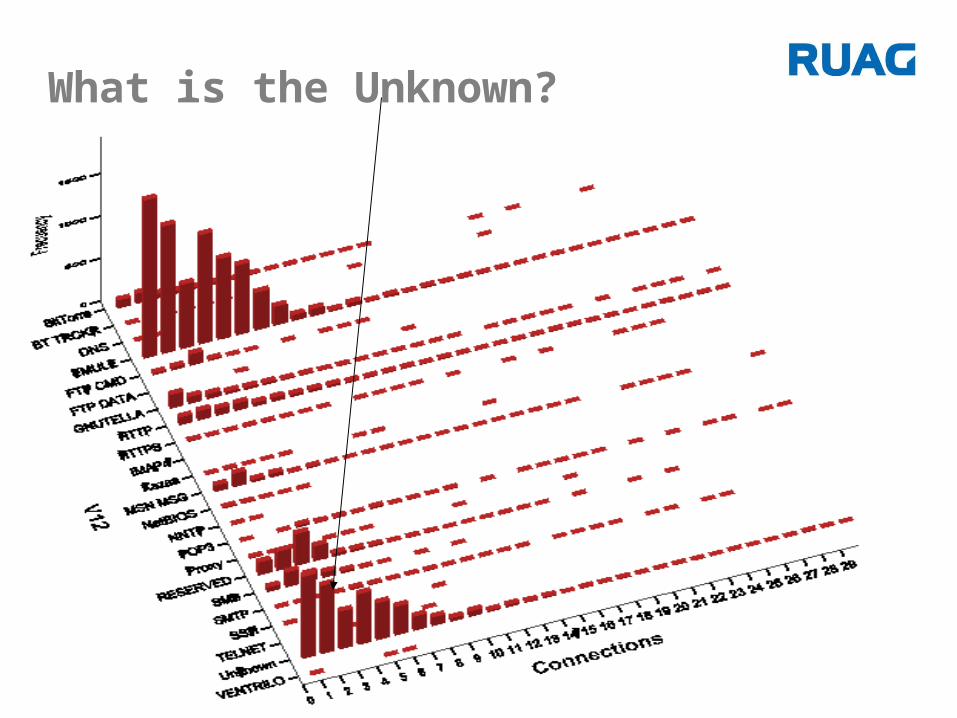
What is the Unknown?
37
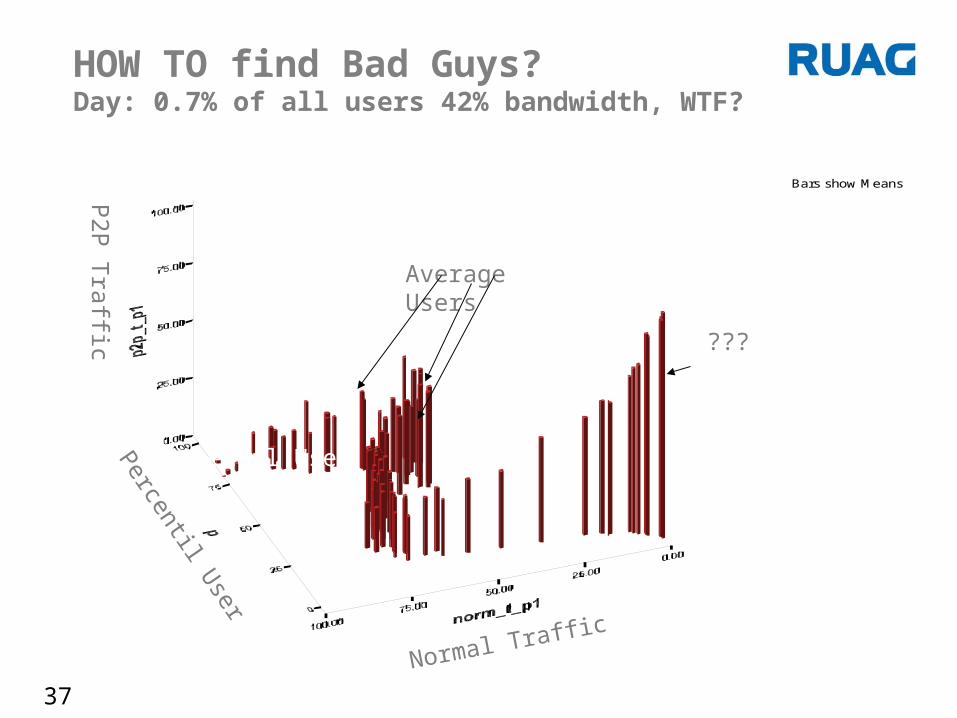
Bars show Means
HOW TO find Bad Guys?Day: 0.7% of all users 42% bandwidth, WTF?
???
Normal Traffic
Percentil User
P2P
Traffic
Average Users
P2P
Traffic
Percentil User
Normal Traffic
38
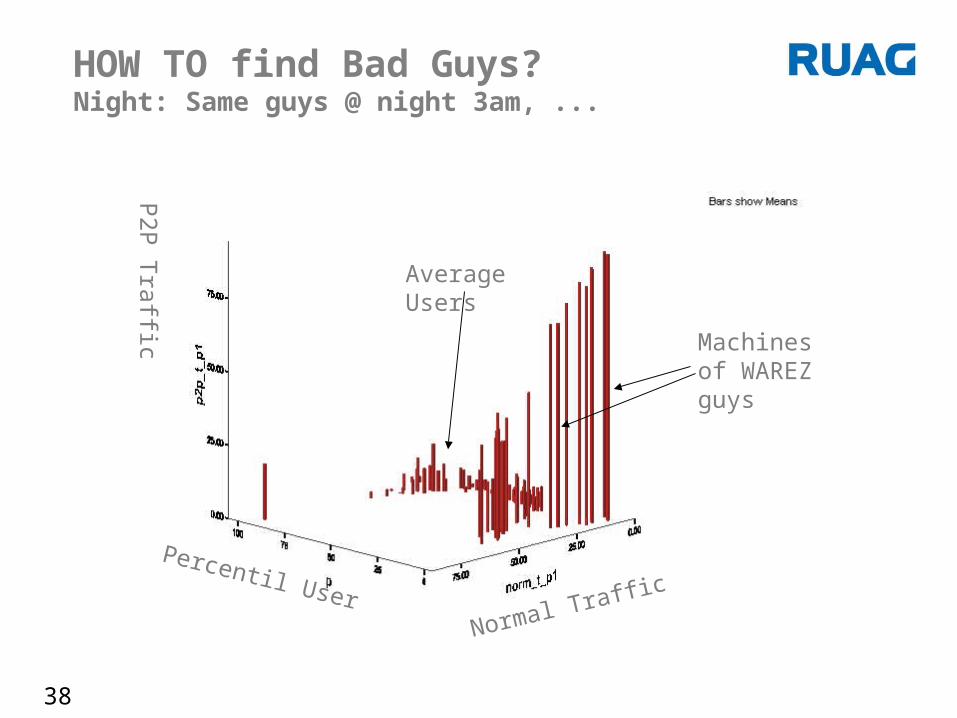
HOW TO find Bad Guys?Night: Same guys @ night 3am, ...
Machines of WAREZ guys
Normal Traffic
Percentil User
P2P
Traffic
Average Users
•39
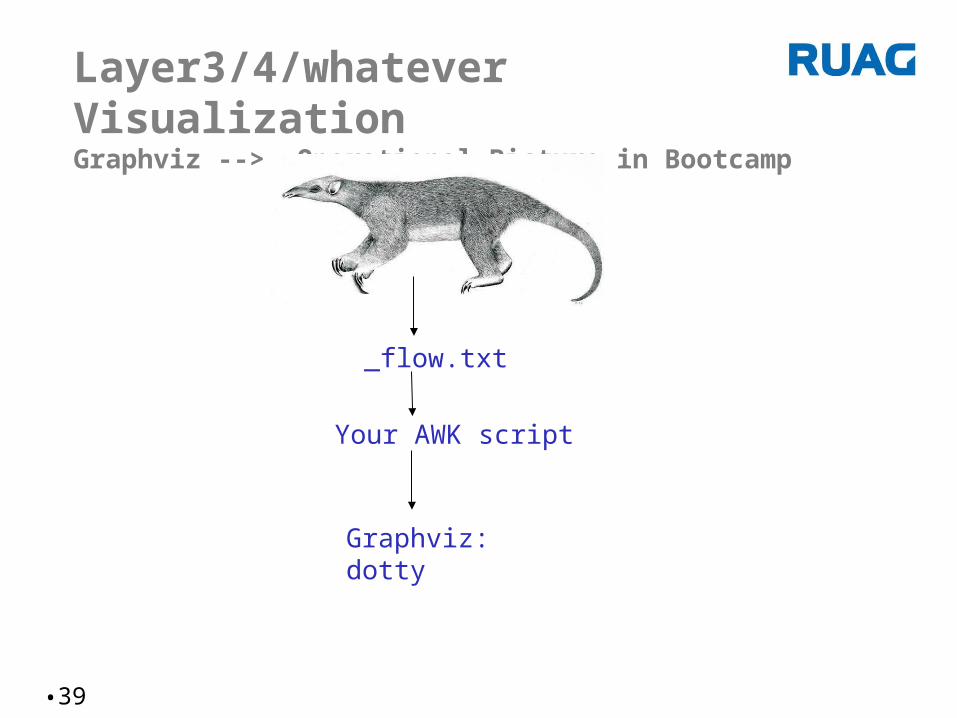
Layer3/4/whatever VisualizationGraphviz --> Operational Picture in Bootcamp
_flow.txt
Your AWK script
Graphviz: dotty
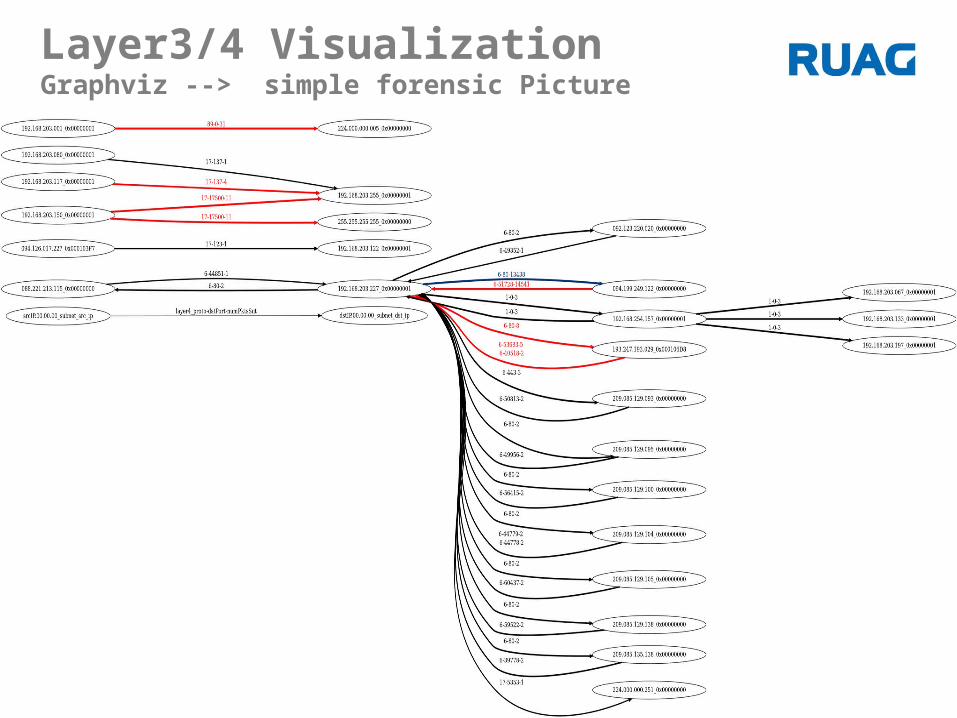
Layer3/4 VisualizationGraphviz --> simple forensic Picture
•41
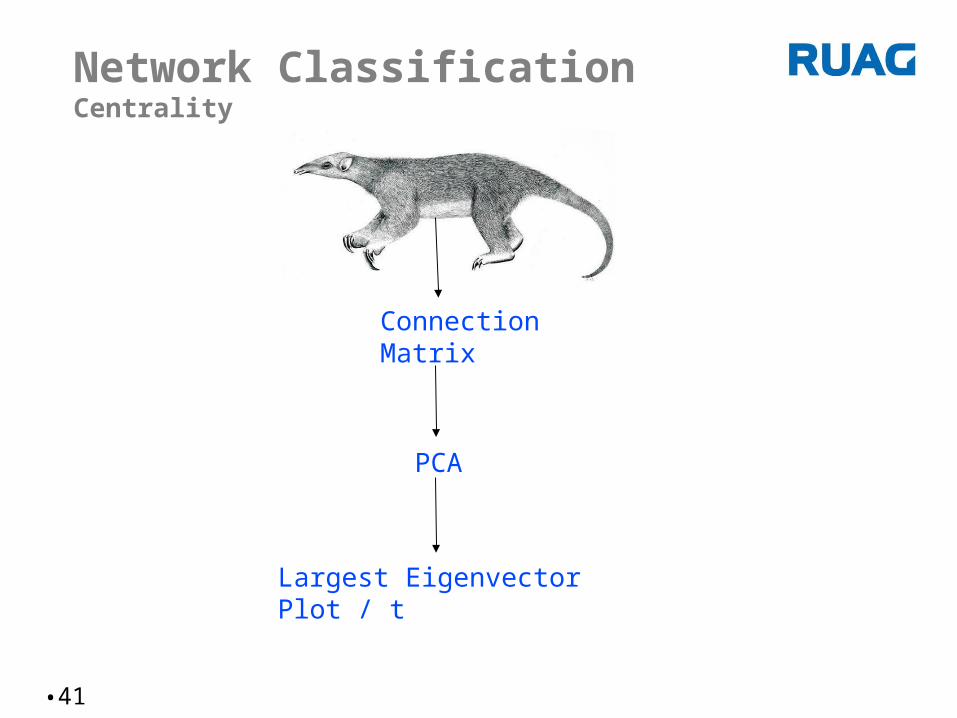
Network ClassificationCentrality
Connection Matrix
PCA
Largest Eigenvector Plot / t
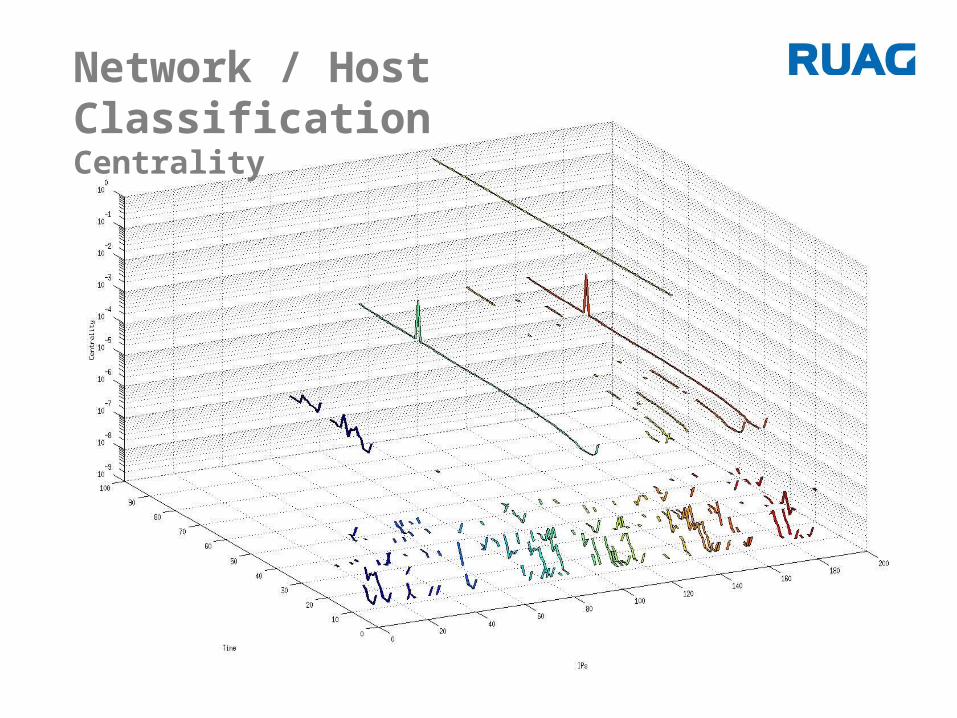
Network / Host ClassificationCentrality

43
ipSOM Operational Picture: 13 Dim statistical T2 Flow parameters Now conceivable by human brain
DNS Zone Transfer
Bot Scanner
44
RFM and try me Join the development forceWho wants Bootcamp?
Questions / Comments
http://sourceforge.net/projects/tranalyzer/http://tranalyzer.comhttp://sourceforge.net/projects/travizGoogle: Dataming for Hackers