Stefan Andersson Deformation, Metamorphism and ...713706/...Remobilisation was possibly initiated...
121
Examensarbete vid Institutionen för geovetenskaper ISSN 1650-6553 Nr 284 Deformation, Metamorphism and Remobilisation in the Hornkullen Polymetallic Deposit, Western Bergslagen, Sweden Deformation, Metamorphism and Remobilisation in the Hornkullen Polymetallic Deposit, Western Bergslagen, Sweden Stefan Andersson Stefan Andersson Uppsala University, Department of Earth Sciences Master Thesis, 30 hp Solid Earth Geology ISSN 1650-6553 Nr 284 Printed by Geotryckeriet, Uppsala University, Uppsala, 2014. The polymetallic Hornkullen deposit is situated in the western part of the Bergslagen ore province, Sweden. It is hosted by an inlier of approximately 1.90-1.88 Ga Svecofennian volcanic and sedimentary metasupracrustal rocks enclosed in a significantly younger, c. 1.8 Ga TIB granitoid (Filipstad granite). Although being mined intermittently for silver during the last 100s of years in addition to been the subject for more recent exploration work, the genesis of this deposit and others in a similar geological position is poorly understood. The hypothesis is that the Hornkullen deposit represents a metamorphically overprinted, syn-volcanic Svecofennian mineralisation. The main ore assemblage comprises magnetite, pyrrhotite, galena, chalcopyrite and arsenopyrite with subordinate pyrite, sphalerite, ilmenite and löllingite. Pb-Fe-Ag-Sb sulphosalts include boulangerite, meneghinite, jamesonite, freibergite-tetrahedrite, pyrargyrite, and stephanite, which mainly occur in trace amounts. Gudmundite and molybdenite are rare accessories. Generally, galena, chalcopyrite and pyrrhotite have accommodated strain in a ductile manner. Locally, this can also be seen in boulangerite, meneghinite and sphalerite. Magnetite, arsenopyrite and pyrite frequently have been deformed in a brittle way. The contrast in competence resulted in the remobilisation of the more ductile minerals into fractures in the more competent minerals. In massive parts, this contrast also resulted in more fragmented clasts of competent minerals within a less competent matrix, similar to “ball ore” texture. Recrystallisation is particularly evident in magnetite and pyrrhotite but also seen in coarser aggregates of ilmenite. Additionally, these minerals and also pyrite and arsenopyrite frequently exhibit euhedral morphology when occurring within less ductile minerals. Inclusions of ore minerals in porphyroblastic garnet are abundant. Geothermobarometry of arsenopyrite and sphalerite suggests temperatures and pressures of 525°C (between 440°C and c. 590°C) and c. 300-400 MPa, consistent with regional Svecokarelian amphibolite facies metamorphism, albeit with some caveats. Fluid inclusion entrapment conditions were determined to c. 440°C (between 400°C and 600°C) and c. 280 MPa. The observed textures are a result of deformation and remobilisation of diverse ore minerals during the Svecokarelian orogeny. Remobilisation was possibly initiated during prograde metamorphism, followed by additional and more extensive modification during retrograde conditions, at least to temperatures below 200°C. Sulphosalt formation is considered to reflect an evolution from prograde through retrograde metamorphism, although most of them formed during the retrograde stage, including the Ag-minerals. No evidence for any additional introduction of elements from later TIB magmatism is present. The combined observations can most easily be reconciled with a metamorphically overprinted syn-volcanic Svecofennian mineralisation.
Transcript of Stefan Andersson Deformation, Metamorphism and ...713706/...Remobilisation was possibly initiated...
Examensarbete vid Institutionen för geovetenskaper ISSN 1650-6553 Nr 284
Deformation, Metamorphism and Remobilisation in the Hornkullen
Polymetallic Deposit, Western Bergslagen, Sweden
Deformation, Metamorphism and Remobilisation in the Hornkullen Polymetallic Deposit, Western Bergslagen, Sweden
Stefan Andersson
Stefan Andersson
Uppsala University, Department of Earth SciencesMaster Thesis, 30 hp Solid Earth GeologyISSN 1650-6553 Nr 284Printed by Geotryckeriet, Uppsala University, Uppsala, 2014.
The polymetallic Hornkullen deposit is situated in the western part of the Bergslagen ore province, Sweden. It is hosted by an inlier of approximately 1.90-1.88 Ga Svecofennian volcanic and sedimentary metasupracrustal rocks enclosed in a significantly younger, c. 1.8 Ga TIB granitoid (Filipstad granite). Although being mined intermittently for silver during the last 100s of years in addition to been the subject for more recent exploration work, the genesis of this deposit and others in a similar geological position is poorly understood. The hypothesis is that the Hornkullen deposit represents a metamorphically overprinted, syn-volcanic Svecofennian mineralisation. The main ore assemblage comprises magnetite, pyrrhotite, galena, chalcopyrite and arsenopyrite with subordinate pyrite, sphalerite, ilmenite and löllingite. Pb-Fe-Ag-Sb sulphosalts include boulangerite, meneghinite, jamesonite, freibergite-tetrahedrite, pyrargyrite, and stephanite, which mainly occur in trace amounts. Gudmundite and molybdenite are rare accessories. Generally, galena, chalcopyrite and pyrrhotite have accommodated strain in a ductile manner. Locally, this can also be seen in boulangerite, meneghinite and sphalerite. Magnetite, arsenopyrite and pyrite frequently have been deformed in a brittle way. The contrast in competence resulted in the remobilisation of the more ductile minerals into fractures in the more competent minerals. In massive parts, this contrast also resulted in more fragmented clasts of competent minerals within a less competent matrix, similar to “ball ore” texture. Recrystallisation is particularly evident in magnetite and pyrrhotite but also seen in coarser aggregates of ilmenite. Additionally, these minerals and also pyrite and arsenopyrite frequently exhibit euhedral morphology when occurring within less ductile minerals. Inclusions of ore minerals in porphyroblastic garnet are abundant. Geothermobarometry of arsenopyrite and sphalerite suggests temperatures and pressures of 525°C (between 440°C and c. 590°C) and c. 300-400 MPa, consistent with regional Svecokarelian amphibolite facies metamorphism, albeit with some caveats. Fluid inclusion entrapment conditions were determined to c. 440°C (between 400°C and 600°C) and c. 280 MPa. The observed textures are a result of deformation and remobilisation of diverse ore minerals during the Svecokarelian orogeny. Remobilisation was possibly initiated during prograde metamorphism, followed by additional and more extensive modification during retrograde conditions, at least to temperatures below 200°C. Sulphosalt formation is considered to reflect an evolution from prograde through retrograde metamorphism, although most of them formed during the retrograde stage, including the Ag-minerals. No evidence for any additional introduction of elements from later TIB magmatism is present. The combined observations can most easily be reconciled with a metamorphically overprinted syn-volcanic Svecofennian mineralisation.
Supervisors: Erik Jonsson and Karin Högdahl
Examensarbete vid Institutionen för geovetenskaper ISSN 1650-6553 Nr 284
Deformation, Metamorphism and Remobilisation in the Hornkullen
Polymetallic Deposit, Western Bergslagen, Sweden
Stefan Andersson

Copyright © and the Department of Earth Sciences Uppsala UniversityPublished at Department of Earth Sciences, Geotryckeriet Uppsala University, Uppsala, 2014
I
Abstract
The polymetallic Hornkullen deposit is situated in the western part of the Bergslagen ore province,
Sweden. It is hosted by an inlier of approximately 1.90-1.88 Ga Svecofennian volcanic and
sedimentary metasupracrustal rocks enclosed in a significantly younger, c. 1.8 Ga TIB granitoid
(Filipstad granite). Although being mined intermittently for silver during the last 100s of years in
addition to been the subject for more recent exploration work, the genesis of this deposit and others in
a similar geological position is poorly understood. The hypothesis is that the Hornkullen deposit
represents a metamorphically overprinted, syn-volcanic Svecofennian mineralisation. The main ore
assemblage comprises magnetite, pyrrhotite, galena, chalcopyrite and arsenopyrite with subordinate
pyrite, sphalerite, ilmenite and löllingite. Pb-Fe-Ag-Sb sulphosalts include boulangerite, meneghinite,
jamesonite, freibergite-tetrahedrite, pyrargyrite, and stephanite, which mainly occur in trace amounts.
Gudmundite and molybdenite are rare accessories. Generally, galena, chalcopyrite and pyrrhotite have
accommodated strain in a ductile manner. Locally, this can also be seen in boulangerite, meneghinite
and sphalerite. Magnetite, arsenopyrite and pyrite frequently have been deformed in a brittle way. The
contrast in competence resulted in the remobilisation of the more ductile minerals into fractures in the
more competent minerals. In massive parts, this contrast also resulted in more fragmented clasts of
competent minerals within a less competent matrix, similar to “ball ore” texture. Recrystallisation is
particularly evident in magnetite and pyrrhotite but also seen in coarser aggregates of ilmenite.
Additionally, these minerals and also pyrite and arsenopyrite frequently exhibit euhedral morphology
when occurring within less ductile minerals. Inclusions of ore minerals in porphyroblastic garnet are
abundant. Geothermobarometry of arsenopyrite and sphalerite suggests temperatures and pressures of
525°C (between 440°C and c. 590°C) and c. 300-400 MPa, consistent with regional Svecokarelian
amphibolite facies metamorphism, albeit with some caveats. Fluid inclusion entrapment conditions
were determined to c. 440°C (between 400°C and 600°C) and c. 280 MPa. The observed textures are a
result of deformation and remobilisation of diverse ore minerals during the Svecokarelian orogeny.
Remobilisation was possibly initiated during prograde metamorphism, followed by additional and
more extensive modification during retrograde conditions, at least to temperatures below 200°C.
Sulphosalt formation is considered to reflect an evolution from prograde through retrograde
metamorphism, although most of them formed during the retrograde stage, including the Ag-minerals.
No evidence for any additional introduction of elements from later TIB magmatism is present. The
combined observations can most easily be reconciled with a metamorphically overprinted syn-
volcanic Svecofennian mineralisation.
Keywords: ore genesis, Bergslagen, deformation, remobilisation, metamorphism,
geothermobarometry
II
Svensk sammanfattning
Den polymetalliska mineraliseringen vid Hornkullen är belägen i västra Bergslagen i Mellansverige.
Den uppträder i ca. 1,90-1,88 miljarder år gamla Svekofenniska metavulkaniska- och sedimentära
ytbergarter inneslutna i en yngre, ca. 1,8 miljarder år gammal intrusiv bergart, så kallad
Filipstadsgranit. Trots att mineraliseringen ganska nyligen varit ett mål för prospektering samt tidigare
brutits på silver, saknas fortfarande information om dess malmmineralogi och hur den bildats.
Hypotesen är att Hornkullen utgörs av en metamorft överpräglad synvulkanisk Svekofennisk
mineralisering. Den domineras av magnetit, magnetkis, blyglans, kopparkis och arsenikkis och i
mindre mängd pyrit, zinkblände, ilmenit och löllingit. Pb-Fe-Ag-Sb-sulfosalter finns lokalt och
inkluderar boulangerit, meneghinit, jamesonit, freibergit-tetrahedrit, pyrargyrit, och stephanit.
Gudmundit och molybdenglans är andra sällsynta accessoriska malmmineral. Blyglans, kopparkis och
magnetkis har deformerats plastiskt men lokalt också boulangerit, meneghinit och zinkblände.
Magnetit, arsenikkis och pyrit har deformerats sprött. Denna tydliga skillnad i kompetens har
resulterat i att inkompetenta mineral ommobiliserats och kommit att fylla sprickor i de mer
kompetenta mineralen. I massiva delar av mineraliseringen har denna skillnad även resulterat i en
textur av kulmalmstyp. Granoblastisk omkristallisering är särskilt tydligt i magnetit och magnetkis,
men även i grovkorniga aggregat av ilmenit. Vidare så förekommer dessa mineral liksom pyrit och
arsenikkis ofta som euhedrala kristaller i mindre kompetent matrix. Inneslutningar av malmmineral i
porfyroblastisk granat är vanligt förekommande. Geotermobarometri på arsenikkis och zinkblände gav
temperatur och tryck på 525°C (mellan 440°C och ca. 590°C) och ca. 300-400 MPa, vilket
överensstämmer med regional Svekokarelsk amfibolitfaciesmetamorfos. Förhållandena vid
infångandet av synmetamorfa vätskeinneslutningar har uppskattats till en temperatur på ca. 440°C
(mellan 400 och 600°C) och tryck på ca. 280 MPa. Merparten av de observerade texturerna är resultat
av deformation och ommobilisering relaterad till de förhållanden som rådde under den Svekokarelska
orogenesen. Ommobiliseringen av vissa mineral startades förmodligen redan under prograd
metamorfos, vilket sedan följdes av mer omfattande modifikation under retrograda förhållanden,
åtminstone till temperaturer under 200°C. Bildningen av sulfosalter reflekterar en utveckling från
prograd till retrograd metamorfos där de flesta bildats under den senare, retrograda fasen, däribland de
olika silvermineralen. Alla observationer resulterar sammantaget i tolkningen att Hornkullen är en
regional-metamorft överpräglad och deformerad synvulkanisk Svekofennisk mineralisering.
Nyckelord: malmbildning, Bergslagen, deformation, ommobilisering, metamorfos,
geotermobarometri
III
Table of contents 1. Introduction ....................................................................................................................................... 1
2. Geological setting ............................................................................................................................... 3
2.1 Regional geology ........................................................................................................................... 4
2.2 Structural and metamorphic features ............................................................................................. 5
2.3 Plate tectonic setting ...................................................................................................................... 7
2.4 Metallogenesis of Bergslagen........................................................................................................ 7
2.5 Local geology and the mineralisation at Hornkullen..................................................................... 9
3. Methodology and background........................................................................................................ 14
3.1 Field work and sampling ............................................................................................................. 14
3.2 Reflected light microscopy .......................................................................................................... 14
3.3 SEM-EDS .................................................................................................................................... 16
3.4 WDS-FE-EPMA .......................................................................................................................... 17
3.5 Geothermobarometry ................................................................................................................... 17
3.6 Geochemical analyses ................................................................................................................. 18
3.7 Fluid inclusion study ................................................................................................................... 19
3.8 Deformation and remobilisation of ore minerals ......................................................................... 21
4. Results .............................................................................................................................................. 26
4.1 Ore mineralogy and textural relations ......................................................................................... 26
4.1.1 Galena ................................................................................................................................... 29
4.1.2 Pyrrhotite .............................................................................................................................. 30
4.1.3 Arsenopyrite and löllingite ................................................................................................... 31
4.1.4 Chalcopyrite ......................................................................................................................... 36
4.1.5 Pyrite .................................................................................................................................... 38
4.1.6 Sphalerite .............................................................................................................................. 39
4.1.7 Magnetite .............................................................................................................................. 41
4.1.8 Pb-Fe-Ag-Sb sulphosalts ...................................................................................................... 43
4.1.9 Trace ore minerals ................................................................................................................ 47
4.2 Geochemistry of the Hornkullen ore assemblages ...................................................................... 49
4.3 Fluid inclusions ........................................................................................................................... 51
4.3.1 Fluid inclusion types............................................................................................................. 51
4.3.2 Microthermometry ................................................................................................................ 53
4.3.3 Raman spectroscopy of fluid inclusions and inclusion-hosted solids .................................. 55
4.3.4 Entrapment conditions .......................................................................................................... 57
IV
4.4 Geothermobarometry ................................................................................................................... 59
4.4.1 Arsenopyrite geothermometry .............................................................................................. 59
4.4.2 Sphalerite geobarometry ....................................................................................................... 59
5. Discussion ......................................................................................................................................... 62
5.1 Features of deformation, metamorphism and remobilisation ...................................................... 62
5.1.1 Brittle-ductile behaviour ....................................................................................................... 62
5.1.2 Minerals with a preferred orientation ................................................................................... 65
5.1.3 Dilatational sites ................................................................................................................... 65
5.1.4 Garnet-ore mineral relations ................................................................................................. 67
5.1.5 Mica-ore mineral relations ................................................................................................... 68
5.1.6 Recrystallisation features...................................................................................................... 68
5.2 Geothermometry and geobarometry ............................................................................................ 69
5.2.1 Arsenopyrite geothermometry .............................................................................................. 69
5.2.2 Sphalerite geobarometry ....................................................................................................... 70
5.3 Fluid inclusions ........................................................................................................................... 71
5.4 Geological evolution of the Hornkullen deposit.......................................................................... 73
5.4.1 Syn-volcanic stage ................................................................................................................ 73
5.4.2 Prograde-peak metamorphic stage........................................................................................ 74
5.4.3 Retrograde stage ................................................................................................................... 75
5.4.4 Formation of Pb-Fe-Ag-Sb sulphosalts and other minor phases at Hornkullen ................... 75
5.4.5 Influence of TIB magmatism ................................................................................................ 77
5.4.6 Low temperature alteration ................................................................................................... 78
6. Conclusions ...................................................................................................................................... 79
7. Acknowledgements .......................................................................................................................... 80
8. References ........................................................................................................................................ 81
Appendix 1: WDS-FE-EMPA ............................................................................................................ 91
Appendix 2: Geochemistry ............................................................................................................... 108
1
1. Introduction
The Hornkullen mines (Fig. 1) are located in the western part of the classic Bergslagen ore province in
the Swedish part of the Fennoscandian shield (Fig. 2). Although having been subject to more recent
exploration work (Hammergren et al., 1986; Ros et al., 1986; Hammergren, 1987; Johansson, 1987) in
addition to being mined for silver intermittently during the last 100s of years (cf. Tegengren, 1924;
Magnusson, 1925; Lundegårdh, 1987), there is a lack of fundamental ore mineralogical information as
well as modern metallogenetic interpretations on the deposit. This information is important, not least
when considering the tectonic evolution of the deposit that features several possible deformational and
thermal events, and has direct implications also for the interpretation of other deposits in related
settings.
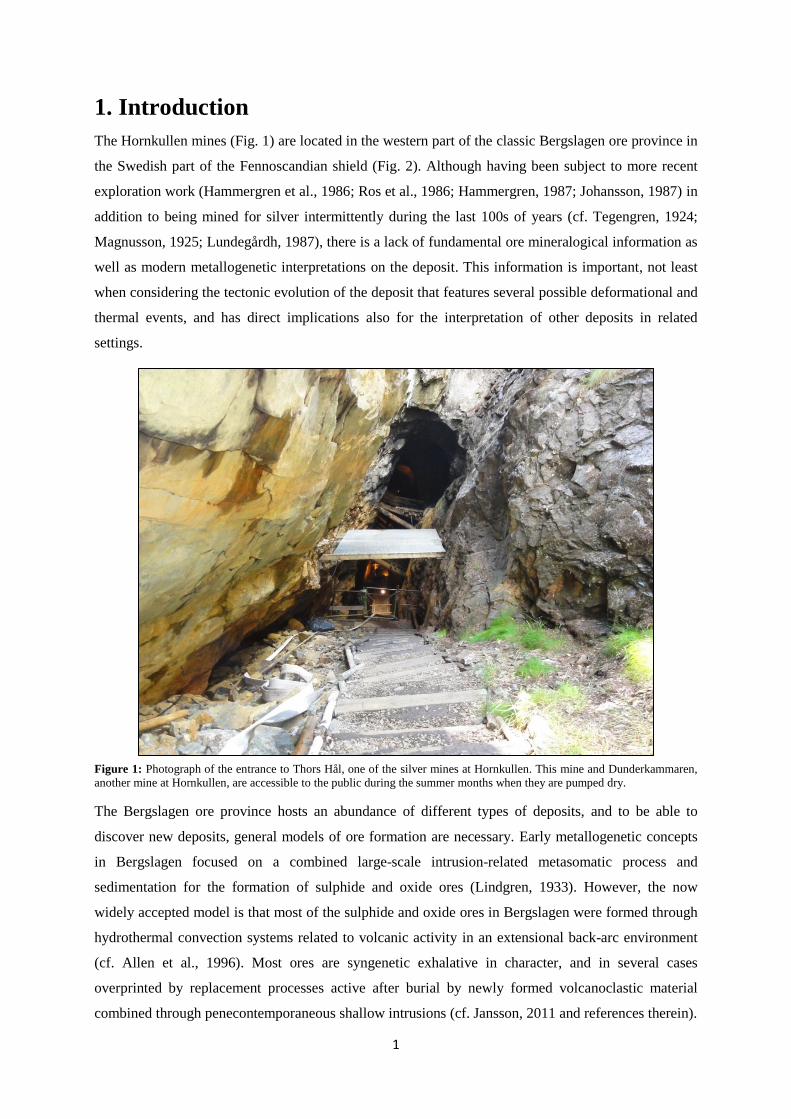
Figure 1: Photograph of the entrance to Thors Hål, one of the silver mines at Hornkullen. This mine and Dunderkammaren,
another mine at Hornkullen, are accessible to the public during the summer months when they are pumped dry.
The Bergslagen ore province hosts an abundance of different types of deposits, and to be able to
discover new deposits, general models of ore formation are necessary. Early metallogenetic concepts
in Bergslagen focused on a combined large-scale intrusion-related metasomatic process and
sedimentation for the formation of sulphide and oxide ores (Lindgren, 1933). However, the now
widely accepted model is that most of the sulphide and oxide ores in Bergslagen were formed through
hydrothermal convection systems related to volcanic activity in an extensional back-arc environment
(cf. Allen et al., 1996). Most ores are syngenetic exhalative in character, and in several cases
overprinted by replacement processes active after burial by newly formed volcanoclastic material
combined through penecontemporaneous shallow intrusions (cf. Jansson, 2011 and references therein).
2
The influence of deformation and metamorphism on ore deposits and their constituent minerals have
been of increasing interest since the late 20th century (e.g. Gill, 1969; Vokes, 1969; Graf & Skinner,
1970; Gilligan & Marshall, 1987; Marshall & Gilligan, 1987; Skinner & Johnson, 1987; Marshall &
Gilligan, 1993; Vokes & Craig, 1993; Marshall et al., 2000a), not least because of the influence such
processes can have on the economic potential of specific deposits. Studies on this subject centered on
assessing how ore minerals respond to variable pressure and temperature conditions, both in relation to
each other and to common silicate host assemblages. Additionally, various processes governing the
actual remobilisation of ore minerals have also been addressed. This development has resulted in new
and vital insights for the interpretation of ore mineral relations and consequently also on
metallogenesis. Such studies have been conducted on several mineralisations in the Fennoscandian
shield in recent years (e.g. Cook et al., 1993; Craig & Vokes, 1993; Wagner et al., 2005).
It has been found that certain ore minerals are more prone to brittle deformation whereas other are
more prone to ductile deformation at given P-T-conditions (e.g. Graf & Skinner, 1970; Gilligan &
Marshall, 1987; Marshall & Gilligan, 1987). It has also been shown that this behaviour is often in
contrast to how host gangue or silicate assemblages respond to deformation. Some ore minerals are
also recognised as being more refractory in nature i.e. less likely to re-equilibrate texturally as well as
chemically during post-formational processes, e.g. pyrite and arsenopyrite and in some circumstances
even sphalerite (Clark, 1960; Scott & Barnes, 1971; Kretschmar & Scott, 1976; Hutchinson & Scott,
1981; Scott, 1983; Sharp et al., 1985; Toulmin et al., 1991).
The mineralised area at Hornkullen is hosted by an inlier of Svecofennian metavolcanic and
metasedimentary rocks enclosed in a significantly younger, c. 1.8 Ga granitoid. The metallogenetic
process(es) in forming the deposit is unclear, and could either be coeval with the c. 1.9 Ga
Svecofennian volcanism, i.e. syn-volcanic, or being formed in conjunction with the later intrusive
rocks through hydrothermal activity. The hypothesis is that the Hornkullen deposit represents a
metamorphically overprinted syn-volcanic Svecofennian mineralisation, thus pre-dating regional
Svecokarelian amphibolite facies metamorphism. In order to test this, evidence from the ore mineral
assemblages, with special emphasis on textural and phase relations that reflect deformation and
metamorphism are evaluated. These are combined with geothermobarometry and information from
fluid inclusions in quartz in order to further verify this, and gain a more detailed understanding of the
evolution of the deposit. The study is in part included in on-going VR (Vetenskapsrådet, the Swedish
research council) and SGU-funded research projects on critical and high-tech elements in central
Sweden, at Uppsala University (UU). As part of the documentation of the deposit, additional
information from geochemical analyses of mineralised assemblages are also integrated.
3
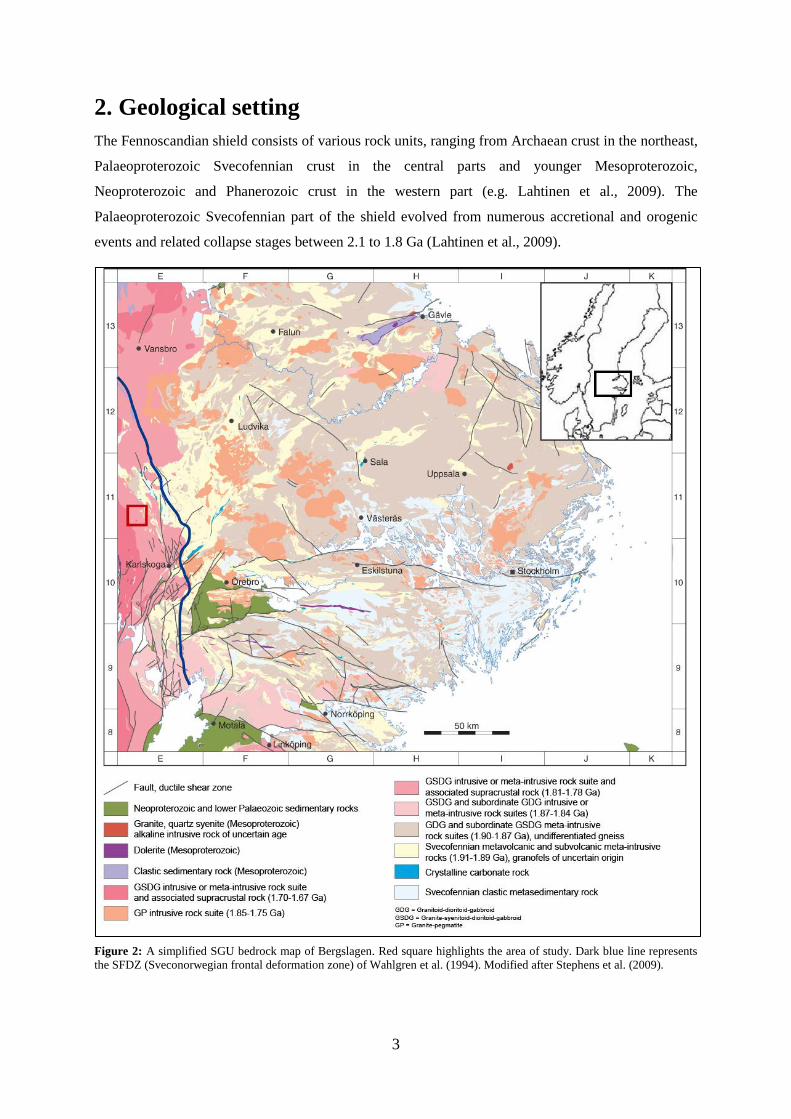
2. Geological setting
The Fennoscandian shield consists of various rock units, ranging from Archaean crust in the northeast,
Palaeoproterozoic Svecofennian crust in the central parts and younger Mesoproterozoic,
Neoproterozoic and Phanerozoic crust in the western part (e.g. Lahtinen et al., 2009). The
Palaeoproterozoic Svecofennian part of the shield evolved from numerous accretional and orogenic
events and related collapse stages between 2.1 to 1.8 Ga (Lahtinen et al., 2009).
Figure 2: A simplified SGU bedrock map of Bergslagen. Red square highlights the area of study. Dark blue line represents
the SFDZ (Sveconorwegian frontal deformation zone) of Wahlgren et al. (1994). Modified after Stephens et al. (2009).
4
The Bergslagen ore province (Fig. 2) belongs to the southwestern part of the Svecofennian region (e.g.
Allen et al., 1996; Stephens et al., 2009; Beunk & Kuipers, 2012). It is well known for its abundance
of various types of metal deposits, including Fe±Mn oxide and Fe-Pb-Zn-Ag-(Cu-Au) sulphide
mineralisations that have been exploited continuously for at least 1000 years. Many of them have been
described in the classic works of Tegengren (1924) and Geijer & Magnusson (1944).
2.1 Regional geology
The Bergslagen province comprise different, locally ore-bearing, metavolcanic and metasedimentary
rocks enclosed, and intruded by different generations of intrusive rocks (e.g. Allen et al., 1996;
Stephens et al., 2009). The dominant rocks in the metavolcanic succession are rhyolitic pyroclastic
units and minor dacitic-rhyolitic volcanic to subvolcanic complexes (Allen et al., 1996), previously
referred to as the leptit-hälleflinta formation (Geijer & Magnusson, 1944). The associated facies
includes welded to non-welded pyroclastic flow units with related, reworked equivalents as well as
subvolcanic porphyritic intrusions and cryptodomes (Allen et al., 1996). The volcanoclastic rocks
were primarily deposited in a shallow to moderately deep marine setting (Allen et al., 1996). The
metavolcanic rocks are particularly abundant in the western and northern part of Berslagen (Fig. 2),
and they are both underlain and overlain by metasedimentary rocks. The metasedimentary rocks that
dominate the Bergslagen region area-wise, in the southeastern and northern part (Fig. 2), are mostly
interpreted as metagraywackes, now mostly in the form of migmatitic paragneisses, with minor
quartzites. Metasedimentary rocks that occur stratigraphically below the metavolcanic rocks comprise
of turbiditic metagreywackes that often show a shallowing-up component (Allen et al., 1996;
Lindström et al., 2000). The metavolcanic rocks are also present as intercalations within the
metasedimentary rocks. The metasedimentary rocks that stratigraphically overlie the metavolcanic
rocks are less conspicuous and mainly comprises of meta-argillites, as in the Grythyttan-Hällefors area
just to the east of the study area (Fig. 2) (Sundius, 1923; Stephens et al., 2009). More well-sorted
metasedimentary rocks (e.g. metaarkoses and quartzites) are less common in the Bergslagen region
and both occur stratigraphically under and over the metavolcanic rocks (e.g. Stephens et al., 2009).
Dolomitic and calcitic marbles occurring interbedded with the metavolcanic rocks are locally
common, mainly in the upper part of the volcanic succession (e.g. Stephens et al., 2009). The timing
of the formation of these metavolcanic and metasedimentary units is relatively well-constrained to
1.91-1.88 Ga (e.g. Stephens et al., 2009 and references therein).
The supracrustal succession in Bergslagen was later subjected to deformation and metamorphism
during the 1.9-1.8 Ga Svecokarelian/Svecofennian orogeny (e.g. Stephens et al., 2009). Several
intrusive rock suites with different chemical affinity and age relations, from pre- and syn- to post-
tectonic are common (Stephens et al., 2009). Traditionally, the plutonic rocks have been classified as
primorogenic (or early orogenic), serorogenic (or late orogenic) and post orogenic in regards to the
5
Svecokarelian orogeny (e.g. Lindström et al., 2000). The early or primorogenic suite, which also is
part of the granitoid-dioritoid-gabbroid (GDG) rock suite of Stephens et al., (2009), is the dominant
type of intrusive rocks and covers vast areas in the northern, central and eastern part of the Bergslagen
region (Fig. 2). Compositionally, they typically vary from tonalite to granite, but spatially related
mafic and ultramafic rocks are also included (Lindström et al., 2000; Stephens et al., 2009). The 1.90-
1.87 Ga ages of the rock suites in addition to geochemical and field relationships show that some of
these rocks are coeval with deposition of metavolcanic and metasedimentary rocks in the region (Allen
et al., 1996; Jansson & Allen, 2011). The early orogenic GDG rocks are variably affected by the
deformation and metamorphism associated with the Svecokarelian orogeny. The late- to post-
orogenic, c. 1.81-1.75 Ga intrusive rocks are dominated by granites often with associated pegmatites
(Lindström et al., 2000). They are included in the c. 1.85-1.75 granite-pegmatite (GP) rock suite of
Stephens et al. (2009) and often show cross-cutting relationships to ductile structures in the
surrounding, older rocks (Stephens et al., 2009).
The intrusive rocks in the western region of Bergslagen belong to the 1.85-1.67 Ga Transscandinavian
Igneous Belt (TIB), which extends from southwestern Sweden towards the Caledonides in the west
central part of the country (e.g. Högdahl et al., 2004). Most of the TIB rocks are also classified as part
of the 1.87-1.84 Ga and 1.81-1.78 Ga granite-syenitoid-dioritoid-gabbroid (GSDG) rock suite of
Stephens et al. (2009). The GSDG rock suite or TIB is predominantly granitic in composition, but with
minor components with a more primitive gabbroic and dioritic composition (Stephens et al., 2009).
The GSDG rock suites are divided into four different suites based on age and tectonic relationships
(Stephens et al., 2009). The oldest is the 1.88-1.87 Ga pre-tectonic rock suite that exhibit
Svecokarelian deformation and metamorphic features. The second and third suites are the syn- to post-
tectonic rocks with ages of 1.87-1.84 Ga and 1.81-1.78 Ga, respectively, and are the dominating
intrusive rock suites in the Bergslagen region. The former often show a penetrative Svecokarelian
fabric and in the westernmost regions occasionally minor ductile shear zones that are inferred to be
Sveconorwegian in age, i.e. c. 1.0 Ga (Wahlgren et al., 1994; Page et al., 1994; Söderlund et al., 1999;
Stephens et al., 2009). The 1.81-1.78 Ga rock suite only display ductile deformational features
associated with the Sveconorwegian orogeny, which mostly are minor shear zones. The fourth suite,
the youngest post-tectonic rock suite with an age of 1.70-1.67 Ga is to a variable extent affected by the
Sveconorwegian deformation in the west (Stephens et al., 2009).
2.2 Structural and metamorphic features
The rocks in the Bergslagen region have been affected by polyphase ductile deformation and at least
two regional phases of folding is proposed (Stålhös, 1981; Stephens et., 2009; Beunk & Kuipers,
2012). A three phase scenario has also been described locally (e.g. Persson & Sjöström, 2003;
Högdahl et al., 2013). The dominant regional structures are related to the second generation of folding
6
(Beunk & Kuipers, 2012). The folds have generally a steep to nearly vertical axial plane and steeply
plunging fold axes with a tight to isoclinal fold geometry (e.g. Persson & Sjöström, 2003; Beunk &
Kuipers, 2012). They are often superimposed on earlier structures, thus refolding the earlier folds
(Stephens et al., 2009; Beunk & Kuipers, 2012). The earlier folds are distinct in some regions, e.g. in
Sala in the central part of Bergslagen (Fig. 2), where they are represented by shallowly plunging
upright folds with tight to isoclinal geometry (Beunk & Kuipers, 2012).
Numerous shear zones occur on different scales in the Bergslagen region, most of which were active
during late stages of Svecokarelian deformation in conjunction with roughly N-S to NNW-SSE
shortening that gradually shifted to transpressional dextral shear (Högdahl et al., 2009; Beunk &
Kuipers, 2012). In the north, the most conspicuous is the E-W Gävle-Rättvik deformation zone
(Högdahl et al., 2009). The TIB rocks located to the west of the Bergslagen region are locally
overprinted by deformation associated with the Sveconorwegian orogeny (Wahlgren et al., 1994; Page
et al., 1994; Söderlund et al., 1999; Stephens et al., 2009). Just outside the western Bergslagen margin,
near Karlskoga (Fig. 2), older N-S striking structures are rotated into a younger set of ductile dextral
reverse shear zones along the Sveconorwegian frontal deformation zone (SFDZ, marked in Fig. 2).
The penetrative character increases towards the west (Wahlgren et al., 1994, Page et al., 1994;
Söderlund et al., 1999). In the Filipstad region and close to the studied area, Sveconorwegian
overprinting seems to be confined to fabrics developed in conjunction with the ductile reverse shear
zones (Cruden et al., 1999). The main structures are inferred to be Svecokarelian (Cruden et al., 1999;
Beunk & Kuipers, 2012). Late orogenic Svecokarelian retrogressive shearing in western Bergslagen is
dominated by sinistral SW-NE trending shear zones along the west Bergslagen boundary zone with a
likely dextral conjugate striking N-NW to E-SE along the Grythyttan-Saxå shear belt (Beunk &
Kuipers, 2012). In general, deformation in western Bergslagen associated with the Sveconorwegian
orogeny is mainly brittle, if at all.
The regional Svecokarelian metamorphic conditions are mainly low pressure amphibolite and
greenschist facies with temperatures between 500-700ºC in the central part. To the north and south, the
metamorphic grade reaches upper amphibolite facies with local granulite facies areas in the south,
adjacent to intrusive rocks (Rickard, 1988; Andersson et al., 2006; Stephens et al., 2009). The
pressures are on average 2-6 kbar (Stephens et al., 2009). Small well-preserved areas metamorphosed
in greenschist facies conditions also exists (e.g. Sundius, 1923; Rickard, 1988; Lundström, 1995). Two
possible metamorphic events are suggested for Bergslagen (Andersson et al., 2006). The first
metamorphic peak or phase is rather poorly constrained to 1.87-1.86 Ga (Rickard, 1988; Andersson et
al., 2006) which is coeval with deformation (Stephens et al., 2009). In the southern part, peak-
metamorphism is related to either a single major event around 1.8 Ga or two separate events at 1.83-
1.82 Ga and 1.80-1.79 Ga (Andersson et al., 2006; Stephens et al., 2009).
7
2.3 Plate tectonic setting
Previously, Oen (1982) and Oen et al. (1987) suggested an intra-continental rift environment for the
Bergslagen volcanic and sedimentary succession. From an extensive regional volcanic facies analysis,
Allen et al. (1996) interpreted this succession as being deposited in association with an extensional
back-arc system inboard an active continental margin, which is now the widely accepted depositional
environment. Allen et al. (1996) also envisaged an extensional and compressional cyclic
palaeotectonic environment for the whole Bergslagen region which in part fits well into recent models
(Hermansson et al., 2008; Stephens et al., 2008; Korja et al., 2006; Lahtinen et al., 2009; Beunk &
Kuipers, 2012) proposed for the the Svecokarelian orogeny, although with some differences between
the models.
Hermansson et al. (2008) and Stephens et al. (2009) envisaged a 50 Ma cyclic development of the
Bergslagen part of the Svecokarelian orogeny. Back-arc extension occurred at c. 1.91-1.89 Ga with
deposition of the supracrustal rocks and coeval intrusion of the GDG rock suite. This was followed by
waning extension and bulk shortening in a transpressional regime at c. 1.89-87 Ga, and a new phase of
extension at c. 1.86 Ga with temporally associated intrusive rock suites (GSDG). Switches in tectonic
regime were caused by trench migration on a northwardly dipping oblique subduction zone beneath an
active continental margin to the northeast, i.e. accreting to the south-west. A new cycle is proposed to
have commenced following the renewed extension and ended around 1.8 Ga (Stephens et al., 2009).
The effects of the latter cycle are only conspicuous in the southern part.
Beunk & Kuipers (2012) advocate an accreted model for the evolution of the Bergslagen part of the
Svecokarelian orogeny in which collision of the Bergslagen microcontinent is related to the formation
of a large orocline. In their model, back-arc closure and first folding occurred at c. 1.87-1.86 Ga
followed by renewed extension at c. 1.86-1.84 Ga with separation of the future Bergslagen
microcontinent. This microcontinent was subsequently obliquely accreted on to the area north of
present Bergslagen region around 1.83-1.82 Ga. Bulk shortening was approximately north-south and
caused bending, folding and shearing and the formation of a orocline. The model generally correlates
with models proposed for the evolution of the southwestern part of the Fennoscandian shield where
final accretion and oroclinal formation may coincide with what has been called the Svecobaltic
orogeny (1.83-1.79 Ga) (Korja et al., 2006; Lahtinen et al., 2009).
2.4 Metallogenesis of Bergslagen
Numerous sulphide and oxide deposits in Bergslagen have been known and mined for many centuries
and have been essential for the growth of Sweden‟s industry, economy and prosperity. The more
important deposit types include banded iron-formations, magnetite-skarn deposits, manganiferous
skarn- and carbonate-hosted iron ores, apatite-bearing iron ores, stratiform and stratabound sulphide
ores and tungsten-bearing skarn deposits (e.g. Allen et al., 1996). Historically significant REE
8
deposits, such as at Bastnäs (e.g. Holtstam & Andersson, 2007) are also notable. The overall most
significant deposits include the Zn-Pb-Cu-Ag sulphide deposit at Garpenberg (Vivallo, 1995; Jansson
et al., 2011), the Cu-(Zn-Pb) deposit at Falun (e.g. Sundblad, 1994), the Zn-Pb-(Ag-Cu-Co) sulphide
deposit at Zinkgruvan (Hedström et al., 1989), the Fe oxide deposit at Dannemora (e.g. Dahlin et al.,
2012) and the apatite iron oxide deposit at Grängesberg (Jonsson et al., 2010; Weis, 2013; Jonsson et
al., 2013). Currently, active mining is taking place in Garpenberg, Zinkgruvan, Dannemora and in the
Zn-Pb deposit Lovisagruvan.
These deposits are primarily hosted by the 1.91-1.88 Ga felsic metavolcanic succession and associated
intercalated marbles (e.g. Allen et al., 1996). Suitable conditions for regional convective systems, such
as widespread availability of marine water, high near-surface geothermal gradients and stable volcano-
tectonic environment prevailed during this period and were vital to ore formation (Allen et al., 1996).
Previously, iron ores in Bergslagen were primarily considered to be of sedimentary origin and later
metamorphosed. Due to the strong relationship of the iron ores with skarns, it later led some workers
to favour a metasomatic origin temporally and spatially related to the older GDG intrusive rocks.
However, others suggested that the iron ores first formed concurrently with the metavolcanic rocks
(the leptit-hälleflinta formation) either by sedimentary processes or near-surface metasomatism. The
ores were subsequently metamorphosed as a result of the intrusion of the GDG rocks, which formed
the sulphides ores in addition to local alteration (Lindgren, 1933). The concept of larger-scale
intrusion-driven metasomatism was abandoned and models involving sea-floor volcanic hydrothermal
activity emerged in the late 1900‟s (e.g. Koark, 1962; Lagerblad & Gorbatschev, 1985; Oen, 1987;
Allen et al., 1996). These investigations showed, for instance that, the pronounced Mg±Na enrichment
in most of the lower stratigraphic metavolcanic rocks along with K enrichment in the higher
stratigraphic levels probably were caused by hydrothermal solutions. Presently, many deposits, both
sulphides and iron oxides, are now generally regarded as syngenetic exhalative in character, or formed
as a result of sub-seafloor replacement processes in relation to volcanic-subvolcanic processes
including shallow magma intrusions (Allen et al., 1996, Jansson, 2011). A direct magmatic origin has
also been suggested for the apatite iron oxide ores at Grängesberg (e.g. Jonsson et al., 2013).
Although, regional hydrothermal alteration may have prevailed, but not necessarily generated ore
deposits, Pb isotope systematics from numerous deposits in Bergslagen show that there is not a simple
common metal source for the sulphide ores. Instead it has been demonstrated that there are discernable
regional variations in metal sources that reflect slightly different environments and depositional
situations (Sundblad, 1994). Commonly, the isotope data define a linear array in Pb-Pb space, which
have been interpreted as being the result of mixing between Pb derived from Svecofennian volcanic
activity and from pre-Svecofennian epiclastic sediments (Sundblad, 1994 and references therein).
Locally, deposits in western Bergslagen also exhibits more radiogenic Pb isotopic compositions,
which have been suggested to reflect the re-utilisation of evolved pre-existing Svecofennian Pb as a
9
result of a thermal input presumably linked to the c. 1.8 Ga TIB magmatism or regional Svecokarelian
metamorphism (Jonsson & Billström, 2009). A majority of the metavolcanic-hosted sulphide deposits,
can according to Allen et al. (1996), be classified as either SAS- or SVALS-type. SAS represents
stratiform ash-siltstone-hosted sea-floor deposits (e.g. Zinkgruvan) whereas SVALS refers to
stratabound volcanic-associated limestone-skarn subsea-floor replacement deposits (e.g. Garpenberg).
An earlier classification also used for stratiform and stratabound sulphide deposits in Bergslagen are
Åmmeberg- and Falun-type deposits, respectively (Geijer, 1917; Sundblad, 1994). However, it is
important to bear in mind that these “two types” are merely two possible end-members within the
broad spectrum of sulphide deposits in Bergslagen. Processes that further complicate the interpretation
of the formation of most deposits are the variable degrees of overprinting through deformation and
metamorphism in conjunction with the Svecokarelian orogeny and partly also later events. This
complex and extended geological evolution is for instance evident in the complex Långban Fe-Mn-
(Ba-As-Pb-Sb…) deposit in the westernmost part of the province (Jonsson, 2004).
2.5 Local geology and the mineralisation at Hornkullen
The Hornkullen polymetallic deposit has been described briefly in previous work such as those of
Widell (1845), Igelström (1850, 1872), Johansson (1889), Tegengren (1924) and Magnusson (1925)
and in more recent unpublished prospecting reports conducted by Sveriges Geologiska AB (SGAB).
These focused mainly on exploration aspects and the economic potential of the deposit (specifically
Hammergren et al. 1986; Ros et al. 1986; Hammergren, 1987; Johansson 1987). In addition,
Hornkullen was also an exploration target for Boliden AB (today New Boliden AB) during the 1970‟s.
A short summary covering its history and geology is also given in the bed rock map description
(Lundegårdh, 1987). Even though the deposit was not deemed to be economically viable at that point,
the previous work on Hornkullen has given important information on e.g. lithologies, structural
features and overall geology, which is very useful. Yet, these studies do not include any detailed
information on the ore mineralogy and petrography. Ore minerals that previously were observed are
pyrrhotite, galena, chalcopyrite, arsenopyrite, sphalerite, magnetite, ilmenite and Pb-Sb sulphosalts,
albeit without any paragenetic or textural information (Hammergren, 1987; Riddersand & Sundblad,
1988). The relationship between magnetite and sulphides were also poorly understood.
Previous studies on Pb isotopes in galena from the Hornkullen deposit indicates that primary sulphide
assemblages formed from volcanic-hydrothermal processes c. 1.9 G.y. ago in conjunction with the
deposition of the Svecofennian metavolcanic and metasedimentary rocks (Riddersand & Sundblad,
1988; Sundblad, 1994). Pb isotope values define a linear array (Fig. 3) originating from a “Falun
source composition” towards that of an “Utö/Stockholm source composition”, as defined by Sundblad
(1994). This trend has been proposed to represent a mixing line in which felsic volcanic components
of Falun source admixed with higher isotopic ratios derived from epiclastic sediments (Sundblad,
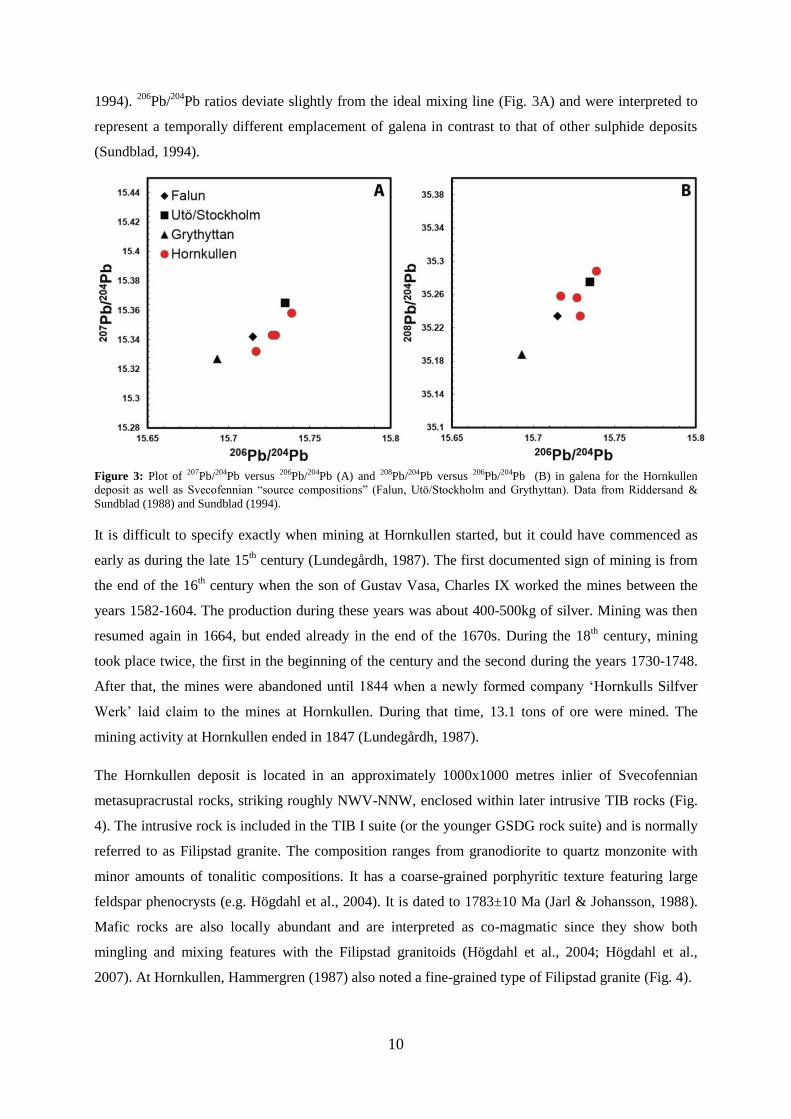
10
1994). 206
Pb/204
Pb ratios deviate slightly from the ideal mixing line (Fig. 3A) and were interpreted to
represent a temporally different emplacement of galena in contrast to that of other sulphide deposits
(Sundblad, 1994).
Figure 3: Plot of 207Pb/204Pb versus 206Pb/204Pb (A) and 208Pb/204Pb versus 206Pb/204Pb (B) in galena for the Hornkullen
deposit as well as Svecofennian “source compositions” (Falun, Utö/Stockholm and Grythyttan). Data from Riddersand &
Sundblad (1988) and Sundblad (1994).
It is difficult to specify exactly when mining at Hornkullen started, but it could have commenced as
early as during the late 15th century (Lundegårdh, 1987). The first documented sign of mining is from
the end of the 16th century when the son of Gustav Vasa, Charles IX worked the mines between the
years 1582-1604. The production during these years was about 400-500kg of silver. Mining was then
resumed again in 1664, but ended already in the end of the 1670s. During the 18th century, mining
took place twice, the first in the beginning of the century and the second during the years 1730-1748.
After that, the mines were abandoned until 1844 when a newly formed company „Hornkulls Silfver
Werk‟ laid claim to the mines at Hornkullen. During that time, 13.1 tons of ore were mined. The
mining activity at Hornkullen ended in 1847 (Lundegårdh, 1987).
The Hornkullen deposit is located in an approximately 1000x1000 metres inlier of Svecofennian
metasupracrustal rocks, striking roughly NWV-NNW, enclosed within later intrusive TIB rocks (Fig.
4). The intrusive rock is included in the TIB I suite (or the younger GSDG rock suite) and is normally
referred to as Filipstad granite. The composition ranges from granodiorite to quartz monzonite with
minor amounts of tonalitic compositions. It has a coarse-grained porphyritic texture featuring large
feldspar phenocrysts (e.g. Högdahl et al., 2004). It is dated to 1783±10 Ma (Jarl & Johansson, 1988).
Mafic rocks are also locally abundant and are interpreted as co-magmatic since they show both
mingling and mixing features with the Filipstad granitoids (Högdahl et al., 2004; Högdahl et al.,
2007). At Hornkullen, Hammergren (1987) also noted a fine-grained type of Filipstad granite (Fig. 4).
11
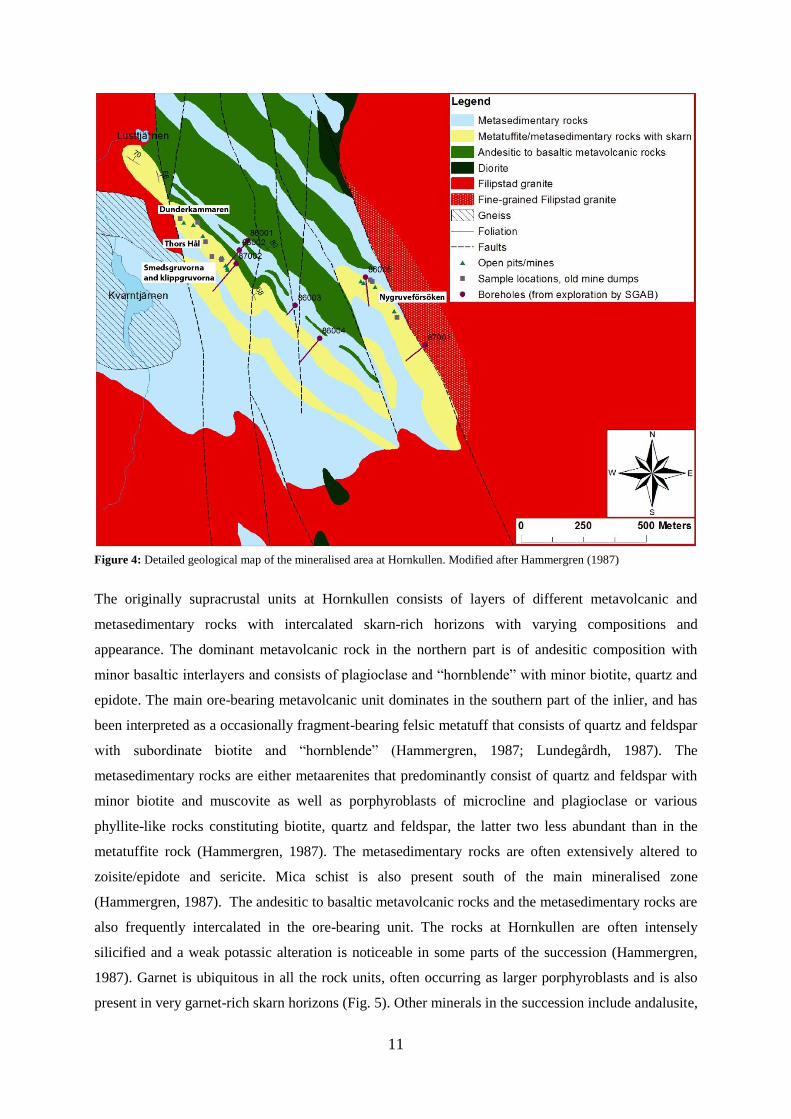
Figure 4: Detailed geological map of the mineralised area at Hornkullen. Modified after Hammergren (1987)
The originally supracrustal units at Hornkullen consists of layers of different metavolcanic and
metasedimentary rocks with intercalated skarn-rich horizons with varying compositions and
appearance. The dominant metavolcanic rock in the northern part is of andesitic composition with
minor basaltic interlayers and consists of plagioclase and “hornblende” with minor biotite, quartz and
epidote. The main ore-bearing metavolcanic unit dominates in the southern part of the inlier, and has
been interpreted as a occasionally fragment-bearing felsic metatuff that consists of quartz and feldspar
with subordinate biotite and “hornblende” (Hammergren, 1987; Lundegårdh, 1987). The
metasedimentary rocks are either metaarenites that predominantly consist of quartz and feldspar with
minor biotite and muscovite as well as porphyroblasts of microcline and plagioclase or various
phyllite-like rocks constituting biotite, quartz and feldspar, the latter two less abundant than in the
metatuffite rock (Hammergren, 1987). The metasedimentary rocks are often extensively altered to
zoisite/epidote and sericite. Mica schist is also present south of the main mineralised zone
(Hammergren, 1987). The andesitic to basaltic metavolcanic rocks and the metasedimentary rocks are
also frequently intercalated in the ore-bearing unit. The rocks at Hornkullen are often intensely
silicified and a weak potassic alteration is noticeable in some parts of the succession (Hammergren,
1987). Garnet is ubiquitous in all the rock units, often occurring as larger porphyroblasts and is also
present in very garnet-rich skarn horizons (Fig. 5). Other minerals in the succession include andalusite,
12
cordierite and chlorite. A gneissic variety of the metasedimentary rocks is common close to Lake
Kvarntjärnen, into which quartz-feldspar occur as irregular patches or as small folded veins.
Magnusson (1925) also reports a cordierite- and biotite-rich quartzitic rock that could represent
hornfels alteration close to the granitoid contact in the east. A common feature in the main mineralised
zone is the occurrence of larger quartz boudins, rounded quartz aggregates and quartz veins (Fig 5).
Skarn occurs abundantly in the ore-bearing metavolcanic and metasedimentary unit, mainly as
continuous horizons in outcrop-scale, or as boudinaged bodies. Amphibole (“hornblende”, actinolite,
and cummingtonite), epidote, zoisite, garnet, biotite, quartz and minor vesuvianite in different
combinations and proportions make up the skarn units (Hammergren, 1987). The most conspicuous
skarn-type appears to be amphibole- and garnet-rich varieties.
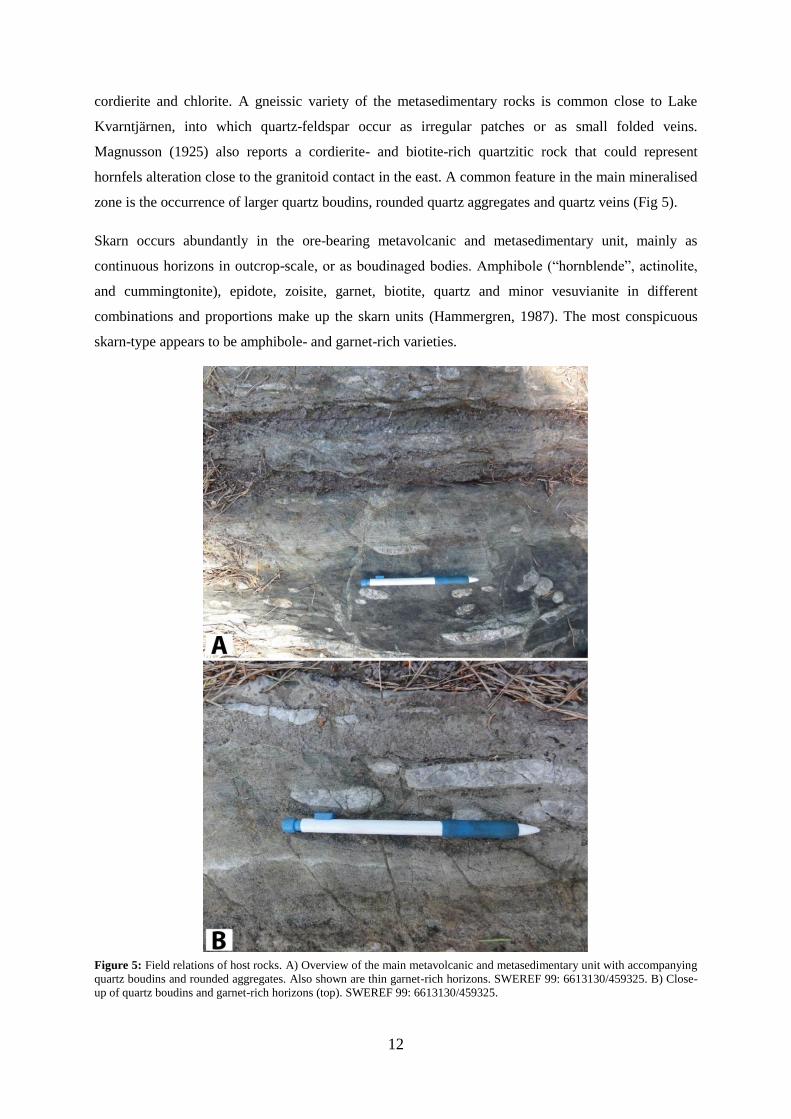
Figure 5: Field relations of host rocks. A) Overview of the main metavolcanic and metasedimentary unit with accompanying
quartz boudins and rounded aggregates. Also shown are thin garnet-rich horizons. SWEREF 99: 6613130/459325. B) Close-
up of quartz boudins and garnet-rich horizons (top). SWEREF 99: 6613130/459325.
13
The tectonic foliation in the metasupracrustal unit is steeply dipping (60-80°) towards NE and strikes
approximately WNW to NW. The orientation is conformable with the overall regional fabric in
Svecofennian supracrustal rocks in the Filipstad area and corresponds to axial planar foliation of tight,
gently plunging folds (Cruden et al., 1999; Beunk & Kuipers 2012). The consistent NE dipping
orientation is a result form an initial synform that has been overturned, which also inverts the
stratigraphy in the eastern part of the area (Lundegårdh, 1987; Hammergren, 1987). Sveconorwegian
generated structures have not been identified with certainty at Hornkullen. A stretching component is
apparent in competent rocks that have been boudinaged, e.g. skarn units and quartz layers and veins
(Fig. 5). Furthermore, evidence of a shearing component is shown by abundant rotated quartz
aggregates as well as shear-fractures and tension gashes oblique to the foliation (Hammergren, 1987).
Provided that these structures are related they indicate an apparent dextral horizontal shear component.
In the Grythyttan-Saxå region, just NE of Hornkullen, Beunk & Kuipers (2012) and Cruden et al.
(1999) both describe dextral shear zones that were formed at a late stage in the Svecokarelian orogeny
in a transpressional regime. The area is also affected by later brittle deformation, with mostly a minor
displacement. One fault shows a pronounced horizontal component, displacing the eastern side, called
Nygruveförsöken, of the main meta-volcanic and sedimentary unit towards the north (Fig. 4).
The mineral assemblages indicate that the deposit has undergone amphibolite facies metamorphism
that is overprinted by a lower, possibly at greenschist facies conditions. Both are inferred to be
Svecokarelian, the latter as a result of retrograde processes. The older rocks must also have
experienced a marked thermal influence from the TIB magmatism, possibly also leading to
retrogradation of Svecokarelian peak-metamorphic assemblages in addition to very local hornfels
alteration. Furthermore, the area is located to the west of the SFDZ (Fig. 2), i.e. the easternmost area
affected by the Sveconorwegian orogeny (Wahlgren et al., 1994). However, with the exception of
localised mainly SW dipping reverse shear zones, Sveconorwegian overprinting is not likely to be
penetrative in the Hornkullen area (Wahlgren et al., 1994; Page et al., 1996; Cruden et al., 1999).
Brittle deformation associated with Sveconorwegian deformation or later deformation could, however,
be significant.
14
3. Methodology and background
3.1 Field work and sampling
Samples were collected from different mine dumps in the Hornkullen area. Criteria for sampling of
particular samples included availability and apparent ore mineralogy. Most of the samples are from the
dumps next to the largest mines, Dunderkammaren and Thors Hål. An additional set of representative
samples, gathered during the 18th and 19
th century during mining, from the collections at the Swedish
Museum of Natural History, Stockholm (Bergskollegii mineralsamling) were also used, together with
a few samples collected and prepared by Kjell Gatedal, formerly at the Filipstad School of Mining and
Metallurgy (Bergsskolan i Filipstad). All the studied samples are listed in Table 1. A number of
profiles across the mineralised area were also surveyed to assess the local geology. The samples
acquired during the field work were subsequently narrowed down and a suite were further selected for
preparation of polished sections for reflected light microscopy (and micro-chemical methods), double-
polished thin-sections (wafers) for fluid inclusion studies as well as materials for geochemical
analysis. The different samples for polished sections were selected in order to cover as many of the
paragenetic assemblages and relationships as possible. Samples with abundant quartz were selected for
double-polished thin section preparation and mineralised samples were selected for geochemical
analysis. The methods applied to each sample are summarised in Table 1.
3.2 Reflected light microscopy
A prerequisite for reflected light microscopy as well as microchemical analyses is that the samples that
are to be studied are properly prepared. All samples aimed for reflected light microscopy were
prepared by the author, except for seven samples from Kjell Gatedal. Representative areas for the
different samples were cut out using both a smaller and a larger diamond saw. Two slices were cut-out
from each sample, with one acting as backup. One (or two) of the cut-out pieces from each sample was
mounted in a standard 25 mm cylindrical mould using epoxy hardener and resin. The samples were
subsequently ground and polished during several steps using different grain sizes of silicon carbide
powder (80, 45, 18 and 12 µm) and diamond suspension (6, 3 and 1 µm), respectively.
The reflected light microscope is similar to an ordinary petrographic microscope but with the
fundamental difference that the light source is placed in order for the light to travel through a set of
apertures, lenses, filters and a first polariser before hitting the sample and then be reflected back to the
viewer through an optional second polariser and the ocular. Often, modern polarising microscopes are
equipped to study samples in both reflected and transmitted light. The microscopes used during the
study were Nikon Eclipse E600 equipped with a Nikon DS-Fi1 camera and a Nikon Eclipse 50i
microscope. In both microscopes blue filters were used to adjust for the normally yellowish light
produced from the light source.
15
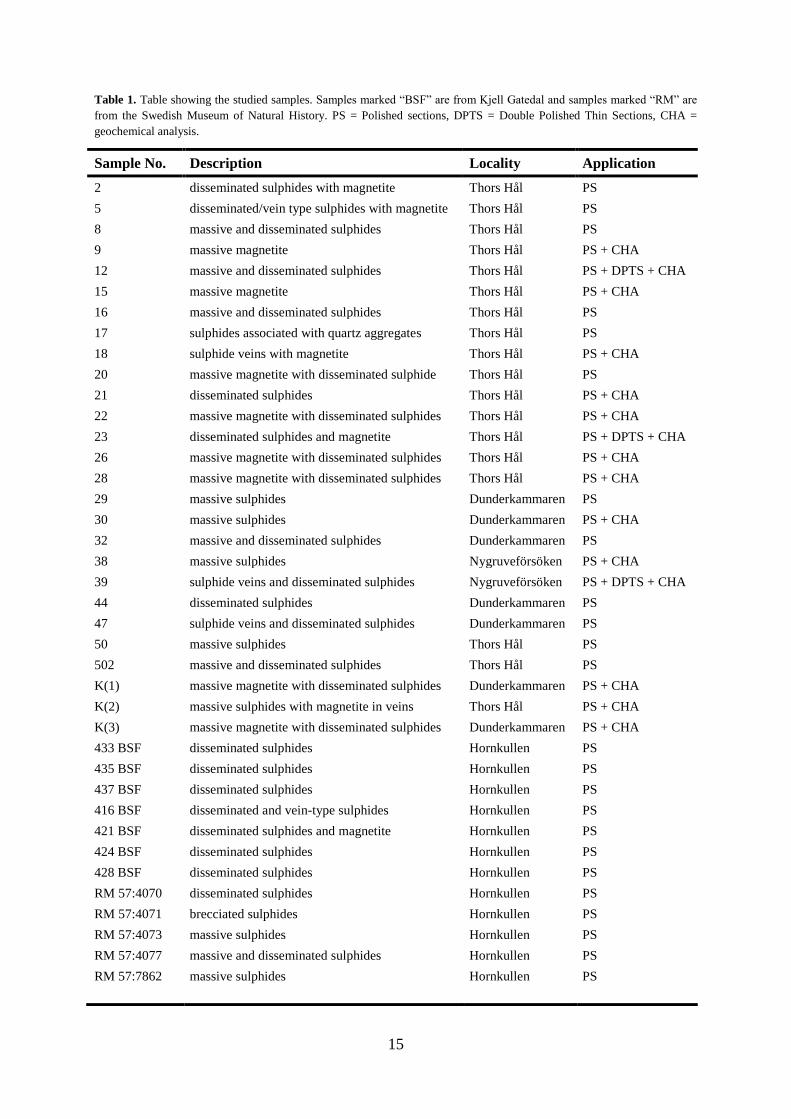
Table 1. Table showing the studied samples. Samples marked “BSF” are from Kjell Gatedal and samples marked “RM” are
from the Swedish Museum of Natural History. PS = Polished sections, DPTS = Double Polished Thin Sections, CHA =
geochemical analysis.
Sample No. Description Locality Application
2 disseminated sulphides with magnetite Thors Hål PS
5 disseminated/vein type sulphides with magnetite Thors Hål PS
8 massive and disseminated sulphides Thors Hål PS
9 massive magnetite Thors Hål PS + CHA
12 massive and disseminated sulphides Thors Hål PS + DPTS + CHA
15 massive magnetite Thors Hål PS + CHA
16 massive and disseminated sulphides Thors Hål PS
17 sulphides associated with quartz aggregates Thors Hål PS
18 sulphide veins with magnetite Thors Hål PS + CHA
20 massive magnetite with disseminated sulphide Thors Hål PS
21 disseminated sulphides Thors Hål PS + CHA
22 massive magnetite with disseminated sulphides Thors Hål PS + CHA
23 disseminated sulphides and magnetite Thors Hål PS + DPTS + CHA
26 massive magnetite with disseminated sulphides Thors Hål PS + CHA
28 massive magnetite with disseminated sulphides Thors Hål PS + CHA
29 massive sulphides Dunderkammaren PS
30 massive sulphides Dunderkammaren PS + CHA
32 massive and disseminated sulphides Dunderkammaren PS
38 massive sulphides Nygruveförsöken PS + CHA
39 sulphide veins and disseminated sulphides Nygruveförsöken PS + DPTS + CHA
44 disseminated sulphides Dunderkammaren PS
47 sulphide veins and disseminated sulphides Dunderkammaren PS
50 massive sulphides Thors Hål PS
502 massive and disseminated sulphides Thors Hål PS
K(1) massive magnetite with disseminated sulphides Dunderkammaren PS + CHA
K(2) massive sulphides with magnetite in veins Thors Hål PS + CHA
K(3) massive magnetite with disseminated sulphides Dunderkammaren PS + CHA
433 BSF disseminated sulphides Hornkullen PS
435 BSF disseminated sulphides Hornkullen PS
437 BSF disseminated sulphides Hornkullen PS
416 BSF disseminated and vein-type sulphides Hornkullen PS
421 BSF disseminated sulphides and magnetite Hornkullen PS
424 BSF disseminated sulphides Hornkullen PS
428 BSF disseminated sulphides Hornkullen PS
RM 57:4070 disseminated sulphides Hornkullen PS
RM 57:4071 brecciated sulphides Hornkullen PS
RM 57:4073 massive sulphides Hornkullen PS
RM 57:4077 massive and disseminated sulphides Hornkullen PS
RM 57:7862 massive sulphides Hornkullen PS
16
3.3 SEM-EDS
An scanning electron microscope (SEM) is often used to produce images, for instance of minute
details of biological as well as geological samples, but it is also used for semi-quantitative chemical
analysis of e.g. mineral, using an energy dispersive spectrometry (EDS) detector. The technique is
based on the interaction between the electron beam from the instrument and the atoms in the analysed
sample volume. The interaction results in various emitted signals where X-rays, backscattered
electrons and secondary electrons are the most significant. Backscattered electrons originate through
high-angle deflection and are a function of atomic numbers, where minerals or compounds with high
mean atomic number deflect more backscattered electrons than those with lower mean atomic number.
This difference is used in imaging (a so-called back-scattered electron or BSE image) and is depicted
in greyscale where minerals or compounds with high mean atomic number are bright, i.e. whiter, than
those with lower mean atomic number. Secondary electrons are produced from electron-electron
repulsion between the electrons from the electron beam and electrons from the sample, i.e. electrons
from the sample are pushed out. This signal is primarily used to image topographic features in the
sample. X-rays are produced from electron transitions between internal energy levels in the atoms of
respective elements. The incident electron beam, if the energy is sufficient, will cause ionisation of an
inner shell electron and subsequent infill of a higher-energy electron, thus releasing element-
characteristic and quantifiable X-ray emissions (Reed, 2005).
During EDS analysis, the characteristic X-rays are collected with a detector that measures the energy
of each X-ray and depicts it in a plot of intensity versus voltage and compares it to known values
(Reed, 2005). The limitations with this particular method is that in general, the operator needs to have
a good knowledge of the type of minerals, or rather the composition of the mineral, that is analysed
since there could be overlaps between peaks of different elements that could potentially impair the
quality of the measurements or lead to misidentification of certain elements. For the purpose during
this study, EDS analyses were mainly used for identification of minerals that are difficult to
distinguish utilising optical properties alone.
After initial microscope studies, unknown or uncertain phases were analysed on a Zeiss Supra35-VP
SEM equipped with an EDAX Genesis 4000 spectrometer at the Evolutionary Biology Centre at
Uppsala University. Detailed maps of the samples were made prior to the analysis in order to
maximise the efficiency of the procedure. Analytical spots were then selected in homogenous areas
with no cracks or irregularities on the surface. An accelerating voltage of 20 kV was used for the
measurements.
17
3.4 WDS-FE-EPMA
The technique is based on the same electron-atom interactions as described above but with the
difference that the X-rays are analysed using a wavelength dispersive spectrometer (WDS) and
therefore yields quantitative data with much higher spectral resolution. Analyses with X-ray
spectrometry utilises Bragg‟s law (eq. 1) to reflect X-rays of particular wavelengths (λ) and incident
angle (θ) generated from the sample into a detector that correlates the counts of each element to known
calibrated counts. Reflections of the first order (n=1) are typically used as higher orders give unwanted
peaks. Several crystals with different interplanar spacing (d) are often utilised in order to cover the
entire spectrum of wavelengths of interest (Reed, 2005).
nλ = 2d sinθ (eq. 1)
The technique was primarily used to quantitatively analyse the composition on several paragenetically
different arsenopyrites and sphalerites, different sulphosalts and other sulphides. Measurements were
made on surfaces optimally free of cracks and irregularities.
The analyses were carried out with a Field Emission Electron Probe Microanalyser model JXA-8530F
JEOL Superprobe equipped with four different crystal spectrometers (TAP, PETJ, PETH and LIFH) at
the Centre for experimental mineralogy, petrology and geochemistry (CEMPEG) at the Department of
Earth Sciences, Uppsala University. A constant beam current of 0.202 nA, an accelerating voltage of
20 kV and counting times of 20 s and 10 s for peak and background respectively were used for all
analyses. Standards utilised were AsGa, Bi, ZnS, Sb2S3, HgS, Ag, PbS, Fe2O3, and metallic Cu, Co
and Au. Detection limits during the analyses were Au (328 ppm), Ni (53 ppm), Co (68 ppm), As (176
ppm), Bi (233 ppm), Sb (105 ppm), Hg (286 ppm), Ag (66 ppm), Pb (146 ppm), Fe (38 ppm), Cu (62
ppm) and Zn (77 ppm).
3.5 Geothermobarometry
As arsenopyrite and sphalerite are comparatively refractory, they have been used to constrain
temperature and pressure of formation or peak metamorphism in different ore deposits (e.g. Sundblad
& Zachrisson, 1984). The As (expressed as atomic percent; At%) content in arsenopyrite has been
demonstrated to be a function of temperature if it is buffered by associated phases in the Fe-As-S
system (Kretschmar & Scott, 1976; Scott, 1983; Sharp et al., 1985), e.g. pyrrhotite, pyrite and
löllingite. The influence of pressure for any buffered assemblage is relatively small and should only be
considered for deposit metamorphosed at high pressures (>> 500 MPa). The geothermometer seems
most applicable to deposits metamorphosed to greenschist to lower amphibolite facies conditions
(Sharp et al., 1985).
In contrast, for temperatures below c. 550°C, the mole% content of FeS in sphalerite buffered by
pyrite and pyrrhotite, is constant but strongly pressure-dependent (Scott & Barnes, 1971; Scott, 1976;
18
Hutchinson & Scott, 1981; Scott, 1983). Toulmin et al. (1991) argued that this relationship probably
only applies to lower pressures and for higher pressures, the effect of temperature on the FeS content
increases significantly, especially at lower temperatures. However, by comparing pressures from the
original experimental data from e.g. Hutchinson & Scott (1981) with calculated pressures from
Toulmin et al. (1991) at c. 500°C and about 300-400 MPa, the difference is about 50 MPa and should
only have a negligible effect. Thus, it should be potentially useful as a geobarometer for
mineralisations affected by metamorphism in amphibolite facies conditions. Unlike arsenopyrite,
sphalerite will more readily re-equilibrate during retrograde metamorphism with slow cooling rates,
particularly in Cu-rich environments (Hutchinson & Scott, 1981). Sphalerites from slowly cooled
metamorphosed deposits are therefore significantly depleted in their FeS content (Hutchinson & Scott,
1981; Scott, 1983). Only sphalerite that essentially have been secluded or isolated during retrograde
re-equilibration would retain FeS values consistent with peak pressure conditions, and thus yield
accurate pressure estimations. Such sphalerite is commonly found as inclusions, armoured by high-
strength porphyroblastic minerals such as pyrite (Scott, 1983; Sundblad et al., 1984).
Prior to measurements, suitable arsenopyrite and sphalerite grains or aggregates were selected by
optical microscopy and mapped in detail (arsenopyrite co-existing with löllingite and pyrrhotite,
arsenopyrite as inclusions in pyrrhotite, arsenopyrite co-existing with pyrite, arsenopyrite with
pyrrhotite, sphalerite co-existing with pyrrhotite ± chalcopyrite ± galena ± pyrite and magnetite,
sphalerite with pyrite, chalcopyrite and galena as well as inclusions of sphalerite in chalcopyrite).
Different numbers of spot analyses with WDS were made depending on grain size and abundance;
sphalerite is generally fine-grained and relatively scarce at Hornkullen and thus more difficult to
analyse properly.
The obtained data for all of the sphalerite analyses were converted to mole% FeS in order to compare
it with published data, using eq. 2.
(eq. 2)
where n is the atomic proportion (or moles) of each element. Data for arsenopyrite was converted to
atomic percent As. All data from both sphalerite and arsenopyrite were plotted as histograms using
Matlab.
3.6 Geochemical analyses
Fifteen samples (Table. 1) were crushed using the mechanical crusher in the saw room at the
CEMPEG Department of Earth Sciences at Uppsala University. The samples were later analysed for
major oxides and trace elements by ALS Global using Inductively Coupled Plasma - Atomic Emission
Spectroscopy (ICP-AES) and Inductively Coupled Plasma - Mass Spectrometry (ICP-MS) methods.
19
3.7 Fluid inclusion study
Fluid inclusions are normally microscopic voids filled with fluids ± gases ± solid precipitates or any
combination of these that were trapped from a solution either during crystal growth or during healing
of fractures. Primary inclusions are those that are preserved from the crystal-growth processes and
secondary are those preserved from the healing of fractures formed post-dating the primary formation
of the host mineral. Inclusions trapped when fractures are healed during the crystal-growth process are
referred to as pseudosecondary. One widespread application for fluid inclusions is to use them as
geothermometric indicators of past geological events, e.g. to determine the temperature of ore-forming
fluids. However, in order to obtain useful data, the fluid inclusions must be properly assigned to
particular events in the ore-forming process, i.e. a detailed study of the fluid inclusions and their
textural and paragenetic relations is essential. The basic principle behind the use of geothermometry
from fluid inclusions is the difference in volume change between the host mineral and the fluid
inclusion upon cooling from an initial homogenous fluid. Basically, the volume reduction in the
trapped fluid is greater than of the host (differential shrinkage) and upon cooling, the fluid occupies
less space than at the initial temperature and as a result, a gas-filled cavity appears. In addition,
components in the initial solution could precipitate as solids during cooling. To obtain the initial
homogeneous temperature, the fluid inclusion is heated under controlled circumstances until the cavity
(in a two-phase inclusion) disappears. Corrections, sometimes extensive, are then needed in order to
yield useful information. The salinity of a solution is another parameter that can be obtained by
studying fluid inclusions. Through measurements of the freezing and melting temperatures of ice and
e.g. clathrates in a particular inclusion and comparing with quantified and known values from
literature data, the salinity, expressed in terms of NaCl equivalents, can be determined among other
things (Roedder, 1984).
All of the measurements were made in the Fluid Inclusion Laboratory at the Department of Geological
Sciences at Stockholm University. The lab is equipped with a Nikon petrographic microscope utilising
a 40X long working-distance objective on which specific heating and cooling stages are mounted, in
this case a Linkam THM 600. The working range of the stage is from -196ºC to +600ºC where heating
is achieved electrically and freezing performed utilising a liquid nitrogen system. The thermocouple
readings were calibrated by means of SynFlinc synthetic fluid inclusions and well-defined natural
inclusions in Alpine quartz; melting of pure CO2 (-56.6°C), melting of water ice (0°C), critical
homogenisation of CO2 (31.1°C) and critical homogenisation of water (374.1°C). The reproducibility
is ±0.1°C for temperatures below +40°C and ±0.5°C for temperatures above +40°C.
Prior to the measurements, the samples were studied in the petrographic microscope and mapped in
detail. Two samples were selected for fluid inclusions measurements (SA12012 and SA12039). The
wafers were carefully broken up into smaller pieces, which had been marked earlier, and put into the
20
sample chamber for the heating and cooling stage. The area of interest in the sample was then
localised using the optical microscope. Suitable inclusions were analysed by either increasing or
decreasing the temperature and observing the phase changes (freezing, melting or homogenisation) in
the microscope and specific temperatures read from the instrument were noted. The few analysed
inclusions is due to the limited time allocated to the fluid inclusion analysis.
Solid phases were also analysed using micro-Raman spectroscopy. Raman spectroscopy utilises the
so-called Raman scattering or inelastic scattering of monochromatic visible light, usually near the
infrared or ultraviolet range. Basically, the light illuminated on the sample interacts with atomic or
molecular vibrations in the sample. The incident light excites the systems to a short-lived virtual high-
energy state due to the much higher phonon energy (vibrational quanta) in the visible light compared
to the difference in vibrational states in the atom or molecule. Most of the photons are scattered (“re-
radiates”) with the same energy as the incident light, a process called Rayleigh scattering or elastic
scattering, but immediately returns to its original vibrational state. However, some photons may
recover to a higher or lower energy state compared to its original vibrational state. This process is
called Raman scattering, whereas the energy difference in relation to the Rayleigh line is referred to as
the Raman effect. The process when a photon recovers to a higher energy state (photons lose energy,
phonons gain energy) is referred to as Stokes-type Raman scattering whereas the reverse process is
referred to as anti-Stokes Raman scattering. The energy difference is measured in relation to the
Rayleigh energy, and the deviation from that energy is called the Raman shift. Raman scattering is
dependent on the polarisability of a molecule or atom, thus, deformation on the electron cloud and
therefore a change in polarisability is necessary in order for Raman scattering to occur. During
measurements, it is normal to only the record the Stokes-type Raman shift, as both are equal in energy
but Stokes bands have much higher intensity. The corresponding spectrum is a plot of light intensity
(usually counts per second) versus the photon energy (or the Raman shift; the wavenumber in cm-1
).
The Raman bands in a spectrum reflect the different frequencies in which atoms or molecules vibrate
in the sample, and by comparing with known spectra, unknown minerals or other compounds can be
determined (Nasdala et al., 2004). The analyses were conducted using a laser Raman confocal
spectrometer (Horiba instrument LabRAM HR 800) equipped with a multichannel air-cooled CCD
detector at the Fluid Inclusions Laboratory at the Department of Geological Sciences at Stockholm
University. An Ar-ion laser (λ=514 nm) was used as the excitation source with an output power at the
sample of 8 mW. The instrument was integrated with an Olympus microscope and the laser beam
focused to a spot size of 1 µm with a 100x objective. The spectral resolution was about 0.3 cm-1
. The
instrument was calibrated using a neon lamp and the Raman line of a silicon wafer (520.7 cm-1
).
Instrument control and data acquisition was conducted with LabSpec 5 software.
21
3.8 Deformation and remobilisation of ore minerals
Ore minerals, like rock-forming minerals, respond differently when exposed to the changes in pressure
and temperature conditions attained during e.g. an orogenic event. It is well-established from dry-state
experimental work that for certain P-T regimes, most of the common sulphide minerals will deform in
a ductile manner while other sulphides and oxides tends to deform in a brittle manner under the same
conditions (Gill, 1969; Vokes, 1969; Graf & Skinner, 1970; Atkinson, 1977; Gilligan & Marshall,
1987; Marshall & Gilligan, 1987; Skinner & Johnson, 1987; Craig & Vokes, 1993; Gilligan &
Marshall, 1993; Vokes & Craig, 1993). Of the most common sulphides, galena passes through the
brittle-ductile transition at very low conditions (<50°C, <50 MPa; Fig. 6), i.e. galena is the most
ductile sulphide (Marshall & Gilligan, 1987). Sphalerite remains in the brittle zone up to 300°, but is
sensitive to pressure, i.e. it is one of the less ductile sulphide minerals at medium temperature.
Chalcopyrite and pyrrhotite behave rather similar but chalcopyrite is more sensitive to temperature
whereas pyrrhotite to pressure (Fig. 6). Under regional metamorphic conditions (greenschist to
amphibolite facies) pyrrhotite may be as easily deformed as galena (Marshall & Gilligan, 1987). Graf
& Skinner (1987) also showed that pyrrhotite readily behaves in a ductile way at temperatures as low
as 100°C. Pyrite, since it is the most widespread sulphide mineral, has been studied extensively (e.g.
Gill, 1969; Graf & Skinner, 1970; McClay & Ellis, 1983; Barrie et al., 2011). Earlier work suggested
that pyrite essentially deformed by brittle processes at all conditions (Graf, 1969; Graf & Skinner;
1970) whereas McClay & Ellis (1983) compiled a deformation mechanism map illustrating that
crystalplastic processes may be of significance at temperatures as low as c. 450°C. A newly refined
map and evidence from naturally deformed pyrite even points to crystalplastic deformation, e.g.
dislocation creep, at temperatures as low as 200-260°C (Barrie et al., 2011). However, pyrite is still
one of the most mechanically resistant sulphide minerals, and during normal regional metamorphic
conditions, (greenschist to amphibolite facies), pyrite behave brittle, which is evident from many
naturally deformed pyrites (e.g. Craig & Vokes, 1993; Vokes & Craig; 1993). For arsenopyrite, less
experimental work has been conducted, but it is also a more competent mineral with similar features
as pyrite (Gilligan & Marshall, 1987). Another common ore mineral, magnetite behaves similarly to
pyrite (Gilligan & Marshall, 1987; Till & Moskowitz, 2013).
It is important to emphasise that all available data are from dry-state experiments under strain rates
significantly higher than during natural conditions. Thus, experimental data should be seen as
reflecting the upper limits of the behaviour of these phases. Nevertheless, a general relative order in
competence for the common ore minerals is still applicable; (from the least competent to the most
competent, at 500°C) galena, pyrrhotite, chalcopyrite, sphalerite, and pyrite (arsenopyrite, magnetite)
(Marshall & Gilligan, 1987). At lower temperatures, the position of chalcopyrite shifts towards the
higher strength minerals.
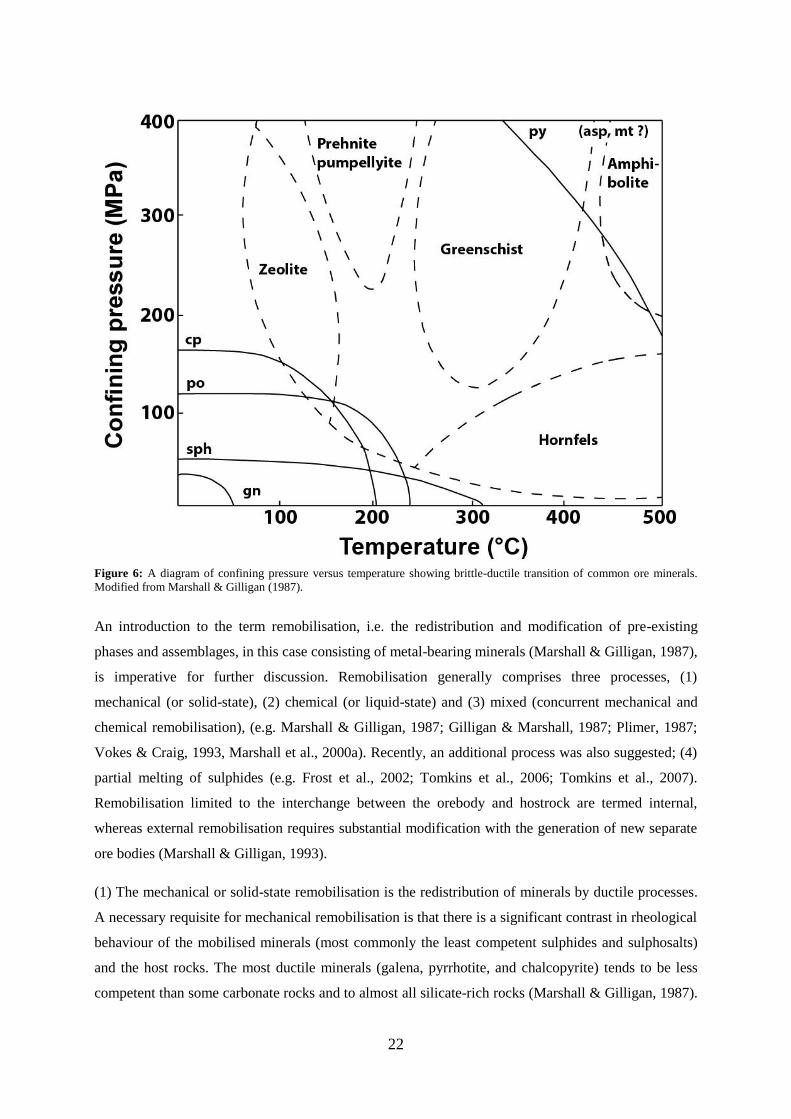
22
Figure 6: A diagram of confining pressure versus temperature showing brittle-ductile transition of common ore minerals.
Modified from Marshall & Gilligan (1987).
An introduction to the term remobilisation, i.e. the redistribution and modification of pre-existing
phases and assemblages, in this case consisting of metal-bearing minerals (Marshall & Gilligan, 1987),
is imperative for further discussion. Remobilisation generally comprises three processes, (1)
mechanical (or solid-state), (2) chemical (or liquid-state) and (3) mixed (concurrent mechanical and
chemical remobilisation), (e.g. Marshall & Gilligan, 1987; Gilligan & Marshall, 1987; Plimer, 1987;
Vokes & Craig, 1993, Marshall et al., 2000a). Recently, an additional process was also suggested; (4)
partial melting of sulphides (e.g. Frost et al., 2002; Tomkins et al., 2006; Tomkins et al., 2007).
Remobilisation limited to the interchange between the orebody and hostrock are termed internal,
whereas external remobilisation requires substantial modification with the generation of new separate
ore bodies (Marshall & Gilligan, 1993).
(1) The mechanical or solid-state remobilisation is the redistribution of minerals by ductile processes.
A necessary requisite for mechanical remobilisation is that there is a significant contrast in rheological
behaviour of the mobilised minerals (most commonly the least competent sulphides and sulphosalts)
and the host rocks. The most ductile minerals (galena, pyrrhotite, and chalcopyrite) tends to be less
competent than some carbonate rocks and to almost all silicate-rich rocks (Marshall & Gilligan, 1987).
23
Pyrite and other high-strength minerals are more competent than most silicate-rich rocks during most
conditions (Marshall & Gilligan, 1987). Phyllosilicate-rich rocks are highly ductile under regional
metamorphic conditions (Cook et al., 1993; Passchier & Trouw, 2005). The relative order for the
common sulphides described earlier seem to control the overall degree to which specific phases are
preferentially mechanically remobilised, i.e. galena, being among the most mobile ore minerals, is
very prone to remobilisation (Marshall & Gilligan, 1993). Remobilisation also depends strongly on the
abundance and relative proportions of the ore minerals present in a rock mass (Marshall & Gilligan,
1993). A rock with abundant galena, pyrrhotite and chalcopyrite in the temperature range of 350-
650°C, will be extremely incompetent and ductile whereas quartz-rich silicate rocks, although
weakened by the presence of fluids, often remain relatively competent (Marshall & Gilligan, 1987).
However, at the higher temperature end (>500°C), quartz-rich silicate rock and the sulphides exhibits
strength-convergence (i.e. with similar strengths and deformation mechanisms), which will inhibit any
extensive remobilisation (Marshall & Gilligan, 1993). Therefore, the largest contrast in strength seems
to exist at temperatures between 300°C and 500°C, and remobilisation should thus be most effective in
that range. During a regional tectonic event, prograde deformation features are likely obliterated and
overprinted by features established during retrograde activity (Marshall & Gilligan, 1987; Plimer,
1987). Remobilisation is also greatly influenced by the internal structure of the ore. A massive body of
sulphides will partition the strain during deformation in the entire body allowing it to act as a single
ductile unit. The single grains in disseminated ores basically acts the same way but will partition less
total strain. As a consequence, a massive sulphide body is more mobile and can be remobilised at the
scale of tens of metres whereas disseminated grains only relocate to the nearest dilatational site, e.g.
strain shadows of porphyroblastic minerals (Marshall & Gilligan, 1987; Marshall et al., 2000a). With
these aspects in mind, it appears quite straightforward to describe the mechanical remobilisation.
However, since many ore minerals, like most other minerals, may readily re-equilibrate and
recrystallise as a respond to deformation, crystalplastic mechanisms (like dislocation glide) that
indicate plastic flow are often not preserved (Marshall & Gilligan, 1987; Skinner & Johnson, 1987).
Yet, textures that reflected large rheological contrasts may still be present and can supply important
information about the history of deformation and mechanical remobilisation.
(2) Chemical or liquid-state remobilisation causes redistribution of ore minerals in the presence of a
fluid-phase in a process called solution-transfer (fluid-assisted or „wet‟ diffusion and advective
transfer). The dissolved materials is transported and typically precipitated in dilatational sites such as
strain shadows and veins (e.g. Marshall et al., 2000a; Passchier & Trouw, 2005). Fluids in prograde
metamorphic systems are primarily derived from devolatilisation of hydrated or hydroxylated silicates
as sulphides generally do not liberate significant quantities of fluids (Marshall & Gilligan, 1987;
Marshall et al., 2000a; Yardley & Cleverley, 2013), but can also derive from pore water trapped from
low-temperature dewatering by sedimentary processes (Marshall et al., 2000a). As a consequence of
24
the low fluid-generating capacity of sulphides, remobilisation during prograde metamorphism can only
occur if the proportions of silicate rocks to sulphides are sufficient for devolatilasation. In a
disseminated deposit, where the ratio is rather high and where the permeability may be sufficiently
high (Yardley & Cleverley, 2013), remobilisation is more likely to occur than for massive sulphide
bodies where permeability is low and the proportion of silicate versus sulphides are low. Only the
outermost parts of the sulphide body can then undergo chemical remobilisation whereas the central
part of the sulphide bodies will more readily be remobilised by crystalplastic processes (Marshall &
Gilligan, 1987). However, fluid infiltration in massive sulphide bodies is still possible due to
microfracturing and uneven strain partitioning as a consequence of variable mineral compositions
within the body (Marshall et al., 2000a). Therefore, the most favourable conditions for more
pronounced chemical remobilisation of sulphide mineralisations probably occur during retrogressive
shear zone activity (Gilligan & Marshall, 1987). Upon cooling, any pore fluid that is available is likely
to be consumed by retrograde reactions. This makes the rock relatively dry and potentially susceptible
for migration of external fluids through the rock via fractures or other suitable pathways. If the
dissolution of components from the rock is sufficient, further retrograde reactions and remobilisation
may be initiated (Yardley & Cleverley, 2013). Dissolution depends on the relative fluid/rock
proportions. A high fluid/rock ratio and higher flow rates than reactions rates will promote a
continuous dissolution and movement of an undersaturated fluid. For a low fluid/rock ratio, the fluid
will eventually be buffered by the adjacent rock, since reactions rates will be higher than the flow rates
(Marshall & Gilligan, 1987).
(3) Even though mechanical and chemical remobilisation is described separately, these processes
benefit greatly from each other and are probably often contemporaneous. Evidence for exclusively
mechanical remobilisation is relatively scarce and it is very likely that an input from fluid-related
processes is important for remobilisation at all scales (Marshall et al., 2000a). The presence of a fluid
can for instance facilitate plastic flow processes, lower the conditions in which minerals are
susceptible to remobilisation by mechanical processes and generally decrease rock strength as well as
allow hydrofracturing (Plimer, 1987; Marshall et al. 2000a).
(4) Although the importance of remobilisation by partial melting in sulphides is rather controversial,
during metamorphism and under suitable conditions, it is possible for a partial sulphide melt to be
generated. Even small proportions of melt can be very mobile due to their low viscosities (Tomkins et
al., 2007). Separately, the ore minerals are quite resistant to melting, but in a mixed ore assemblage
where several sulphide minerals coexist, the melting point can be reduced significantly (Tomkins et
al., 2007). For an assemblage rich in sulphosalts and tellurides, melt can be generated at lower
greenschist to amphibolite facies conditions. If such low melting-point phases are absent in a deposit,
it may only melt at significantly higher temperatures, if at all, most likely at upper amphibolite facies
conditions (Tomkins et al., 2007). Sulphur fugacity can also play an important role in generating melt.
25
In a system with arsenopyrite and low sulphur fugacity, the major reactions (e.g. Py + Asp = As – Smelt
+ FeS) that are important in generating melt may be completely ineffective (Tomkins et al., 2007).
However, if the sulphur fugacity is kept high during metamorphism, commonly in pyrite-rich deposit
where decomposition of pyrite to pyrrhotite is promoted, arsenopyrite can melt at temperatures as low
as 490°C at 100 MPa or c. 560°C at 500 MPa (Tomkins et al., 2006). The volumes that are produced
during melting are in most cases very low, although high concentrations can be achieved in local
volumes of an ore rich in low melting-point phases. Thus, extensive remobilisation is unlikely and any
melt that is generated commonly migrates into the nearest dilatational site (Tomkins et al., 2007).
Melts that do form in the temperature range 500-600°C will commonly be enriched in Ag, As, Au, Bi,
Hg, Sb, Se, Sn, Tl and Te, and accumulated in rare sulphosalt assemblages often at dilatational sites
(Frost et al., 2002). Partial melting of base-metal deposits is probably only likely to occur during upper
amphibolite facies to granulite facies metamorphism expect if they are significantly abundant in low
melting points minerals or if sulphur fugacity is kept high.
26
4. Results
4.1 Ore mineralogy and textural relations
The most conspicuous ore minerals in the present study are galena, pyrrhotite, arsenopyrite and
magnetite. Chalcopyrite is less abundant. Pyrite and sphalerite are only minor ore constituents, but
pyrite can be fairly abundant in some samples. Sulphosalts are mostly present in trace amounts, except
for boulangerite and meneghinite which both can be the dominant ore minerals in some of the
samples. The samples are dominated by quartz as gangue mineral with minor phyllosilicates (both
biotite and muscovite have been identified from EDS analysis), often occurring with a preferred
orientation, defining a weak foliation. Garnet (mainly almandine have been identified from EDS
analysis), is also very commonly associated with the phyllosilicates. Additionally, amphiboles occur,
of which some have been identified using EDS technique. Typical ore assemblages are shown in
Figure 7. A summary of ore minerals at Hornkullen are presented in Table 2. Abbreviations used are;
gn (galena), po (pyrrhotite), cp (chalcopyrite), asp (arsenopyrite), py (pyrite), sph (sphalerite), mt
(magnetite), il (ilmenite), bou (boulangerite), men (meneghinite), tet (tetrehedrite), pg (pyrargyrite),
gud (gudmundite), qz (quartz), grt (garnet), ph (phyllosilicates), am (amphibole) and goe (goethite).
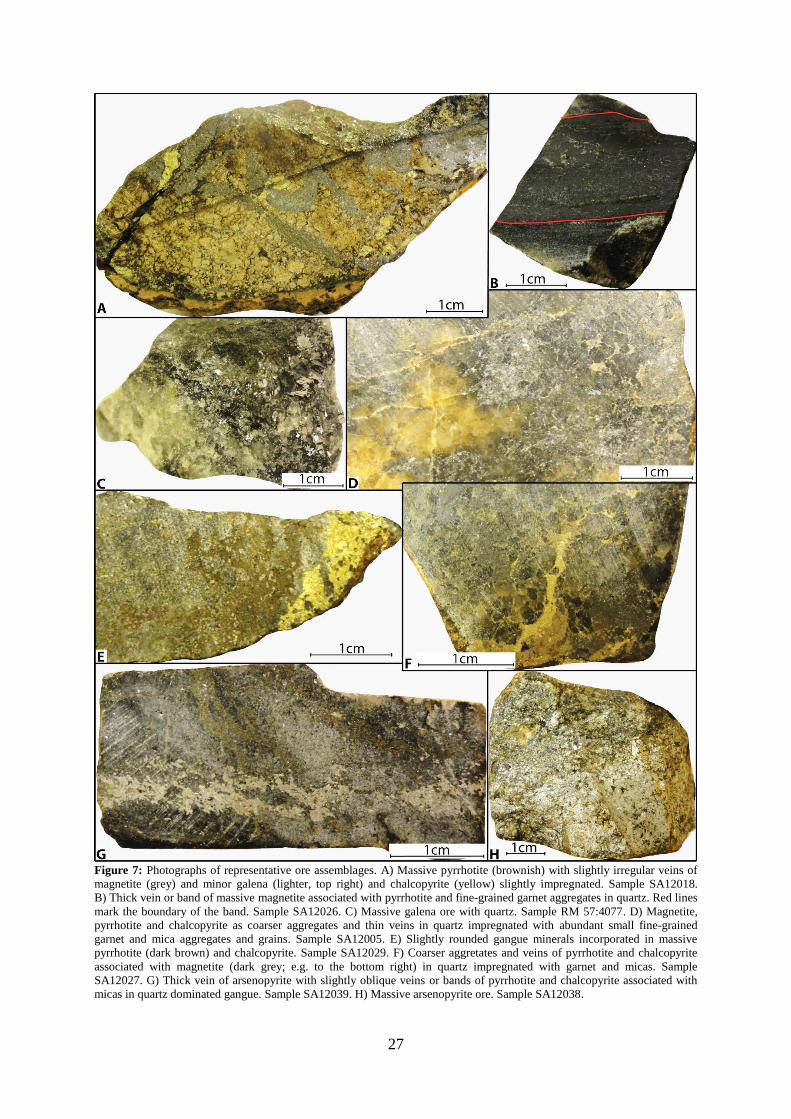
27
Figure 7: Photographs of representative ore assemblages. A) Massive pyrrhotite (brownish) with slightly irregular veins of
magnetite (grey) and minor galena (lighter, top right) and chalcopyrite (yellow) slightly impregnated. Sample SA12018.
B) Thick vein or band of massive magnetite associated with pyrrhotite and fine-grained garnet aggregates in quartz. Red lines
mark the boundary of the band. Sample SA12026. C) Massive galena ore with quartz. Sample RM 57:4077. D) Magnetite,
pyrrhotite and chalcopyrite as coarser aggregates and thin veins in quartz impregnated with abundant small fine-grained
garnet and mica aggregates and grains. Sample SA12005. E) Slightly rounded gangue minerals incorporated in massive
pyrrhotite (dark brown) and chalcopyrite. Sample SA12029. F) Coarser aggretates and veins of pyrrhotite and chalcopyrite
associated with magnetite (dark grey; e.g. to the bottom right) in quartz impregnated with garnet and micas. Sample
SA12027. G) Thick vein of arsenopyrite with slightly oblique veins or bands of pyrrhotite and chalcopyrite associated with
micas in quartz dominated gangue. Sample SA12039. H) Massive arsenopyrite ore. Sample SA12038.
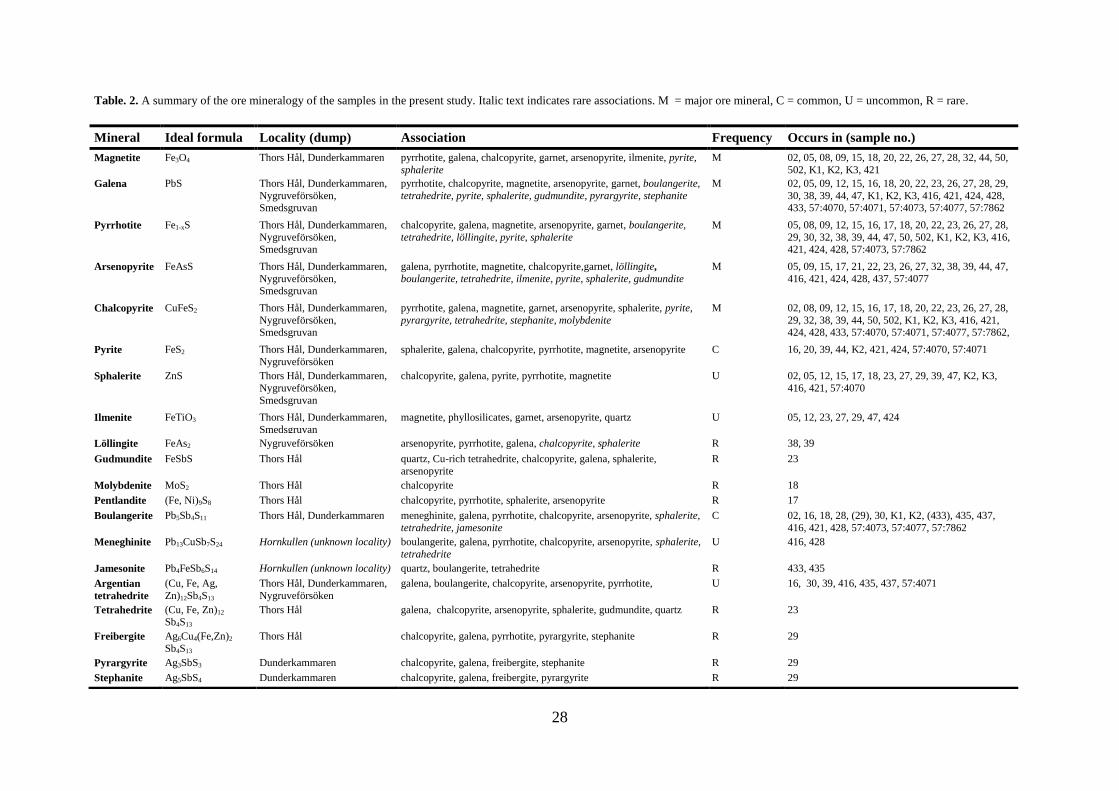
28
Table. 2. A summary of the ore mineralogy of the samples in the present study. Italic text indicates rare associations. M = major ore mineral, C = common, U = uncommon, R = rare.
Mineral Ideal formula Locality (dump) Association Frequency Occurs in (sample no.)
Magnetite
Fe3O4
Thors Hål, Dunderkammaren
pyrrhotite, galena, chalcopyrite, garnet, arsenopyrite, ilmenite, pyrite,
sphalerite
M
02, 05, 08, 09, 15, 18, 20, 22, 26, 27, 28, 32, 44, 50,
502, K1, K2, K3, 421
Galena
PbS
Thors Hål, Dunderkammaren,
Nygruveförsöken, Smedsgruvan
pyrrhotite, chalcopyrite, magnetite, arsenopyrite, garnet, boulangerite,
tetrahedrite, pyrite, sphalerite, gudmundite, pyrargyrite, stephanite
M
02, 05, 09, 12, 15, 16, 18, 20, 22, 23, 26, 27, 28, 29,
30, 38, 39, 44, 47, K1, K2, K3, 416, 421, 424, 428, 433, 57:4070, 57:4071, 57:4073, 57:4077, 57:7862
Pyrrhotite
Fe1-xS
Thors Hål, Dunderkammaren,
Nygruveförsöken, Smedsgruvan
chalcopyrite, galena, magnetite, arsenopyrite, garnet, boulangerite,
tetrahedrite, löllingite, pyrite, sphalerite
M
05, 08, 09, 12, 15, 16, 17, 18, 20, 22, 23, 26, 27, 28,
29, 30, 32, 38, 39, 44, 47, 50, 502, K1, K2, K3, 416, 421, 424, 428, 57:4073, 57:7862
Arsenopyrite
FeAsS
Thors Hål, Dunderkammaren,
Nygruveförsöken, Smedsgruvan
galena, pyrrhotite, magnetite, chalcopyrite,garnet, löllingite,
boulangerite, tetrahedrite, ilmenite, pyrite, sphalerite, gudmundite
M
05, 09, 15, 17, 21, 22, 23, 26, 27, 32, 38, 39, 44, 47,
416, 421, 424, 428, 437, 57:4077
Chalcopyrite
CuFeS2
Thors Hål, Dunderkammaren,
Nygruveförsöken, Smedsgruvan
pyrrhotite, galena, magnetite, garnet, arsenopyrite, sphalerite, pyrite,
pyrargyrite, tetrahedrite, stephanite, molybdenite
M
02, 08, 09, 12, 15, 16, 17, 18, 20, 22, 23, 26, 27, 28,
29, 32, 38, 39, 44, 50, 502, K1, K2, K3, 416, 421, 424, 428, 433, 57:4070, 57:4071, 57:4077, 57:7862,
Pyrite
FeS2
Thors Hål, Dunderkammaren,
Nygruveförsöken
sphalerite, galena, chalcopyrite, pyrrhotite, magnetite, arsenopyrite C
16, 20, 39, 44, K2, 421, 424, 57:4070, 57:4071
Sphalerite
ZnS
Thors Hål, Dunderkammaren,
Nygruveförsöken,
Smedsgruvan
chalcopyrite, galena, pyrite, pyrrhotite, magnetite
U
02, 05, 12, 15, 17, 18, 23, 27, 29, 39, 47, K2, K3,
416, 421, 57:4070
Ilmenite
FeTiO3
Thors Hål, Dunderkammaren,
Smedsgruvan
magnetite, phyllosilicates, garnet, arsenopyrite, quartz
U
05, 12, 23, 27, 29, 47, 424
Löllingite FeAs2 Nygruveförsöken arsenopyrite, pyrrhotite, galena, chalcopyrite, sphalerite R 38, 39
Gudmundite
FeSbS
Thors Hål
quartz, Cu-rich tetrahedrite, chalcopyrite, galena, sphalerite,
arsenopyrite
R
23
Molybdenite MoS2 Thors Hål chalcopyrite R 18
Pentlandite (Fe, Ni)9S8 Thors Hål chalcopyrite, pyrrhotite, sphalerite, arsenopyrite R 17
Boulangerite
Pb5Sb4S11
Thors Hål, Dunderkammaren
meneghinite, galena, pyrrhotite, chalcopyrite, arsenopyrite, sphalerite,
tetrahedrite, jamesonite
C
02, 16, 18, 28, (29), 30, K1, K2, (433), 435, 437,
416, 421, 428, 57:4073, 57:4077, 57:7862
Meneghinite Pb13CuSb7S24 Hornkullen (unknown locality) boulangerite, galena, pyrrhotite, chalcopyrite, arsenopyrite, sphalerite,
tetrahedrite
U 416, 428
Jamesonite Pb4FeSb6S14 Hornkullen (unknown locality) quartz, boulangerite, tetrahedrite R 433, 435
Argentian
tetrahedrite
(Cu, Fe, Ag,
Zn)12Sb4S13
Thors Hål, Dunderkammaren,
Nygruveförsöken
galena, boulangerite, chalcopyrite, arsenopyrite, pyrrhotite, U
16, 30, 39, 416, 435, 437, 57:4071
Tetrahedrite (Cu, Fe, Zn)12
Sb4S13 Thors Hål galena, chalcopyrite, arsenopyrite, sphalerite, gudmundite, quartz R 23
Freibergite Ag6Cu4(Fe,Zn)2
Sb4S13
Thors Hål chalcopyrite, galena, pyrrhotite, pyrargyrite, stephanite R 29
Pyrargyrite Ag3SbS3 Dunderkammaren chalcopyrite, galena, freibergite, stephanite R 29
Stephanite Ag5SbS4 Dunderkammaren chalcopyrite, galena, freibergite, pyrargyrite R 29
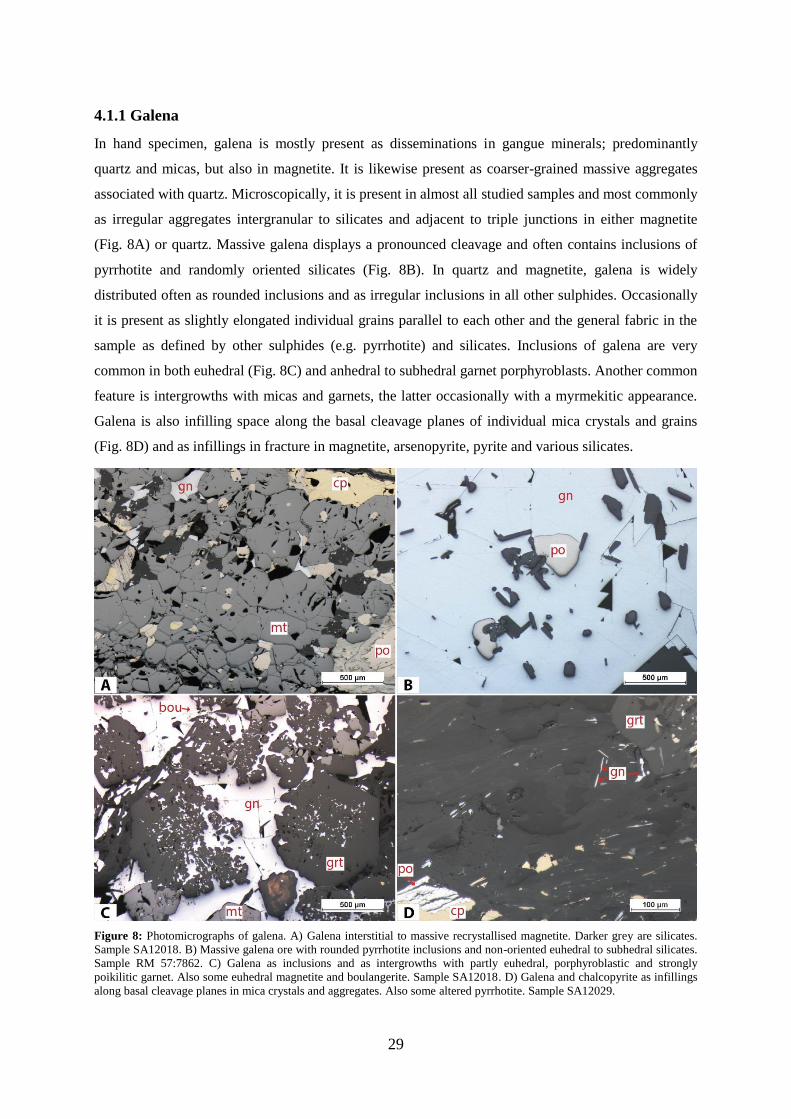
29
4.1.1 Galena
In hand specimen, galena is mostly present as disseminations in gangue minerals; predominantly
quartz and micas, but also in magnetite. It is likewise present as coarser-grained massive aggregates
associated with quartz. Microscopically, it is present in almost all studied samples and most commonly
as irregular aggregates intergranular to silicates and adjacent to triple junctions in either magnetite
(Fig. 8A) or quartz. Massive galena displays a pronounced cleavage and often contains inclusions of
pyrrhotite and randomly oriented silicates (Fig. 8B). In quartz and magnetite, galena is widely
distributed often as rounded inclusions and as irregular inclusions in all other sulphides. Occasionally
it is present as slightly elongated individual grains parallel to each other and the general fabric in the
sample as defined by other sulphides (e.g. pyrrhotite) and silicates. Inclusions of galena are very
common in both euhedral (Fig. 8C) and anhedral to subhedral garnet porphyroblasts. Another common
feature is intergrowths with micas and garnets, the latter occasionally with a myrmekitic appearance.
Galena is also infilling space along the basal cleavage planes of individual mica crystals and grains
(Fig. 8D) and as infillings in fracture in magnetite, arsenopyrite, pyrite and various silicates.
Figure 8: Photomicrographs of galena. A) Galena interstitial to massive recrystallised magnetite. Darker grey are silicates.
Sample SA12018. B) Massive galena ore with rounded pyrrhotite inclusions and non-oriented euhedral to subhedral silicates.
Sample RM 57:7862. C) Galena as inclusions and as intergrowths with partly euhedral, porphyroblastic and strongly
poikilitic garnet. Also some euhedral magnetite and boulangerite. Sample SA12018. D) Galena and chalcopyrite as infillings
along basal cleavage planes in mica crystals and aggregates. Also some altered pyrrhotite. Sample SA12029.
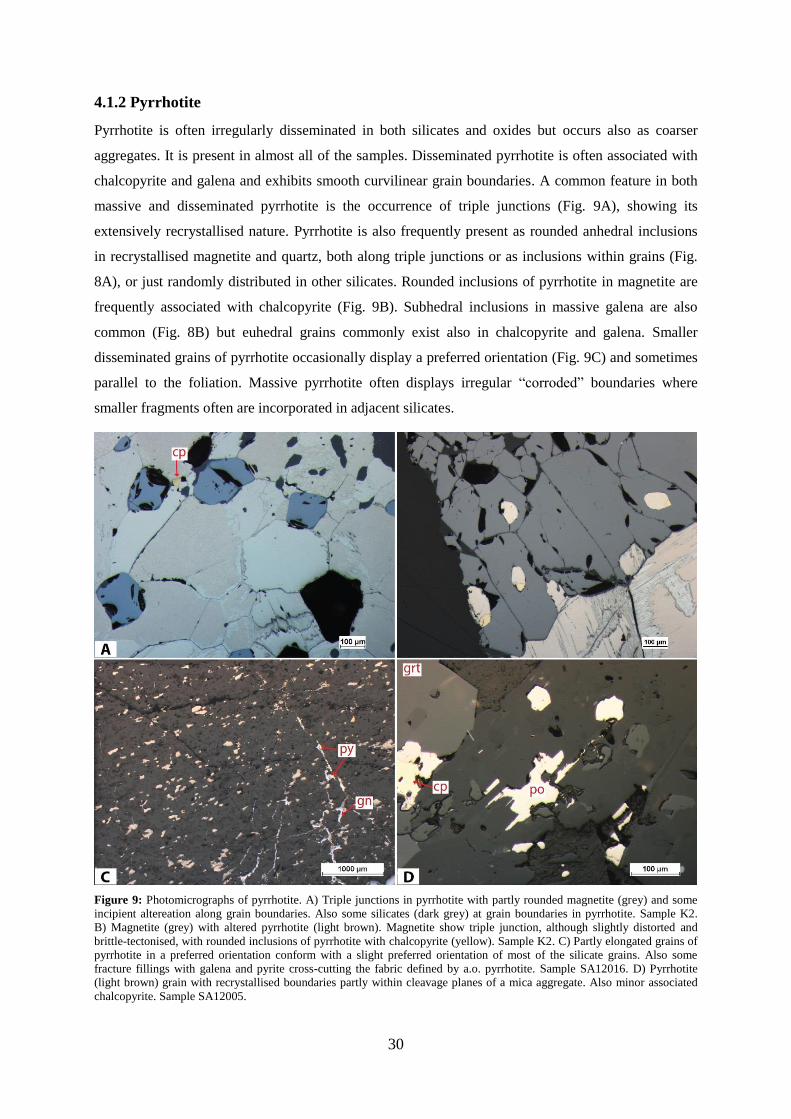
30
4.1.2 Pyrrhotite
Pyrrhotite is often irregularly disseminated in both silicates and oxides but occurs also as coarser
aggregates. It is present in almost all of the samples. Disseminated pyrrhotite is often associated with
chalcopyrite and galena and exhibits smooth curvilinear grain boundaries. A common feature in both
massive and disseminated pyrrhotite is the occurrence of triple junctions (Fig. 9A), showing its
extensively recrystallised nature. Pyrrhotite is also frequently present as rounded anhedral inclusions
in recrystallised magnetite and quartz, both along triple junctions or as inclusions within grains (Fig.
8A), or just randomly distributed in other silicates. Rounded inclusions of pyrrhotite in magnetite are
frequently associated with chalcopyrite (Fig. 9B). Subhedral inclusions in massive galena are also
common (Fig. 8B) but euhedral grains commonly exist also in chalcopyrite and galena. Smaller
disseminated grains of pyrrhotite occasionally display a preferred orientation (Fig. 9C) and sometimes
parallel to the foliation. Massive pyrrhotite often displays irregular “corroded” boundaries where
smaller fragments often are incorporated in adjacent silicates.
Figure 9: Photomicrographs of pyrrhotite. A) Triple junctions in pyrrhotite with partly rounded magnetite (grey) and some
incipient altereation along grain boundaries. Also some silicates (dark grey) at grain boundaries in pyrrhotite. Sample K2.
B) Magnetite (grey) with altered pyrrhotite (light brown). Magnetite show triple junction, although slightly distorted and
brittle-tectonised, with rounded inclusions of pyrrhotite with chalcopyrite (yellow). Sample K2. C) Partly elongated grains of
pyrrhotite in a preferred orientation conform with a slight preferred orientation of most of the silicate grains. Also some
fracture fillings with galena and pyrite cross-cutting the fabric defined by a.o. pyrrhotite. Sample SA12016. D) Pyrrhotite
(light brown) grain with recrystallised boundaries partly within cleavage planes of a mica aggregate. Also minor associated
chalcopyrite. Sample SA12005.

31
Pyrrhotite is also found partly in direct contact with as well as enclosing massive and vein-type
arsenopyrite and as irregular smaller inclusions in the arsenopyrite grains. Inclusions, as both smaller
and larger aggregates in euhedral and anhedral garnet porphyroblasts are abundant. Intergrowths with
phyllosilicates and occasionally garnets are sporadically occurring as is remobilised pyrrhotite
between silicate grains, mostly along cleavage planes of mica grains (Fig. 9D).
In one of the samples (SA12017), pyrrhotite occurs together with chalcopyrite in the strain shadows of
larger, possibly rotated quartz aggregates. In the same sample, pyrrhotite appears together with
chalcopyrite and arsenopyrite in tension gashes within the quartz aggregate. Breakdown of pyrrhotite
to marcasite, pyrite and minor magnetite is ubiquitous on several scales. Incipient alteration of
pyrrhotite to marcasite et alia is often observed along grain boundaries. Completely replaced grains of
pyrrhotite to marcasite, pyrite and magnetite (e.g. Fig. 8D) in a lamellar appearance is also common.
Alteration of pyrrhotite to pyrite without observed additional breakdown products is also present.
4.1.3 Arsenopyrite and löllingite
Arsenopyrite is mainly present as disseminated small subhedral to euhedral grains (from 50 to 500µm,
and up to 5mm) throughout most of the mineralisation. Locally, it also occurs as larger, massive
aggregates. These are often irregular and up to several centimetre in size (Fig. 7H), but can sometimes
also be confined to rather narrow veins (Fig. 7G). Disseminated subhedral to euhedral arsenopyrite is
occasionally parallel or subparallell with a preferred fabric in the sample, both microscopically and in
hand specimen. Massive or vein-type arsenopyrite usually displays euhedral morphology when
enclosed, wholly or partially in galena or pyrrhotite, but otherwise exhibiting irregular grain
boundaries with abundant silicate inclusions (Fig. 10A). Associated with massive aggregates are
sometimes grains that show a pronounced elongation variably aligned with other minerals (e.g.
phyllosilicates, galena and pyrrhotite). Smaller (50-500µm) subhedral to euhedral arsenopyrite grains
are widely distributed and commonly occurs either isolated or with other sulphides, e.g. in pyrrhotite,
or in aggregates with galena, chalcopyrite, pyrrhotite and occasionally sulphosalts, within magnetite or
silicates. Larger euhedral grains (500µm to 5mm) typically occur in magnetite (Fig. 10B). In one
sample (SA12017), partly euhedral arsenopyrite occurs together with pyrrhotite and chalcopyrite in
tension gashes within possibly rotated quartz aggregates. Inclusions in euhedral garnet porphyroblasts
is occasionally present. Larger aggregates typically display evidence of some brittle deformation (Fig.
10C) whereas smaller grains do not. In some cases, fractures are filled with silicates and galena, and
some arsenopyrite grains show corroded grain boundaries. Occasionally, arsenopyrite appears to be
replaced by adjacent quartz (Fig. 10D).
Löllingite is present as irregular, often elongated inclusions in arsenopyrite (Fig. 11A), which often
have a tendency to be aligned in the same orientation as with other grains. Löllingite is also present
along rims of arsenopyrite aggregates and some small arsenopyrite grains are also present as
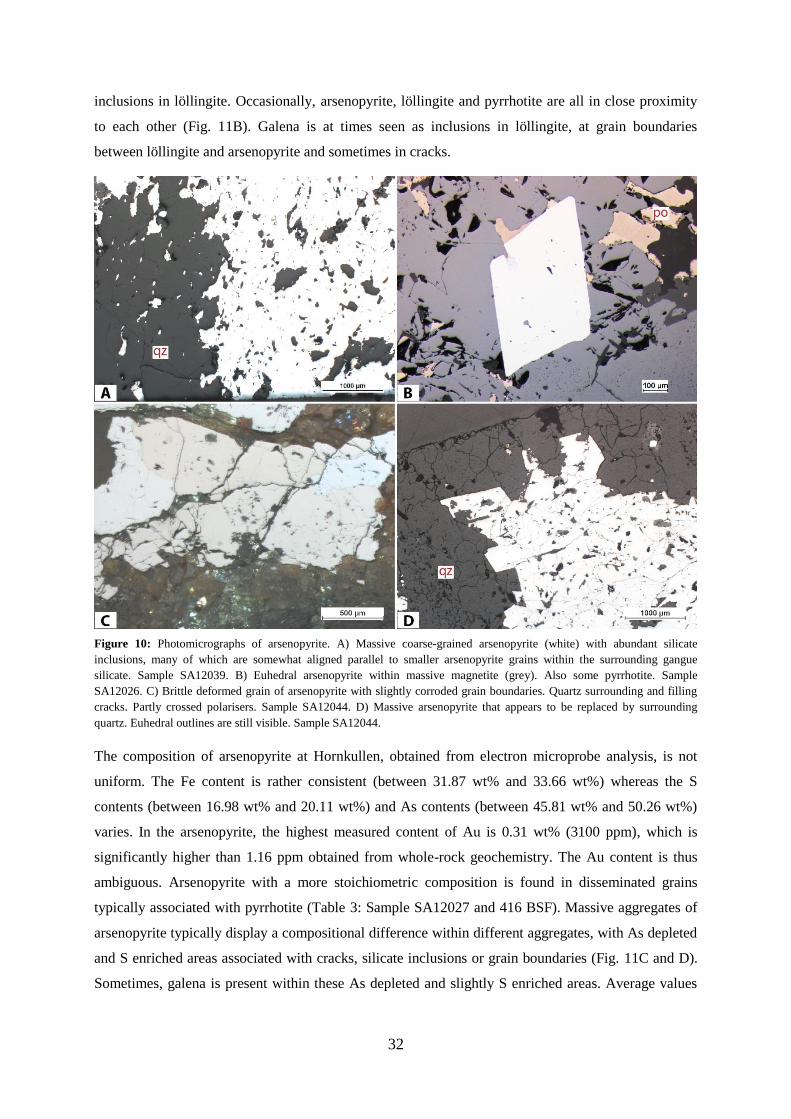
32
inclusions in löllingite. Occasionally, arsenopyrite, löllingite and pyrrhotite are all in close proximity
to each other (Fig. 11B). Galena is at times seen as inclusions in löllingite, at grain boundaries
between löllingite and arsenopyrite and sometimes in cracks.
Figure 10: Photomicrographs of arsenopyrite. A) Massive coarse-grained arsenopyrite (white) with abundant silicate
inclusions, many of which are somewhat aligned parallel to smaller arsenopyrite grains within the surrounding gangue
silicate. Sample SA12039. B) Euhedral arsenopyrite within massive magnetite (grey). Also some pyrrhotite. Sample
SA12026. C) Brittle deformed grain of arsenopyrite with slightly corroded grain boundaries. Quartz surrounding and filling
cracks. Partly crossed polarisers. Sample SA12044. D) Massive arsenopyrite that appears to be replaced by surrounding
quartz. Euhedral outlines are still visible. Sample SA12044.
The composition of arsenopyrite at Hornkullen, obtained from electron microprobe analysis, is not
uniform. The Fe content is rather consistent (between 31.87 wt% and 33.66 wt%) whereas the S
contents (between 16.98 wt% and 20.11 wt%) and As contents (between 45.81 wt% and 50.26 wt%)
varies. In the arsenopyrite, the highest measured content of Au is 0.31 wt% (3100 ppm), which is
significantly higher than 1.16 ppm obtained from whole-rock geochemistry. The Au content is thus
ambiguous. Arsenopyrite with a more stoichiometric composition is found in disseminated grains
typically associated with pyrrhotite (Table 3: Sample SA12027 and 416 BSF). Massive aggregates of
arsenopyrite typically display a compositional difference within different aggregates, with As depleted
and S enriched areas associated with cracks, silicate inclusions or grain boundaries (Fig. 11C and D).
Sometimes, galena is present within these As depleted and slightly S enriched areas. Average values
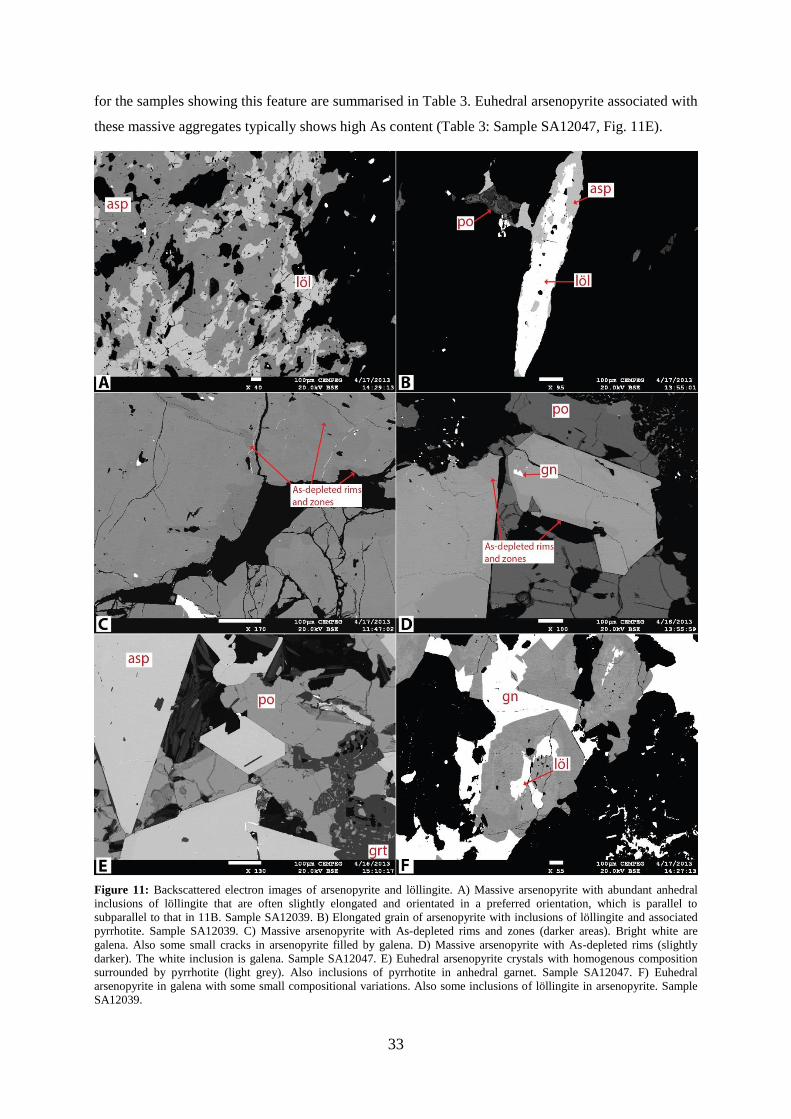
33
for the samples showing this feature are summarised in Table 3. Euhedral arsenopyrite associated with
these massive aggregates typically shows high As content (Table 3: Sample SA12047, Fig. 11E).
Figure 11: Backscattered electron images of arsenopyrite and löllingite. A) Massive arsenopyrite with abundant anhedral
inclusions of löllingite that are often slightly elongated and orientated in a preferred orientation, which is parallel to
subparallel to that in 11B. Sample SA12039. B) Elongated grain of arsenopyrite with inclusions of löllingite and associated
pyrrhotite. Sample SA12039. C) Massive arsenopyrite with As-depleted rims and zones (darker areas). Bright white are
galena. Also some small cracks in arsenopyrite filled by galena. D) Massive arsenopyrite with As-depleted rims (slightly
darker). The white inclusion is galena. Sample SA12047. E) Euhedral arsenopyrite crystals with homogenous composition
surrounded by pyrrhotite (light grey). Also inclusions of pyrrhotite in anhedral garnet. Sample SA12047. F) Euhedral
arsenopyrite in galena with some small compositional variations. Also some inclusions of löllingite in arsenopyrite. Sample
SA12039.
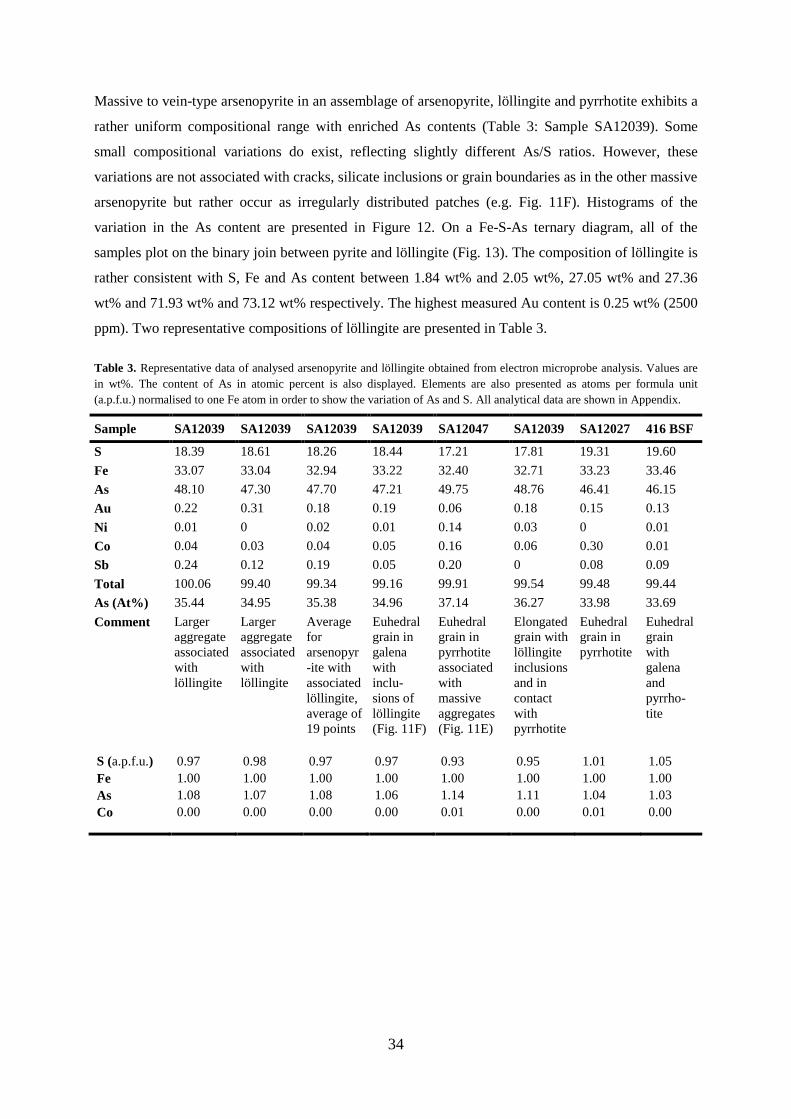
34
Massive to vein-type arsenopyrite in an assemblage of arsenopyrite, löllingite and pyrrhotite exhibits a
rather uniform compositional range with enriched As contents (Table 3: Sample SA12039). Some
small compositional variations do exist, reflecting slightly different As/S ratios. However, these
variations are not associated with cracks, silicate inclusions or grain boundaries as in the other massive
arsenopyrite but rather occur as irregularly distributed patches (e.g. Fig. 11F). Histograms of the
variation in the As content are presented in Figure 12. On a Fe-S-As ternary diagram, all of the
samples plot on the binary join between pyrite and löllingite (Fig. 13). The composition of löllingite is
rather consistent with S, Fe and As content between 1.84 wt% and 2.05 wt%, 27.05 wt% and 27.36
wt% and 71.93 wt% and 73.12 wt% respectively. The highest measured Au content is 0.25 wt% (2500
ppm). Two representative compositions of löllingite are presented in Table 3.
Table 3. Representative data of analysed arsenopyrite and löllingite obtained from electron microprobe analysis. Values are
in wt%. The content of As in atomic percent is also displayed. Elements are also presented as atoms per formula unit
(a.p.f.u.) normalised to one Fe atom in order to show the variation of As and S. All analytical data are shown in Appendix.
Sample SA12039 SA12039 SA12039 SA12039 SA12047 SA12039 SA12027 416 BSF
S 18.39 18.61 18.26 18.44 17.21 17.81 19.31 19.60
Fe 33.07 33.04 32.94 33.22 32.40 32.71 33.23 33.46
As 48.10 47.30 47.70 47.21 49.75 48.76 46.41 46.15
Au 0.22 0.31 0.18 0.19 0.06 0.18 0.15 0.13
Ni 0.01 0 0.02 0.01 0.14 0.03 0 0.01
Co 0.04 0.03 0.04 0.05 0.16 0.06 0.30 0.01
Sb 0.24 0.12 0.19 0.05 0.20 0 0.08 0.09
Total 100.06 99.40 99.34 99.16 99.91 99.54 99.48 99.44
As (At%) 35.44 34.95 35.38 34.96 37.14 36.27 33.98 33.69
Comment
Larger
aggregate
associated
with
löllingite
Larger
aggregate
associated
with
löllingite
Average
for
arsenopyr
-ite with
associated
löllingite,
average of
19 points
Euhedral
grain in
galena
with
inclu-
sions of
löllingite
(Fig. 11F)
Euhedral
grain in
pyrrhotite
associated
with
massive
aggregates
(Fig. 11E)
Elongated
grain with
löllingite
inclusions
and in
contact
with
pyrrhotite
Euhedral
grain in
pyrrhotite
Euhedral
grain
with
galena
and
pyrrho-
tite
S (a.p.f.u.)
(((((a.p.f.u.)
(a.p.f.u.)
0.97 0.98 0.97 0.97 0.93 0.95 1.01 1.05
Fe 1.00 1.00 1.00 1.00 1.00 1.00 1.00 1.00
As 1.08 1.07 1.08 1.06 1.14 1.11 1.04 1.03
Co
0.00
0.00 0.00 0.00 0.01 0.00 0.01 0.00
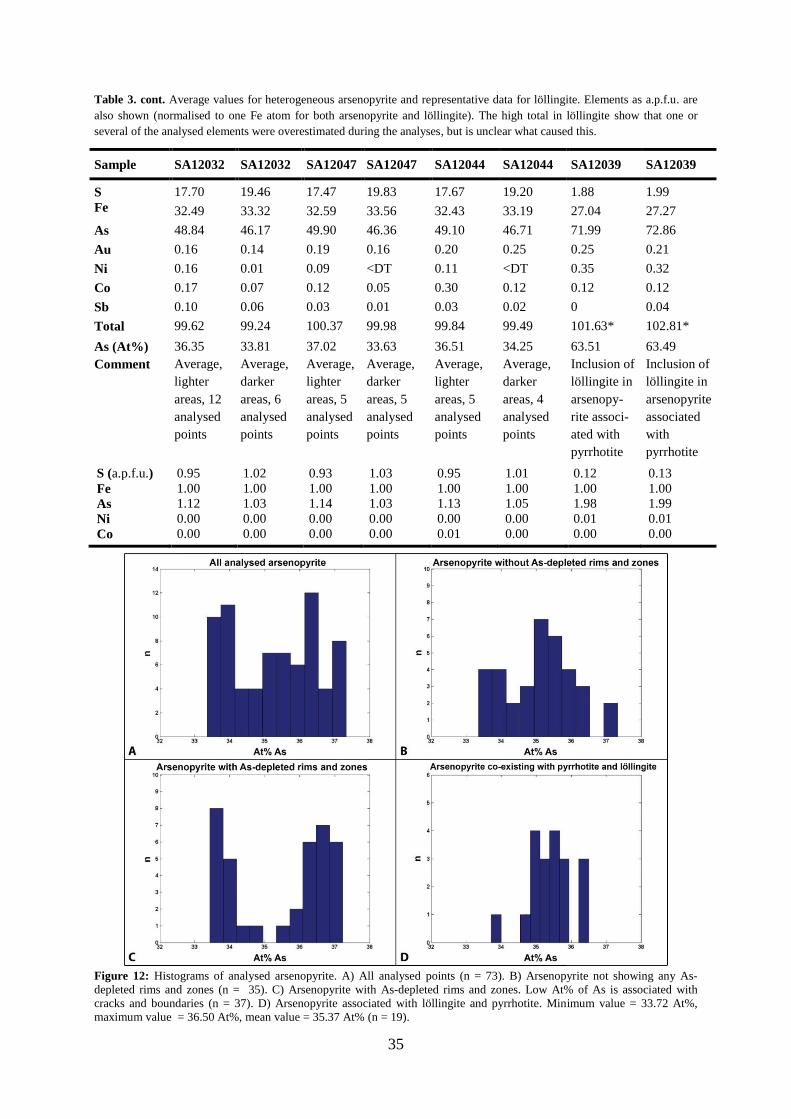
35
Table 3. cont. Average values for heterogeneous arsenopyrite and representative data for löllingite. Elements as a.p.f.u. are
also shown (normalised to one Fe atom for both arsenopyrite and löllingite). The high total in löllingite show that one or
several of the analysed elements were overestimated during the analyses, but is unclear what caused this.
Sample SA12032 SA12032 SA12047 SA12047 SA12044 SA12044 SA12039 SA12039
S 17.70 19.46 17.47 19.83 17.67 19.20 1.88 1.99
Fe 32.49 33.32 32.59 33.56 32.43 33.19 27.04 27.27
As 48.84 46.17 49.90 46.36 49.10 46.71 71.99 72.86
Au 0.16 0.14 0.19 0.16 0.20 0.25 0.25 0.21
Ni 0.16 0.01 0.09 <DT 0.11 <DT 0.35 0.32
Co 0.17 0.07 0.12 0.05 0.30 0.12 0.12 0.12
Sb 0.10 0.06 0.03 0.01 0.03 0.02 0 0.04
Total 99.62 99.24 100.37 99.98 99.84 99.49 101.63* 102.81*
As (At%) 36.35 33.81 37.02 33.63 36.51 34.25 63.51 63.49
Comment
Average,
lighter
areas, 12
analysed
points
Average,
darker
areas, 6
analysed
points
Average,
lighter
areas, 5
analysed
points
Average,
darker
areas, 5
analysed
points
Average,
lighter
areas, 5
analysed
points
Average,
darker
areas, 4
analysed
points
Inclusion of
löllingite in
arsenopy-
rite associ-
ated with
pyrrhotite
Inclusion of
löllingite in
arsenopyrite
associated
with
pyrrhotite
S (a.p.f.u.) 0.95 1.02 0.93 1.03 0.95 1.01 0.12 0.13
Fe 1.00 1.00 1.00 1.00 1.00 1.00 1.00 1.00
As 1.12 1.03 1.14 1.03 1.13 1.05 1.98 1.99
Ni 0.00 0.00 0.00 0.00 0.00 0.00 0.01 0.01
Co 0.00 0.00 0.00 0.00 0.01 0.00 0.00 0.00
Figure 12: Histograms of analysed arsenopyrite. A) All analysed points (n = 73). B) Arsenopyrite not showing any As-
depleted rims and zones (n = 35). C) Arsenopyrite with As-depleted rims and zones. Low At% of As is associated with
cracks and boundaries (n = 37). D) Arsenopyrite associated with löllingite and pyrrhotite. Minimum value = 33.72 At%,
maximum value = 36.50 At%, mean value = 35.37 At% (n = 19).
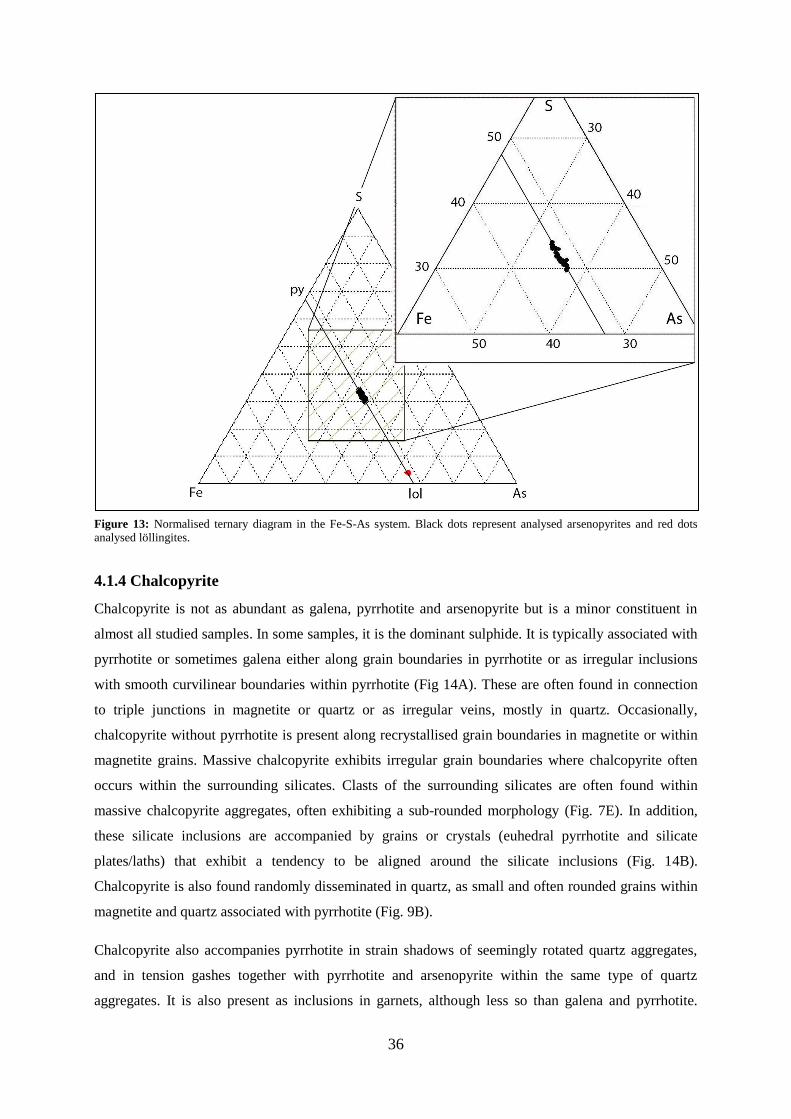
36
Figure 13: Normalised ternary diagram in the Fe-S-As system. Black dots represent analysed arsenopyrites and red dots analysed löllingites.
4.1.4 Chalcopyrite
Chalcopyrite is not as abundant as galena, pyrrhotite and arsenopyrite but is a minor constituent in
almost all studied samples. In some samples, it is the dominant sulphide. It is typically associated with
pyrrhotite or sometimes galena either along grain boundaries in pyrrhotite or as irregular inclusions
with smooth curvilinear boundaries within pyrrhotite (Fig 14A). These are often found in connection
to triple junctions in magnetite or quartz or as irregular veins, mostly in quartz. Occasionally,
chalcopyrite without pyrrhotite is present along recrystallised grain boundaries in magnetite or within
magnetite grains. Massive chalcopyrite exhibits irregular grain boundaries where chalcopyrite often
occurs within the surrounding silicates. Clasts of the surrounding silicates are often found within
massive chalcopyrite aggregates, often exhibiting a sub-rounded morphology (Fig. 7E). In addition,
these silicate inclusions are accompanied by grains or crystals (euhedral pyrrhotite and silicate
plates/laths) that exhibit a tendency to be aligned around the silicate inclusions (Fig. 14B).
Chalcopyrite is also found randomly disseminated in quartz, as small and often rounded grains within
magnetite and quartz associated with pyrrhotite (Fig. 9B).
Chalcopyrite also accompanies pyrrhotite in strain shadows of seemingly rotated quartz aggregates,
and in tension gashes together with pyrrhotite and arsenopyrite within the same type of quartz
aggregates. It is also present as inclusions in garnets, although less so than galena and pyrrhotite.
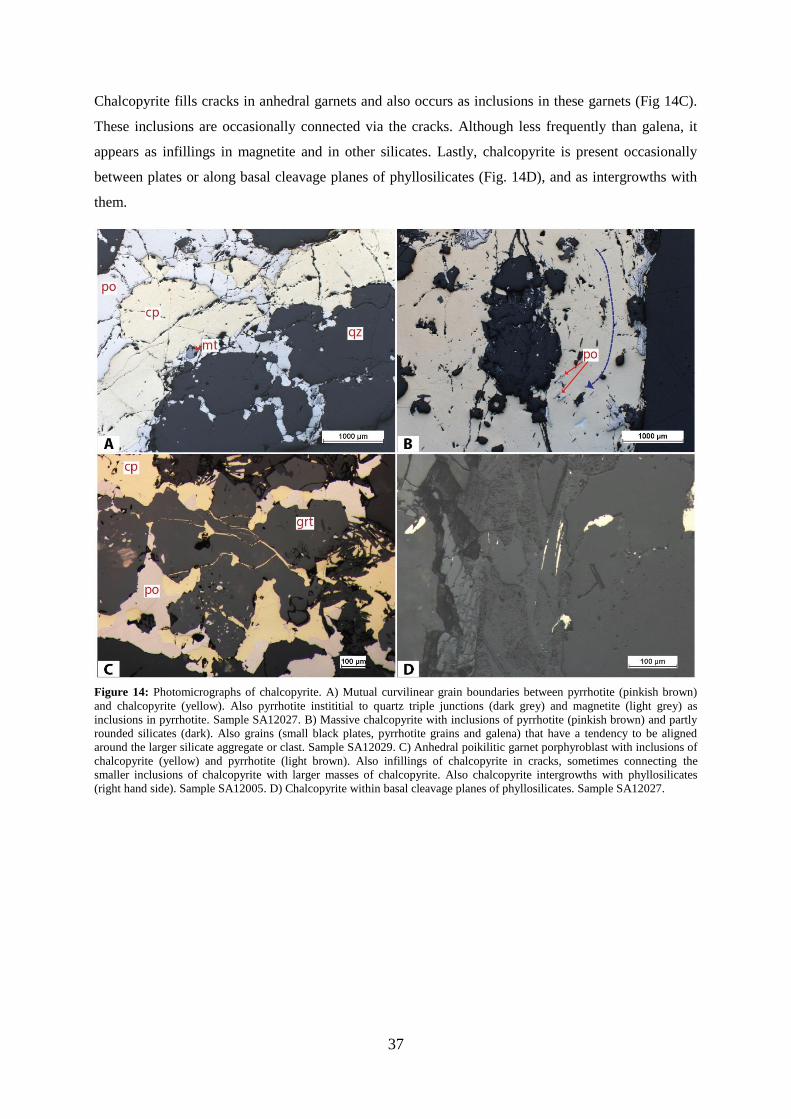
37
Chalcopyrite fills cracks in anhedral garnets and also occurs as inclusions in these garnets (Fig 14C).
These inclusions are occasionally connected via the cracks. Although less frequently than galena, it
appears as infillings in magnetite and in other silicates. Lastly, chalcopyrite is present occasionally
between plates or along basal cleavage planes of phyllosilicates (Fig. 14D), and as intergrowths with
them.
Figure 14: Photomicrographs of chalcopyrite. A) Mutual curvilinear grain boundaries between pyrrhotite (pinkish brown)
and chalcopyrite (yellow). Also pyrrhotite instititial to quartz triple junctions (dark grey) and magnetite (light grey) as
inclusions in pyrrhotite. Sample SA12027. B) Massive chalcopyrite with inclusions of pyrrhotite (pinkish brown) and partly
rounded silicates (dark). Also grains (small black plates, pyrrhotite grains and galena) that have a tendency to be aligned
around the larger silicate aggregate or clast. Sample SA12029. C) Anhedral poikilitic garnet porphyroblast with inclusions of
chalcopyrite (yellow) and pyrrhotite (light brown). Also infillings of chalcopyrite in cracks, sometimes connecting the
smaller inclusions of chalcopyrite with larger masses of chalcopyrite. Also chalcopyrite intergrowths with phyllosilicates
(right hand side). Sample SA12005. D) Chalcopyrite within basal cleavage planes of phyllosilicates. Sample SA12027.
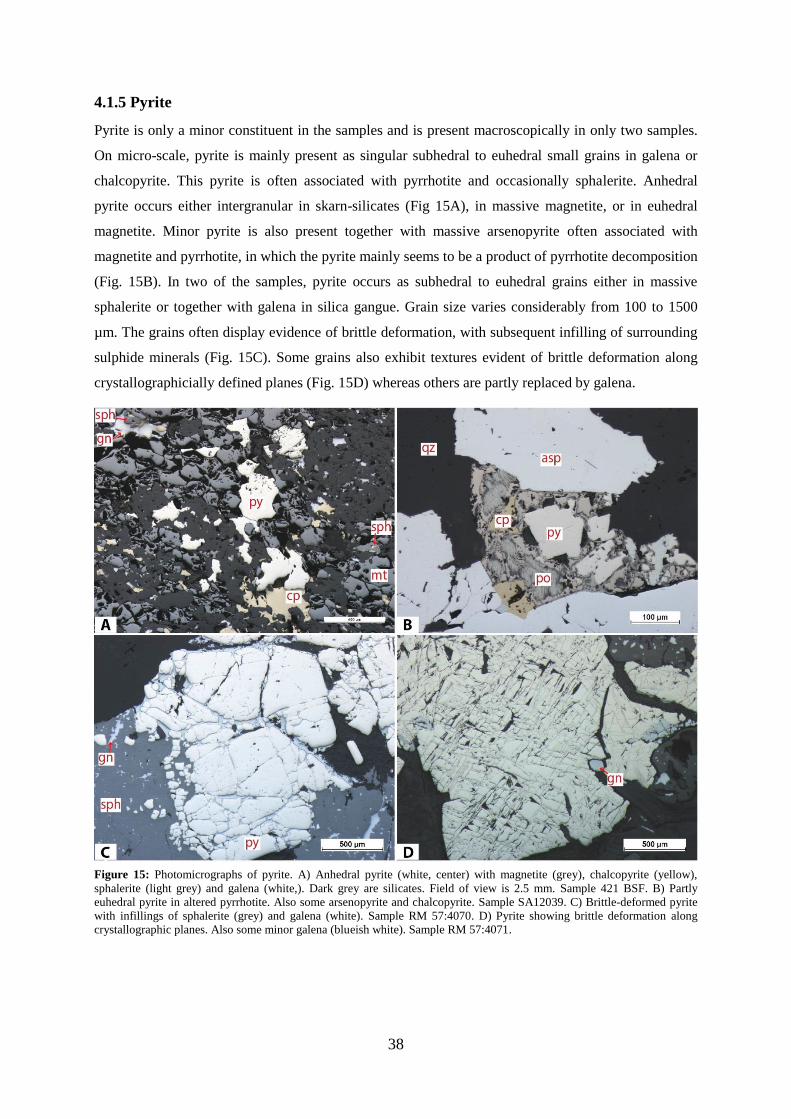
38
4.1.5 Pyrite
Pyrite is only a minor constituent in the samples and is present macroscopically in only two samples.
On micro-scale, pyrite is mainly present as singular subhedral to euhedral small grains in galena or
chalcopyrite. This pyrite is often associated with pyrrhotite and occasionally sphalerite. Anhedral
pyrite occurs either intergranular in skarn-silicates (Fig 15A), in massive magnetite, or in euhedral
magnetite. Minor pyrite is also present together with massive arsenopyrite often associated with
magnetite and pyrrhotite, in which the pyrite mainly seems to be a product of pyrrhotite decomposition
(Fig. 15B). In two of the samples, pyrite occurs as subhedral to euhedral grains either in massive
sphalerite or together with galena in silica gangue. Grain size varies considerably from 100 to 1500
µm. The grains often display evidence of brittle deformation, with subsequent infilling of surrounding
sulphide minerals (Fig. 15C). Some grains also exhibit textures evident of brittle deformation along
crystallographicially defined planes (Fig. 15D) whereas others are partly replaced by galena.
Figure 15: Photomicrographs of pyrite. A) Anhedral pyrite (white, center) with magnetite (grey), chalcopyrite (yellow),
sphalerite (light grey) and galena (white,). Dark grey are silicates. Field of view is 2.5 mm. Sample 421 BSF. B) Partly
euhedral pyrite in altered pyrrhotite. Also some arsenopyrite and chalcopyrite. Sample SA12039. C) Brittle-deformed pyrite
with infillings of sphalerite (grey) and galena (white). Sample RM 57:4070. D) Pyrite showing brittle deformation along
crystallographic planes. Also some minor galena (blueish white). Sample RM 57:4071.
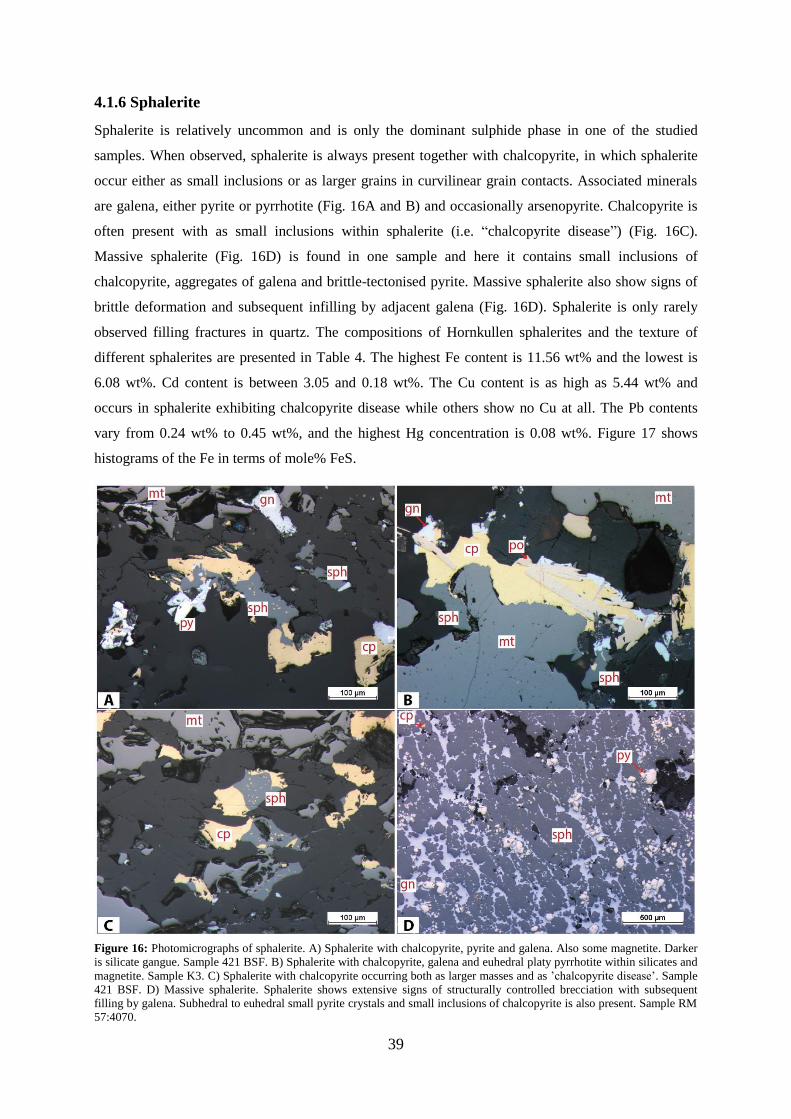
39
4.1.6 Sphalerite
Sphalerite is relatively uncommon and is only the dominant sulphide phase in one of the studied
samples. When observed, sphalerite is always present together with chalcopyrite, in which sphalerite
occur either as small inclusions or as larger grains in curvilinear grain contacts. Associated minerals
are galena, either pyrite or pyrrhotite (Fig. 16A and B) and occasionally arsenopyrite. Chalcopyrite is
often present with as small inclusions within sphalerite (i.e. “chalcopyrite disease”) (Fig. 16C).
Massive sphalerite (Fig. 16D) is found in one sample and here it contains small inclusions of
chalcopyrite, aggregates of galena and brittle-tectonised pyrite. Massive sphalerite also show signs of
brittle deformation and subsequent infilling by adjacent galena (Fig. 16D). Sphalerite is only rarely
observed filling fractures in quartz. The compositions of Hornkullen sphalerites and the texture of
different sphalerites are presented in Table 4. The highest Fe content is 11.56 wt% and the lowest is
6.08 wt%. Cd content is between 3.05 and 0.18 wt%. The Cu content is as high as 5.44 wt% and
occurs in sphalerite exhibiting chalcopyrite disease while others show no Cu at all. The Pb contents
vary from 0.24 wt% to 0.45 wt%, and the highest Hg concentration is 0.08 wt%. Figure 17 shows
histograms of the Fe in terms of mole% FeS.
Figure 16: Photomicrographs of sphalerite. A) Sphalerite with chalcopyrite, pyrite and galena. Also some magnetite. Darker
is silicate gangue. Sample 421 BSF. B) Sphalerite with chalcopyrite, galena and euhedral platy pyrrhotite within silicates and
magnetite. Sample K3. C) Sphalerite with chalcopyrite occurring both as larger masses and as ‟chalcopyrite disease‟. Sample
421 BSF. D) Massive sphalerite. Sphalerite shows extensive signs of structurally controlled brecciation with subsequent
filling by galena. Subhedral to euhedral small pyrite crystals and small inclusions of chalcopyrite is also present. Sample RM
57:4070.
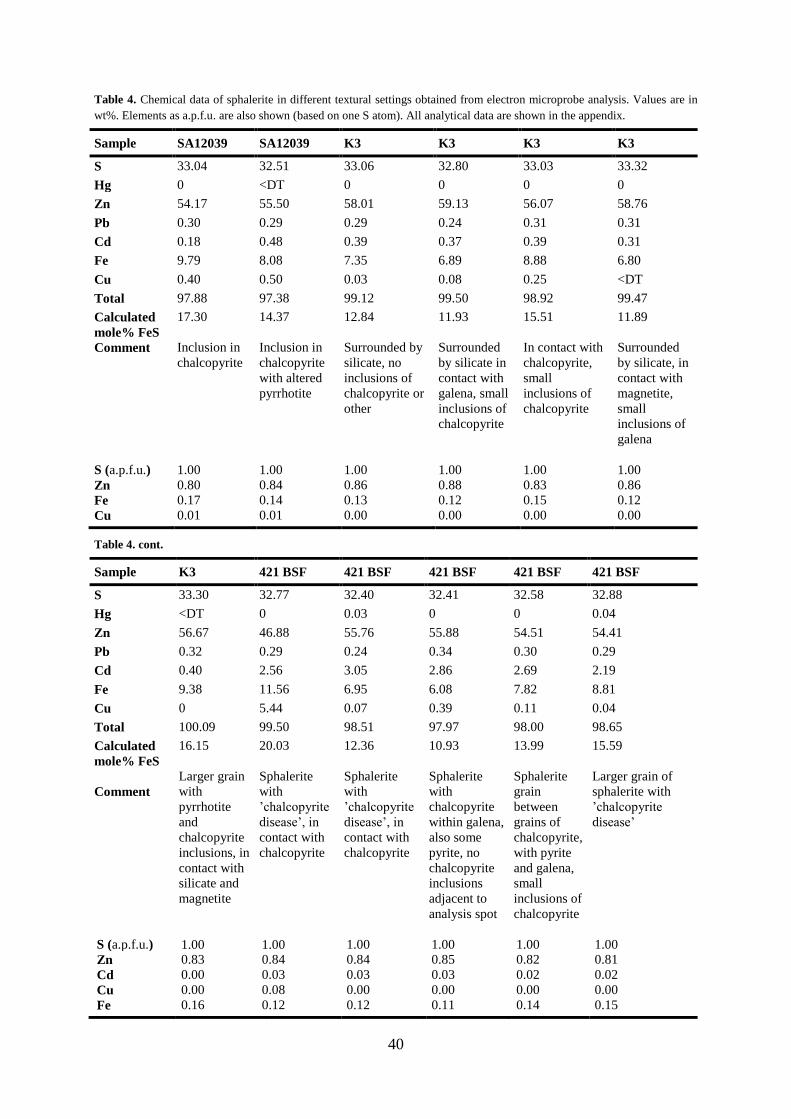
40
Table 4. Chemical data of sphalerite in different textural settings obtained from electron microprobe analysis. Values are in
wt%. Elements as a.p.f.u. are also shown (based on one S atom). All analytical data are shown in the appendix.
Sample SA12039 SA12039 K3 K3 K3 K3
S 33.04 32.51 33.06 32.80 33.03 33.32
Hg 0 <DT 0 0 0 0
Zn 54.17 55.50 58.01 59.13 56.07 58.76
Pb 0.30 0.29 0.29 0.24 0.31 0.31
Cd 0.18 0.48 0.39 0.37 0.39 0.31
Fe 9.79 8.08 7.35 6.89 8.88 6.80
Cu 0.40 0.50 0.03 0.08 0.25 <DT
Total 97.88 97.38 99.12 99.50 98.92 99.47
Calculated
mole% FeS
17.30
14.37
12.84
11.93
15.51
11.89
Comment
Inclusion in
chalcopyrite
Inclusion in
chalcopyrite
with altered
pyrrhotite
Surrounded by
silicate, no
inclusions of
chalcopyrite or
other
Surrounded
by silicate in
contact with
galena, small
inclusions of
chalcopyrite
In contact with
chalcopyrite,
small
inclusions of
chalcopyrite
Surrounded
by silicate, in
contact with
magnetite,
small
inclusions of
galena
S (a.p.f.u.) 1.00 1.00 1.00 1.00 1.00 1.00
Zn 0.80 0.84 0.86 0.88 0.83 0.86
Fe 0.17 0.14 0.13 0.12 0.15 0.12
Cu 0.01 0.01 0.00 0.00 0.00 0.00
Table 4. cont.
Sample K3 421 BSF 421 BSF 421 BSF 421 BSF 421 BSF
S 33.30 32.77 32.40 32.41 32.58 32.88
Hg <DT 0 0.03 0 0 0.04
Zn 56.67 46.88 55.76 55.88 54.51 54.41
Pb 0.32 0.29 0.24 0.34 0.30 0.29
Cd 0.40 2.56 3.05 2.86 2.69 2.19
Fe 9.38 11.56 6.95 6.08 7.82 8.81
Cu 0 5.44 0.07 0.39 0.11 0.04
Total 100.09 99.50 98.51 97.97 98.00 98.65
Calculated
mole% FeS
16.15
20.03
12.36
10.93
13.99
15.59
Comment
Larger grain
with
pyrrhotite
and
chalcopyrite
inclusions, in
contact with
silicate and
magnetite
Sphalerite
with
‟chalcopyrite
disease‟, in
contact with
chalcopyrite
Sphalerite
with
‟chalcopyrite
disease‟, in
contact with
chalcopyrite
Sphalerite
with
chalcopyrite
within galena,
also some
pyrite, no
chalcopyrite
inclusions
adjacent to
analysis spot
Sphalerite
grain
between
grains of
chalcopyrite,
with pyrite
and galena,
small
inclusions of
chalcopyrite
Larger grain of
sphalerite with
‟chalcopyrite
disease‟
S (a.p.f.u.) 1.00 1.00
1.00 1.00 1.00 1.00
Zn 0.83 0.84 0.84 0.85 0.82 0.81
Cd 0.00 0.03 0.03 0.03 0.02 0.02
Cu 0.00 0.08 0.00 0.00 0.00 0.00
Fe 0.16 0.12
0.12 0.11 0.14 0.15
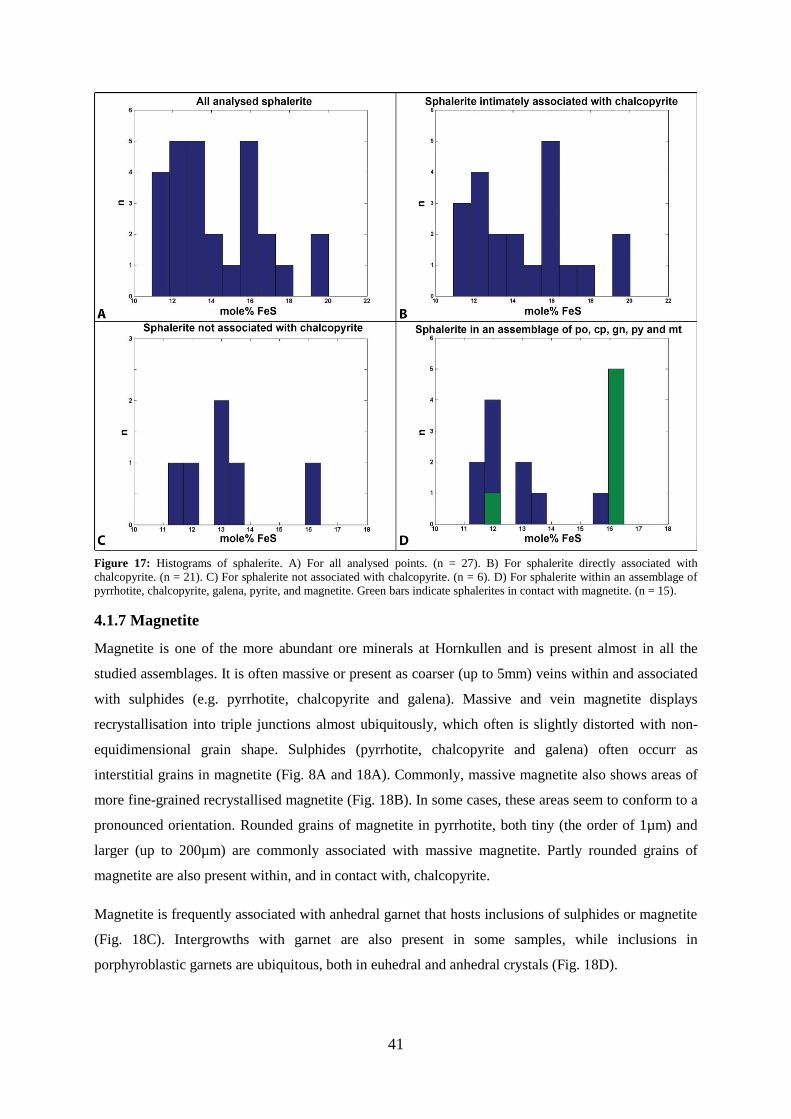
41
Figure 17: Histograms of sphalerite. A) For all analysed points. (n = 27). B) For sphalerite directly associated with
chalcopyrite. (n = 21). C) For sphalerite not associated with chalcopyrite. (n = 6). D) For sphalerite within an assemblage of
pyrrhotite, chalcopyrite, galena, pyrite, and magnetite. Green bars indicate sphalerites in contact with magnetite. (n = 15).
4.1.7 Magnetite
Magnetite is one of the more abundant ore minerals at Hornkullen and is present almost in all the
studied assemblages. It is often massive or present as coarser (up to 5mm) veins within and associated
with sulphides (e.g. pyrrhotite, chalcopyrite and galena). Massive and vein magnetite displays
recrystallisation into triple junctions almost ubiquitously, which often is slightly distorted with non-
equidimensional grain shape. Sulphides (pyrrhotite, chalcopyrite and galena) often occurr as
interstitial grains in magnetite (Fig. 8A and 18A). Commonly, massive magnetite also shows areas of
more fine-grained recrystallised magnetite (Fig. 18B). In some cases, these areas seem to conform to a
pronounced orientation. Rounded grains of magnetite in pyrrhotite, both tiny (the order of 1µm) and
larger (up to 200µm) are commonly associated with massive magnetite. Partly rounded grains of
magnetite are also present within, and in contact with, chalcopyrite.
Magnetite is frequently associated with anhedral garnet that hosts inclusions of sulphides or magnetite
(Fig. 18C). Intergrowths with garnet are also present in some samples, while inclusions in
porphyroblastic garnets are ubiquitous, both in euhedral and anhedral crystals (Fig. 18D).
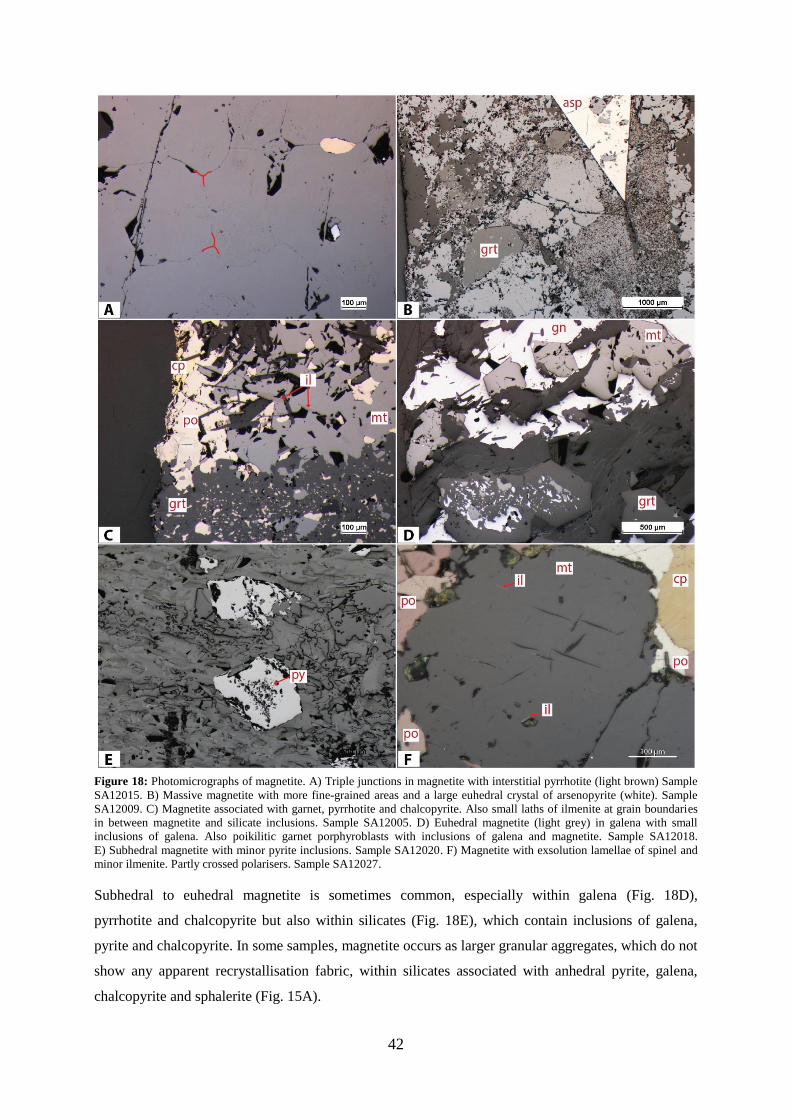
42
Figure 18: Photomicrographs of magnetite. A) Triple junctions in magnetite with interstitial pyrrhotite (light brown) Sample
SA12015. B) Massive magnetite with more fine-grained areas and a large euhedral crystal of arsenopyrite (white). Sample
SA12009. C) Magnetite associated with garnet, pyrrhotite and chalcopyrite. Also small laths of ilmenite at grain boundaries
in between magnetite and silicate inclusions. Sample SA12005. D) Euhedral magnetite (light grey) in galena with small
inclusions of galena. Also poikilitic garnet porphyroblasts with inclusions of galena and magnetite. Sample SA12018.
E) Subhedral magnetite with minor pyrite inclusions. Sample SA12020. F) Magnetite with exsolution lamellae of spinel and
minor ilmenite. Partly crossed polarisers. Sample SA12027.
Subhedral to euhedral magnetite is sometimes common, especially within galena (Fig. 18D),
pyrrhotite and chalcopyrite but also within silicates (Fig. 18E), which contain inclusions of galena,
pyrite and chalcopyrite. In some samples, magnetite occurs as larger granular aggregates, which do not
show any apparent recrystallisation fabric, within silicates associated with anhedral pyrite, galena,
chalcopyrite and sphalerite (Fig. 15A).
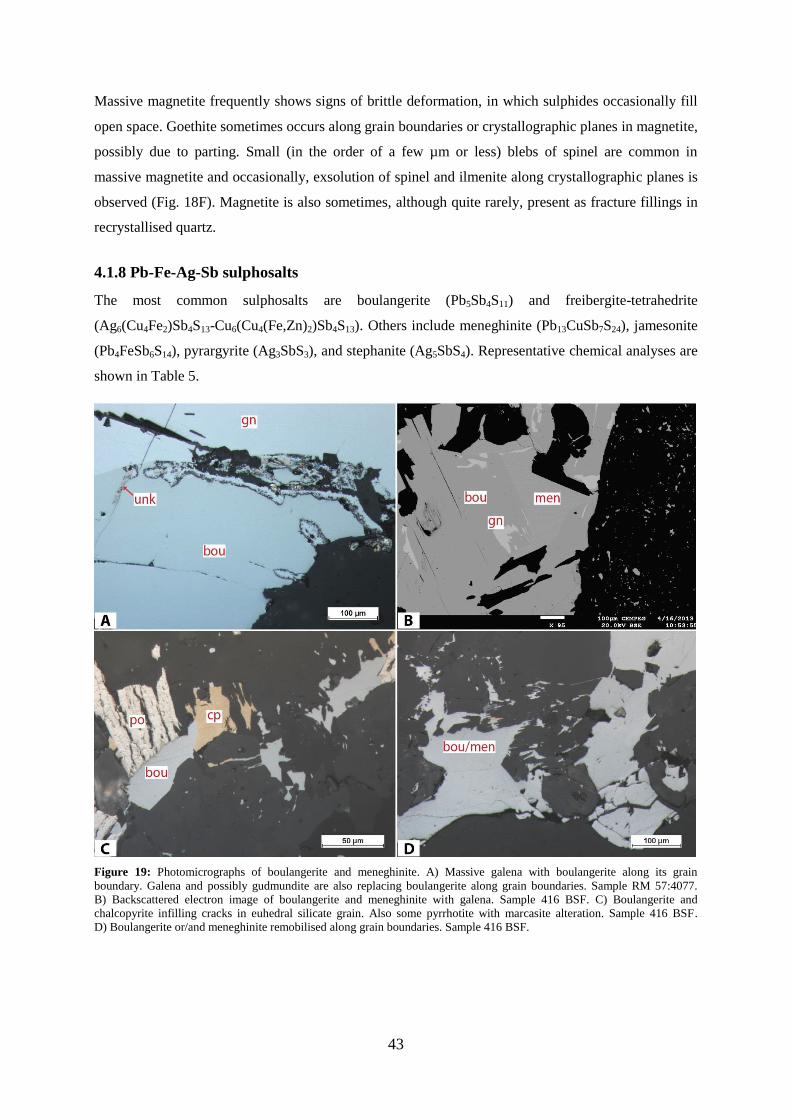
43
Massive magnetite frequently shows signs of brittle deformation, in which sulphides occasionally fill
open space. Goethite sometimes occurs along grain boundaries or crystallographic planes in magnetite,
possibly due to parting. Small (in the order of a few µm or less) blebs of spinel are common in
massive magnetite and occasionally, exsolution of spinel and ilmenite along crystallographic planes is
observed (Fig. 18F). Magnetite is also sometimes, although quite rarely, present as fracture fillings in
recrystallised quartz.
4.1.8 Pb-Fe-Ag-Sb sulphosalts
The most common sulphosalts are boulangerite (Pb5Sb4S11) and freibergite-tetrahedrite
(Ag6(Cu4Fe2)Sb4S13-Cu6(Cu4(Fe,Zn)2)Sb4S13). Others include meneghinite (Pb13CuSb7S24), jamesonite
(Pb4FeSb6S14), pyrargyrite (Ag3SbS3), and stephanite (Ag5SbS4). Representative chemical analyses are
shown in Table 5.
Figure 19: Photomicrographs of boulangerite and meneghinite. A) Massive galena with boulangerite along its grain
boundary. Galena and possibly gudmundite are also replacing boulangerite along grain boundaries. Sample RM 57:4077.
B) Backscattered electron image of boulangerite and meneghinite with galena. Sample 416 BSF. C) Boulangerite and
chalcopyrite infilling cracks in euhedral silicate grain. Also some pyrrhotite with marcasite alteration. Sample 416 BSF.
D) Boulangerite or/and meneghinite remobilised along grain boundaries. Sample 416 BSF.
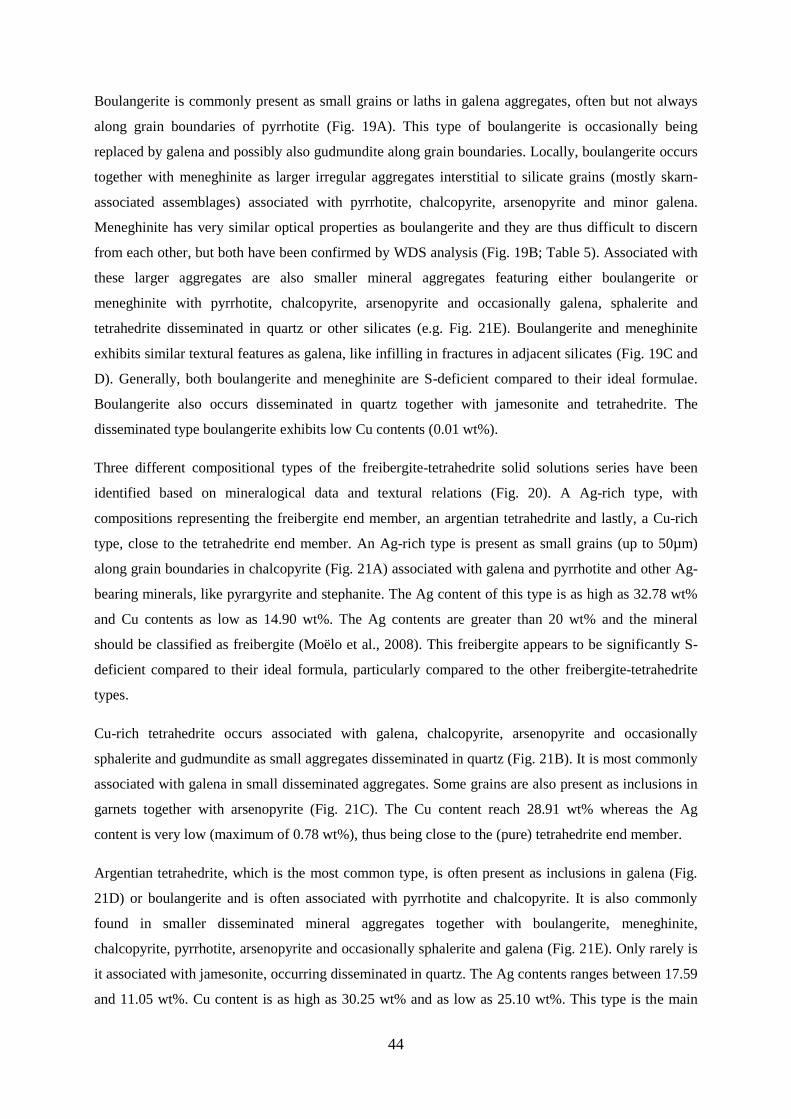
44
Boulangerite is commonly present as small grains or laths in galena aggregates, often but not always
along grain boundaries of pyrrhotite (Fig. 19A). This type of boulangerite is occasionally being
replaced by galena and possibly also gudmundite along grain boundaries. Locally, boulangerite occurs
together with meneghinite as larger irregular aggregates interstitial to silicate grains (mostly skarn-
associated assemblages) associated with pyrrhotite, chalcopyrite, arsenopyrite and minor galena.
Meneghinite has very similar optical properties as boulangerite and they are thus difficult to discern
from each other, but both have been confirmed by WDS analysis (Fig. 19B; Table 5). Associated with
these larger aggregates are also smaller mineral aggregates featuring either boulangerite or
meneghinite with pyrrhotite, chalcopyrite, arsenopyrite and occasionally galena, sphalerite and
tetrahedrite disseminated in quartz or other silicates (e.g. Fig. 21E). Boulangerite and meneghinite
exhibits similar textural features as galena, like infilling in fractures in adjacent silicates (Fig. 19C and
D). Generally, both boulangerite and meneghinite are S-deficient compared to their ideal formulae.
Boulangerite also occurs disseminated in quartz together with jamesonite and tetrahedrite. The
disseminated type boulangerite exhibits low Cu contents (0.01 wt%).
Three different compositional types of the freibergite-tetrahedrite solid solutions series have been
identified based on mineralogical data and textural relations (Fig. 20). A Ag-rich type, with
compositions representing the freibergite end member, an argentian tetrahedrite and lastly, a Cu-rich
type, close to the tetrahedrite end member. An Ag-rich type is present as small grains (up to 50µm)
along grain boundaries in chalcopyrite (Fig. 21A) associated with galena and pyrrhotite and other Ag-
bearing minerals, like pyrargyrite and stephanite. The Ag content of this type is as high as 32.78 wt%
and Cu contents as low as 14.90 wt%. The Ag contents are greater than 20 wt% and the mineral
should be classified as freibergite (Moëlo et al., 2008). This freibergite appears to be significantly S-
deficient compared to their ideal formula, particularly compared to the other freibergite-tetrahedrite
types.
Cu-rich tetrahedrite occurs associated with galena, chalcopyrite, arsenopyrite and occasionally
sphalerite and gudmundite as small aggregates disseminated in quartz (Fig. 21B). It is most commonly
associated with galena in small disseminated aggregates. Some grains are also present as inclusions in
garnets together with arsenopyrite (Fig. 21C). The Cu content reach 28.91 wt% whereas the Ag
content is very low (maximum of 0.78 wt%), thus being close to the (pure) tetrahedrite end member.
Argentian tetrahedrite, which is the most common type, is often present as inclusions in galena (Fig.
21D) or boulangerite and is often associated with pyrrhotite and chalcopyrite. It is also commonly
found in smaller disseminated mineral aggregates together with boulangerite, meneghinite,
chalcopyrite, pyrrhotite, arsenopyrite and occasionally sphalerite and galena (Fig. 21E). Only rarely is
it associated with jamesonite, occurring disseminated in quartz. The Ag contents ranges between 17.59
and 11.05 wt%. Cu content is as high as 30.25 wt% and as low as 25.10 wt%. This type is the main
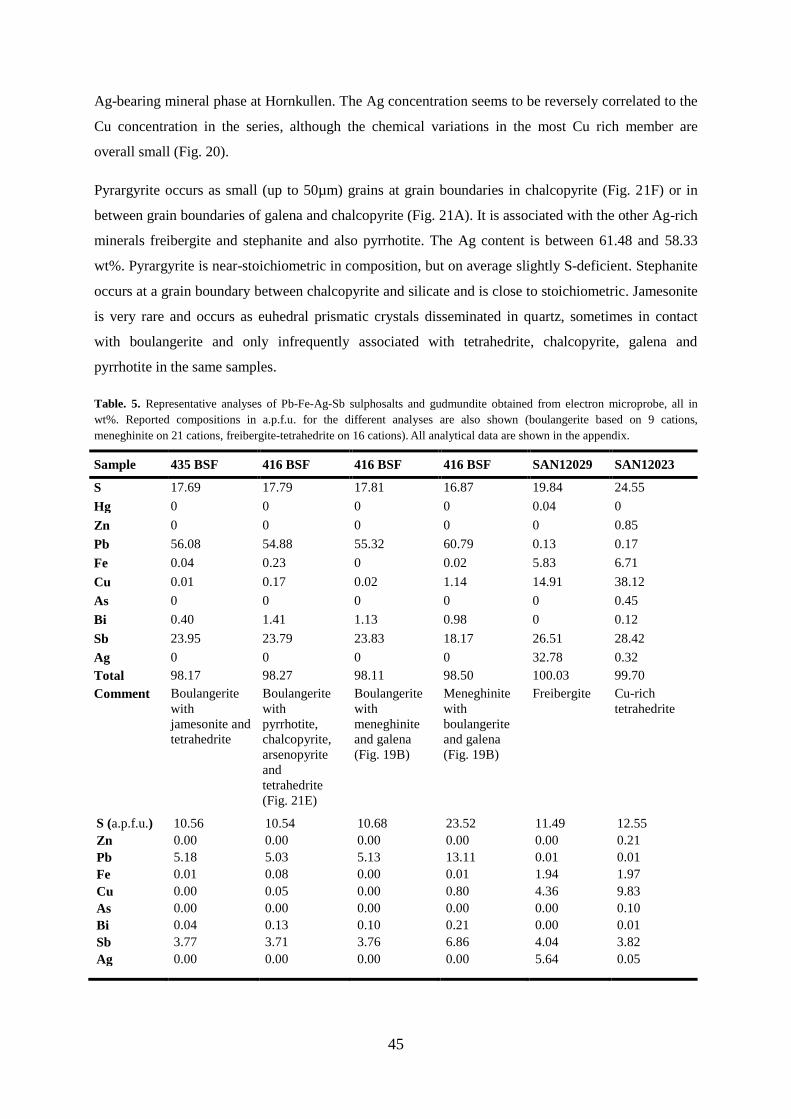
45
Ag-bearing mineral phase at Hornkullen. The Ag concentration seems to be reversely correlated to the
Cu concentration in the series, although the chemical variations in the most Cu rich member are
overall small (Fig. 20).
Pyrargyrite occurs as small (up to 50µm) grains at grain boundaries in chalcopyrite (Fig. 21F) or in
between grain boundaries of galena and chalcopyrite (Fig. 21A). It is associated with the other Ag-rich
minerals freibergite and stephanite and also pyrrhotite. The Ag content is between 61.48 and 58.33
wt%. Pyrargyrite is near-stoichiometric in composition, but on average slightly S-deficient. Stephanite
occurs at a grain boundary between chalcopyrite and silicate and is close to stoichiometric. Jamesonite
is very rare and occurs as euhedral prismatic crystals disseminated in quartz, sometimes in contact
with boulangerite and only infrequently associated with tetrahedrite, chalcopyrite, galena and
pyrrhotite in the same samples.
Table. 5. Representative analyses of Pb-Fe-Ag-Sb sulphosalts and gudmundite obtained from electron microprobe, all in
wt%. Reported compositions in a.p.f.u. for the different analyses are also shown (boulangerite based on 9 cations,
meneghinite on 21 cations, freibergite-tetrahedrite on 16 cations). All analytical data are shown in the appendix.
Sample 435 BSF 416 BSF 416 BSF 416 BSF SAN12029 SAN12023
S 17.69 17.79 17.81 16.87 19.84 24.55
Hg 0 0 0 0 0.04 0
Zn 0 0 0 0 0 0.85
Pb 56.08 54.88 55.32 60.79 0.13 0.17
Fe 0.04 0.23 0 0.02 5.83 6.71
Cu 0.01 0.17 0.02 1.14 14.91 38.12
As 0 0 0 0 0 0.45
Bi 0.40 1.41 1.13 0.98 0 0.12
Sb 23.95 23.79 23.83 18.17 26.51 28.42
Ag 0 0 0 0 32.78 0.32
Total 98.17 98.27 98.11 98.50 100.03 99.70
Comment
Boulangerite
with
jamesonite and
tetrahedrite
Boulangerite
with
pyrrhotite,
chalcopyrite,
arsenopyrite
and
tetrahedrite
(Fig. 21E)
Boulangerite
with
meneghinite
and galena
(Fig. 19B)
Meneghinite
with
boulangerite
and galena
(Fig. 19B)
Freibergite
Cu-rich
tetrahedrite
S (a.p.f.u.) 10.56 10.54 10.68 23.52 11.49 12.55
Zn 0.00 0.00 0.00 0.00 0.00 0.21
Pb 5.18 5.03 5.13 13.11 0.01 0.01
Fe 0.01 0.08 0.00 0.01 1.94 1.97
Cu 0.00 0.05 0.00 0.80 4.36 9.83
As 0.00 0.00 0.00 0.00 0.00 0.10
Bi 0.04 0.13 0.10 0.21 0.00 0.01
Sb 3.77 3.71 3.76 6.86 4.04 3.82
Ag 0.00 0.00 0.00 0.00 5.64 0.05
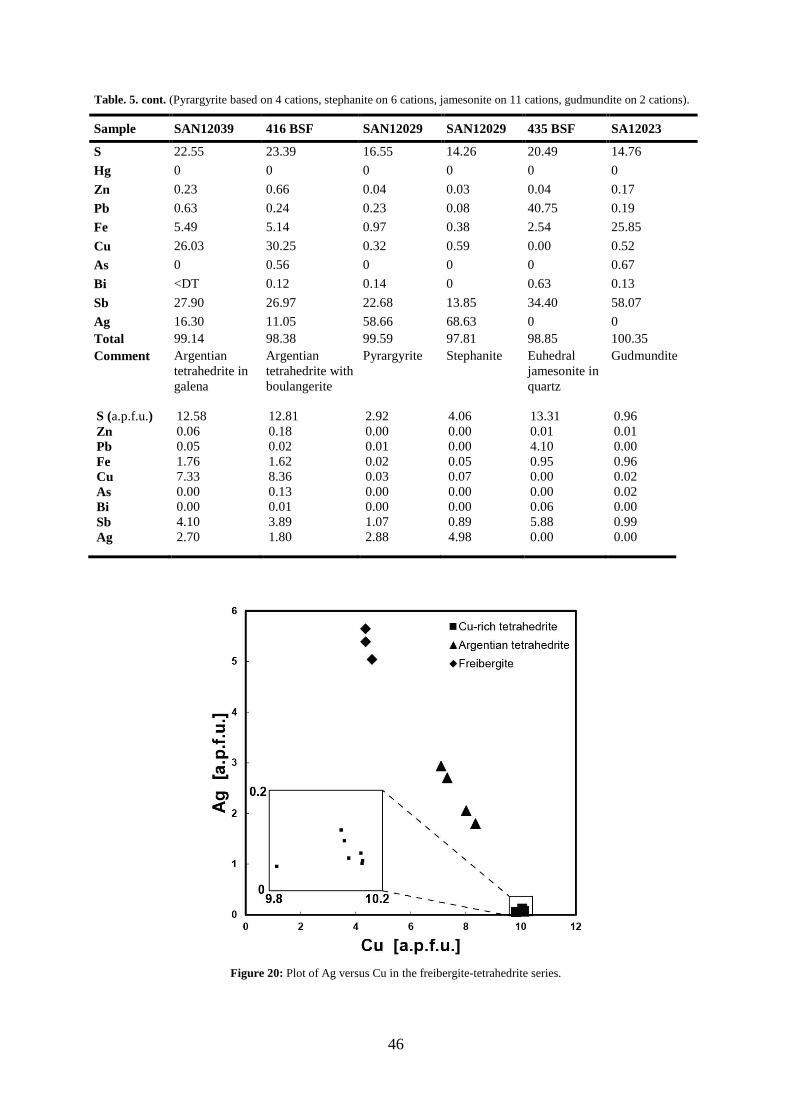
46
Table. 5. cont. (Pyrargyrite based on 4 cations, stephanite on 6 cations, jamesonite on 11 cations, gudmundite on 2 cations).
Sample SAN12039 416 BSF SAN12029 SAN12029 435 BSF SA12023
S 22.55 23.39 16.55 14.26 20.49 14.76
Hg 0 0 0 0 0 0
Zn 0.23 0.66 0.04 0.03 0.04 0.17
Pb 0.63 0.24 0.23 0.08 40.75 0.19
Fe 5.49 5.14 0.97 0.38 2.54 25.85
Cu 26.03 30.25 0.32 0.59 0.00 0.52
As 0 0.56 0 0 0 0.67
Bi <DT 0.12 0.14 0 0.63 0.13
Sb 27.90 26.97 22.68 13.85 34.40 58.07
Ag 16.30 11.05 58.66 68.63 0 0
Total 99.14 98.38 99.59 97.81 98.85 100.35
Comment
Argentian
tetrahedrite in
galena
Argentian
tetrahedrite with
boulangerite
Pyrargyrite
Stephanite
Euhedral
jamesonite in
quartz
Gudmundite
S (a.p.f.u.) 12.58 12.81 2.92 4.06 13.31 0.96
Zn 0.06 0.18 0.00 0.00 0.01 0.01
Pb 0.05 0.02 0.01 0.00 4.10 0.00
Fe 1.76 1.62 0.02 0.05 0.95 0.96
Cu 7.33 8.36 0.03 0.07 0.00 0.02
As 0.00 0.13 0.00 0.00 0.00 0.02
Bi 0.00 0.01 0.00 0.00 0.06 0.00
Sb 4.10 3.89 1.07 0.89 5.88 0.99
Ag 2.70 1.80 2.88 4.98 0.00 0.00
Figure 20: Plot of Ag versus Cu in the freibergite-tetrahedrite series.
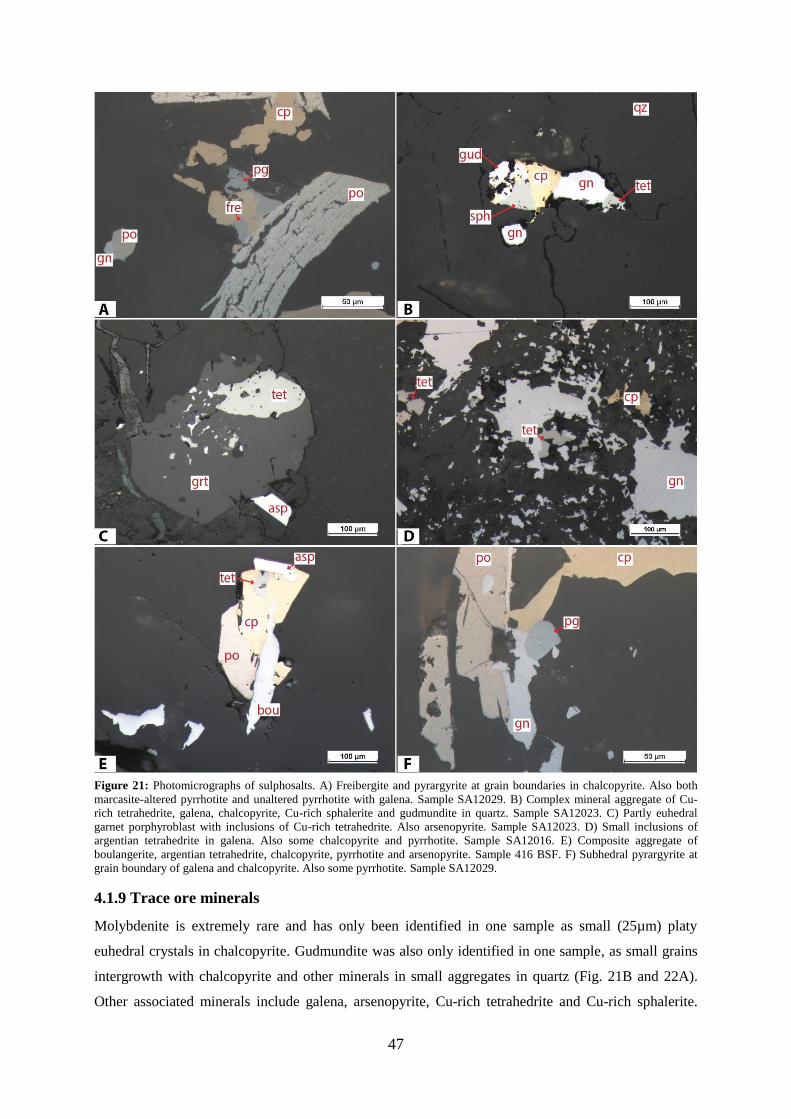
47
Figure 21: Photomicrographs of sulphosalts. A) Freibergite and pyrargyrite at grain boundaries in chalcopyrite. Also both
marcasite-altered pyrrhotite and unaltered pyrrhotite with galena. Sample SA12029. B) Complex mineral aggregate of Cu-
rich tetrahedrite, galena, chalcopyrite, Cu-rich sphalerite and gudmundite in quartz. Sample SA12023. C) Partly euhedral
garnet porphyroblast with inclusions of Cu-rich tetrahedrite. Also arsenopyrite. Sample SA12023. D) Small inclusions of
argentian tetrahedrite in galena. Also some chalcopyrite and pyrrhotite. Sample SA12016. E) Composite aggregate of
boulangerite, argentian tetrahedrite, chalcopyrite, pyrrhotite and arsenopyrite. Sample 416 BSF. F) Subhedral pyrargyrite at
grain boundary of galena and chalcopyrite. Also some pyrrhotite. Sample SA12029.
4.1.9 Trace ore minerals
Molybdenite is extremely rare and has only been identified in one sample as small (25µm) platy
euhedral crystals in chalcopyrite. Gudmundite was also only identified in one sample, as small grains
intergrowth with chalcopyrite and other minerals in small aggregates in quartz (Fig. 21B and 22A).
Other associated minerals include galena, arsenopyrite, Cu-rich tetrahedrite and Cu-rich sphalerite.
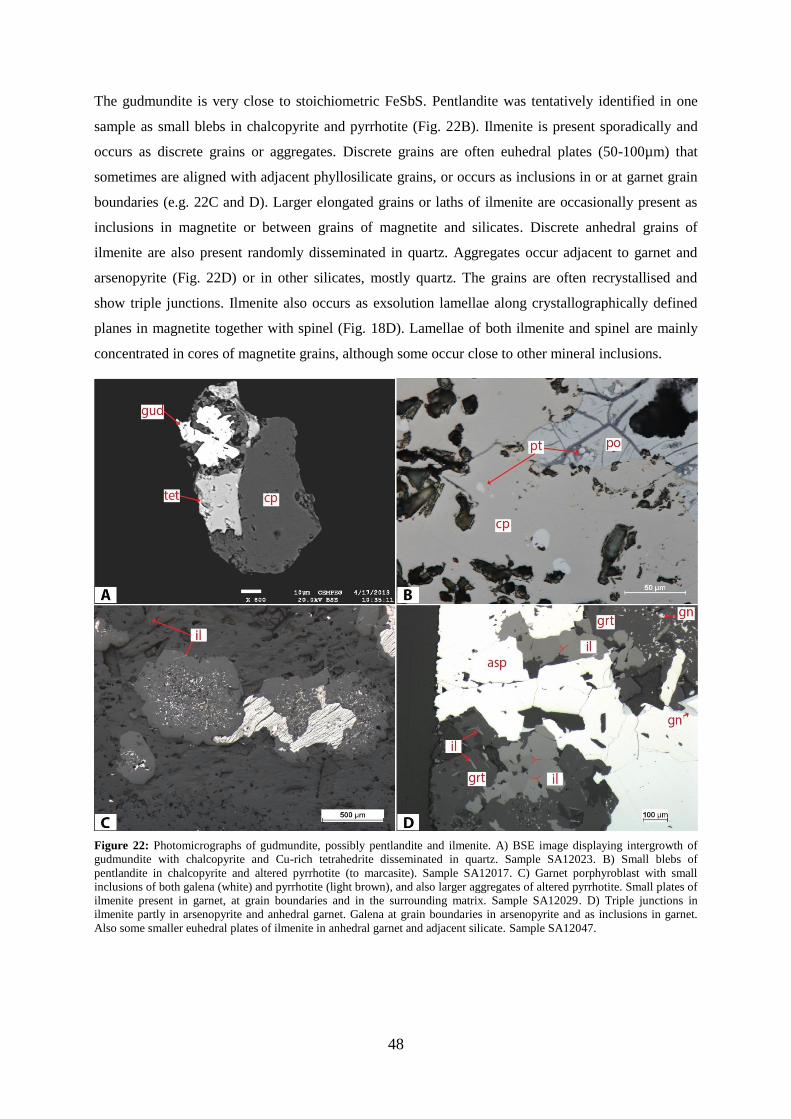
48
The gudmundite is very close to stoichiometric FeSbS. Pentlandite was tentatively identified in one
sample as small blebs in chalcopyrite and pyrrhotite (Fig. 22B). Ilmenite is present sporadically and
occurs as discrete grains or aggregates. Discrete grains are often euhedral plates (50-100µm) that
sometimes are aligned with adjacent phyllosilicate grains, or occurs as inclusions in or at garnet grain
boundaries (e.g. 22C and D). Larger elongated grains or laths of ilmenite are occasionally present as
inclusions in magnetite or between grains of magnetite and silicates. Discrete anhedral grains of
ilmenite are also present randomly disseminated in quartz. Aggregates occur adjacent to garnet and
arsenopyrite (Fig. 22D) or in other silicates, mostly quartz. The grains are often recrystallised and
show triple junctions. Ilmenite also occurs as exsolution lamellae along crystallographically defined
planes in magnetite together with spinel (Fig. 18D). Lamellae of both ilmenite and spinel are mainly
concentrated in cores of magnetite grains, although some occur close to other mineral inclusions.
Figure 22: Photomicrographs of gudmundite, possibly pentlandite and ilmenite. A) BSE image displaying intergrowth of
gudmundite with chalcopyrite and Cu-rich tetrahedrite disseminated in quartz. Sample SA12023. B) Small blebs of
pentlandite in chalcopyrite and altered pyrrhotite (to marcasite). Sample SA12017. C) Garnet porphyroblast with small
inclusions of both galena (white) and pyrrhotite (light brown), and also larger aggregates of altered pyrrhotite. Small plates of
ilmenite present in garnet, at grain boundaries and in the surrounding matrix. Sample SA12029. D) Triple junctions in
ilmenite partly in arsenopyrite and anhedral garnet. Galena at grain boundaries in arsenopyrite and as inclusions in garnet.
Also some smaller euhedral plates of ilmenite in anhedral garnet and adjacent silicate. Sample SA12047.
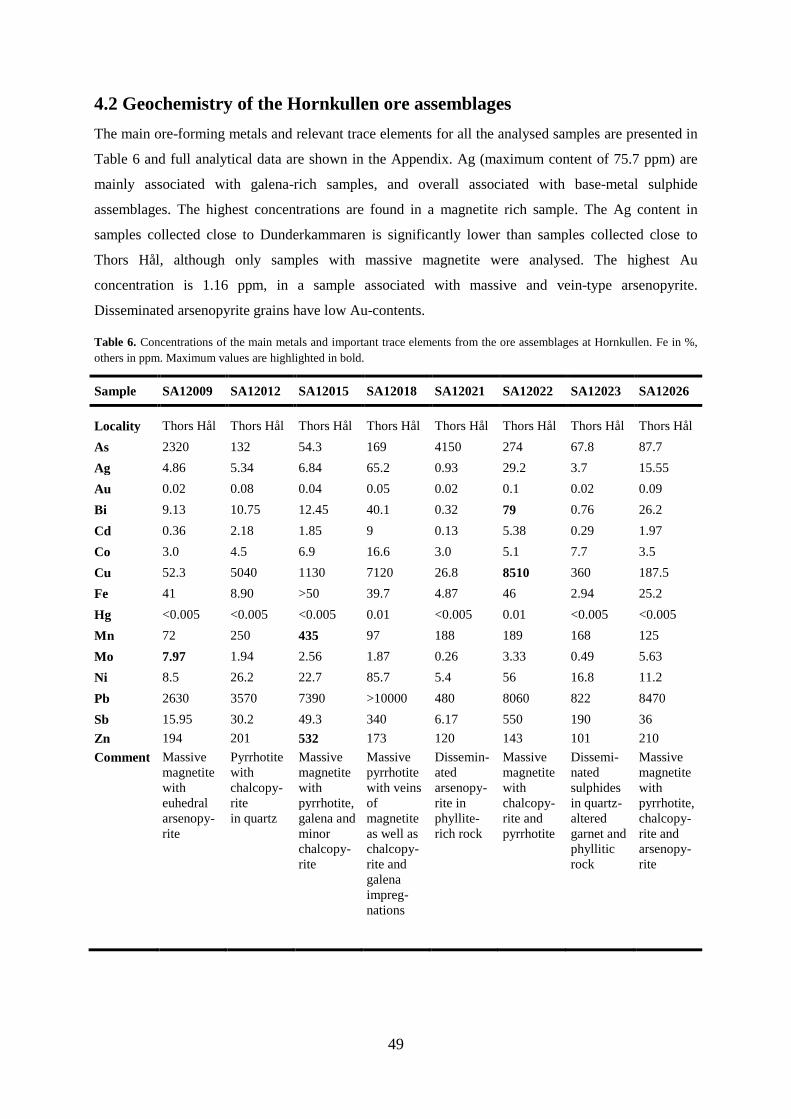
49
4.2 Geochemistry of the Hornkullen ore assemblages
The main ore-forming metals and relevant trace elements for all the analysed samples are presented in
Table 6 and full analytical data are shown in the Appendix. Ag (maximum content of 75.7 ppm) are
mainly associated with galena-rich samples, and overall associated with base-metal sulphide
assemblages. The highest concentrations are found in a magnetite rich sample. The Ag content in
samples collected close to Dunderkammaren is significantly lower than samples collected close to
Thors Hål, although only samples with massive magnetite were analysed. The highest Au
concentration is 1.16 ppm, in a sample associated with massive and vein-type arsenopyrite.
Disseminated arsenopyrite grains have low Au-contents.
Table 6. Concentrations of the main metals and important trace elements from the ore assemblages at Hornkullen. Fe in %,
others in ppm. Maximum values are highlighted in bold.
Sample SA12009 SA12012 SA12015 SA12018 SA12021 SA12022 SA12023 SA12026
Locality Thors Hål Thors Hål Thors Hål Thors Hål Thors Hål Thors Hål Thors Hål Thors Hål
As 2320 132 54.3 169 4150 274 67.8 87.7
Ag 4.86 5.34 6.84 65.2 0.93 29.2 3.7 15.55
Au 0.02 0.08 0.04 0.05 0.02 0.1 0.02 0.09
Bi 9.13 10.75 12.45 40.1 0.32 79 0.76 26.2
Cd 0.36 2.18 1.85 9 0.13 5.38 0.29 1.97
Co 3.0 4.5 6.9 16.6 3.0 5.1 7.7 3.5
Cu 52.3 5040 1130 7120 26.8 8510 360 187.5
Fe 41 8.90 >50 39.7 4.87 46 2.94 25.2
Hg <0.005 <0.005 <0.005 0.01 <0.005 0.01 <0.005 <0.005
Mn 72 250 435 97 188 189 168 125
Mo 7.97 1.94 2.56 1.87 0.26 3.33 0.49 5.63
Ni 8.5 26.2 22.7 85.7 5.4 56 16.8 11.2
Pb 2630 3570 7390 >10000 480 8060 822 8470
Sb 15.95 30.2 49.3 340 6.17 550 190 36
Zn 194 201 532 173 120 143 101 210
Comment
Massive
magnetite
with
euhedral
arsenopy-
rite
Pyrrhotite
with
chalcopy-
rite
in quartz
Massive
magnetite
with
pyrrhotite,
galena and
minor
chalcopy-
rite
Massive
pyrrhotite
with veins
of
magnetite
as well as
chalcopy-
rite and
galena
impreg-
nations
Dissemin-
ated
arsenopy-
rite in
phyllite-
rich rock
Massive
magnetite
with
chalcopy-
rite and
pyrrhotite
Dissemi-
nated
sulphides
in quartz-
altered
garnet and
phyllitic
rock
Massive
magnetite
with
pyrrhotite,
chalcopy-
rite and
arsenopy-
rite
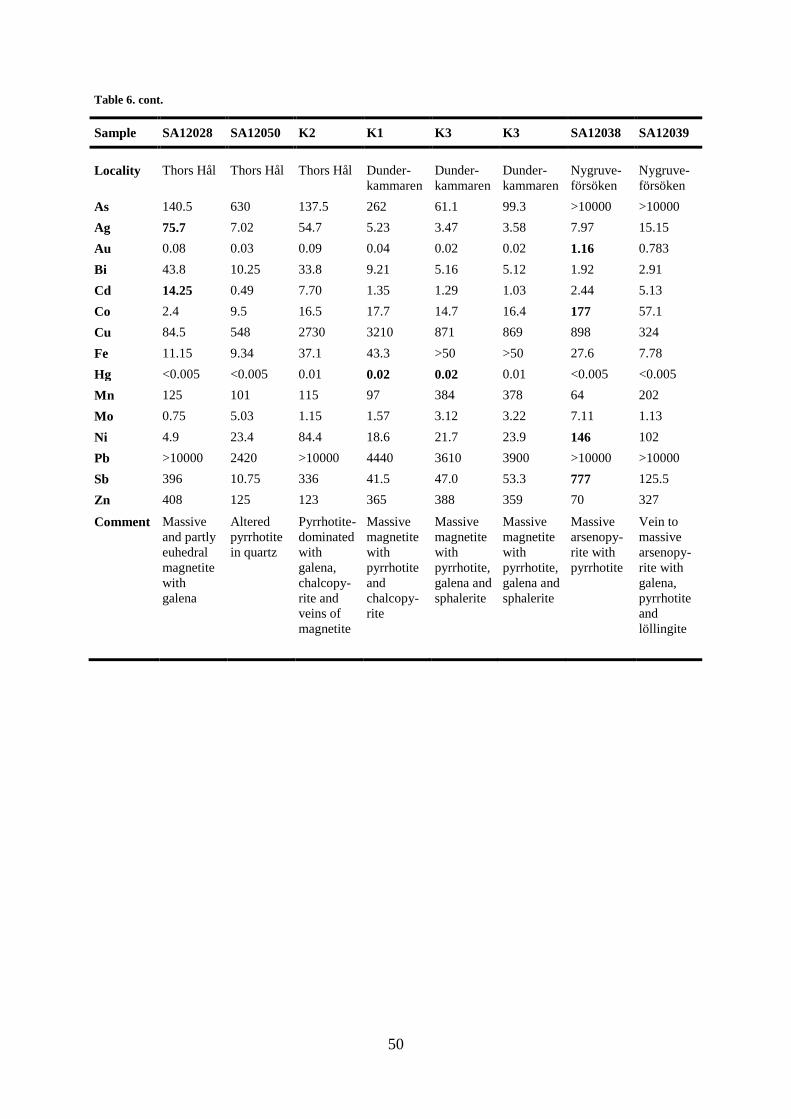
50
Table 6. cont.
Sample SA12028 SA12050 K2 K1 K3 K3 SA12038 SA12039
Locality
Thors Hål
Thors Hål
Thors Hål
Dunder-
kammaren
Dunder-
kammaren
Dunder-
kammaren
Nygruve-
försöken
Nygruve-
försöken
As 140.5 630 137.5 262 61.1 99.3 >10000 >10000
Ag 75.7 7.02 54.7 5.23 3.47 3.58 7.97 15.15
Au 0.08 0.03 0.09 0.04 0.02 0.02 1.16 0.783
Bi 43.8 10.25 33.8 9.21 5.16 5.12 1.92 2.91
Cd 14.25 0.49 7.70 1.35 1.29 1.03 2.44 5.13
Co 2.4 9.5 16.5 17.7 14.7 16.4 177 57.1
Cu 84.5 548 2730 3210 871 869 898 324
Fe 11.15 9.34 37.1 43.3 >50 >50 27.6 7.78
Hg <0.005 <0.005 0.01 0.02 0.02 0.01 <0.005 <0.005
Mn 125 101 115 97 384 378 64 202
Mo 0.75 5.03 1.15 1.57 3.12 3.22 7.11 1.13
Ni 4.9 23.4 84.4 18.6 21.7 23.9 146 102
Pb >10000 2420 >10000 4440 3610 3900 >10000 >10000
Sb 396 10.75 336 41.5 47.0 53.3 777 125.5
Zn 408 125 123 365 388 359 70 327
Comment
Massive
and partly
euhedral
magnetite
with
galena
Altered
pyrrhotite
in quartz
Pyrrhotite-
dominated
with
galena,
chalcopy-
rite and
veins of
magnetite
Massive
magnetite
with
pyrrhotite
and
chalcopy-
rite
Massive
magnetite
with
pyrrhotite,
galena and
sphalerite
Massive
magnetite
with
pyrrhotite,
galena and
sphalerite
Massive
arsenopy-
rite with
pyrrhotite
Vein to
massive
arsenopy-
rite with
galena,
pyrrhotite
and
löllingite
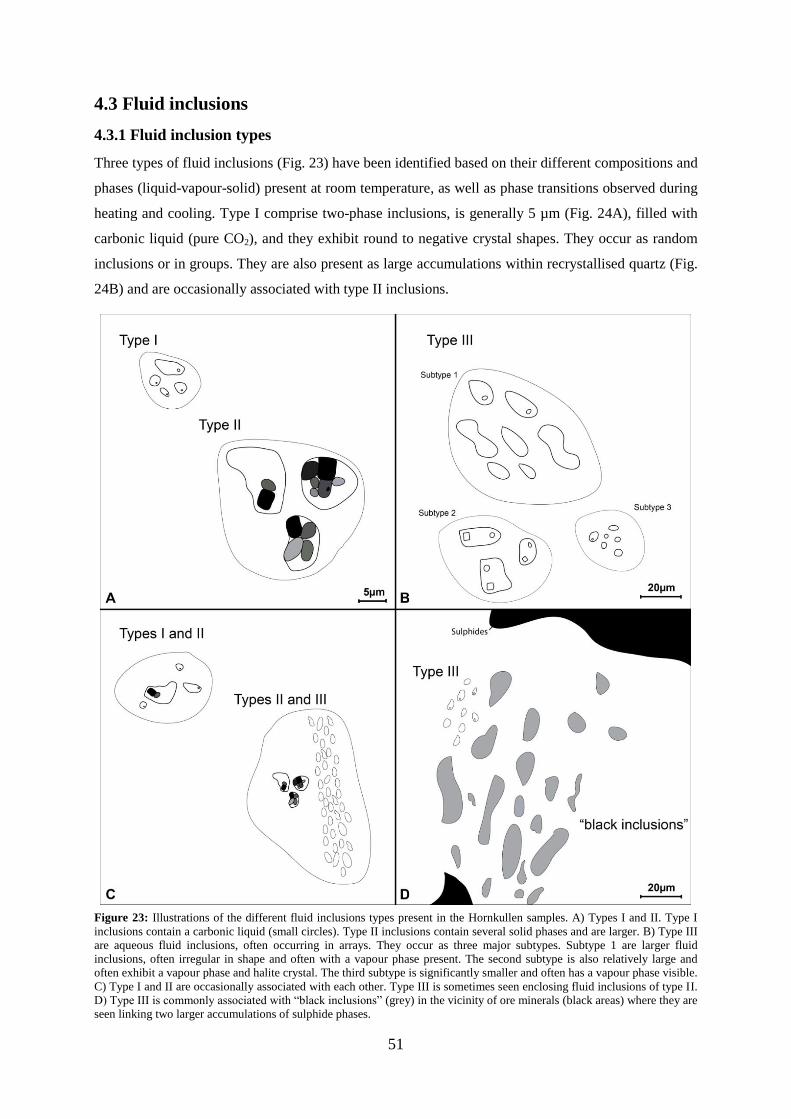
51
4.3 Fluid inclusions
4.3.1 Fluid inclusion types
Three types of fluid inclusions (Fig. 23) have been identified based on their different compositions and
phases (liquid-vapour-solid) present at room temperature, as well as phase transitions observed during
heating and cooling. Type I comprise two-phase inclusions, is generally 5 µm (Fig. 24A), filled with
carbonic liquid (pure CO2), and they exhibit round to negative crystal shapes. They occur as random
inclusions or in groups. They are also present as large accumulations within recrystallised quartz (Fig.
24B) and are occasionally associated with type II inclusions.
Figure 23: Illustrations of the different fluid inclusions types present in the Hornkullen samples. A) Types I and II. Type I
inclusions contain a carbonic liquid (small circles). Type II inclusions contain several solid phases and are larger. B) Type III
are aqueous fluid inclusions, often occurring in arrays. They occur as three major subtypes. Subtype 1 are larger fluid
inclusions, often irregular in shape and often with a vapour phase present. The second subtype is also relatively large and
often exhibit a vapour phase and halite crystal. The third subtype is significantly smaller and often has a vapour phase visible.
C) Type I and II are occasionally associated with each other. Type III is sometimes seen enclosing fluid inclusions of type II.
D) Type III is commonly associated with “black inclusions” (grey) in the vicinity of ore minerals (black areas) where they are
seen linking two larger accumulations of sulphide phases.
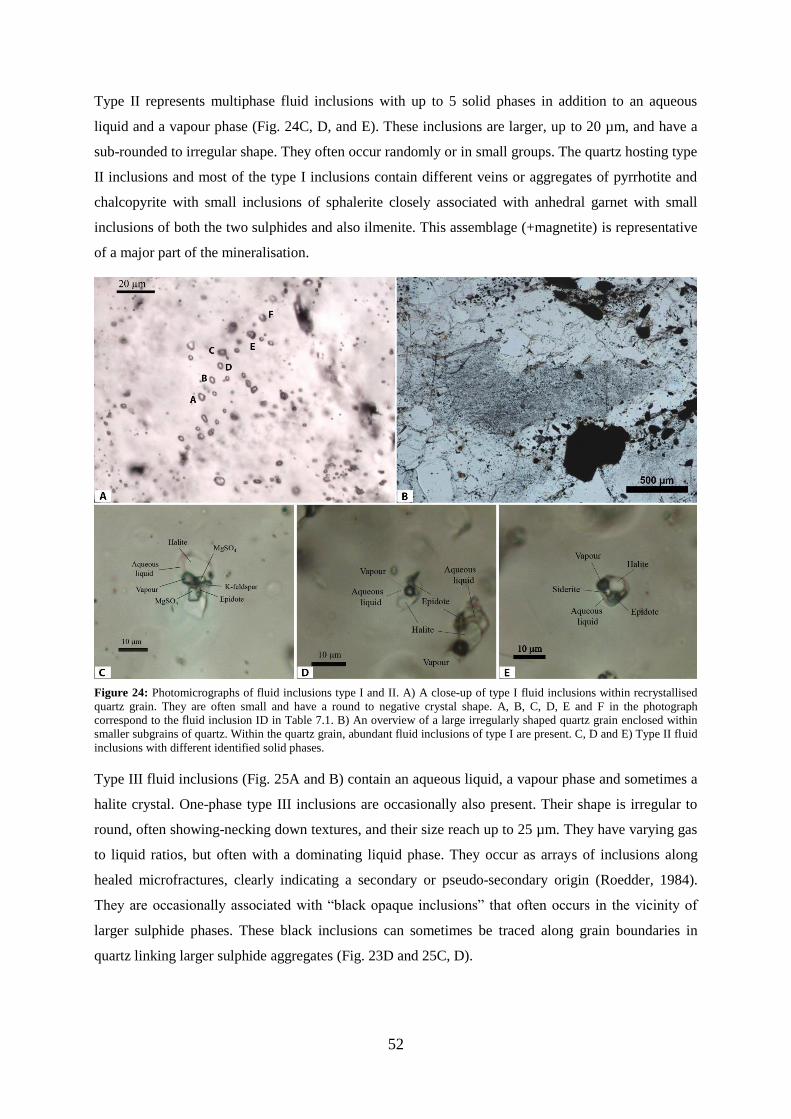
52
Type II represents multiphase fluid inclusions with up to 5 solid phases in addition to an aqueous
liquid and a vapour phase (Fig. 24C, D, and E). These inclusions are larger, up to 20 µm, and have a
sub-rounded to irregular shape. They often occur randomly or in small groups. The quartz hosting type
II inclusions and most of the type I inclusions contain different veins or aggregates of pyrrhotite and
chalcopyrite with small inclusions of sphalerite closely associated with anhedral garnet with small
inclusions of both the two sulphides and also ilmenite. This assemblage (+magnetite) is representative
of a major part of the mineralisation.
Figure 24: Photomicrographs of fluid inclusions type I and II. A) A close-up of type I fluid inclusions within recrystallised
quartz grain. They are often small and have a round to negative crystal shape. A, B, C, D, E and F in the photograph
correspond to the fluid inclusion ID in Table 7.1. B) An overview of a large irregularly shaped quartz grain enclosed within
smaller subgrains of quartz. Within the quartz grain, abundant fluid inclusions of type I are present. C, D and E) Type II fluid
inclusions with different identified solid phases.
Type III fluid inclusions (Fig. 25A and B) contain an aqueous liquid, a vapour phase and sometimes a
halite crystal. One-phase type III inclusions are occasionally also present. Their shape is irregular to
round, often showing-necking down textures, and their size reach up to 25 µm. They have varying gas
to liquid ratios, but often with a dominating liquid phase. They occur as arrays of inclusions along
healed microfractures, clearly indicating a secondary or pseudo-secondary origin (Roedder, 1984).
They are occasionally associated with “black opaque inclusions” that often occurs in the vicinity of
larger sulphide phases. These black inclusions can sometimes be traced along grain boundaries in
quartz linking larger sulphide aggregates (Fig. 23D and 25C, D).
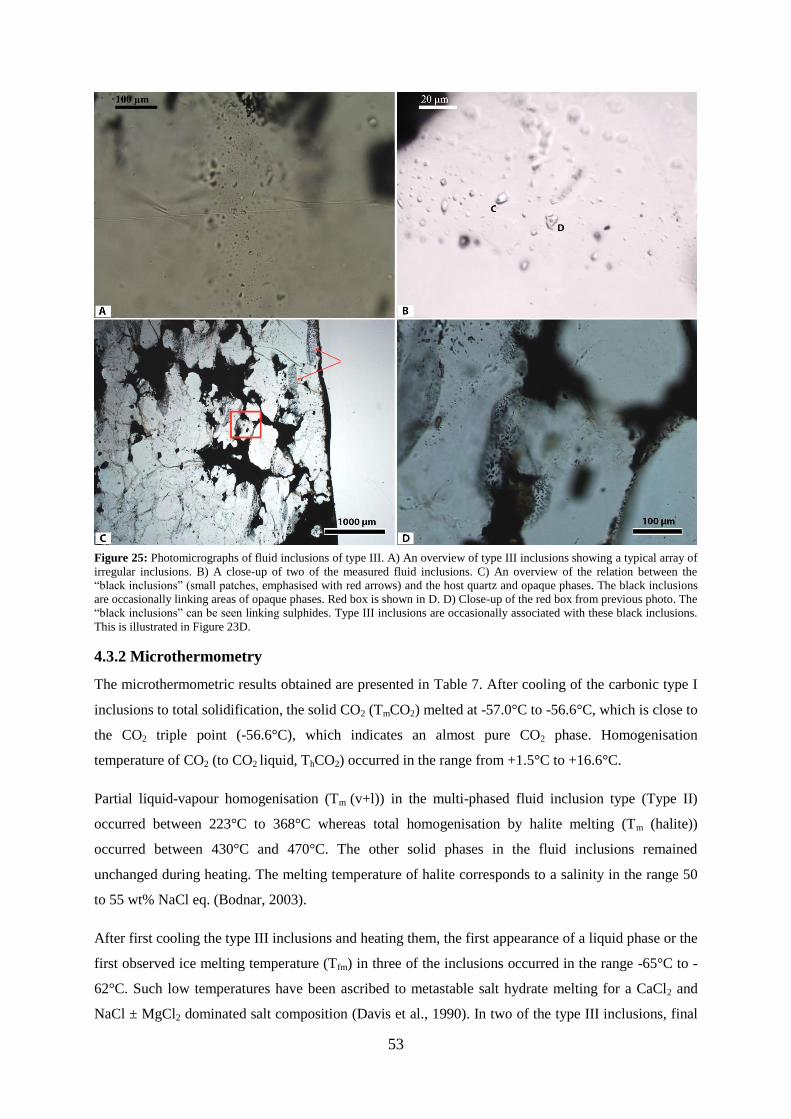
53
Figure 25: Photomicrographs of fluid inclusions of type III. A) An overview of type III inclusions showing a typical array of
irregular inclusions. B) A close-up of two of the measured fluid inclusions. C) An overview of the relation between the
“black inclusions” (small patches, emphasised with red arrows) and the host quartz and opaque phases. The black inclusions
are occasionally linking areas of opaque phases. Red box is shown in D. D) Close-up of the red box from previous photo. The
“black inclusions” can be seen linking sulphides. Type III inclusions are occasionally associated with these black inclusions.
This is illustrated in Figure 23D.
4.3.2 Microthermometry
The microthermometric results obtained are presented in Table 7. After cooling of the carbonic type I
inclusions to total solidification, the solid CO2 (TmCO2) melted at -57.0°C to -56.6°C, which is close to
the CO2 triple point (-56.6°C), which indicates an almost pure CO2 phase. Homogenisation
temperature of CO2 (to CO2 liquid, ThCO2) occurred in the range from +1.5°C to +16.6°C.
Partial liquid-vapour homogenisation (Tm (v+l)) in the multi-phased fluid inclusion type (Type II)
occurred between 223°C to 368°C whereas total homogenisation by halite melting (Tm (halite))
occurred between 430°C and 470°C. The other solid phases in the fluid inclusions remained
unchanged during heating. The melting temperature of halite corresponds to a salinity in the range 50
to 55 wt% NaCl eq. (Bodnar, 2003).
After first cooling the type III inclusions and heating them, the first appearance of a liquid phase or the
first observed ice melting temperature (Tfm) in three of the inclusions occurred in the range -65°C to -
62°C. Such low temperatures have been ascribed to metastable salt hydrate melting for a CaCl2 and
NaCl ± MgCl2 dominated salt composition (Davis et al., 1990). In two of the type III inclusions, final
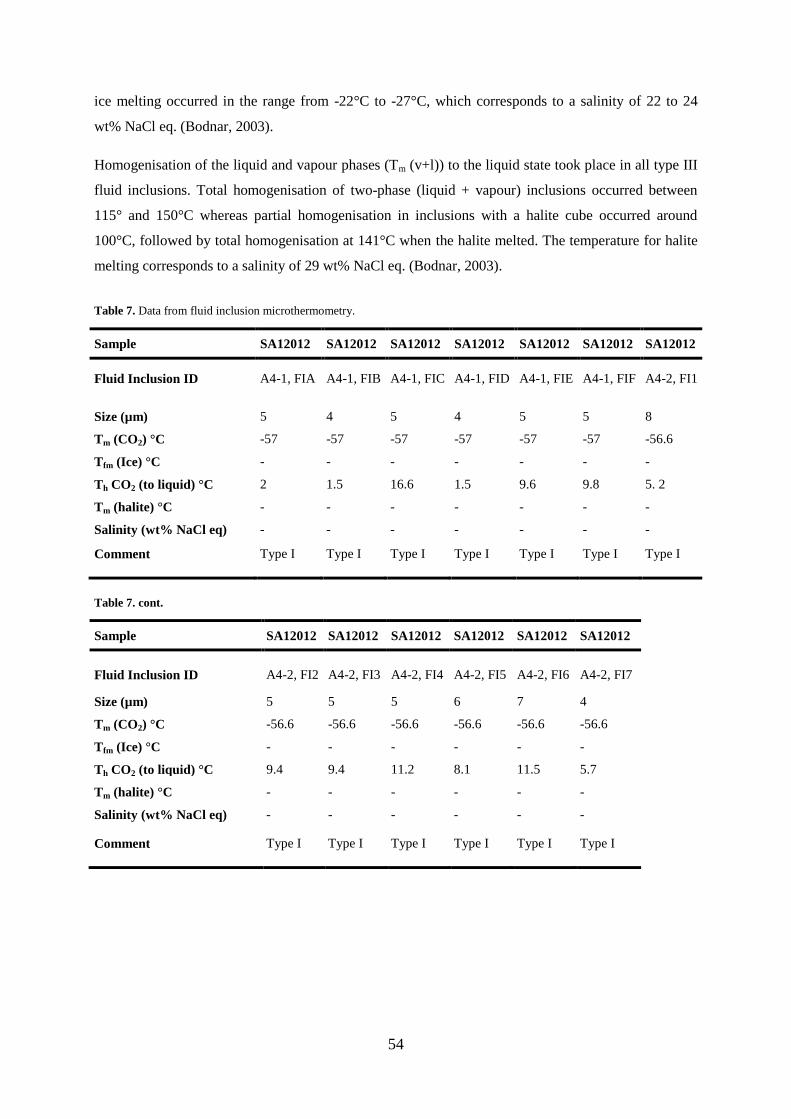
54
ice melting occurred in the range from -22°C to -27°C, which corresponds to a salinity of 22 to 24
wt% NaCl eq. (Bodnar, 2003).
Homogenisation of the liquid and vapour phases (Tm (v+l)) to the liquid state took place in all type III
fluid inclusions. Total homogenisation of two-phase (liquid + vapour) inclusions occurred between
115° and 150°C whereas partial homogenisation in inclusions with a halite cube occurred around
100°C, followed by total homogenisation at 141°C when the halite melted. The temperature for halite
melting corresponds to a salinity of 29 wt% NaCl eq. (Bodnar, 2003).
Table 7. Data from fluid inclusion microthermometry.
Sample SA12012 SA12012 SA12012 SA12012 SA12012 SA12012 SA12012
Fluid Inclusion ID
A4-1, FIA
A4-1, FIB
A4-1, FIC
A4-1, FID
A4-1, FIE
A4-1, FIF
A4-2, FI1
Size (µm) 5 4 5 4 5 5 8
Tm (CO2) °C -57 -57 -57 -57 -57 -57 -56.6
Tfm (Ice) °C - - - - - - -
Th CO2 (to liquid) °C 2 1.5 16.6 1.5 9.6 9.8 5. 2
Tm (halite) °C - - - - - - -
Salinity (wt% NaCl eq) - - - - - - -
Comment
Type I
Type I
Type I
Type I
Type I
Type I
Type I
Table 7. cont.
Sample SA12012 SA12012 SA12012 SA12012 SA12012 SA12012
Fluid Inclusion ID
A4-2, FI2
A4-2, FI3
A4-2, FI4
A4-2, FI5
A4-2, FI6
A4-2, FI7
Size (µm) 5 5 5 6 7 4
Tm (CO2) °C -56.6 -56.6 -56.6 -56.6 -56.6 -56.6
Tfm (Ice) °C - - - - - -
Th CO2 (to liquid) °C 9.4 9.4 11.2 8.1 11.5 5.7
Tm (halite) °C - - - - - -
Salinity (wt% NaCl eq) - - - - - -
Comment
Type I
Type I
Type I
Type I
Type I
Type I
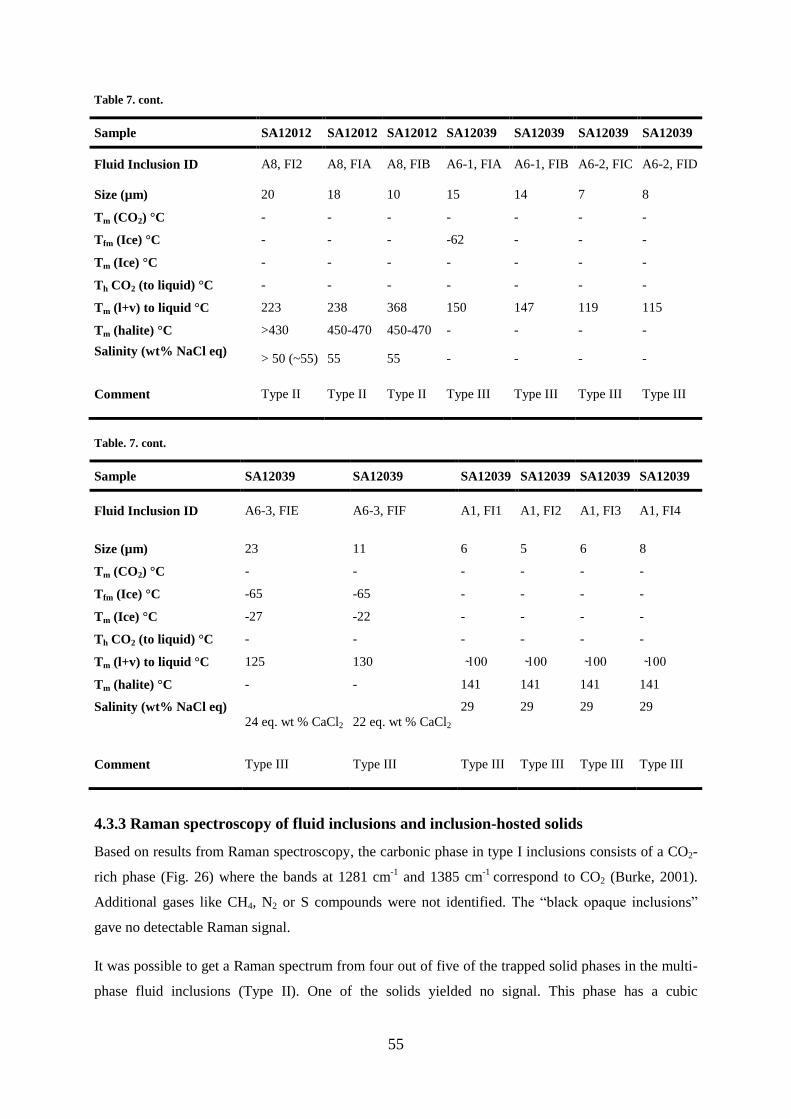
55
Table 7. cont.
Sample SA12012 SA12012 SA12012 SA12039 SA12039 SA12039 SA12039
Fluid Inclusion ID A8, FI2 A8, FIA A8, FIB A6-1, FIA A6-1, FIB A6-2, FIC A6-2, FID
Size (µm) 20 18 10 15 14 7 8
Tm (CO2) °C - - - - - - -
Tfm (Ice) °C - - - -62 - - -
Tm (Ice) °C - - - - - - -
Th CO2 (to liquid) °C - - - - - - -
Tm (l+v) to liquid °C 223 238 368 150 147 119 115
Tm (halite) °C >430 450-470 450-470 - - - -
Salinity (wt% NaCl eq)
> 50 (~55) 55 55 - - - -
Comment
Type II
Type II
Type II
Type III
Type III
Type III
Type III
Table. 7. cont.
Sample SA12039 SA12039 SA12039 SA12039 SA12039 SA12039
Fluid Inclusion ID
A6-3, FIE
A6-3, FIF
A1, FI1
A1, FI2
A1, FI3
A1, FI4
Size (µm) 23 11 6 5 6 8
Tm (CO2) °C - - - - - -
Tfm (Ice) °C -65 -65 - - - -
Tm (Ice) °C -27 -22 - - - -
Th CO2 (to liquid) °C - - - - - -
Tm (l+v) to liquid °C 125 130 100 100 100 100
Tm (halite) °C - - 141 141 141 141
Salinity (wt% NaCl eq)
24 eq. wt % CaCl2
22 eq. wt % CaCl2
29
29
29
29
Comment
Type III
Type III
Type III
Type III
Type III
Type III
4.3.3 Raman spectroscopy of fluid inclusions and inclusion-hosted solids
Based on results from Raman spectroscopy, the carbonic phase in type I inclusions consists of a CO2-
rich phase (Fig. 26) where the bands at 1281 cm-1
and 1385 cm-1
correspond to CO2 (Burke, 2001).
Additional gases like CH4, N2 or S compounds were not identified. The “black opaque inclusions”
gave no detectable Raman signal.
It was possible to get a Raman spectrum from four out of five of the trapped solid phases in the multi-
phase fluid inclusions (Type II). One of the solids yielded no signal. This phase has a cubic
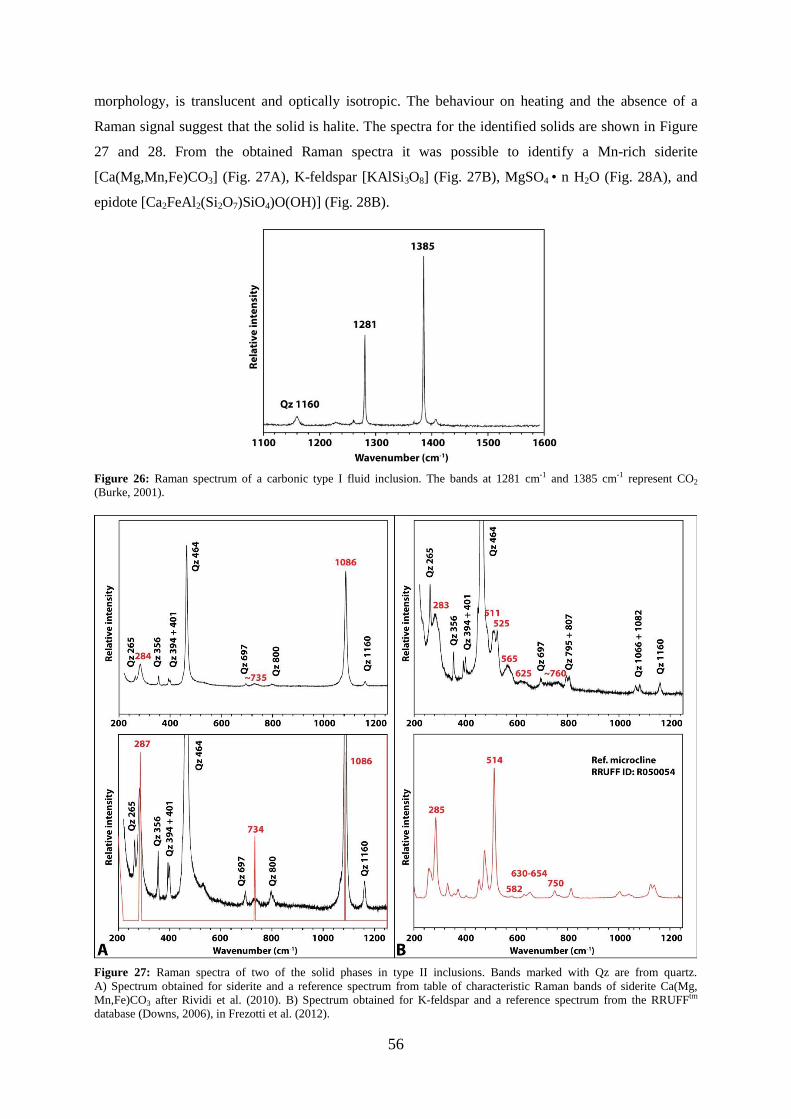
56
morphology, is translucent and optically isotropic. The behaviour on heating and the absence of a
Raman signal suggest that the solid is halite. The spectra for the identified solids are shown in Figure
27 and 28. From the obtained Raman spectra it was possible to identify a Mn-rich siderite
[Ca(Mg,Mn,Fe)CO3] (Fig. 27A), K-feldspar [KAlSi3O8] (Fig. 27B), MgSO4 • n H2O (Fig. 28A), and
epidote [Ca2FeAl2(Si2O7)SiO4)O(OH)] (Fig. 28B).
Figure 26: Raman spectrum of a carbonic type I fluid inclusion. The bands at 1281 cm-1 and 1385 cm-1 represent CO2
(Burke, 2001).
Figure 27: Raman spectra of two of the solid phases in type II inclusions. Bands marked with Qz are from quartz.
A) Spectrum obtained for siderite and a reference spectrum from table of characteristic Raman bands of siderite Ca(Mg,
Mn,Fe)CO3 after Rividi et al. (2010). B) Spectrum obtained for K-feldspar and a reference spectrum from the RRUFFtm
database (Downs, 2006), in Frezotti et al. (2012).
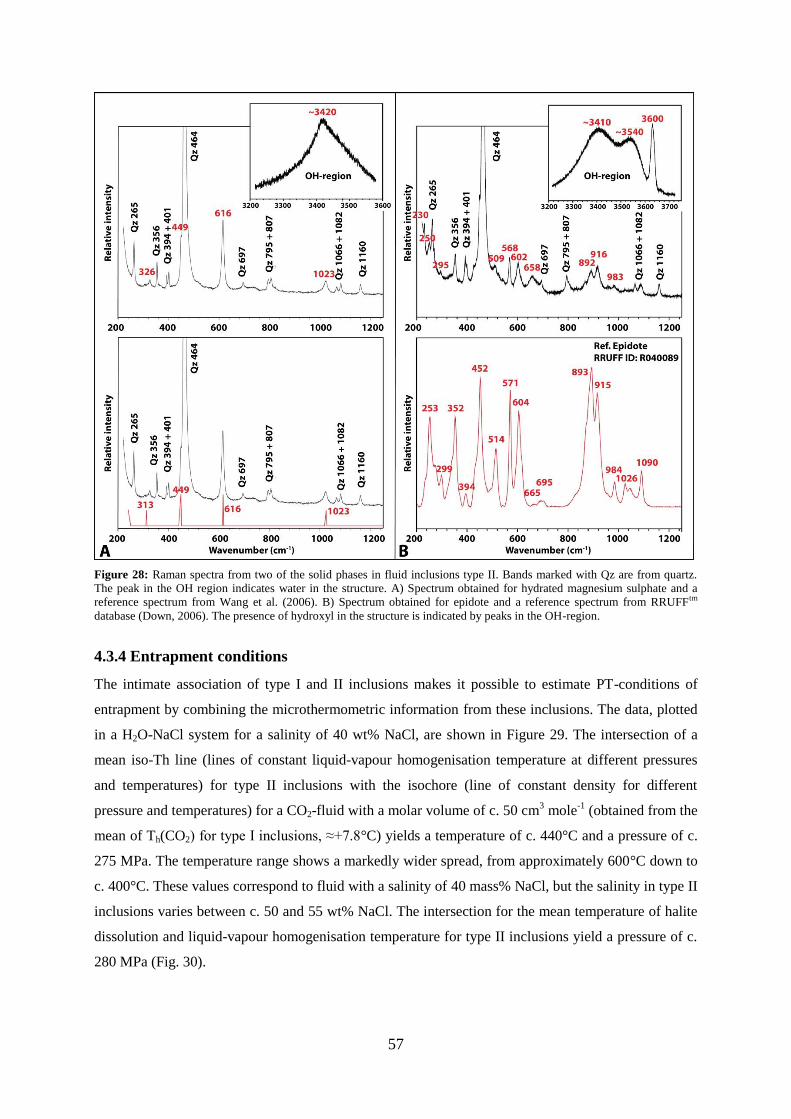
57
Figure 28: Raman spectra from two of the solid phases in fluid inclusions type II. Bands marked with Qz are from quartz.
The peak in the OH region indicates water in the structure. A) Spectrum obtained for hydrated magnesium sulphate and a
reference spectrum from Wang et al. (2006). B) Spectrum obtained for epidote and a reference spectrum from RRUFFtm
database (Down, 2006). The presence of hydroxyl in the structure is indicated by peaks in the OH-region.
4.3.4 Entrapment conditions
The intimate association of type I and II inclusions makes it possible to estimate PT-conditions of
entrapment by combining the microthermometric information from these inclusions. The data, plotted
in a H2O-NaCl system for a salinity of 40 wt% NaCl, are shown in Figure 29. The intersection of a
mean iso-Th line (lines of constant liquid-vapour homogenisation temperature at different pressures
and temperatures) for type II inclusions with the isochore (line of constant density for different
pressure and temperatures) for a CO2-fluid with a molar volume of c. 50 cm3 mole
-1 (obtained from the
mean of Th(CO2) for type I inclusions, ≈+7.8°C) yields a temperature of c. 440°C and a pressure of c.
275 MPa. The temperature range shows a markedly wider spread, from approximately 600°C down to
c. 400°C. These values correspond to fluid with a salinity of 40 mass% NaCl, but the salinity in type II
inclusions varies between c. 50 and 55 wt% NaCl. The intersection for the mean temperature of halite
dissolution and liquid-vapour homogenisation temperature for type II inclusions yield a pressure of c.
280 MPa (Fig. 30).
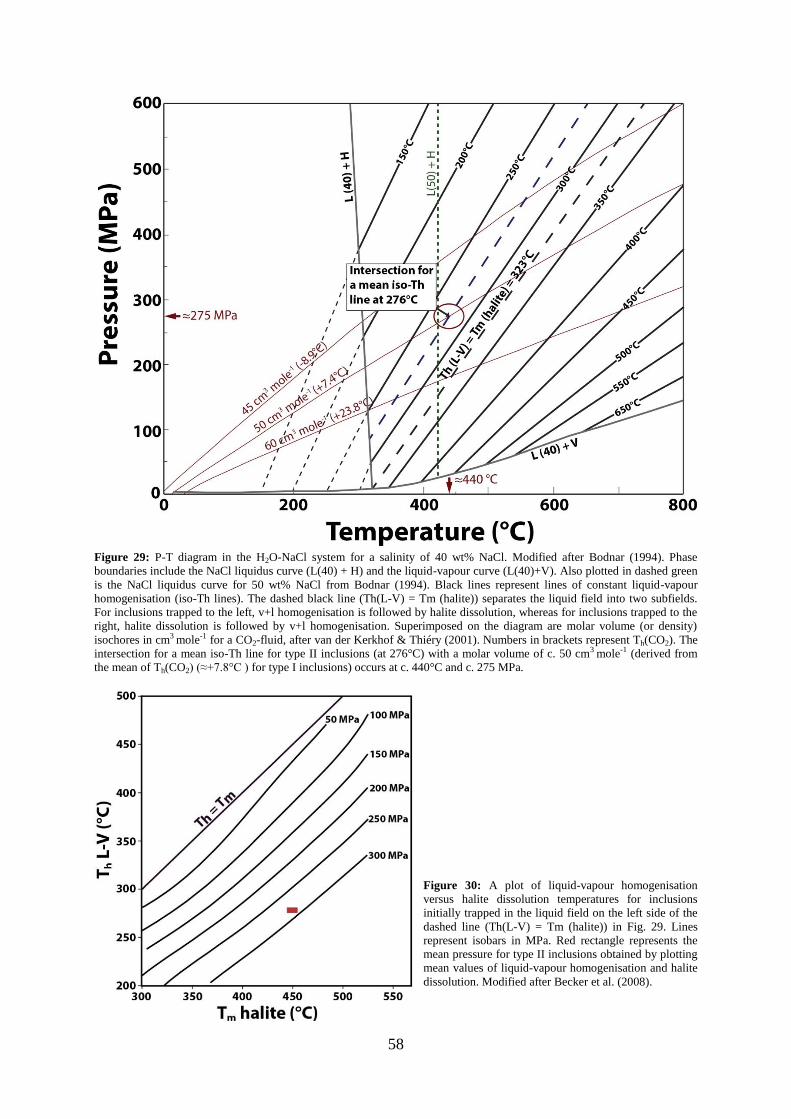
58
Figure 29: P-T diagram in the H2O-NaCl system for a salinity of 40 wt% NaCl. Modified after Bodnar (1994). Phase
boundaries include the NaCl liquidus curve (L(40) + H) and the liquid-vapour curve (L(40)+V). Also plotted in dashed green
is the NaCl liquidus curve for 50 wt% NaCl from Bodnar (1994). Black lines represent lines of constant liquid-vapour
homogenisation (iso-Th lines). The dashed black line (Th(L-V) = Tm (halite)) separates the liquid field into two subfields.
For inclusions trapped to the left, v+l homogenisation is followed by halite dissolution, whereas for inclusions trapped to the
right, halite dissolution is followed by v+l homogenisation. Superimposed on the diagram are molar volume (or density)
isochores in cm3 mole-1 for a CO2-fluid, after van der Kerkhof & Thiéry (2001). Numbers in brackets represent Th(CO2). The
intersection for a mean iso-Th line for type II inclusions (at 276°C) with a molar volume of c. 50 cm3 mole-1 (derived from
the mean of Th(CO2) (≈+7.8°C ) for type I inclusions) occurs at c. 440°C and c. 275 MPa.
Figure 30: A plot of liquid-vapour homogenisation
versus halite dissolution temperatures for inclusions
initially trapped in the liquid field on the left side of the
dashed line (Th(L-V) = Tm (halite)) in Fig. 29. Lines
represent isobars in MPa. Red rectangle represents the
mean pressure for type II inclusions obtained by plotting
mean values of liquid-vapour homogenisation and halite
dissolution. Modified after Becker et al. (2008).
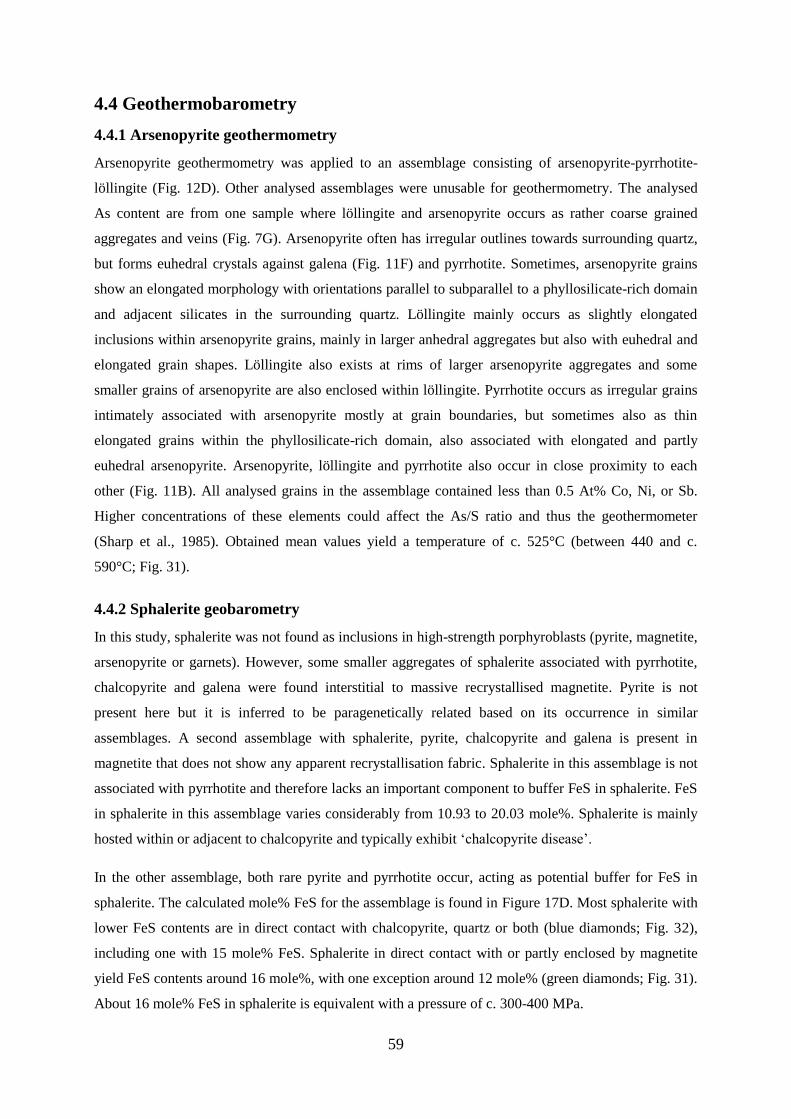
59
4.4 Geothermobarometry
4.4.1 Arsenopyrite geothermometry
Arsenopyrite geothermometry was applied to an assemblage consisting of arsenopyrite-pyrrhotite-
löllingite (Fig. 12D). Other analysed assemblages were unusable for geothermometry. The analysed
As content are from one sample where löllingite and arsenopyrite occurs as rather coarse grained
aggregates and veins (Fig. 7G). Arsenopyrite often has irregular outlines towards surrounding quartz,
but forms euhedral crystals against galena (Fig. 11F) and pyrrhotite. Sometimes, arsenopyrite grains
show an elongated morphology with orientations parallel to subparallel to a phyllosilicate-rich domain
and adjacent silicates in the surrounding quartz. Löllingite mainly occurs as slightly elongated
inclusions within arsenopyrite grains, mainly in larger anhedral aggregates but also with euhedral and
elongated grain shapes. Löllingite also exists at rims of larger arsenopyrite aggregates and some
smaller grains of arsenopyrite are also enclosed within löllingite. Pyrrhotite occurs as irregular grains
intimately associated with arsenopyrite mostly at grain boundaries, but sometimes also as thin
elongated grains within the phyllosilicate-rich domain, also associated with elongated and partly
euhedral arsenopyrite. Arsenopyrite, löllingite and pyrrhotite also occur in close proximity to each
other (Fig. 11B). All analysed grains in the assemblage contained less than 0.5 At% Co, Ni, or Sb.
Higher concentrations of these elements could affect the As/S ratio and thus the geothermometer
(Sharp et al., 1985). Obtained mean values yield a temperature of c. 525°C (between 440 and c.
590°C; Fig. 31).
4.4.2 Sphalerite geobarometry
In this study, sphalerite was not found as inclusions in high-strength porphyroblasts (pyrite, magnetite,
arsenopyrite or garnets). However, some smaller aggregates of sphalerite associated with pyrrhotite,
chalcopyrite and galena were found interstitial to massive recrystallised magnetite. Pyrite is not
present here but it is inferred to be paragenetically related based on its occurrence in similar
assemblages. A second assemblage with sphalerite, pyrite, chalcopyrite and galena is present in
magnetite that does not show any apparent recrystallisation fabric. Sphalerite in this assemblage is not
associated with pyrrhotite and therefore lacks an important component to buffer FeS in sphalerite. FeS
in sphalerite in this assemblage varies considerably from 10.93 to 20.03 mole%. Sphalerite is mainly
hosted within or adjacent to chalcopyrite and typically exhibit „chalcopyrite disease‟.
In the other assemblage, both rare pyrite and pyrrhotite occur, acting as potential buffer for FeS in
sphalerite. The calculated mole% FeS for the assemblage is found in Figure 17D. Most sphalerite with
lower FeS contents are in direct contact with chalcopyrite, quartz or both (blue diamonds; Fig. 32),
including one with 15 mole% FeS. Sphalerite in direct contact with or partly enclosed by magnetite
yield FeS contents around 16 mole%, with one exception around 12 mole% (green diamonds; Fig. 31).
About 16 mole% FeS in sphalerite is equivalent with a pressure of c. 300-400 MPa.
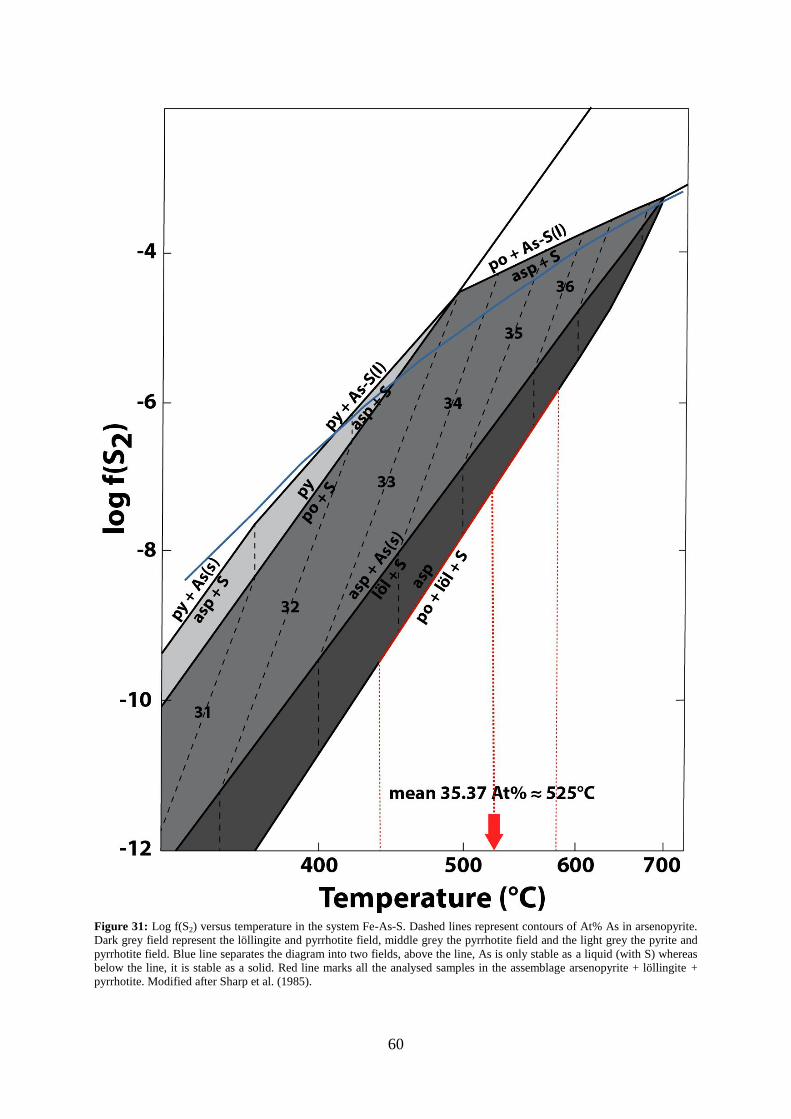
60
Figure 31: Log f(S2) versus temperature in the system Fe-As-S. Dashed lines represent contours of At% As in arsenopyrite.
Dark grey field represent the löllingite and pyrrhotite field, middle grey the pyrrhotite field and the light grey the pyrite and
pyrrhotite field. Blue line separates the diagram into two fields, above the line, As is only stable as a liquid (with S) whereas
below the line, it is stable as a solid. Red line marks all the analysed samples in the assemblage arsenopyrite + löllingite +
pyrrhotite. Modified after Sharp et al. (1985).
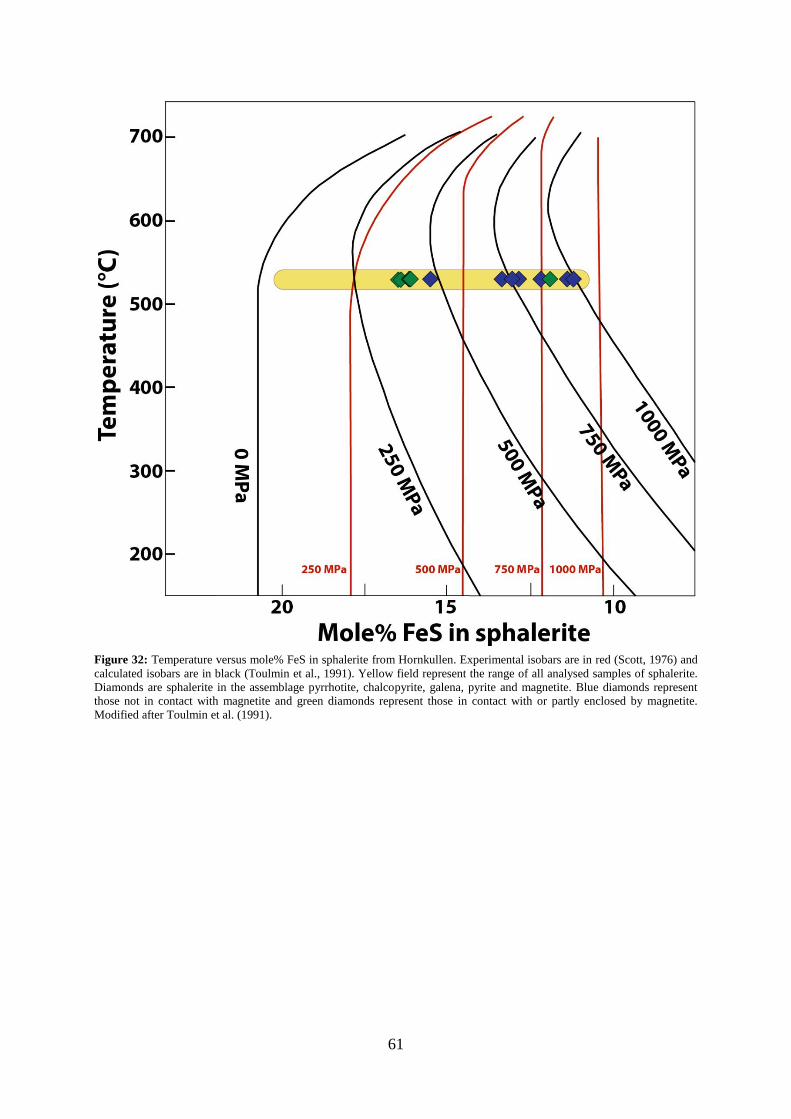
61
Figure 32: Temperature versus mole% FeS in sphalerite from Hornkullen. Experimental isobars are in red (Scott, 1976) and
calculated isobars are in black (Toulmin et al., 1991). Yellow field represent the range of all analysed samples of sphalerite.
Diamonds are sphalerite in the assemblage pyrrhotite, chalcopyrite, galena, pyrite and magnetite. Blue diamonds represent
those not in contact with magnetite and green diamonds represent those in contact with or partly enclosed by magnetite.
Modified after Toulmin et al. (1991).
62
5. Discussion
5.1 Features of deformation, metamorphism and remobilisation
The conditions attained during the Svecokarelian metamorphism and deformation in western
Bergslagen was mainly in low pressure amphibolite facies, although a greenschist facies area is
preserved just to the east of Hornkullen (Björk, 1986; Lundström, 1995). Nevertheless, at amphibolite
facies conditions, many of the more common base-metal sulphides will be very ductile, whereas more
competent ore minerals and silicates most likely deform in a brittle manner, thus creating the distinct
contrasts in rheological behaviour necessary for mechanical remobilisation. The lack of pyrite in the
massive parts of the ore also ensures that the contrast is sufficiently high since more pyrite-rich
assemblages can act as relatively competent bodies (Marshall & Gilligan, 1993). The presence of
many metamorphic hydrous phases like amphiboles and micas in the ore assemblages also indicates
that fluids played a major role during deformation and metamorphism of the mineralisation.
5.1.1 Brittle-ductile behaviour
The most prominent consequence of the brittle-ductile contrast is the infill of ductile and mobile ore
minerals into fractures of more competent ore minerals and silicates. The minerals that act as infill are
mainly galena and chalcopyrite with minor boulangerite, meneghinite and sphalerite. Pyrrhotite,
although considered as less competent (e.g. Grad & Skinner, 1987), is not observed filling fractures. In
the samples boulangerite and meneghinite are abundant, they commonly display similar features as
galena and chalcopyrite. Sphalerite is only a minor infilling mineral, but in massive sphalerite ore, it
could be an important infilling mineral in pyrite. The overall sparse occurrence of sphalerite in
fractures in competent minerals is probably related to the low abundance of this mineral in the
Hornkullen deposit. The fractures are often small, either initiated at grain boundaries or fractures that
penetrate the entire grain (e.g. 33A), filled with the surrounding sulphide(s). In pyrite, fractures
occasionally developed along crystallographically defined planes. Both are mostly characterised by
“matching walls” (Vokes & Craig, 1993), but some have slightly corroded boundaries, indicating a
component of replacement during or subsequent to the infilling process. Inclusions in porphyroblastic
garnets are sometimes linked via fractures to the surrounding sulphides, which imply that the infilling
processes probably took place sometime after the growth of the garnets (Vokes & Craig, 1993).
Fractures in sphalerite and quartz are also aligned parallel or subparallel to each other and indicate
local stress-induced deformation and subsequent infilling.
Another related but distinctive type of brittle-ductile relationship is commonly seen in magnetite and
quartz. Both minerals show characteristically recrystallised equilibrium textures, featuring 120° triple
junctions, which occasionally appear to have been opened along their grain boundaries by brittle
deformation. The mobile ore minerals galena, chalcopyrite and pyrrhotite have subsequently been
remobilised into the space interstitial to the grain boundaries that often creates slightly irregular grain
63
boundary morphology (e.g. Fig. 33B). These features suggest that the deformation occurred
subsequent to the recovery and recrystallisation of magnetite and quartz. In contrast to the other
fracture-infilling relationship, pyrrhotite commonly occurs interstitial to fractured triple junctions, thus
verifying its ductile behaviour. Magnetite interstitial to granoblastic quartz might suggest mechanical
remobilisation of magnetite. However, this is unlikely considering the competence of magnetite. It it
thus inferred to be the result of chemical remobilisation into fractured quartz.
Locally, competent minerals are extremely fragmented and often have a sub-rounded to rounded
morphology surrounded by a matrix of less competent minerals like galena, pyrrhotite and
chalcopyrite (Fig. 33C and D). The matrix minerals must have filled open space around the brittle
fragments that possibly also led to a rotation of some fragments, which resulted in the sub-rounded to
rounded grain morphology. Rounded and spherical grains of quartz often occur within a matrix of
galena and pyrrhotite (Fig. 33E), comparable to “ball ore texture” (e.g. Vokes, 1973), implying similar
rotating processes.
Most of the deformation and remobilisation occurred during retrograde conditions as shown by for
example fractured garnet and amphibole porphyroblasts as well as fractures along recrystallised grain
boundaries in quartz and magnetite. The brittle deformation of the more competent minerals was either
obtained via cataclastic deformation, by hydrofracturing or most likely, a combination of both (Vokes
& Craig, 1993). The infilling mechanisms probably involved both mechanical flow and fluid-assisted
replacement processes as evident by the corroded appearance of some of the observed fracture and
grain boundaries. Additionally, the ore minerals that occur as fracture fillings in more competent
phases are commonly found as inclusions in the latter, indicating that the remobilisation was local.
The observed brittle-ductile behaviour can most easily be interpreted as being a direct consequence of
high temperature deformation at conditions attained during the Svecokarelian orogeny (cf. Fig. 6).
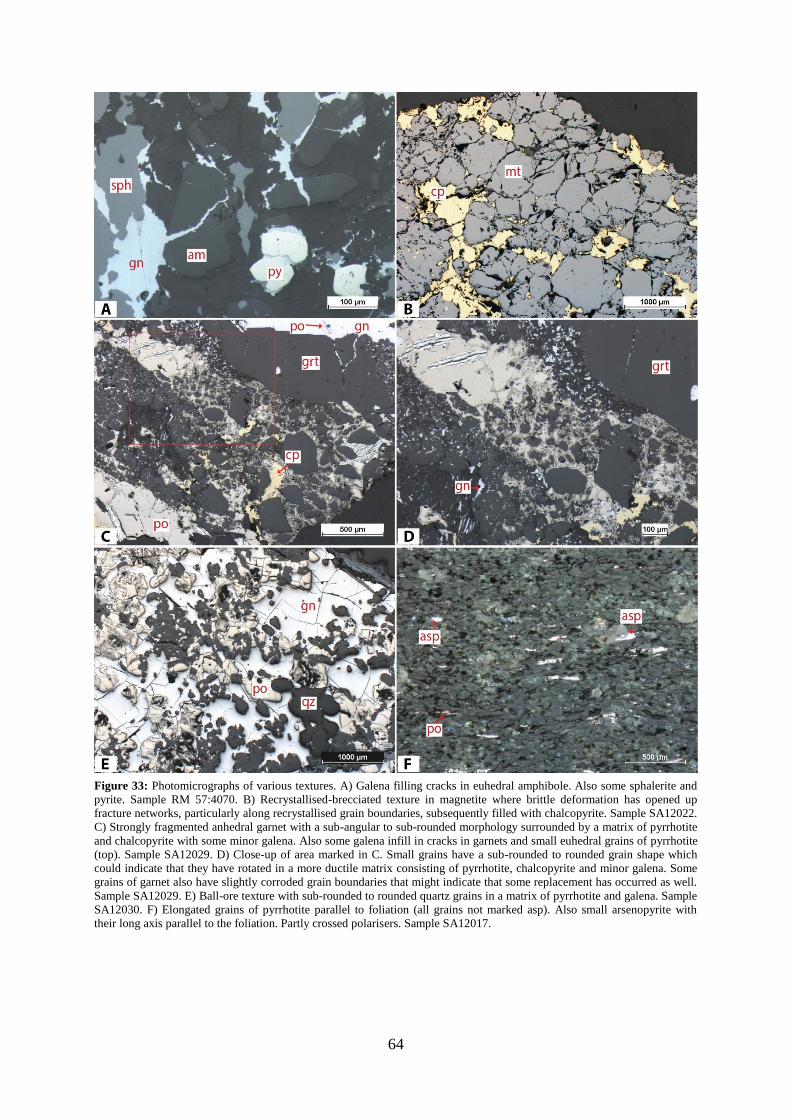
64
Figure 33: Photomicrographs of various textures. A) Galena filling cracks in euhedral amphibole. Also some sphalerite and
pyrite. Sample RM 57:4070. B) Recrystallised-brecciated texture in magnetite where brittle deformation has opened up
fracture networks, particularly along recrystallised grain boundaries, subsequently filled with chalcopyrite. Sample SA12022.
C) Strongly fragmented anhedral garnet with a sub-angular to sub-rounded morphology surrounded by a matrix of pyrrhotite
and chalcopyrite with some minor galena. Also some galena infill in cracks in garnets and small euhedral grains of pyrrhotite
(top). Sample SA12029. D) Close-up of area marked in C. Small grains have a sub-rounded to rounded grain shape which
could indicate that they have rotated in a more ductile matrix consisting of pyrrhotite, chalcopyrite and minor galena. Some
grains of garnet also have slightly corroded grain boundaries that might indicate that some replacement has occurred as well.
Sample SA12029. E) Ball-ore texture with sub-rounded to rounded quartz grains in a matrix of pyrrhotite and galena. Sample
SA12030. F) Elongated grains of pyrrhotite parallel to foliation (all grains not marked asp). Also small arsenopyrite with
their long axis parallel to the foliation. Partly crossed polarisers. Sample SA12017.
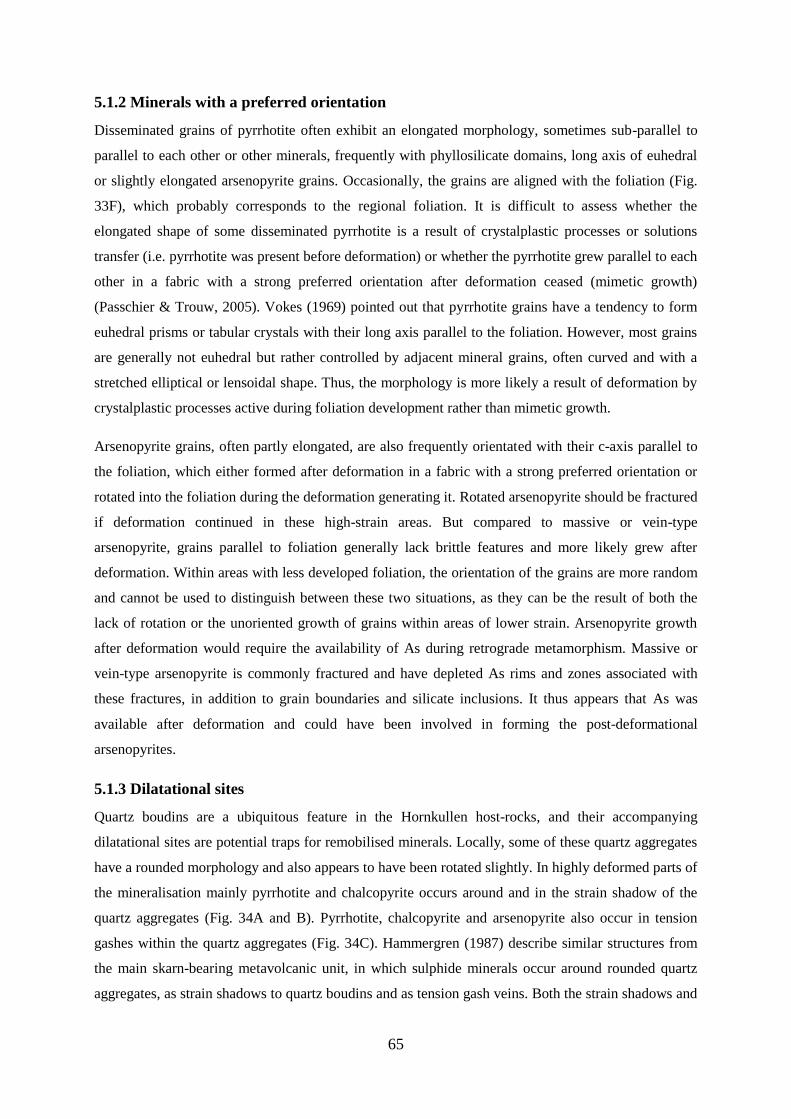
65
5.1.2 Minerals with a preferred orientation
Disseminated grains of pyrrhotite often exhibit an elongated morphology, sometimes sub-parallel to
parallel to each other or other minerals, frequently with phyllosilicate domains, long axis of euhedral
or slightly elongated arsenopyrite grains. Occasionally, the grains are aligned with the foliation (Fig.
33F), which probably corresponds to the regional foliation. It is difficult to assess whether the
elongated shape of some disseminated pyrrhotite is a result of crystalplastic processes or solutions
transfer (i.e. pyrrhotite was present before deformation) or whether the pyrrhotite grew parallel to each
other in a fabric with a strong preferred orientation after deformation ceased (mimetic growth)
(Passchier & Trouw, 2005). Vokes (1969) pointed out that pyrrhotite grains have a tendency to form
euhedral prisms or tabular crystals with their long axis parallel to the foliation. However, most grains
are generally not euhedral but rather controlled by adjacent mineral grains, often curved and with a
stretched elliptical or lensoidal shape. Thus, the morphology is more likely a result of deformation by
crystalplastic processes active during foliation development rather than mimetic growth.
Arsenopyrite grains, often partly elongated, are also frequently orientated with their c-axis parallel to
the foliation, which either formed after deformation in a fabric with a strong preferred orientation or
rotated into the foliation during the deformation generating it. Rotated arsenopyrite should be fractured
if deformation continued in these high-strain areas. But compared to massive or vein-type
arsenopyrite, grains parallel to foliation generally lack brittle features and more likely grew after
deformation. Within areas with less developed foliation, the orientation of the grains are more random
and cannot be used to distinguish between these two situations, as they can be the result of both the
lack of rotation or the unoriented growth of grains within areas of lower strain. Arsenopyrite growth
after deformation would require the availability of As during retrograde metamorphism. Massive or
vein-type arsenopyrite is commonly fractured and have depleted As rims and zones associated with
these fractures, in addition to grain boundaries and silicate inclusions. It thus appears that As was
available after deformation and could have been involved in forming the post-deformational
arsenopyrites.
5.1.3 Dilatational sites
Quartz boudins are a ubiquitous feature in the Hornkullen host-rocks, and their accompanying
dilatational sites are potential traps for remobilised minerals. Locally, some of these quartz aggregates
have a rounded morphology and also appears to have been rotated slightly. In highly deformed parts of
the mineralisation mainly pyrrhotite and chalcopyrite occurs around and in the strain shadow of the
quartz aggregates (Fig. 34A and B). Pyrrhotite, chalcopyrite and arsenopyrite also occur in tension
gashes within the quartz aggregates (Fig. 34C). Hammergren (1987) describe similar structures from
the main skarn-bearing metavolcanic unit, in which sulphide minerals occur around rounded quartz
aggregates, as strain shadows to quartz boudins and as tension gash veins. Both the strain shadows and
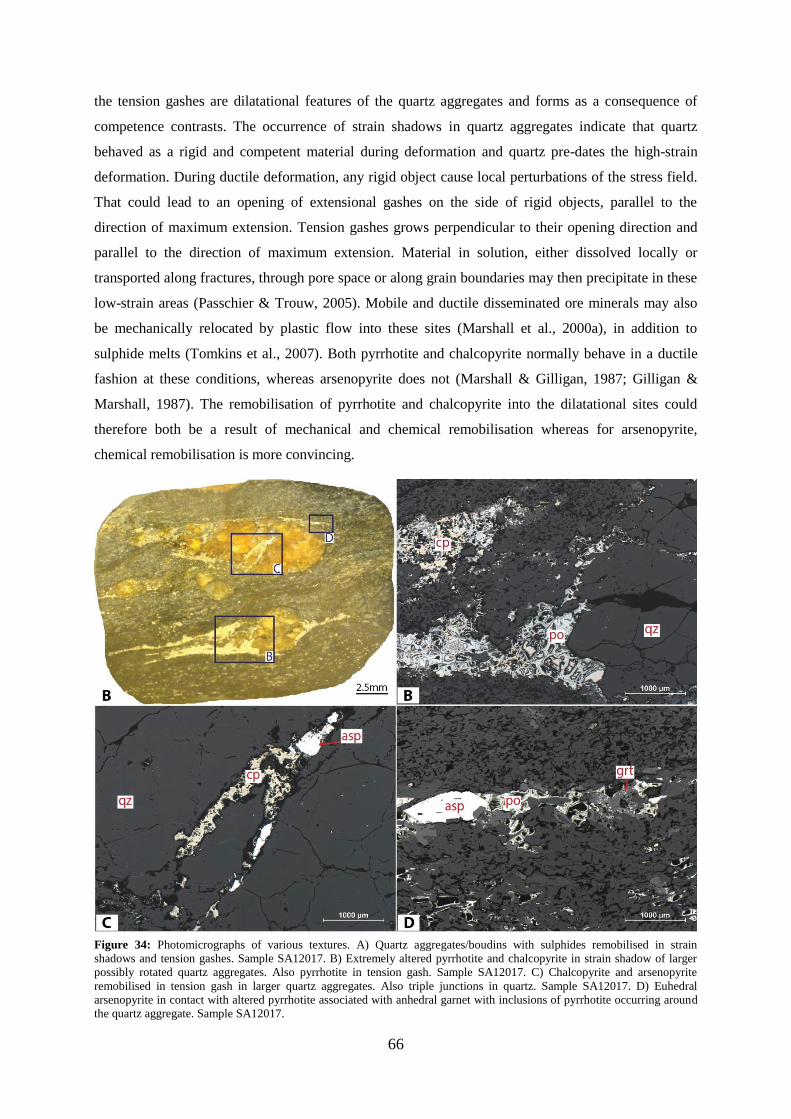
66
the tension gashes are dilatational features of the quartz aggregates and forms as a consequence of
competence contrasts. The occurrence of strain shadows in quartz aggregates indicate that quartz
behaved as a rigid and competent material during deformation and quartz pre-dates the high-strain
deformation. During ductile deformation, any rigid object cause local perturbations of the stress field.
That could lead to an opening of extensional gashes on the side of rigid objects, parallel to the
direction of maximum extension. Tension gashes grows perpendicular to their opening direction and
parallel to the direction of maximum extension. Material in solution, either dissolved locally or
transported along fractures, through pore space or along grain boundaries may then precipitate in these
low-strain areas (Passchier & Trouw, 2005). Mobile and ductile disseminated ore minerals may also
be mechanically relocated by plastic flow into these sites (Marshall et al., 2000a), in addition to
sulphide melts (Tomkins et al., 2007). Both pyrrhotite and chalcopyrite normally behave in a ductile
fashion at these conditions, whereas arsenopyrite does not (Marshall & Gilligan, 1987; Gilligan &
Marshall, 1987). The remobilisation of pyrrhotite and chalcopyrite into the dilatational sites could
therefore both be a result of mechanical and chemical remobilisation whereas for arsenopyrite,
chemical remobilisation is more convincing.
Figure 34: Photomicrographs of various textures. A) Quartz aggregates/boudins with sulphides remobilised in strain
shadows and tension gashes. Sample SA12017. B) Extremely altered pyrrhotite and chalcopyrite in strain shadow of larger
possibly rotated quartz aggregates. Also pyrrhotite in tension gash. Sample SA12017. C) Chalcopyrite and arsenopyrite
remobilised in tension gash in larger quartz aggregates. Also triple junctions in quartz. Sample SA12017. D) Euhedral
arsenopyrite in contact with altered pyrrhotite associated with anhedral garnet with inclusions of pyrrhotite occurring around
the quartz aggregate. Sample SA12017.
67
5.1.4 Garnet-ore mineral relations
Garnet porphyroblasts, mainly almandine, are a very common feature of the ore. Ore mineral
inclusions are abundant within garnet and include (in decreasing order) galena, pyrrhotite, magnetite,
chalcopyrite, arsenopyrite, ilmenite, tetrahedrite and pyrite. The appearance of the inclusions and the
garnet itself varies considerably within the deposit. Commonly, small inclusions are often clustered
within the core of more euhedral garnets (e.g. Fig. 35A). This poikilitic texture is also very common in
the case of anhedral garnet aggregates that occasionally hosts larger or both larger and smaller
inclusions (e.g. 18C). In addition to the very poikilitic garnets are garnets with only larger inclusions.
The larger inclusions in these garnets were most likely included through overgrowth by the garnet.
Figure 35: Photomicrographs of various textures. A) Subhedral poikilitic garnet porphyroblast with inclusions of galena,
magnetite and ilmenite. Sample SA12005. B) Anhedral garnet occurring with magnetite and pyrrhotite in fractures in quartz.
Sample SA12026. C) Close up of B. Magnetite, anhedral garnet and pyrrhotite occurring as fractures in quartz. Sample
SA12026. D) Recrystallised fine-grained magnetite in a preferred orientation parallel with elongated grains of pyrrhotite.
Also some party annealed and recrystallised magnetite that could indicate that annealing and static recrystallisation were
incomplete. Sample SA12027.
In the case for the very poikilitic garnets, the distribution of the inclusions close to the cores of the
garnets does not resemble that of a “pre-garnet state”. It is suggested that the more euhedral garnet
grew at a site rich in ore minerals, initially at a high growth rate, which allowed some inclusions to be
incorporated into the cores whereas other were partially or fully consumed. As the growth rate of the
garnet reduced, ore minerals were completely removed, as evident by the frequently inclusions free
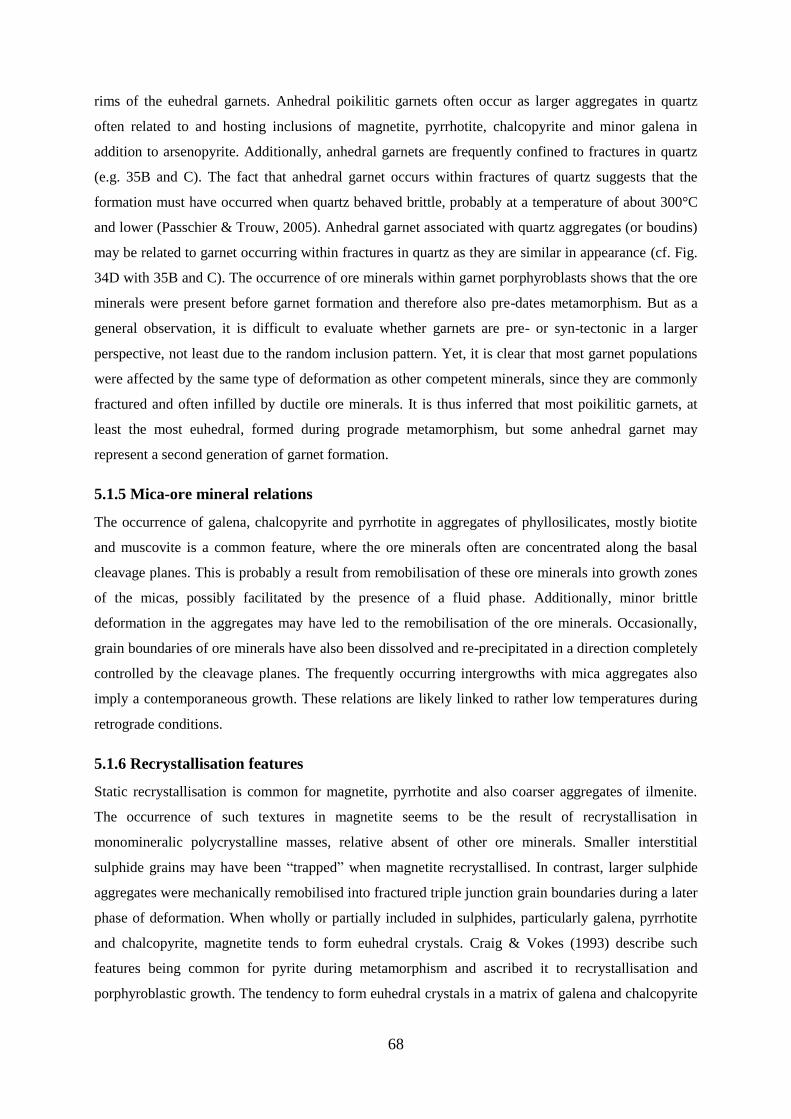
68
rims of the euhedral garnets. Anhedral poikilitic garnets often occur as larger aggregates in quartz
often related to and hosting inclusions of magnetite, pyrrhotite, chalcopyrite and minor galena in
addition to arsenopyrite. Additionally, anhedral garnets are frequently confined to fractures in quartz
(e.g. 35B and C). The fact that anhedral garnet occurs within fractures of quartz suggests that the
formation must have occurred when quartz behaved brittle, probably at a temperature of about 300°C
and lower (Passchier & Trouw, 2005). Anhedral garnet associated with quartz aggregates (or boudins)
may be related to garnet occurring within fractures in quartz as they are similar in appearance (cf. Fig.
34D with 35B and C). The occurrence of ore minerals within garnet porphyroblasts shows that the ore
minerals were present before garnet formation and therefore also pre-dates metamorphism. But as a
general observation, it is difficult to evaluate whether garnets are pre- or syn-tectonic in a larger
perspective, not least due to the random inclusion pattern. Yet, it is clear that most garnet populations
were affected by the same type of deformation as other competent minerals, since they are commonly
fractured and often infilled by ductile ore minerals. It is thus inferred that most poikilitic garnets, at
least the most euhedral, formed during prograde metamorphism, but some anhedral garnet may
represent a second generation of garnet formation.
5.1.5 Mica-ore mineral relations
The occurrence of galena, chalcopyrite and pyrrhotite in aggregates of phyllosilicates, mostly biotite
and muscovite is a common feature, where the ore minerals often are concentrated along the basal
cleavage planes. This is probably a result from remobilisation of these ore minerals into growth zones
of the micas, possibly facilitated by the presence of a fluid phase. Additionally, minor brittle
deformation in the aggregates may have led to the remobilisation of the ore minerals. Occasionally,
grain boundaries of ore minerals have also been dissolved and re-precipitated in a direction completely
controlled by the cleavage planes. The frequently occurring intergrowths with mica aggregates also
imply a contemporaneous growth. These relations are likely linked to rather low temperatures during
retrograde conditions.
5.1.6 Recrystallisation features
Static recrystallisation is common for magnetite, pyrrhotite and also coarser aggregates of ilmenite.
The occurrence of such textures in magnetite seems to be the result of recrystallisation in
monomineralic polycrystalline masses, relative absent of other ore minerals. Smaller interstitial
sulphide grains may have been “trapped” when magnetite recrystallised. In contrast, larger sulphide
aggregates were mechanically remobilised into fractured triple junction grain boundaries during a later
phase of deformation. When wholly or partially included in sulphides, particularly galena, pyrrhotite
and chalcopyrite, magnetite tends to form euhedral crystals. Craig & Vokes (1993) describe such
features being common for pyrite during metamorphism and ascribed it to recrystallisation and
porphyroblastic growth. The tendency to form euhedral crystals in a matrix of galena and chalcopyrite
69
may reflect the ductile behaviour of the matrix in contrast to the more competent minerals like
magnetite. This relationship is particularly evident in pyrrhotite, which develop euhedral crystals in a
matrix of galena and chalcopyrite, establishing a relative order of competence for those minerals in
particular microvolumes of the ore. Recrystallisation into triple junctions for pyrrhotite has developed
in coarser aggregates, in similar ways as magnetite. Pyrite also tends to form euhedral larger crystals
in a matrix of sphalerite and galena, in which pyrite often are heavily fractured and later filled by the
matrix minerals. Some of the crystals have not been affected by later brittle deformation and may
possible represent later formed pyrite or formed in low strain areas. Triple junctions have not been
observed in pyrite, and the absence of this texture is probably related to the relatively low abundance
of more massive pyrite in the studied assemblages. Apart from arsenopyrite along foliation, euhedral
grains in galena and pyrrhotite are also common. This may suggest that arsenopyrite grew into
euhedral grains within less competent minerals. Larger, sometimes perfectly euhedral grains of
arsenopyrite are also common within magnetite, which could imply a relative small mechanical
contrast between these minerals of which arsenopyrite is the more competent.
In addition to static recrystallisation of magnetite, massive magnetite commonly displays areas of
more fine-grained recrystallisation, occasionally confined to a preferred orientation (Fig. 35D).
Individual grains are usually too small to distinguish optically, but definitively much smaller than
those statically recrystallised. Sometimes grains exhibit straight boundaries and 120° degree
intersections and a slightly elongated shape. In some cases, grains of pyrrhotite and chalcopyrite are
oriented in the same direction. This is interpreted as being a result of dynamic recrystallisation
followed by, at some places, an incomplete static recrystallisation that locally preserved this texture.
5.2 Geothermometry and geobarometry
The overall textural evidence supports a Svecokarelian metamorphic overprint on the originally syn-
volcanic mineralogy. It should therefore be possible to further verify the postulated pre-metamorphic
(Svecofennian) origin of the deposit, and evaluate the peak-metamorphic conditions using arsenopyrite
geothermometer and sphalerite geobarometer.
5.2.1 Arsenopyrite geothermometry
During metamorphism, arsenopyrite liberates As when re-equilibrating with the host assemblages. The
As will either: (1) form metamorphic arsenopyrite from reactions with pyrrhotite or other Fe and S
species; (2) modify compositions of pre-existing arsenopyrite according to prevailing P-T conditions,
or (3) be remobilised out of the local system (Lentz, 2002). The effect of (3) should be negligible here
since arsenopyrite is one of the more common sulphide. Processes (1) and (2) are both probable and
compositions obtained should thus reflect the temperature condition that was attained during peak
metamorphism. Theoretically, the closure temperature for the system could also influence the final
composition. No information is available on this but the effect is assumed to be negligible.
70
Analysed arsenopyrites lies on the binary join between pyrite and löllingite (Fig. 12), implying that
their composition were fixed at constant temperature and pressure when buffered by the pyrrhotite and
löllingite assemblage. Compositional isopleths in the löllingite and pyrrhotite field in f(S2)-T space
(Fig. 31) is thus expected to be vertical rather than sloped as in the pyrrhotite field when arsenopyrite
only is buffered by pyrrhotite (Sharp et al., 1985). Equilibrium is based on the close relationship
between the phases. The majority of analysed grains yield temperatures close to the mean value of
525°C, except one grain which yielded the lowest temperature of c. 440°C. The analysed arsenopyrite
exhibits a rather small compositional variation, and the lower As content probably only reflects small
deviations from equilibrium during growth or re-equilibration (Kretschmar & Scott, 1976). Removing
the lower value only has a negligible effect on the mean temperature. In order to obtain high-
qualitative results, arsenopyrite geothermometry should preferably be used with carefully determined
arsenopyrite standards as other could give higher As content due to a different bonded As in the
structure (Kretschmar & Scott, 1976).
According to the stability diagram of the Fe-As-S system, löllingite can form as a result of
arsenopyrite desulphidation during prograde metamorphism through the reaction: 2FeAsS FeAs2 +
FeS + ½S2 (Kretschmar & Scott, 1976; Sharp et al., 1985). This reaction has been proposed to yield a
texture where arsenopyrite is rimmed by löllingite (Barnicoat et al., 1991). Conversely, arsenopyrite
(with minor pyrrhotite) can form by the breakdown of löllingite and pyrrhotite during cooling,
yielding a texture where löllingite is rimmed by arsenopyrite (Barnicoat et al., 1991), similar to that
observed in the assemblages at Hornkullen. Tomkins and Mavrogenes (2001) argued that textural
relations alone do not always support the interpretation of the arsenopyrite-löllingite relations, since
re-equilibration rates of sulphides are high at greater temperatures. They suggested from experimental
results that the main texture observed could represent both a prograde reaction followed directly by the
reverse reaction during syn to post-peak conditions. Euhedral arsenopyrite grains in the assemblage
occur in contact to or within the more ductile sulphides phases (galena and pyrrhotite). Therefore,
arsenopyrite re-equilibration and growth, by the breakdown of löllingite and pyrrhotite, is likely linked
to syn or post-peak conditions in the matrix of the more mobile sulphides. Small inclusions of
arsenopyrite within löllingite could be “remnants” from a prograde metamorphism of arsenopyrite and
the formation of löllingite and pyrrhotite. The rather uniform As content and high temperatures
indicated are consistent with lower amphibolite facies conditions, and would nevertheless imply that
arsenopyrite re-equilibration and buffering occurred close to peak metamorphic conditions during the
Svecokarelian orogeny.
5.2.2 Sphalerite geobarometry
During prograde metamorphism, any pre-existing sphalerite will re-equilibrate to the prevailing P-T
conditions owing to the high diffusion rates of Fe in sphalerite at high temperatures (Lentz, 2002).
Sphalerite in an assemblage of pyrite, chalcopyrite and galena lack an important component to buffer
71
FeS in sphalerite, and should not represent equilibrium. FeS in the assemblage varies considerably
from 10.93 to 20.03 corresponding to pressures of c. 1000 and 100 MPa assuming temperatures about
c. 500°C, representing a large metamorphic range for the sphalerite geobarometer. This variation
implies that the assemblage either was poorly buffered or that it was substantially re-equilibrated
during retrograde conditions. Since sphalerite typically exhibits „chalcopyrite disease‟, it is very
susceptible to retrograde re-equilibration (Hutchinson & Scott, 1981). The pressure estimates from this
assemblage is very poorly constrained and regarded as unusable for geobarometry.
In the other assemblage, most of the grains that have values that plot towards lower FeS contents are
in direct contact with chalcopyrite or quartz, including the one plotting close to the 500 MPa line (blue
diamonds; Fig. 32). This indicates some re-equilibration of sphalerite, probably with chalcopyrite,
pyrrhotite and/or pyrite during unbuffered retrograde conditions. However, grains that are in contact
with or partly enclosed in magnetite yield FeS contents around 16 mole%, with one exception of
around 12 mole% (green diamonds; Fig. 32). If the outlier is excluded, the obtained pressure is c. 300-
400 MPa, which falls within a reasonable pressure in relation to the regional Svecokarelian
metamorphic grade. It is conceivable that the sphalerite grains in contact with magnetite attained its
FeS content during peak metamorphism and that magnetite in a sense “shielded” the sphalerite from
further changes during retrograde conditions. The presence or absence of an oxygen fugacity sufficient
to make wüstite or magnetite stable has no measurable effect on the activity of FeS in the sphalerite
solid solution (Barton & Toulmin, 1966). FeS contents around 16 mole% yield a pressure around 300-
400 MPa at c. 500°C, regardless of which isobars used.
Sphalerite associated with chalcopyrite gives variable FeS contents, and sphalerite grains with
„chalcopyrite disease‟ vary from 12.36 to 20.03 mole% FeS as may be expected (Hutchinson & Scott,
1981). Furthermore, only a few grains were analysed in both assemblages due to the low abundance of
sphalerite. It is also justifiable to question the significance of the measurements, as analyses of
different parts of the same grains gave slightly variable FeS contents. The sphalerite geobarometer is
also not ideal, considering the difference between experimental data and theoretical calculations
(Toulmin et al., 1991) as well as the often not so optimal buffering in the system, particularly with the
general scarcity of pyrite. However, the pressure of c. 300-400 MPa is relatively consistent with
regional Svecokarelian metamorphic conditions, and comparable to the pressure of about 300 MPa
obtained from the entrapment of fluid inclusions in similar assemblages. But as a general conclusion,
the results obtained are somewhat ambiguous and should be viewed with caution.
5.3 Fluid inclusions
Since the mineralisation was significantly overprinted by deformation and metamorphic processes,
fluid inclusions that were trapped already during syn-volcanic deposition are probably missing, as
those processes usually leads to strong modification or destruction of pre-existing populations, and the
72
entrapment of new fluid inclusions. (Marshall el., 2000b). If the metamorphic grade was reasonably
low, some inclusions in refractive-enough host minerals could still represent pre-metamorphic
conditions. At the temperatures attained during amphibolite facies metamorphism, it is most likely that
the original fluid inclusions are absent. Also, quartz, the host mineral for the fluid inclusions, shows
ubiquitous evidence of metamorphic recrystallisation. It is therefore assumed that most of the fluid
inclusions, if not all, are of metamorphic origin or younger. The majority of the type I and II
inclusions are closely associated with each other, implying that they initially may have been part of the
same fluid system. This suggests that the fluid initially were both CO2-bearing and saline.
Metamorphic fluids in low to medium grades metamorphic rocks are usually aqueous, CO2-bearing
and usually have low salinity (less than 3 wt%) but relatively salt-saturated fluids are also common
(Roedder, 1984; Yardley & Cleverley, 2013). Yardley & Graham (2002) showed that metamorphic
fluids derived from sediments deposited in shallow waters along continental margins and rifts, are
often highly saline and normally preserve their high salinity despite extensive prograde metamorphic
dehydration reactions. The high salinity is suggested to reflect the original distribution of evaporites
and/or connate brines (Yardley & Graham, 2002), and could possible explain the high salinity (50-55
wt% NaCl eq.) in the analysed fluid inclusions. The variability of solid phases present in different
types of type II inclusions suggests that the phases, excluding halite, were trapped. However, some,
possibly the carbonate and/or sulphate phases, might be daughter phases.
The temperature of 440°C (between 400-600°C) and pressure of c. 275 MPa correspond to a fluid with
a salinity of 40 wt% NaCl eq.. However, the measured salinity in the fluid inclusions is significantly
higher, suggesting that these conditions should be used as approximations. Halite dissolution
temperatures are usually used as an estimate of minimum formation temperature, and the mean
temperature for type II inclusions is 450°C, and could therefore partly act to validate that the fluid
inclusions were trapped close to 440°C. Becker et al. (2008) experimentally determined the
relationship between liquid-vapour homogenisation temperature, halite dissolution temperature and
minimum trapping pressure for inclusions that were homogenised by halite dissolution after liquid-
vapour homogenisation. Using this relationship, a pressure of c. 280 MPa for type II inclusions is
obtained (Fig. 30), which is consistent with the trapping pressure. As evident from the multiple solid
phases in type II inclusions, the fluid is more complex than depicted in the simplified H2O-NaCl
system. Nevertheless, these values should still be useful as approximations.
Usually, shallow exhalites in a VMS setting that formed during the immature or/and waning stage of
regional hydrothermal activity have formation temperatures around or less than 250°C (Galley et al.,
2007). Primary fluid inclusions in the massive sulphide deposits of the Skellefte district (N. Sweden)
formed at two major stages at temperatures of about 210°C and 295°C (Broman, 1987). Based on the
obtained relatively high temperatures and pressures and the overall metamorphic overprint of the host
quartz and the ore assemblages, the fluid inclusions likely reflect metamorphic conditions. The
73
temperatures and pressures are slightly lower than those obtained from sulphide geothermobarometry,
so the entrapment of the fluid may likely correspond to conditions other than peak-metamorphic. Since
chlorine content primarily reflect a fluids capacity to transport higher concentrations of dissolved
elements (Yardley & Graham, 2002), the high salinity in the fluid shows a high capacity for metal
transport. The fluid is thus proposed to have been involved in the remobilisation of elements during
metamorphism.
Liquid-vapour homogenisation temperatures for type III inclusions vary in the range of 100-150°C,
implying considerably lower trapping temperatures. As the pressure cannot be estimated by any
related isochore, the entrapment occurred somewhere in the 100-200°C temperature range (from P-T
diagrams of 25 and 30 wt% NaCl in Bodnar, 2003). The entrapment probably occurred during separate
events based on the varying appearance of the type III inclusions, their slightly variable salinity and
their behaviour during heating and cooling. One-phased liquid-filled type III inclusions yield no
homogenisation temperatures, but they have commonly been interpreted as being trapped at
temperatures below 70°C (cf. Jonsson & Broman, 2002). Type III inclusions could possible represent
meteoric fluids. Some of the type III inclusions are directly associated with “dark opaque inclusions”.
The “inclusions” failed to give a readable Raman spectrum, but they may in part be interpreted as
sulphide inclusions, similar to the phases that reach the surface of the polished thin section. However,
it is presently unclear exactly what they represent.
5.4 Geological evolution of the Hornkullen deposit
5.4.1 Syn-volcanic stage
Primary ore formation of the Hornkullen deposit mainly took place penecontemporaneous with the
deposition of the supracrustal rocks (Riddersand & Sundblad, 1988). But since the ore is strongly
influenced by post-depositional processes connected to the Svecokarelian orogeny, primary features of
the ore are difficult to recognise with confidence. During metamorphism, the sulphur fugacity is
primarily controlled by the pyrite-pyrrhotite buffer, in which sulphur is liberated from the
decomposition of pyrite during increasing temperatures, hence increasing sulphur fugacity in the
system (Craig & Vokes, 1993). This implies that pyrrhotite, since it is frequently recrystallised and
occasionally shows a foliated texture, was present before metamorphism and not produced by
decomposition of pyrite to pyrrhotite. The low abundance of pyrite thus reflects initial low
concentration during the syn-volcanic stage. The bulk of magnetite likely formed prior to
metamorphism or during prograde conditions. Most of the massive arsenopyrite may have formed
early as well, possibly during prograde metamorphism but most likely during initial deposition, due to
the fact that the grains often are heavily fractured and sometimes partly replaced by quartz. Larger
massive aggregates of other sulphides, notably ductile chalcopyrite may also be features of primary
ore formation.
74
In order to describe the temporal evolution of the assemblages during deformation and metamorphism,
the relative time sequence of important events have to be defined. These are tentatively separated into
prograde, peak and retrograde stages assuming a peak around 1.87-1.86 Ga (e.g. Rickard; 1988;
Andersson et al., 2006) more or less coeval with penetrative ductile deformation and accompanying
regional foliation development (Stephens et al., 2009 and references therein).
5.4.2 Prograde-peak metamorphic stage
Elongated grains of pyrrhotite parallel to the foliation may have originated as a result of crystalplastic
deformation during foliation development. Dynamic recrystallisation is an important mechanism
during foliation development (Passchier & Trouw, 2005), and it is therefore proposed that dynamic
recrystallisation of magnetite occurred during this process. The remobilisation of chalcopyrite and
pyrrhotite in strain shadows of quartz boudins/aggregates in addition to arsenopyrite, which
Hammergren (1987) describe being common locally for arsenopyrite, may also be an effect from
shortening. Although other textures indicative of deformation and remobilisation are difficult to
ascribe to prograde features with certainty, such processes must have started already at these
conditions. The presence of granoblastic recrystallisation textures surely shows that deformation must
have been active. The intergrowths of partly euhedral garnet porphyroblasts with for instance
aggregates of galena also implies that the more incompetent minerals were mobile during the time of
major garnet formation, which likely occurred during prograde conditions. Since the fluid composition
and estimated P-T conditions show a high capacity of metal transport at conditions close to peak, it is
thus likely that chemical remobilisation also started already during prograde metamorphism. This may
have been initiated during silicate devolatilasation as a result of an enhanced permeability due to
cracking (Yardley & Cleverley, 2013). The available S and Fe during prograde metamorphism may
have contributed to the growth of some of the more fractured euhedral pyrite. The timing for the
growth of magnetite and pyrrhotite are however more difficult to address, but the former seem to be
younger than most of the euhedral garnets.
Temperature conditions close to peak metamorphism have been estimated to c. 525°C, (between
440°C and 590°). Small grains of sphalerite exsolved in chalcopyrite may suggest initial high
temperature (>500°C?) chalcopyrite solid solution (e.g. Lusk & Calder, 2004). Experimental studies
suggest that recovery and recrystallisation of pyrrhotite occurs above 450°C, although such processes
can operate also at low-grade conditions (Marshall & Gilligan, 1987; Zheng et al., 2012). Amphibole
and garnet have not deformed in a ductile way which indicates that the temperature never exceeded c.
650°C (Passchier & Trouw, 2005 and references therein). These additional constraints in addition to
the temperature obtained by fluid inclusion entrapment suggest that estimates from arsenopyrite
geothermometry are fairly reliable. Pressure obtained from fluid inclusion entrapment can in part also
validate that the result from sphalerite geobarometry are reasonable, although the pressure from the
latter should be used with caution.
75
5.4.3 Retrograde stage
During subsequent retrograde conditions, deformation is likely to have been localised rather than
penetrative. The most pronounced deformation and remobilisation at this stage is the numerous
fracture-infilling relationships, although they may have occurred at different stages depending on
specific mechanical properties and contrasts. Such processes surely commenced already during
prograde metamorphism, probably after the onset of silicate devolatilasation, but the observed textural
relations reflect processes active during peak- to retrograde conditions. Although galena, pyrrhotite,
chalcopyrite, boulangerite, meneghinite and sphalerite all show signs of predominantly mechanical
remobilisation, though sphalerite to a lesser extent, the remobilisation likely occurred as a mixed state,
i.e. both mechanical and chemical. For arsenopyrite and magnetite, the remobilisation processes must
have been mostly chemical. The direct relationship with alteration or replacement along grain
boundaries or in fractures in massive arsenopyrite implies that the chemical remobilisation of
elements, at least for As, occurred during or after brittle deformation of arsenopyrite. These fluids may
later have supplied the As required for possible late arsenopyrite and arsenopyrite in tension gashes in
quartz along with pyrrhotite and chalcopyrite. The continued mobility at lower temperature of galena,
pyrrhotite and chalcopyrite is also evident in the intergrowths of these ore minerals with unoriented
mica aggregates as well as the remobilisation of these ore minerals into basal cleavage planes of mica
crystals or aggregates. Sphalerite that have been deformed in a brittle way and the infilling of galena
into opened fractures show that local deformation and mobility of at least galena continued to
conditions below the brittle-ductile transition zone for sphalerite, probably at temperatures
significantly below 300°C (Marshall & Gilligan, 1987). The modification persisted to low
temperatures (<200°C), resulting in the formation of minerals stable at these conditions (e.g.
gudmundite and stephanite).
5.4.4 Formation of Pb-Fe-Ag-Sb sulphosalts and other minor phases at Hornkullen
The existence of Pb-Fe-Ag-Sb sulphosalts and other less common minerals including boulangerite,
freibergite-tetrahedrite, pyrargyrite, stephanite, jamesonite, and gudmundite are considered to reflect
an evolution from prograde through retrograde conditions. Boulangerite is stable below 638±2°C in
the system Pb-Sb-S (Craig et al., 1973). Meneghinite is only stable above 300°C (Pruseth et al., 1997).
Fe-rich (2 a.p.f.u) tetrahedrite in the Cu-Fe-Sb-S system has an upper stability of 661°C, whereas Fe-
free tetrahedrite has upper and lower stabilities at 573°C and 250°C, respectively (Tatsuka &
Morimoto, 1977). Increased Ag content probably results in a lower stability close to that of pyrargyrite
(cf. Tomkins et al., 2004). Pyrargyrite in the Ag-Sb-S system has an upper stability of 485°C (Keighin
& Honea, 1969) whereas in a PbS-Ag2S-Sb2S3 system, it is only stable up to c. 400°C (Hoda & Chang,
1975). Stephanite in the Ag-Sb-S system is only stable at temperatures lower than 197±5°C (Keighin
& Honea, 1969). Jamesonite has an upper stability at 545±5°C in the PbS-Fe1-xS-Sb2S3 system (Chang
76
& Knowles, 1977). Gudmundite in the Fe-Sb-S system is not stable above 280±10°C (Barton, 1971).
It is obvious that at least pyrargyrite, stephanite and gudmundite formed during retrograde conditions.
The bulk of boulangerite co-exist with meneghinite associated with chalcopyrite, pyrrhotite,
arsenopyrite and minor galena, tetrahedrite and sphalerite within skarn-silicates. Both frequently
displays textures indicative of remobilisation during retrograde conditions. The fact that this
assemblage is closely associated with skarn silicates combined with the remobilised nature of the
assemblage and their high temperature stability points to a formation prior or close to peak
metamorphism.
In contrast, inclusions of boulangerite in galena show no deformation and likely reflect retrograde
conditions. The majority of the inclusions occur at grain boundaries in galena or in contact with
pyrrhotite inclusions. In galena, the coupled substitution Ag+ + Sb
3+ ↔ 2Pb
2+ may be significant at
higher temperatures. Above 420°C, it is postulated that galena even form a complete solid solution
with AgSbS2 and AgBiS2 (Chutus et al., 2008 and references therein). This implies that a significant
amount of Sb (and Ag) can be accommodated in the galena structure during high temperatures.
Accordingly, inclusions of boulangerite may have been exsolved from galena upon cooling during
retrograde conditions, often nucleating at grain boundaries where strain energy is lower (Cook et al.,
1994). However, it may also be that boulangerite formed together with galena and other ore minerals
in the assemblage during an event much earlier in a low-strain area. Some boulangerite inclusions are
replaced by galena and an unidentified mineral (tentatively gudmundite) along grain boundaries and in
cracks, which surely reflect low-temperature processes.
All types from the freibergite-tetrahedrite series show a simple substitution of Cu+ for Ag
+ (Fig. 20B).
Freibergite show a greater affinity for chalcopyrite than galena, compared to the argentian tetrahedrite,
which commonly occur as inclusions in galena. Chalcopyrite can accommodate between 5-8% Ag in
its matrix, possibly due to the simple substitution of Cu+ for Ag
+ (Amcoff, 1984 and references
therein). The solubility of Ag and Sb in galena and the presumably lower temperature stability for Ag-
rich fahlore minerals suggests that freibergite solved from chalcopyrite and argentian tetrahedrite
solved from galena during retrograde cooling. This should be conceivable considering the small size
of the inclusions and the common occurrence at grain boundaries. A further enrichment of Ag may
have been the result of solid-state reactions involving the Ag-Cu exchange (Sack et al., 2005) that
occur during cooling of primary deposits, but should be pertinent also for retrograde cooling of
metamorphosed deposits. Cu-rich tetrahedrite occurs in garnets and in small mineral aggregates
disseminated in recrystallised quartz. Cu-rich tetrahedrite must have formed in conjunction with quartz
prior to the formation of the garnets. The composition of this tetrahedrite is similar to the composition
of tetrahedrite in Tatsuka & Morimoto (1977), which has an upper stability of 661°C, implying that
this type of tetrahedrite may have been present prior to peak metamorphism.
77
Pyrargyrite occurs intimately with freibergite and chalcopyrite ± galena and is usually interpreted as
being a result of breakdown of freibergite during retrograde conditions below 500°C (e.g. Höller &
Gandhi, 1995). However, textural evidence for breakdown is lacking, but this could also imply that the
reaction involved in the decomposition was completed. During lower conditions (<200°C), a further
breakdown may have resulted in formation of stephanite (e.g. Höller & Gandhi, 1995), which also
invariably occurs at grain boundaries in chalcopyrite. Jamesonite occurs together with galena as
disseminated prisms within quartz with unknown relation to the geological evolution. It is assumed
that this assemblage formed during retrograde conditions below 500°C as jamesonite is not stable with
galena above this temperature. It is possible that a join between these two was established below
400°C (Chang & Knowles, 1977). The low temperature stability (<300°C) of gudmundite points to a
late-stage formation. The intergrowth with chalcopyrite and Cu-rich tetrahedrite and its occurrence
with galena and Cu-rich sphalerite may suggest breakdown of an unknown precursor rich in Fe, Sb,
Cu and possibly Zn and Pb.
5.4.5 Influence of TIB magmatism
Following the retrograde Svecokarelian metamorphism, it is likely that the mineral assemblages
established during the lengthy cooling process may have been further modified by thermal activity
during the magmatism of the TIB (Filipstad) intrusives. It is however uncertain to what extent this
activity modified the assemblages, if at all. Earlier, there were also some discussions regarding the role
of the granites on mineralisation at Hornkullen, whether it introduced ore-forming components or
whether it only contributed to the modification of pre-existing metal contents. Generally, ore
mineralisations spatially and temporally related to granites in western Bergslagen comprise tungsten or
molybdenum deposits, often related to various skarn formations (e.g. Sundblad et al., 1993; Romer &
Öhlander, 1994). These granites belong to the late to post-orogenic c. 1.81-1.75 Ga intrusive rocks and
are temporally related to the intrusion of the Filipstad granite. These intrusions are often characterised
by granites sensu stricto and often with abundant aplitic and pegmatitic dykes. This is in marked
contrast to the Filipstad granite, in which pegmatites are rather rare (Högdahl et al., 2007). The
absence of pegmatitic dykes implies rather dry magmas. Also, mineralisations associated with the TIB
intrusives are very scarce (e.g. Högdahl et al., 2004). Accordingly, it is highly improbable that these
granites supplied any new components into pre-existing metal inventories. Additionally, the general
absence of incompatible elements frequently derived from granitic magmas (e.g. Sn, Mo, W, F…) also
attests on this. It is also evident from textural relations that all elements that have been involved in
remobilisation processes have done so within the ore mass from prograde through retrograde
metamorphism.
78
5.4.6 Low temperature alteration
Pyrrhotite in many of the samples exhibits different types of alteration textures and includes formation
of planar marcasite aggregates, seemingly replacing lamellae in pyrrhotite with small associated pyrite
and magnetite grains, marcasite alteration along grain boundaries that sometimes leaves small
“islands” of pyrrhotite, and pyrrhotite grains completely replaced by marcasite. The latter two types
exclusively occur in weathered dump samples and most likely formed through supergene alteration at
or near the surface. These samples are also characterised by abundant goethite replacement, e.g. in
magnetite along boundaries or along crystallographically defined planes, along grain boundaries in
sulphides, or randomly through sulphides, particularly pyrrhotite. This must also have been the result
of alteration at or near the surface, possibly from slightly oxidising meteoric fluids circulating through
fractures. However, the lamellae texture does not invariably occur in weathered samples and may
suggest alteration of pyrrhotite at slightly different low-temperature conditions.
79
6. Conclusions
The ore assemblages at Hornkullen are dominated by magnetite, pyrrhotite, chalcopyrite, galena, and
arsenopyrite in addition to subordinate sphalerite, ilmenite and pyrite. Boulangerite associated with
meneghinite is locally dominant. The close relationship between magnetite and sulphides suggests a
genetic link between oxides and sulphides. Ag-bearing minerals comprise freibergite, argentian
tetrahedrite, pyrargyrite and stephanite, of which argentian tetrahedrite predominates and is probably
the chief Ag-carrier at Hornkullen. Other minor phases include Cu-rich tetrahedrite with negligible
traces of Ag, löllingite, gudmundite, jamesonite and molybdenite.
Galena, chalcopyrite, pyrrhotite and to a lesser extent sphalerite, boulangerite and meneghinite all
exhibit evidence of ductile deformation whereas the more competent arsenopyrite, magnetite and
pyrite mainly deformed in a brittle manner. Monomineralic aggregates of magnetite, pyrrhotite and
ilmenite are characterised by static recrystallisation featuring triple junctions, whereas individual
grains of magnetite, pyrite, arsenopyrite and pyrrhotite present within more ductile minerals tend to
exhibit euhedral morphology. Additionally, ore minerals are ubiquitous as inclusions in both euhedral
and anhedral porphyroblastic garnet.
The present appearance of the ore assemblages and their textural relations are suggested to be the
result of remobilisation, primarily effected as a consequence of regional Svecokarelian amphibolite
facies metamorphism. Remobilisation possibly initiated already during prograde metamorphism after
the onset of silicate devolatilisation, followed by additional and more prevalent modification during
retrograde conditions. The formation of Pb-Fe-Ag-Sb-sulphosalts and other rare accessory ore
minerals are considered to reflect an evolution from prograde to retrograde conditions, where most
mineral changes occurred during the retrograde stage, as seen in their present textural positions.
Arsenopyrite geothermometry yield a mean temperature of c. 525°C (between 440°C and 590°C).
Sphalerite geobarometry indicate peak pressures of c. 300-400 MPa, albeit a bit ambiguous. Both are
consistent with regional Svecokarelian amphibolite facies metamorphism. P-T conditions of fluid
entrapment were estimated to a temperature of c. 440°C and a pressure of c. 280 MPa, indicating that
this fluid may have been involved in redistributing elements during regional metamorphism.
Importantly, the fluid inclusions data also corroborates the sulphide geothermobarometry.
The ore mineral assemblages and their distinct metamorphosed and deformed features are unlikely, if
not impossible, to have formed by a major thermal event following the Svecokarelian orogeny. Thus,
the Hornkullen polymetallic deposit can most easily be reconciled with a metamorphically overprinted
syn-volcanic Svecofennian mineralisation. Retrogradation during the TIB magmatism may have
modified pre-existing assemblages, but no evidence for additional any introduction of ore-forming
components have been observed.
80
7. Acknowledgements
First and foremost, my supervisors Prof. Erik Jonsson (SGU/UU) and Dr. Karin Högdahl (UU) are
thanked for all the help and support during the time of this project and also giving me the opportunity
to work on it. Curt Broman at the Department of Geology and Geochemistry at Stockholm University
is thanked for introducing me to fluid inclusions and to all the valuable help during the measurements.
Dr. Jarek Majka (UU) is thanked for setting up and helping with the WDS analyses and to all the not
so often gratifying carbon coating work. I am thankful to Gary Wife at the Evolutionary Biology
Centre at Uppsala University for the help with EDS analyses. Jörgen Langhof at the Swedish Museum
of Natural History and Kjell Gatedal, formely at the Filipstad School of Mining and Metallurgy, are
thanked for providing additional samples. I am very grateful to the staff at the mines at Hornkullen for
allowing me and my supervisors to gather samples and giving us a pleasant tour of the mines. A big
thanks also goes to the Swedish Research Council (Vetenskapsrådet) and SGU for the financial
support to projects on rare metals in central Swedish mines and mine dumps. I also give my
appreciation to Kjell Helge (Minoprep) for the preparation of double-polished wafers and to Åke
Rosén (UU) for introducing me to the preparation of polished samples. I also want to give my endless
gratitude to all my friends during my years of studying for making it such an amazing time that it was.
My former teachers during the years, especially my supervisor for my bachelor thesis and current
reviewer Dr. Örjan Amcoff (UU), are also thanked for all the interesting courses. I will also be forever
indebted to you Julia for the never-ending encouragement, support and belief in me.
81
8. References
Allen, R. L., Lundström, I., Ripa, M., Simeonov , A. & Christofferson, H., 1996: Facies analysis of a
1.9 Ga, continental margin, back-arc, felsic caldera province with diverse Zn-Pb-Ag-(Cu-Au) sulfide
and Fe oxide deposits, Bergslagen region, Sweden. Economic Geology 191, 979-1008.
Amcoff, Ö., 1984: Distribution of silver in massive sulfide ores. Mineralium Deposita 19, 63-69.
Andersson, U. B., Högdahl, K., Sjöström, H. & Bergman, S., 2006: Multistage growth and reworking
of the Palaeoproterozoic crust in the Bergslagen area, southern Sweden: evidence from U-Pb
geochronology. Geological Magazine 143, 679-697.
Atkinson, B. K., 1977: The kinetics of ore deformation: its illustration and analysis by means of
deformation-mechanism maps. GFF 99, 186-197.
Barnicoat, A. C., Fare, R. J., Groves, D. I. & McNaughton, N. J., 1991: Synmetamorphic lode-gold
deposits in high-grade Archean settings. Geology 19, 921-924.
Barrie, C. D., Pearce, M. A. & Boyle, A. L., 2011: Reconstructing the pyrite deformation mechanism
map. Ore Geology Reviews 39, 265-276.
Barton, P. B., 1971: The Fe-Sb-S system. Economic Geology 66, 121-132.
Barton, P. B. & Toulmin, P., 1966: Phase relations involving sphalerite in the Fe-Zn-S system.
Economic Geology 61, 815-849.
Becker, S. P., Fall, A. & Bodnar, R. J., 2008: Synthetic fluid inclusions. XVII. PVTX properties of
high salinity H2O-NaCl solutions (>30 wt% NaCl): Application to fluid inclusions that homogenize by
halite disappearance from porphyry copper and other hydrothermal ore deposits. Economic Geology
103, 539-554.
Beunk, F. F. & Kuipers, G., 2012: The Bergslagen ore province, Sweden: Review and update of an
accreted orocline, 1.9-1.8 Ga BP. Precambrian Research 216-219, 95-119.
Björk, L., 1986: Beskrivning till berggrundskartan Filipstad NV. Sveriges Geologiska Undersökning
Serie Af 147, 110pp.
Bodnar, R. J., 1994: Synthetic fluid inclusions: XII. The system H2O-NaCl. Experimental
determination of the halite liquidus and isochores for a 40 wt% NaCl solution. Geochimica et
Cosmochimica Acta 58, 1053-1063.

82
Bodnar, R. J., 2003: Introduction to aqueous-electrolyte fluid inclusions. In: Samson, I., Anderson, A.
& Marshall, D. (eds.): Fluid Inclusions: Analysis and Interpretation. Mineralogical Association of
Canada 32, 81-99.
Broman, C., 1987: Fluid inclusions of the massive sulfide deposit in the Skellefte district, Sweden.
Chemical Geology 61, 161-168.
Burke, E. A. J., 2001: Raman microspectrometry of fluid inclusions. Lithos 55, 139-158.
Chang, L. L. Y. & Knowles, C. R., 1977: Phase relations in the system PbS-Fe1-xS-Sb2S3 and PbS-Fe1-
xS-Bi2S3. Canadian Mineralogist 15, 374-379.
Chutas, N. I., Kress, V. C., Ghiorso, M. S. & Sack, R. O., 2008: A solution model for high-
temperature PbS-AgSbS2-AgBiS2 galena. American Mineralogist 93, 1630-1640.
Clark, L. A., 1960: The Fe-As-S system – Phase relations and applications. Economic Geology 55,
1345-1381.
Cook, N. J., Halls, C. & Boyle, A. P., 1993: Deformation and metamorphism of massive sulphides at
Sulitjelma, Norway. Mineralogical Magazine 57, 67-81.
Cook, N. J., Klemd, R. & Okrusch, M., 1994: Sulphide mineralogy, metamorphism and deformation in
the Matchless massive sulphide deposit, Namibia. Mineralium Deposita 29, 1-15.
Craig, J. R., Chang, L. L. Y. & Rees, W. R., 1973: Investigations in the Pb-Sb-S system. Canadian
Mineralogist 12, 199-206.
Craig, J. R. & Vokes, F. M., 1993: The metamorphism of pyrite and pyritic ores: an overview.
Mineralogical Magazine 57, 3-18.
Cruden, A. R., Sjöström, H. & Aaro, S., 1999: Structure and geophysics of the Gåsborn granite,
central Sweden: an example of fracture-fed assymetric pluton emplacement. In: A. Castro, C.
Fernandez & J. L. Vigneresse (eds.): Understanding granites: integrating new and classical techniques.
Geological Society of London Special Publication 168, 141-160.
Dahlin, P., Allen, R. & Sjöström, H., 2012: Palaeoproterozoic metavolcanic and metasedimentary
succession hosting the Dannemora iron ore deposits, Bergslagen region, Sweden. GFF 134, 71-85.
Davis, D. W., Lowenstein, T. K. & Spencer, R. J., 1990: Melting behaviour of fluid inclusions in
laboratory-grown halite crystals in the systems NaCl-H2O, NaCl-KCl-H2O, NaCl-MgCl2-H2O, and
NaCl-CaCl2-H2O. Geochimica et Cosmochimica Acta 54, 591-601.
83
Downs, R. T., 2006: The RRUFF Project: an integrated study of the chemistry, crystallography,
Raman and infrared spectroscopy of minerals. Program and Abstracts of the 19th General Meeting of
the International Mineralogical Association in Kobe, Japan, O03-13.
Frezzotti, M.L., Tecce, F. & Casagli, A., 2012: Raman spectroscopy for fluid inclusion analysis.
Journal of Geochemical Exploration 112, 1-20.
Frost, B. R., Mavrogenes, J. A. & Tomkins, A. G., 2002: Partial melting of sulfide ore deposits during
medium- and high-grade metamorphism. Canadian Mineralogist 40. 1-18.
Galley, A., Hannington, M. & Jonasson, I., 2007: Volcanogenic massive sulphide deposits. Geological
Association of Canada Special Publications 5, 141-161.
Geijer, P., 1917: Falutraktens berggrund och malmfyndigheter. Sveriges Geologiska Undersökning
C275, 316 pp.
Geijer, P. & Magnusson, N. H., 1944: De mellansvenska järnmalmernas geologi. Sveriges Geologiska
Undersökning Ca 35, 654 pp.
Gill, J. E., 1969: Experimental deformation and annealing of sulfides and interpretation of ore
textures. Economic Geology 64, 500-508.
Gilligan, L. B. & Marshall, B., 1987: Textural evidence for remobilization in metamorphic
environments. In: B. Marshall & L. B. Gilligan (eds.): Mechanical and chemical (re)-mobilization of
metalliferous mineralisation. Ore Geology Reviews 2, 205-229.
Graf Jr., J. L. & Skinner, B. J., 1970: Strength and deformation of pyrite and pyrrhotite. Economic
Geology 65, 206-215.
Hammergren P., Sädbom, S. & Nysten, P., 1986: Guld i Filipstadsområdet. (SGU) unpublished SGAB
prospecting report 86552, 87 pp.
Hammergren P., 1987: Hornkullen – Redovisning av borrning, geokemi och geologi efter guld 1987.
(SGU) unpublished SGAB prospecting report 87507, 149 pp.
Hedström, P., Simeonov, A. & Malmström, L., 1989: The Zinkgruvan ore deposit, south central
Sweden; a Proterozoic, proximal Zn-Pb-Ag deposit in distal volcanic facies. Economic Geology 84,
1235-1261.
Hermansson, T., Stephens, M. B., Corfu, F., Page, L. M. & Andersson, J., 2008: Migratory tectonic
switching, western Svecofennian orogen, central Sweden: Constraints from U/Pb zircon and titanite
geochronology. Precambrian Research 161, 250-278.
84
Hoda, S. N. & Chang, L. L. Y., 1975: Phase relations in the system PbS-Ag2S-Sb2S3 and PbS-Ag2S-
Bi2S3. American mineralogist 60, 621-633.
Holtstam, D. & Andersson, U. B., 2007: The REE minerals of the Bastnäs-type deposit, south-central
Sweden. Canadian Mineralogist 45, 1073-1114.
Hutchinson, M. N. & Scott, S. D., 1981: Sphalerite Geobarometry in the Cu-Fe-Zn-S System.
Economic Geology 76 143-153.
Högdahl, K., Andersson, U. B. & Eklund, O. (eds.), 2004: The Transscandinavian Igneous Belt (TIB)
in Sweden: a review of its character and evolution. Geological Survey of Finland Special Paper 37,
125 pp.
Högdahl, K., Jonsson, E. & Selbekk, R. S., 2007: Geological relations and U-Pb geochronology of
Hyttsjö granites in the Långban-Nordmark area, western Bergslagen, Sweden. GFF 129, 43-54.
Högdahl, K., Sjöström, H. & Bergman, S., 2009: Ductile shear zones related to crustal shortening and
domain boundary evolution in the central Fennoscandian Shield. Tectonics 28, 1-18.
Högdahl, K., Troll, V. R., Nilsson, K. P. & Jonsson, E., 2013: Structural evolution of the apatite-iron
oxide deposit at Grängesberg, Bergslagen, Sweden. In: Jonsson, E. (ed.): Mineral deposit research for
a high-tech world, SGA biennal meeting 2013, 1650-1653.
Höller, W. & Gandhi, S. M., 1995: Silver-bearing sulfosalts from the metamorphosed Rampura
Agucha Zn-Pb-(Ag) deposit, Rajasthan, India. Canadian Mineralogist 33, 1047-1057.
Igelström, L. J., 1850: Bidrag till kännedomen af Wermlands mineralier. Öfversigt af Kongliga
Vetenskaps-akademiens Förhandlingar, p. 203.
Igelström, L. J., 1872: Sveriges malmer och nyttiga mineralier. Andra upplagan, Örebro 1871, p. 90.
Jansson, N. F., 2011: The origin of Iron ores in Bergslagen, Sweden, and their relationship with
polymetallic sulphide ores. Doctoral Thesis, Luleå University of Technology, 292 pp.
Jansson, N. F. & Allen, R., 2011: Timing of volcanism, hydrothermal alteration and ore formation at
Garpenberg, Bergslagen, Sweden. GFF 133, 3-18.
Jarl, L-G. & Johansson, Å., 1988: U-Pb zircon ages of granitoids from the Småland-Värmland granite-
porphyry belt, southern and central Sweden. GFF 110, 21-28.
Johansson, J., 1889: Noraskogs Arkiv. Bergshistoriska samlingar och anteckningar, Andra Bandet,
520-529.
85
Johansson, R. 1987: Hornkullen, geofysisk tolkning. (SGU) unpublished SGAB prospecting report
87513, 16 pp.
Jonsson, E., 2004: Fissure-hosted mineral formation and metallogenesis in the Långban Fe-Mn-(Ba-
As-Pb-Sb…) deposit, Bergslagen, Sweden. Meddelanden från Stockholms Universitets Institution för
Geologi och Geokemi 318, 22pp.
Jonsson, E. & Billström, K., 2009: Lead isotope systematics in the Långban deposit and adjacent
sulphide mineralisations in western Bergslagen, Sweden. GFF 131, 215-227.
Jonsson, E. & Broman, C., 2002: Fluid inclusions in late-stage Pb-Mn-As-Sb mineral assemblages in
the Långban deposit, Bergslagen, Sweden. Canadian Mineralogist 40, 47-65.
Jonsson, E., Nilsson, K. P., Hallberg, A. & Högdahl, K., 2010: The Palaeoproterozoic apatite-iron
oxide deposits of the Grängesberg area: Kiruna-type deposits in central Sweden. In: Nakrem, H. A.,
Harstad, A. O. & Haukdal, G. (eds.): NGF abstracts and proceedings 1, 88–89.
Jonsson, E., Troll, V. R., Högdahl, K., Harris, C., Weis, F., Nilsson, K. P. & Skelton, A., 2013:
Magmatic origin of giant „Kiruna-type‟ apatite-iron-oxide ores in Central Sweden. Nature Scientific
reports 3, 1-8.
Keighin, C. W. & Honea, R. M., 1969: The system Ag-Sb-S from 600°C to 200°C. Mineralium
Deposita 4, 153-171.
Koark, H. J., 1962: Zur Altersstellung und Entstehung der Sulfiderze vom Typus Falun. Geologische
Rundschau 52, 123–146.
Korja, A., Lahtinen, R. & Nironen, M., 2006: The Svecofennian orogen: a collapse of microcontinents
and island arcs. In: Gee, D. G. & Stephenson, R. A. (eds.): European Lithosphere Dynamics.
Geological Society of London Memoirs 32, 561-578.
Kretschmar, U. & Scott, S. D., 1976: Phase relations involving arsenopyrite in the system Fe-As-S and
their application. Canadian Mineralogist 14, 364-386.
Lagerblad, B. & Gorbatschev, R., 1985: Hydrothermal alteration as a control of regional geochemistry
and ore formation in the central Baltic Shield. Geologische Rundschau 74, 33-49.
Lahtinen, R. & Korja, A., Nironen M. & Heikkinen, P., 2009: Palaeoproterozoic accretionary
processes in Fennoscandia. In: Cawood, P. A. & Kröner, A. (eds): Earth Accretionary Systems in
Space and Time. Geological Society of London Special Publications 318, 237-256.
86
Lentz, D. R., 2002: Sphalerite and arsenopyrite at the Brunswick No. 12 massive-sulfide deposit,
Bathurst camp, New Brunswick: constraints on P-T evolution. Canadian Mineralogist 44, 19-31.
Lindgren, Waldemar., 1933: Mineral deposits. 4th edition, McGraw-Hill Book Company, 930 pp.
Lundegårdh, P. H., 1987: Beskrivning till Berggrundskartan Filipstad SV. Sveriges Geologiska
Undersökning Serie Af 157. 77 pp.
Lundström, I., 1995: Beskrivning till berggrundskartorna Filipstad SO och NO. Sveriges Geologiska
Undersökning Serie Af 177 + 185, 218 pp.
Lusk, J. & Calder, B. O. E., 2004: The composition of sphalerite and associated sulphides in reactions
of the Cu-Fe-Zn-S, Fe-Zn-S and Cu-Fe-S systems at 1bar and temperatures between 250 and 535°C.
Chemical Geology 203, 319-345.
Magnusson, N. H., 1925: Persbergs malmtrakt och berggrunden i de centrala delarna av Filipstads
bergslag. Kungliga kommerskollegium: Beskrivning av mineralfyndigheter 2, 231pp.
Marshall, B. & Gilligan, L. B., 1987: An introduction to remobilization: Information from ore-body
geometry and experimental considerations. In: B. Marshall & L. B. Gilligan (eds.): Mechanical and
chemical (re)-mobilization of metalliferous mineralisation. Ore Geology Reviews 2, 87-131.
Marshall, B. & Gilligan, L. B. 1993: Remobilization, syn-tectonic processes and massive sulfide
deposits. Ore Geology Reviews 8, 38-64.
Marshall, B., Vokes, F. M. & Larocque, A. C. I., 2000a: Regional metamorphic remobilization:
Upgrading and formation of ore deposits. In: F. M. Vokes, B. Marshall & P. G. Spry (eds.):
Metamorpic and metamorphogenic ore deposits. Reviews in Economic Geology 11, 19-38.
Marshall, B., Giles, A. D. & Hagemann, S. G., 2000b: Fluid inclusions in metamorphosed and
synmetamorphic (including metamorphogenic) base and precious metal deposits: Indicators of ore-
forming conditions and/or ore-modifying histories?. In: F. M. Vokes, B. Marshall & P. G. Spry (eds.):
Metamorphic and metamorphogenic ore deposits. Reviews in Economic Geology 11, 119-148.
McClay, K. R. & Ellis, P. G, 1983: Deformation and recrystalliszation of pyrite. Mineralogical
Magazine 47, 527-538.
Moëlo, Y., Makovicky, E., Mozgova, N. N., Jambor, J. L., Cook. N. J., Pring, A., Paar, W., Nickel, E.
H., Graeser, S., Karup-Møller, S., Balic-Zunic, T., Mumme, W. G., Vurro, F., Topa, D., Bindi, L.,
Bente, K. & Shimizu, M., 2008: Sulfosalt systematics: a review. Report of the sulfosalt sub-committee
of the IMA commission on ore mineralogy. European Journal of Mineralogy 20, 7-46.
87
Nasdala, L., Smith, D. C., Kaindl, R. & Ziemann, M., 2004: Raman spectroscopy: analytical
perspective in mineralogical research. In: A. Beran & E. Libowitzky (eds.): Spectroscopic methods in
mineralogy. European Mineralogical Union Notes in Mineralogy 6, 281-343.
Oen, I. S., 1987: Rift-related igneous activity and metallogenesis in SW Bergslagen, Sweden.
Precambrian Research 35, 367-382.
Oen, I. S., Helmers, H., Verschure, R. H. & Wiklander, U., 1982: Ore deposition in a Proterozoic
incipient rift zone environment: a tentative model for the Filipstad-Grythyttan-Hjulsjö region,
Bergslagen, Sweden. Geologische Rundschau 71, 182-194.
Page, L. M., Stephens, M. B. & Wahlgren, C-H., (1996): 40
Ar/39
Ar geochronological constraints on the
tectonothermal evolution of the Eastern Segment of the Sveconorwegian Orogen, south-central
Sweden. In: Brewer, T. S. (ed.): Precambrian Crustal Evolution in the North Atlantic Region.
Geological Society of London Special Publication 111, 315-330.
Passchier, C. W. & Trouw, R. A. J., 2005: Microtectonics. 2nd
Edition, Springer Verlag, 366 pp.
Persson, K. S. & Sjöström, H., 2003: Late-orogenic progressive shearing in eastern Bergslagen, central
Sweden. GFF 125, 23-36.
Plimer, I. R., 1987: Remobilization in high-grade metamorphic environments. In: B. Marshall & L. B.
Gilligan (eds.): Mechanical and chemical (re)-mobilization of metalliferous mineralisation. Ore
Geology Reviews 2, 231-245.
Pruseth, K. L., Mishra, B. & Bernhardt, H. J., 1997: Phase relations in the Cu2S-PbS-Sb2S3 system: An
experimental appraisal and application to natural polymetallic sulfide ores. Economic Geology 92,
720-732.
Reed, S. J. B., 2005: Electron microprobe analysis and scanning electron microscopy in geology. 2th
edition, Cambridge University Press, 187 pp.
Rickard, D., 1988: Regional metamorphism in the Bergslagen province, south central Sweden.
Geologie en Mijnbouw 67, 139-155.
Riddersand H. & Sundblad, K., 1988: Origin of the Hornkullen silver deposit, Bergslagen, Sweden.
18th Nordic Geological Winter Meeting, abstract volume, 350-351.
Rividi, N., van Zuilen, M., Philippot, P., Ménez, B., Godard, G. & Poidatz, E. M., 2010: Calibration of
carbonate composition using micro-Raman analysis: Application to planetary surface exploration.
Astrobiology 10, 293-309.
88
Roedder, E., 1984: Fluid Inclusions. Reviews in Mineralogy 12, 646 pp.
Romer, R. L. & Öhlander, B., 1994: U-Pb age of the Yxsjöberg tungsten-skarn deposit, Sweden. GFF
116, 161-166.
Ros, F., Sjöblom, B., Westerberg, S., Fors, K. & Lundmark, C., 1986: Grönstenar och
sedimentbergarter i Sverige. (SGU) unpublished SGAB prospecting report 86550, 142 pp.
Sack, R. O., Fredericks, R., Hardy, L. S. & Ebel, D. S., 2005: Origin of high-Ag fahlores from the
Galena Mine, Wallace, Idaho, U.S.A. American Mineralogist 90, 1000-1007.
Scott, S. D., 1976: Application of the sphalerite geobarometer to regionally metamorphosed terrains.
American Mineralogist 61, 661-670.
Scott, S. D., 1983: Chemical behavior of sphalerite and arsenopyrite in hydrothermal and metamorphic
environments. Mineralogical Magazine 47, 427-435.
Scott, S. D. & Barnes, H. L., 1971: Sphalerite geothermometry and geobarometry. Economic Geology
66, 653-669.
Sharp, Z. D., Essene, E. J. & Kelly, W. C., 1985: A re-examination of the arsenopyrite
geothermometer: pressure considerations and applications to natural assemblages. Canadian
Mineralogist 23, 517-534.
Skinner, B. J. & Johnson, C. A., 1987: Evidence for movement of ore materials during high-grade
metamorphism. In: B. Marshall & L. B. Gilligan (eds.): Mechanical and chemical (re)-mobilization of
metalliferous mineralisation. Ore Geology Reviews 2, 191-204.
Stephens, M. B., Ripa, M., Lundström, I., Persson, L., Bergman, T., Ahl, M., Wahlgren, C. H.,
Persson, P-O. & Wickström, L., 2009: Synthesis of the bedrock geology in the Bergslagen region,
Fennoscandian Shield, south-central Sweden. Geological Survey of Sweden Ba 58, 260 pp.
Stålhös, G., 1981: A tectonic model for the Svecokarelian folding in east central Sweden. GFF 103,
33-46.
Söderlund, U., Jarl, L.-G., Persson, P.-O., Stephens, M. B. & Wahlgren, C.-H., 1999: Protolith ages
and timing of deformation in the eastern, marginal part of the Sveconorwegian orogen, southwestern
Sweden. Precambrian Research 94, 29-48.
Sundblad, K., Ahl, M. & Schöberg, H., 1993: Age and geochemistry of granites associated with Mo-
mineralizations in western Bergslagen, Sweden. Precambrian Research 64, 319-335.
89
Sundblad, K., 1994: A genetic reinterpretation of the Falun and Åmneberg ore types, Bergslagen,
Sweden. Mineralium Deposita 29, 170-179.
Sundblad, K. & Zachrisson, E., 1984: Sphalerite geobarometry and arsenopyrite geothermometry
applied to metamorphosed sulfide ores in the Swedish Caledonides. Economic Geology 79, 1660-
1668.
Sundius, N., 1923: Grythyttefältets geologi. Sveriges Geologiska Undersökning Serie C 321, 354 pp.
Tatsuka, K. & Morimoto, N., 1977: Tetrahedrite stability relations in the Cu-Fe-Sb-S system.
American Mineralogist 62, 1101-1109.
Tegengren, F., 1924: Sveriges ädlare malmer och bergverk. Sveriges Geologiska Undersökning Ca 17,
406pp.
Till, J. L. & Moskowitz, B., 2013: Magnetite deformation mechanism maps for better prediction of
strain partitioning. Geophysical Research Letters 40, 1-6.
Tomkins, A. G. & Mavrogenes, J. A., 2001: Redistribution of gold within arsenopyrite and löllingite
during pro- and retrograde metamorphism: application to mining of mineralization. Economic Geology
96, 525-534.
Tomkins, A. G., Pattison, D. R. M. & Zaleski, E., 2004: The Hemlo gold deposit, Ontario: An
example of melting and mobilization of a precious metal-sulfosalt assemblage during amphibolite
facies metamorphism and deformation. Economic Geology 99, 1063-1084.
Tomkins, A. G., Frost, B. R. & Pattison, D. R. M., 2006: Arsenopyrite melting during metamorphism
of sulfide ore deposits. Canadian Mineralogist 44. 1045-1062.
Tomkins, A. G., Pattison, D. R. M. & Frost, B. R., 2007: On the initiation of metamorphic sulfide
anatexis. Journal of Petrology 48, 511-535.
Toulmin, P., Barton, P. B. & Wiggins, L. B., 1991: Commentary of the sphalerite geobarometer.
American Mineralogist 76, 1038-1051.
Van der Kerkhof, A. & Thiéry, R., 2001: Carbonic inclusions. Lithos 55, 49-68.
Vivallo, W., 1985: The geology and genesis of the Proterozoic massive sulfide deposit at Garpenberg,
central Sweden. Economic Geology 80, 17-32.
Vokes, F. M., 1969: A review of the metamorphism of sulphide deposits. Earth Sciences Reviews 5,
99-143.
90
Vokes, F. M., 1973: “Ball texture” in sulphide ores. GFF 95, 403-406.
Vokes, F. M. & Craig, J. R., 1993: Post-recrystallisation mobilisation phenomena in metamorphosed
stratabound sulphide ores. Mineralogical Magazine 57, 19-28.
Wagner, T., Jonsson, E. & Boyce, A. J., 2005: Metamorphic ore remobilization in the Hällefors
disctrict, Bergslagen, Sweden: constraints from mineralogical and small-scale sulphur isotope studies.
Mineralium Deposita 40, 100-114.
Wahlgren, C-H., Cruden, A. R. & Stephens, M. B., 1994: Kinematics of a major fan-like structure in
the eastern part of the Sveconorwegian orogeny, Baltic Shield, south-central Sweden. Precambrian
Research 70, 67-91.
Wang, A., Freeman, J. J., Jolliff, B. L. & Chou, I-M., 2006: Sulfates on Mars: A systematic Raman
spectroscopic study of hydrated states of magnesium sulfates. Geochimica et Cosmochimica Acta 70,
6118-6135.
Weis, F., 2013: Oxygen and iron isotope systematics of the Grängesberg Mining District (GMD),
Central Sweden. Examensarbete vid Institutionen for geovetenskaper 251, Uppsala University, 82 pp.
Widell, P., 1845: Blyglans från Hornkulls silfvergruva. Jern-kontorets annaler, Tjugonionde
årgången, p. 197.
Yardley, B. W. D. & Graham, J. T., 2002: The origins of salinity in metamorphic fluids. Geofluids 2,
249-256.
Yardley, B. W. D. & Cleverley, J. S., 2013: The role of metamorphic fluids in the formation of ore
deposits. In: Jenkin, G. R. T., Lusty, P. A. J., Mcdonald, I., Smith, M. P., Boyce, A. J. & Wilkinson, J.
J. (eds.): Ore Deposits in an evolving Earth. Geological Society of London Special Publications 393,
doi:10.1144/SP393.5.
Zheng, Y., Gu, L., Tang, X., Wang, Z., Wu, C., Zhang, W. & Wu, X., 2012: Sulfide remobilisation
from sulfide ore at high temperatures and differential stresses: An experimental approach. Resource
Geology 62, 174-186.
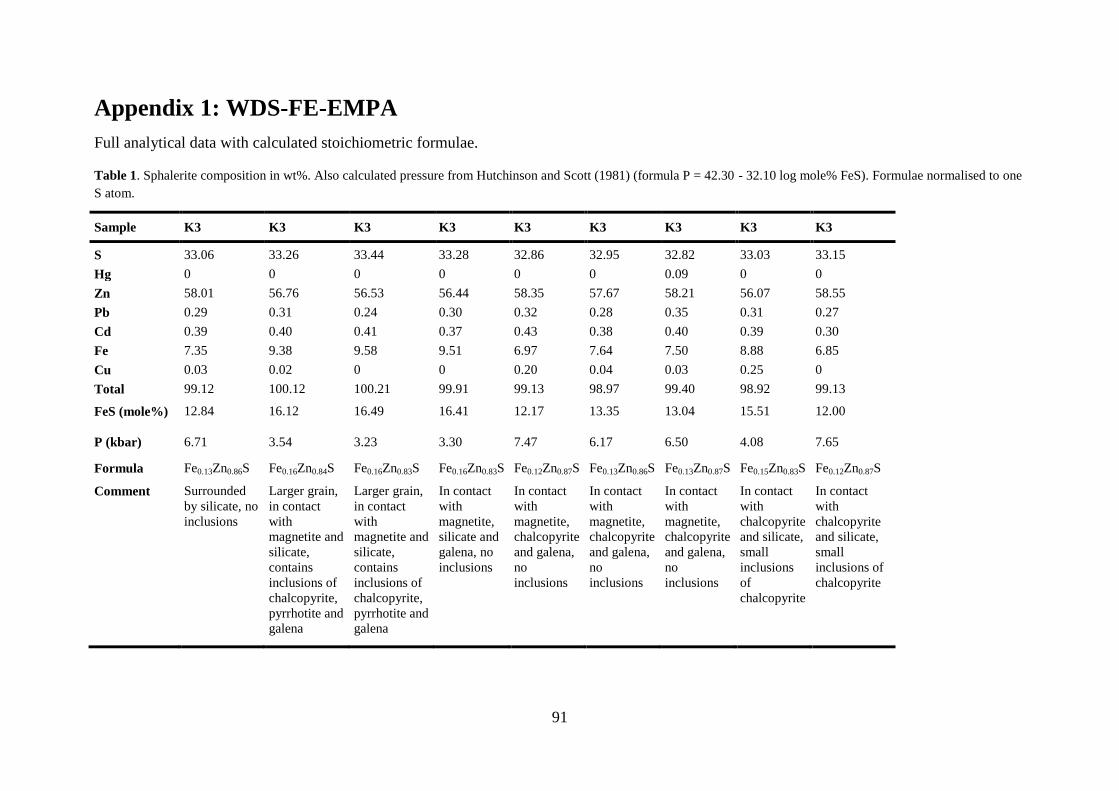
91
Appendix 1: WDS-FE-EMPA
Full analytical data with calculated stoichiometric formulae.
Table 1. Sphalerite composition in wt%. Also calculated pressure from Hutchinson and Scott (1981) (formula P = 42.30 - 32.10 log mole% FeS). Formulae normalised to one
S atom.
Sample K3 K3 K3 K3 K3 K3 K3 K3 K3
S 33.06 33.26 33.44 33.28 32.86 32.95 32.82 33.03 33.15
Hg 0 0 0 0 0 0 0.09 0 0
Zn 58.01 56.76 56.53 56.44 58.35 57.67 58.21 56.07 58.55
Pb 0.29 0.31 0.24 0.30 0.32 0.28 0.35 0.31 0.27
Cd 0.39 0.40 0.41 0.37 0.43 0.38 0.40 0.39 0.30
Fe 7.35 9.38 9.58 9.51 6.97 7.64 7.50 8.88 6.85
Cu 0.03 0.02 0 0 0.20 0.04 0.03 0.25 0
Total 99.12 100.12 100.21 99.91 99.13 98.97 99.40 98.92 99.13
FeS (mole%)
12.84 16.12 16.49 16.41 12.17 13.35 13.04 15.51 12.00
P (kbar)
6.71 3.54 3.23 3.30 7.47 6.17 6.50 4.08 7.65
Formula Fe0.13Zn0.86S Fe0.16Zn0.84S Fe0.16Zn0.83S Fe0.16Zn0.83S Fe0.12Zn0.87S Fe0.13Zn0.86S Fe0.13Zn0.87S Fe0.15Zn0.83S Fe0.12Zn0.87S
Comment
Surrounded
by silicate, no
inclusions
Larger grain,
in contact
with
magnetite and
silicate,
contains
inclusions of
chalcopyrite,
pyrrhotite and
galena
Larger grain,
in contact
with
magnetite and
silicate,
contains
inclusions of
chalcopyrite,
pyrrhotite and
galena
In contact
with
magnetite,
silicate and
galena, no
inclusions
In contact
with
magnetite,
chalcopyrite
and galena,
no
inclusions
In contact
with
magnetite,
chalcopyrite
and galena,
no
inclusions
In contact
with
magnetite,
chalcopyrite
and galena,
no
inclusions
In contact
with
chalcopyrite
and silicate,
small
inclusions
of
chalcopyrite
In contact
with
chalcopyrite
and silicate,
small
inclusions of
chalcopyrite
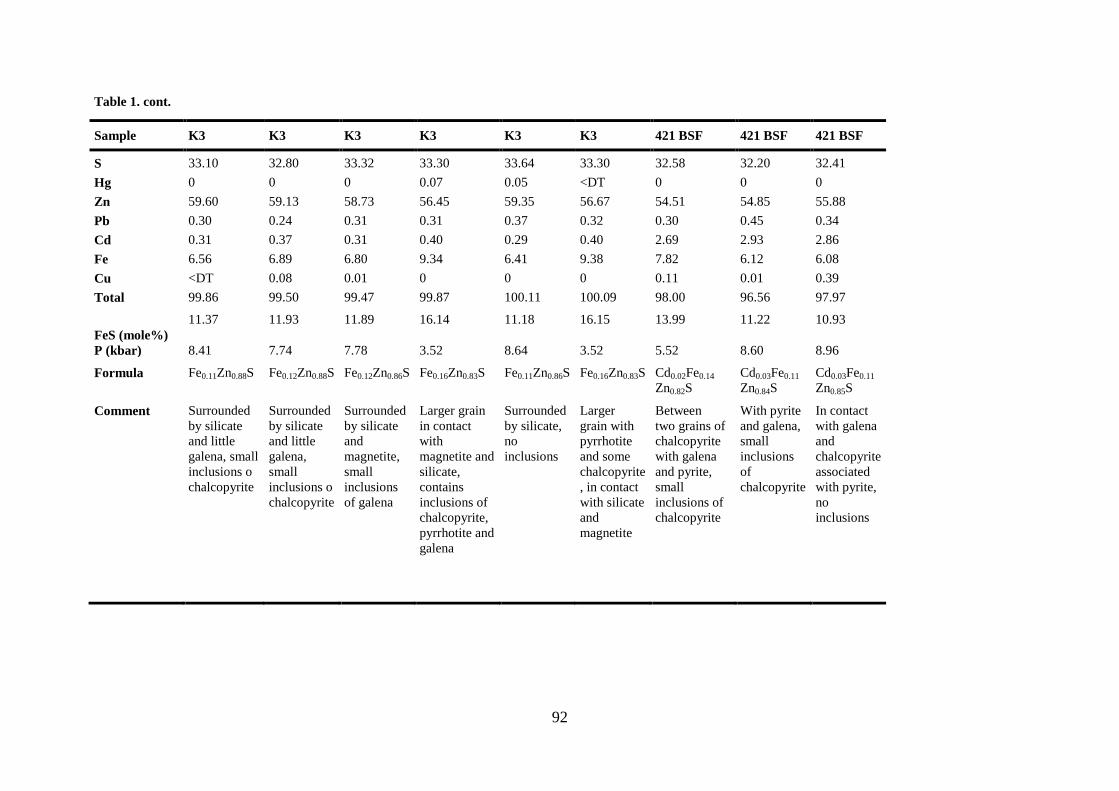
92
Table 1. cont.
Sample K3 K3 K3 K3 K3 K3 421 BSF 421 BSF 421 BSF
S 33.10 32.80 33.32 33.30 33.64 33.30 32.58 32.20 32.41
Hg 0 0 0 0.07 0.05 <DT 0 0 0
Zn 59.60 59.13 58.73 56.45 59.35 56.67 54.51 54.85 55.88
Pb 0.30 0.24 0.31 0.31 0.37 0.32 0.30 0.45 0.34
Cd 0.31 0.37 0.31 0.40 0.29 0.40 2.69 2.93 2.86
Fe 6.56 6.89 6.80 9.34 6.41 9.38 7.82 6.12 6.08
Cu <DT 0.08 0.01 0 0 0 0.11 0.01 0.39
Total 99.86 99.50 99.47 99.87 100.11 100.09 98.00 96.56 97.97
FeS (mole%)
11.37 11.93 11.89 16.14 11.18 16.15 13.99 11.22 10.93
P (kbar)
8.41 7.74 7.78 3.52 8.64 3.52 5.52 8.60 8.96
Formula
Fe0.11Zn0.88S
Fe0.12Zn0.88S
Fe0.12Zn0.86S
Fe0.16Zn0.83S
Fe0.11Zn0.86S
Fe0.16Zn0.83S
Cd0.02Fe0.14
Zn0.82S
Cd0.03Fe0.11
Zn0.84S
Cd0.03Fe0.11
Zn0.85S
Comment
Surrounded
by silicate
and little
galena, small
inclusions o
chalcopyrite
Surrounded
by silicate
and little
galena,
small
inclusions o
chalcopyrite
Surrounded
by silicate
and
magnetite,
small
inclusions
of galena
Larger grain
in contact
with
magnetite and
silicate,
contains
inclusions of
chalcopyrite,
pyrrhotite and
galena
Surrounded
by silicate,
no
inclusions
Larger
grain with
pyrrhotite
and some
chalcopyrite
, in contact
with silicate
and
magnetite
Between
two grains of
chalcopyrite
with galena
and pyrite,
small
inclusions of
chalcopyrite
With pyrite
and galena,
small
inclusions
of
chalcopyrite
In contact
with galena
and
chalcopyrite
associated
with pyrite,
no
inclusions
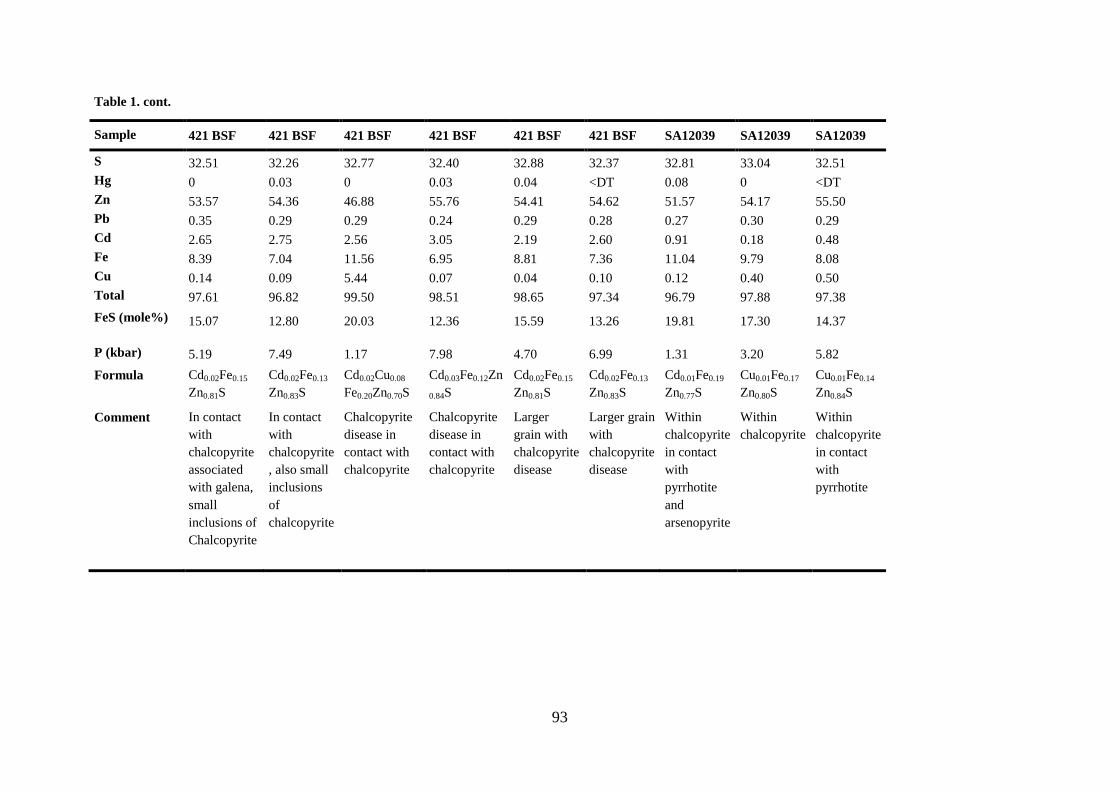
93
Table 1. cont.
Sample 421 BSF 421 BSF 421 BSF 421 BSF 421 BSF 421 BSF SA12039 SA12039 SA12039
S 32.51 32.26 32.77 32.40 32.88 32.37 32.81 33.04 32.51
Hg 0 0.03 0 0.03 0.04 <DT 0.08 0 <DT
Zn 53.57 54.36 46.88 55.76 54.41 54.62 51.57 54.17 55.50
Pb 0.35 0.29 0.29 0.24 0.29 0.28 0.27 0.30 0.29
Cd 2.65 2.75 2.56 3.05 2.19 2.60 0.91 0.18 0.48
Fe 8.39 7.04 11.56 6.95 8.81 7.36 11.04 9.79 8.08
Cu 0.14 0.09 5.44 0.07 0.04 0.10 0.12 0.40 0.50
Total 97.61 96.82 99.50 98.51 98.65 97.34 96.79 97.88 97.38
FeS (mole%)
15.07 12.80 20.03 12.36 15.59 13.26 19.81 17.30 14.37
P (kbar) 5.19 7.49 1.17 7.98 4.70 6.99 1.31 3.20 5.82
Formula
Cd0.02Fe0.15
Zn0.81S
Cd0.02Fe0.13
Zn0.83S
Cd0.02Cu0.08
Fe0.20Zn0.70S
Cd0.03Fe0.12Zn
0.84S
Cd0.02Fe0.15
Zn0.81S
Cd0.02Fe0.13
Zn0.83S
Cd0.01Fe0.19
Zn0.77S
Cu0.01Fe0.17
Zn0.80S
Cu0.01Fe0.14
Zn0.84S
Comment
In contact
with
chalcopyrite
associated
with galena,
small
inclusions of
Chalcopyrite
In contact
with
chalcopyrite
, also small
inclusions
of
chalcopyrite
Chalcopyrite
disease in
contact with
chalcopyrite
Chalcopyrite
disease in
contact with
chalcopyrite
Larger
grain with
chalcopyrite
disease
Larger grain
with
chalcopyrite
disease
Within
chalcopyrite
in contact
with
pyrrhotite
and
arsenopyrite
Within
chalcopyrite
Within
chalcopyrite
in contact
with
pyrrhotite
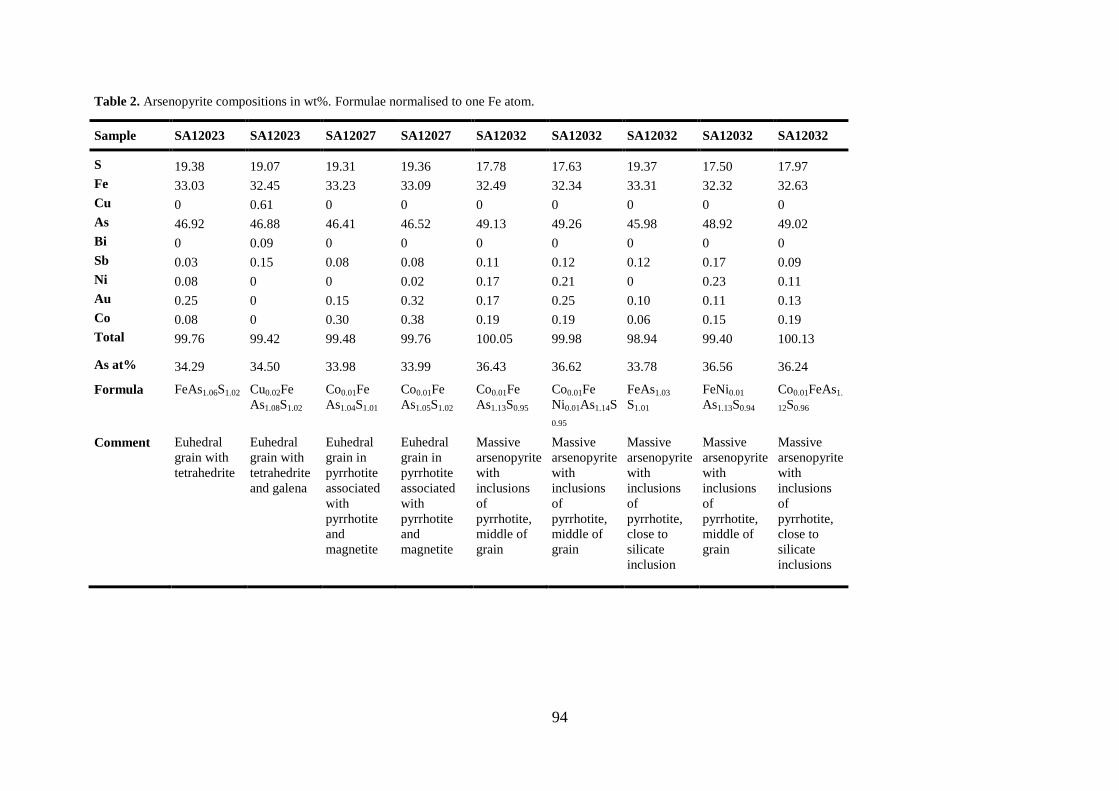
94
Table 2. Arsenopyrite compositions in wt%. Formulae normalised to one Fe atom.
Sample SA12023 SA12023 SA12027 SA12027 SA12032 SA12032 SA12032 SA12032 SA12032
S 19.38 19.07 19.31 19.36 17.78 17.63 19.37 17.50 17.97
Fe 33.03 32.45 33.23 33.09 32.49 32.34 33.31 32.32 32.63
Cu 0 0.61 0 0 0 0 0 0 0
As 46.92 46.88 46.41 46.52 49.13 49.26 45.98 48.92 49.02
Bi 0 0.09 0 0 0 0 0 0 0
Sb 0.03 0.15 0.08 0.08 0.11 0.12 0.12 0.17 0.09
Ni 0.08 0 0 0.02 0.17 0.21 0 0.23 0.11
Au 0.25 0 0.15 0.32 0.17 0.25 0.10 0.11 0.13
Co 0.08 0 0.30 0.38 0.19 0.19 0.06 0.15 0.19
Total 99.76 99.42 99.48 99.76 100.05 99.98 98.94 99.40 100.13
As at% 34.29 34.50 33.98 33.99 36.43 36.62 33.78 36.56 36.24
Formula
FeAs1.06S1.02
Cu0.02Fe
As1.08S1.02
Co0.01Fe
As1.04S1.01
Co0.01Fe
As1.05S1.02
Co0.01Fe
As1.13S0.95
Co0.01Fe
Ni0.01As1.14S
0.95
FeAs1.03
S1.01
FeNi0.01
As1.13S0.94
Co0.01FeAs1.
12S0.96
Comment
Euhedral
grain with
tetrahedrite
Euhedral
grain with
tetrahedrite
and galena
Euhedral
grain in
pyrrhotite
associated
with
pyrrhotite
and
magnetite
Euhedral
grain in
pyrrhotite
associated
with
pyrrhotite
and
magnetite
Massive
arsenopyrite
with
inclusions
of
pyrrhotite,
middle of
grain
Massive
arsenopyrite
with
inclusions
of
pyrrhotite,
middle of
grain
Massive
arsenopyrite
with
inclusions
of
pyrrhotite,
close to
silicate
inclusion
Massive
arsenopyrite
with
inclusions
of
pyrrhotite,
middle of
grain
Massive
arsenopyrite
with
inclusions
of
pyrrhotite,
close to
silicate
inclusions
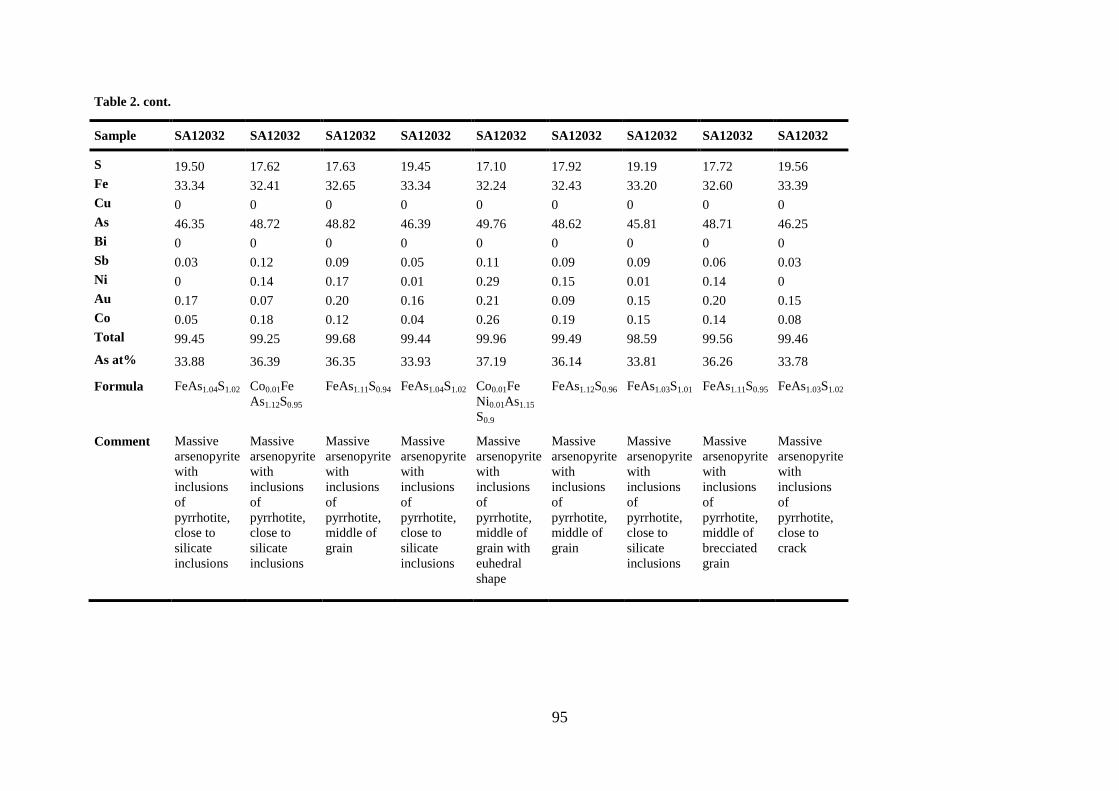
95
Table 2. cont.
Sample SA12032 SA12032 SA12032 SA12032 SA12032 SA12032 SA12032 SA12032 SA12032
S 19.50 17.62 17.63 19.45 17.10 17.92 19.19 17.72 19.56
Fe 33.34 32.41 32.65 33.34 32.24 32.43 33.20 32.60 33.39
Cu 0 0 0 0 0 0 0 0 0
As 46.35 48.72 48.82 46.39 49.76 48.62 45.81 48.71 46.25
Bi 0 0 0 0 0 0 0 0 0
Sb 0.03 0.12 0.09 0.05 0.11 0.09 0.09 0.06 0.03
Ni 0 0.14 0.17 0.01 0.29 0.15 0.01 0.14 0
Au 0.17 0.07 0.20 0.16 0.21 0.09 0.15 0.20 0.15
Co 0.05 0.18 0.12 0.04 0.26 0.19 0.15 0.14 0.08
Total 99.45 99.25 99.68 99.44 99.96 99.49 98.59 99.56 99.46
As at% 33.88 36.39 36.35 33.93 37.19 36.14 33.81 36.26 33.78
Formula
FeAs1.04S1.02
Co0.01Fe
As1.12S0.95
FeAs1.11S0.94
FeAs1.04S1.02
Co0.01Fe
Ni0.01As1.15
S0.9
FeAs1.12S0.96
FeAs1.03S1.01
FeAs1.11S0.95
FeAs1.03S1.02
Comment
Massive
arsenopyrite
with
inclusions
of
pyrrhotite,
close to
silicate
inclusions
Massive
arsenopyrite
with
inclusions
of
pyrrhotite,
close to
silicate
inclusions
Massive
arsenopyrite
with
inclusions
of
pyrrhotite,
middle of
grain
Massive
arsenopyrite
with
inclusions
of
pyrrhotite,
close to
silicate
inclusions
Massive
arsenopyrite
with
inclusions
of
pyrrhotite,
middle of
grain with
euhedral
shape
Massive
arsenopyrite
with
inclusions
of
pyrrhotite,
middle of
grain
Massive
arsenopyrite
with
inclusions
of
pyrrhotite,
close to
silicate
inclusions
Massive
arsenopyrite
with
inclusions
of
pyrrhotite,
middle of
brecciated
grain
Massive
arsenopyrite
with
inclusions
of
pyrrhotite,
close to
crack
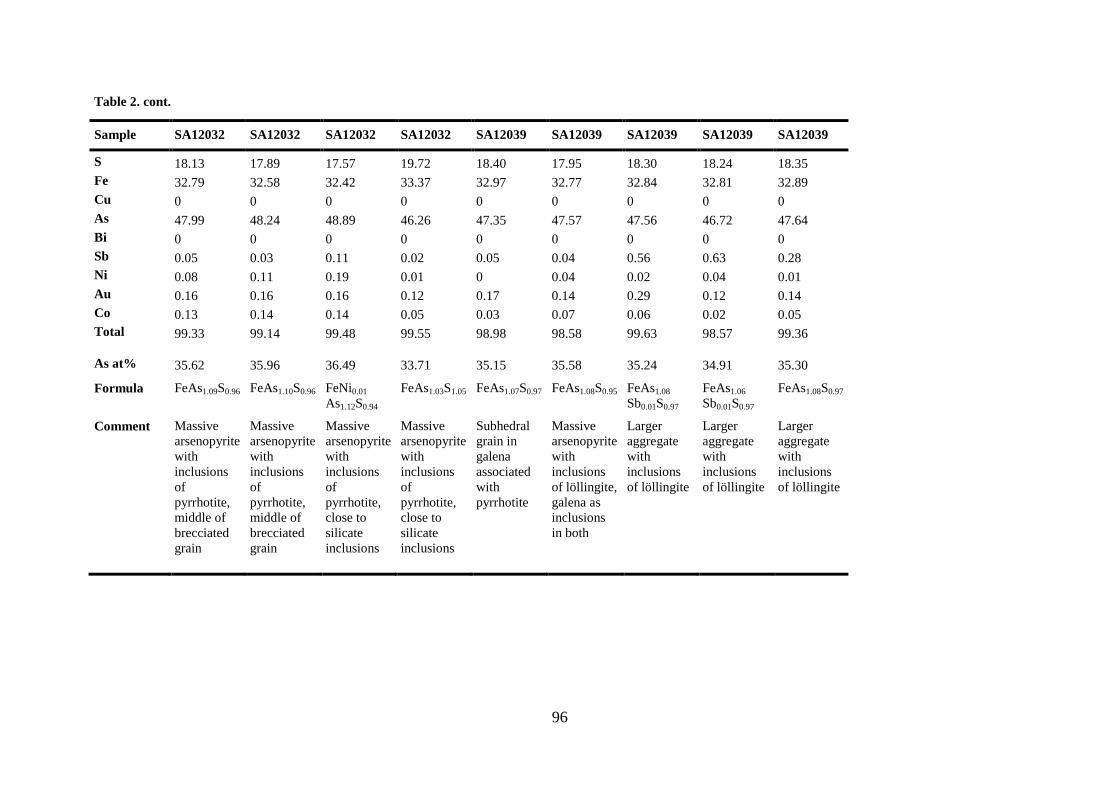
96
Table 2. cont.
Sample SA12032 SA12032 SA12032 SA12032 SA12039 SA12039 SA12039 SA12039 SA12039
S 18.13 17.89 17.57 19.72 18.40 17.95 18.30 18.24 18.35
Fe 32.79 32.58 32.42 33.37 32.97 32.77 32.84 32.81 32.89
Cu 0 0 0 0 0 0 0 0 0
As 47.99 48.24 48.89 46.26 47.35 47.57 47.56 46.72 47.64
Bi 0 0 0 0 0 0 0 0 0
Sb 0.05 0.03 0.11 0.02 0.05 0.04 0.56 0.63 0.28
Ni 0.08 0.11 0.19 0.01 0 0.04 0.02 0.04 0.01
Au 0.16 0.16 0.16 0.12 0.17 0.14 0.29 0.12 0.14
Co 0.13 0.14 0.14 0.05 0.03 0.07 0.06 0.02 0.05
Total 99.33 99.14 99.48 99.55 98.98 98.58 99.63 98.57 99.36
As at% 35.62 35.96 36.49 33.71 35.15 35.58 35.24 34.91 35.30
Formula
FeAs1.09S0.96
FeAs1.10S0.96
FeNi0.01
As1.12S0.94
FeAs1.03S1.05
FeAs1.07S0.97
FeAs1.08S0.95
FeAs1.08
Sb0.01S0.97
FeAs1.06
Sb0.01S0.97
FeAs1.08S0.97
Comment
Massive
arsenopyrite
with
inclusions
of
pyrrhotite,
middle of
brecciated
grain
Massive
arsenopyrite
with
inclusions
of
pyrrhotite,
middle of
brecciated
grain
Massive
arsenopyrite
with
inclusions
of
pyrrhotite,
close to
silicate
inclusions
Massive
arsenopyrite
with
inclusions
of
pyrrhotite,
close to
silicate
inclusions
Subhedral
grain in
galena
associated
with
pyrrhotite
Massive
arsenopyrite
with
inclusions
of löllingite,
galena as
inclusions
in both
Larger
aggregate
with
inclusions
of löllingite
Larger
aggregate
with
inclusions
of löllingite
Larger
aggregate
with
inclusions
of löllingite
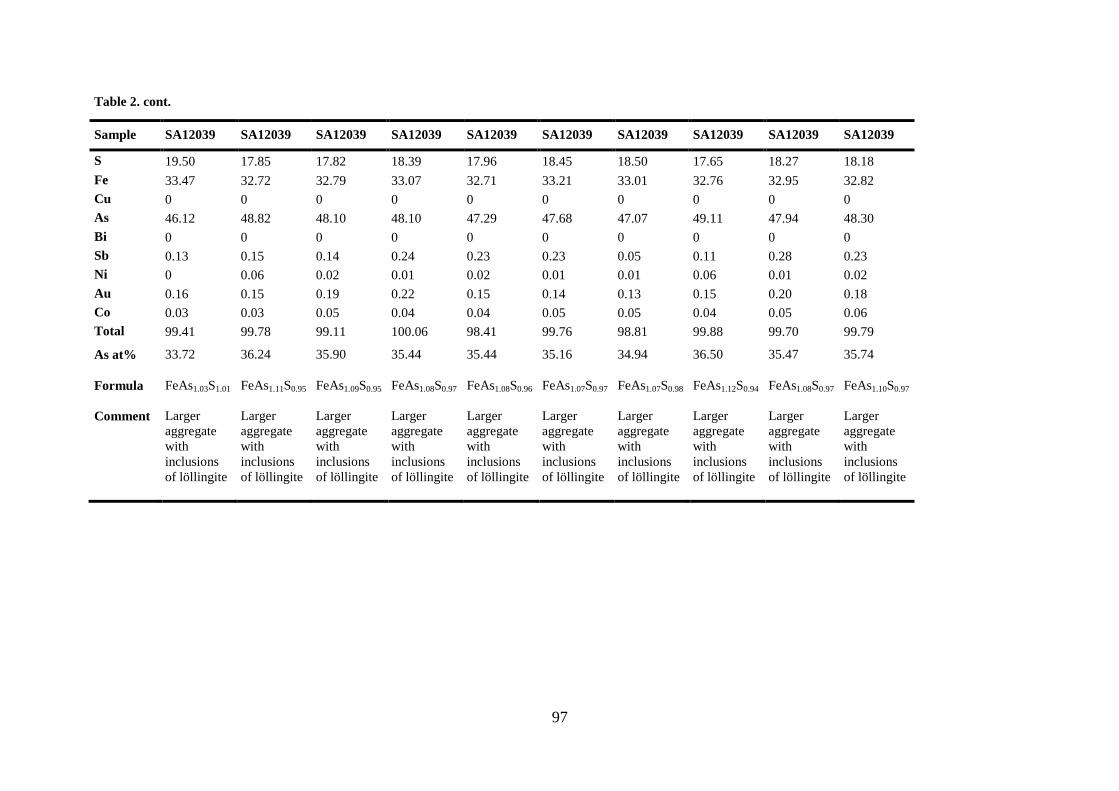
97
Table 2. cont.
Sample SA12039 SA12039 SA12039 SA12039 SA12039 SA12039 SA12039 SA12039 SA12039 SA12039
S 19.50 17.85 17.82 18.39 17.96 18.45 18.50 17.65 18.27 18.18
Fe 33.47 32.72 32.79 33.07 32.71 33.21 33.01 32.76 32.95 32.82
Cu 0 0 0 0 0 0 0 0 0 0
As 46.12 48.82 48.10 48.10 47.29 47.68 47.07 49.11 47.94 48.30
Bi 0 0 0 0 0 0 0 0 0 0
Sb 0.13 0.15 0.14 0.24 0.23 0.23 0.05 0.11 0.28 0.23
Ni 0 0.06 0.02 0.01 0.02 0.01 0.01 0.06 0.01 0.02
Au 0.16 0.15 0.19 0.22 0.15 0.14 0.13 0.15 0.20 0.18
Co 0.03 0.03 0.05 0.04 0.04 0.05 0.05 0.04 0.05 0.06
Total 99.41 99.78 99.11 100.06 98.41 99.76 98.81 99.88 99.70 99.79
As at% 33.72 36.24 35.90 35.44 35.44 35.16 34.94 36.50 35.47 35.74
Formula FeAs1.03S1.01 FeAs1.11S0.95 FeAs1.09S0.95 FeAs1.08S0.97 FeAs1.08S0.96 FeAs1.07S0.97 FeAs1.07S0.98 FeAs1.12S0.94 FeAs1.08S0.97 FeAs1.10S0.97
Comment
Larger
aggregate
with
inclusions
of löllingite
Larger
aggregate
with
inclusions
of löllingite
Larger
aggregate
with
inclusions
of löllingite
Larger
aggregate
with
inclusions
of löllingite
Larger
aggregate
with
inclusions
of löllingite
Larger
aggregate
with
inclusions
of löllingite
Larger
aggregate
with
inclusions
of löllingite
Larger
aggregate
with
inclusions
of löllingite
Larger
aggregate
with
inclusions
of löllingite
Larger
aggregate
with
inclusions
of löllingite
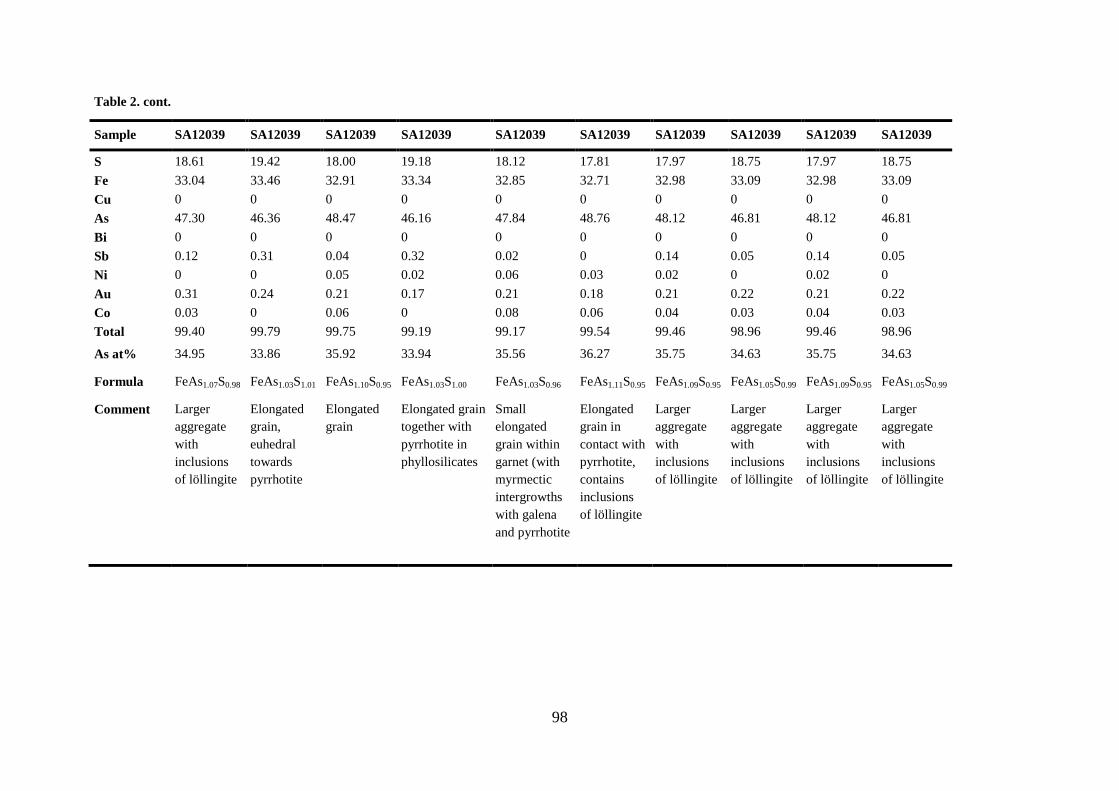
98
Table 2. cont.
Sample SA12039 SA12039 SA12039 SA12039 SA12039 SA12039 SA12039 SA12039 SA12039 SA12039
S 18.61 19.42 18.00 19.18 18.12 17.81 17.97 18.75 17.97 18.75
Fe 33.04 33.46 32.91 33.34 32.85 32.71 32.98 33.09 32.98 33.09
Cu 0 0 0 0 0 0 0 0 0 0
As 47.30 46.36 48.47 46.16 47.84 48.76 48.12 46.81 48.12 46.81
Bi 0 0 0 0 0 0 0 0 0 0
Sb 0.12 0.31 0.04 0.32 0.02 0 0.14 0.05 0.14 0.05
Ni 0 0 0.05 0.02 0.06 0.03 0.02 0 0.02 0
Au 0.31 0.24 0.21 0.17 0.21 0.18 0.21 0.22 0.21 0.22
Co 0.03 0 0.06 0 0.08 0.06 0.04 0.03 0.04 0.03
Total 99.40 99.79 99.75 99.19 99.17 99.54 99.46 98.96 99.46 98.96
As at% 34.95 33.86 35.92 33.94 35.56 36.27 35.75 34.63 35.75 34.63
Formula FeAs1.07S0.98 FeAs1.03S1.01 FeAs1.10S0.95 FeAs1.03S1.00 FeAs1.03S0.96 FeAs1.11S0.95 FeAs1.09S0.95 FeAs1.05S0.99 FeAs1.09S0.95 FeAs1.05S0.99
Comment
Larger
aggregate
with
inclusions
of löllingite
Elongated
grain,
euhedral
towards
pyrrhotite
Elongated
grain
Elongated grain
together with
pyrrhotite in
phyllosilicates
Small
elongated
grain within
garnet (with
myrmectic
intergrowths
with galena
and pyrrhotite
Elongated
grain in
contact with
pyrrhotite,
contains
inclusions
of löllingite
Larger
aggregate
with
inclusions
of löllingite
Larger
aggregate
with
inclusions
of löllingite
Larger
aggregate
with
inclusions
of löllingite
Larger
aggregate
with
inclusions
of löllingite
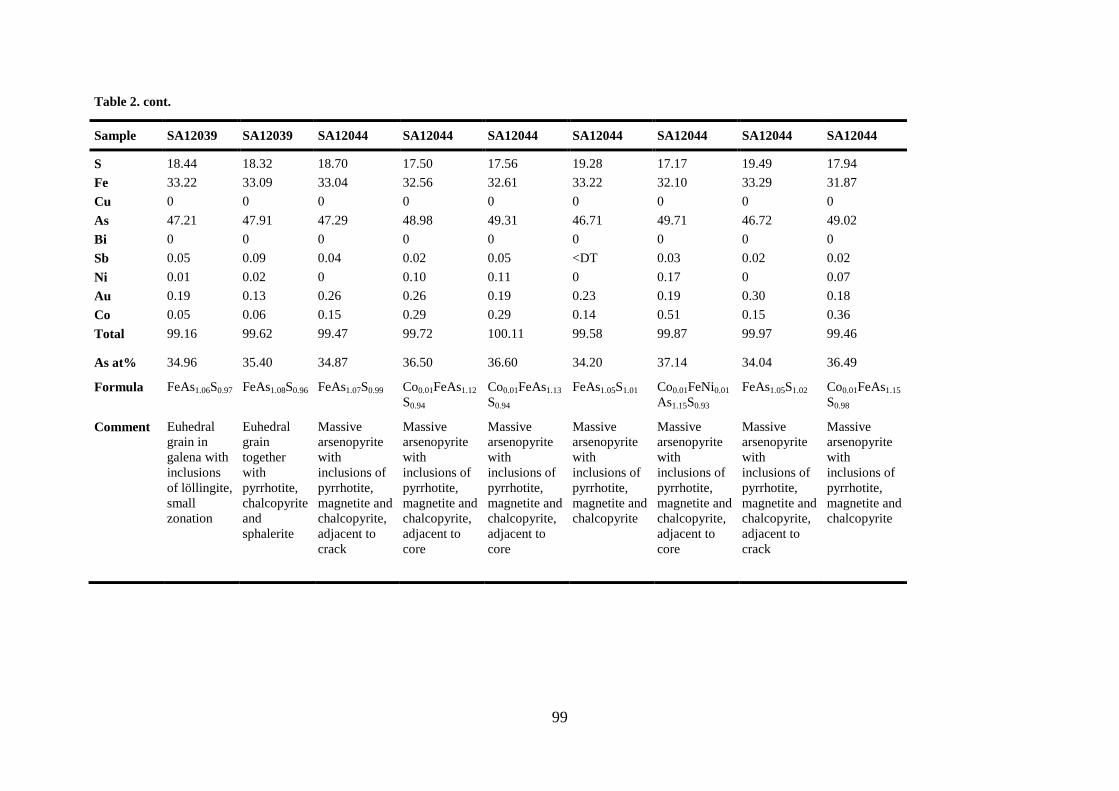
99
Table 2. cont.
Sample SA12039 SA12039 SA12044 SA12044 SA12044 SA12044 SA12044 SA12044 SA12044
S 18.44 18.32 18.70 17.50 17.56 19.28 17.17 19.49 17.94
Fe 33.22 33.09 33.04 32.56 32.61 33.22 32.10 33.29 31.87
Cu 0 0 0 0 0 0 0 0 0
As 47.21 47.91 47.29 48.98 49.31 46.71 49.71 46.72 49.02
Bi 0 0 0 0 0 0 0 0 0
Sb 0.05 0.09 0.04 0.02 0.05 <DT 0.03 0.02 0.02
Ni 0.01 0.02 0 0.10 0.11 0 0.17 0 0.07
Au 0.19 0.13 0.26 0.26 0.19 0.23 0.19 0.30 0.18
Co 0.05 0.06 0.15 0.29 0.29 0.14 0.51 0.15 0.36
Total 99.16 99.62 99.47 99.72 100.11 99.58 99.87 99.97 99.46
As at% 34.96 35.40 34.87 36.50 36.60 34.20 37.14 34.04 36.49
Formula
FeAs1.06S0.97
FeAs1.08S0.96
FeAs1.07S0.99
Co0.01FeAs1.12
S0.94
Co0.01FeAs1.13
S0.94
FeAs1.05S1.01
Co0.01FeNi0.01
As1.15S0.93
FeAs1.05S1.02
Co0.01FeAs1.15
S0.98
Comment
Euhedral
grain in
galena with
inclusions
of löllingite,
small
zonation
Euhedral
grain
together
with
pyrrhotite,
chalcopyrite
and
sphalerite
Massive
arsenopyrite
with
inclusions of
pyrrhotite,
magnetite and
chalcopyrite,
adjacent to
crack
Massive
arsenopyrite
with
inclusions of
pyrrhotite,
magnetite and
chalcopyrite,
adjacent to
core
Massive
arsenopyrite
with
inclusions of
pyrrhotite,
magnetite and
chalcopyrite,
adjacent to
core
Massive
arsenopyrite
with
inclusions of
pyrrhotite,
magnetite and
chalcopyrite
Massive
arsenopyrite
with
inclusions of
pyrrhotite,
magnetite and
chalcopyrite,
adjacent to
core
Massive
arsenopyrite
with
inclusions of
pyrrhotite,
magnetite and
chalcopyrite,
adjacent to
crack
Massive
arsenopyrite
with
inclusions of
pyrrhotite,
magnetite and
chalcopyrite
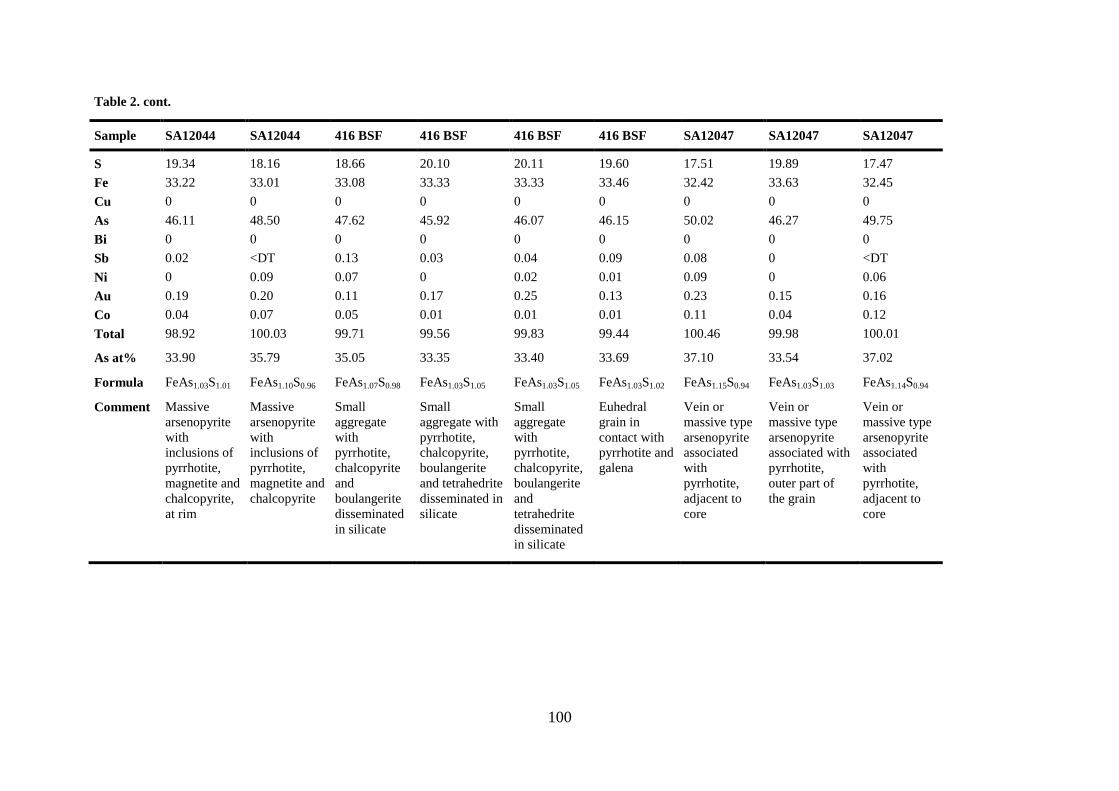
100
Table 2. cont.
Sample SA12044 SA12044 416 BSF 416 BSF 416 BSF 416 BSF SA12047 SA12047 SA12047
S 19.34 18.16 18.66 20.10 20.11 19.60 17.51 19.89 17.47
Fe 33.22 33.01 33.08 33.33 33.33 33.46 32.42 33.63 32.45
Cu 0 0 0 0 0 0 0 0 0
As 46.11 48.50 47.62 45.92 46.07 46.15 50.02 46.27 49.75
Bi 0 0 0 0 0 0 0 0 0
Sb 0.02 <DT 0.13 0.03 0.04 0.09 0.08 0 <DT
Ni 0 0.09 0.07 0 0.02 0.01 0.09 0 0.06
Au 0.19 0.20 0.11 0.17 0.25 0.13 0.23 0.15 0.16
Co 0.04 0.07 0.05 0.01 0.01 0.01 0.11 0.04 0.12
Total 98.92 100.03 99.71 99.56 99.83 99.44 100.46 99.98 100.01
As at% 33.90 35.79 35.05 33.35 33.40 33.69 37.10 33.54 37.02
Formula FeAs1.03S1.01 FeAs1.10S0.96 FeAs1.07S0.98 FeAs1.03S1.05 FeAs1.03S1.05 FeAs1.03S1.02 FeAs1.15S0.94 FeAs1.03S1.03 FeAs1.14S0.94
Comment
Massive
arsenopyrite
with
inclusions of
pyrrhotite,
magnetite and
chalcopyrite,
at rim
Massive
arsenopyrite
with
inclusions of
pyrrhotite,
magnetite and
chalcopyrite
Small
aggregate
with
pyrrhotite,
chalcopyrite
and
boulangerite
disseminated
in silicate
Small
aggregate with
pyrrhotite,
chalcopyrite,
boulangerite
and tetrahedrite
disseminated in
silicate
Small
aggregate
with
pyrrhotite,
chalcopyrite,
boulangerite
and
tetrahedrite
disseminated
in silicate
Euhedral
grain in
contact with
pyrrhotite and
galena
Vein or
massive type
arsenopyrite
associated
with
pyrrhotite,
adjacent to
core
Vein or
massive type
arsenopyrite
associated with
pyrrhotite,
outer part of
the grain
Vein or
massive type
arsenopyrite
associated
with
pyrrhotite,
adjacent to
core
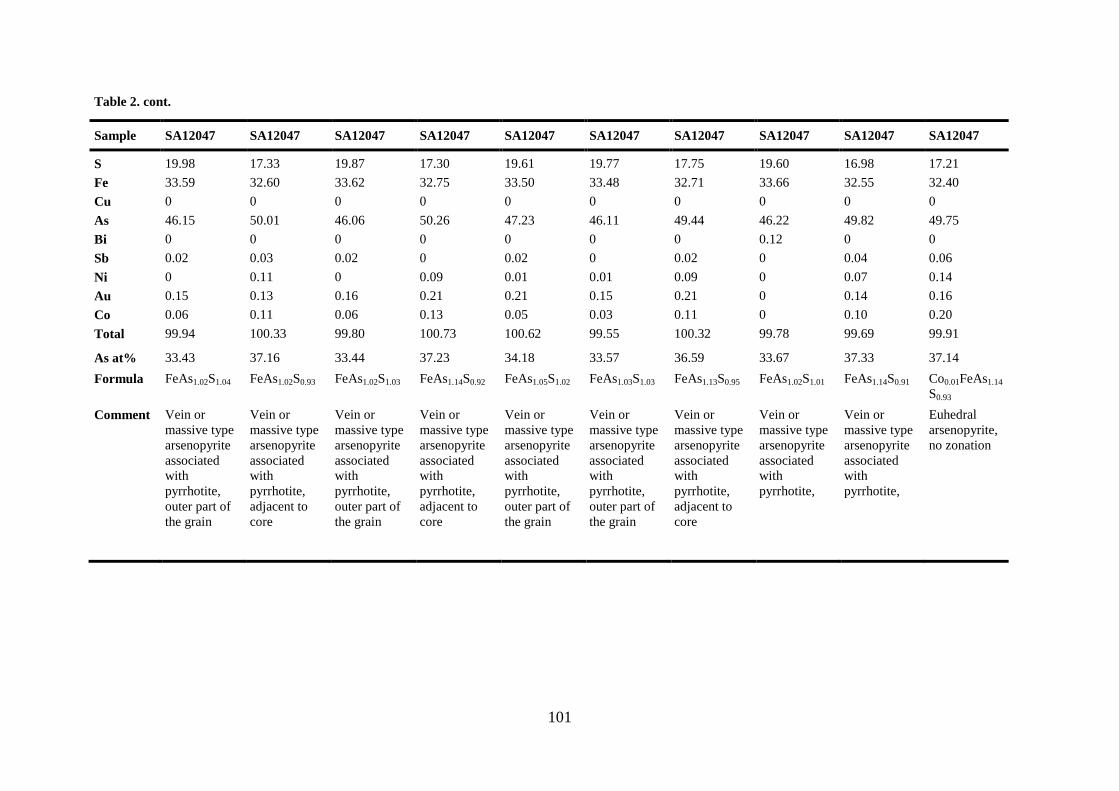
101
Table 2. cont.
Sample SA12047 SA12047 SA12047 SA12047 SA12047 SA12047 SA12047 SA12047 SA12047 SA12047
S 19.98 17.33 19.87 17.30 19.61 19.77 17.75 19.60 16.98 17.21
Fe 33.59 32.60 33.62 32.75 33.50 33.48 32.71 33.66 32.55 32.40
Cu 0 0 0 0 0 0 0 0 0 0
As 46.15 50.01 46.06 50.26 47.23 46.11 49.44 46.22 49.82 49.75
Bi 0 0 0 0 0 0 0 0.12 0 0
Sb 0.02 0.03 0.02 0 0.02 0 0.02 0 0.04 0.06
Ni 0 0.11 0 0.09 0.01 0.01 0.09 0 0.07 0.14
Au 0.15 0.13 0.16 0.21 0.21 0.15 0.21 0 0.14 0.16
Co 0.06 0.11 0.06 0.13 0.05 0.03 0.11 0 0.10 0.20
Total 99.94 100.33 99.80 100.73 100.62 99.55 100.32 99.78 99.69 99.91
As at% 33.43 37.16 33.44 37.23 34.18 33.57 36.59 33.67 37.33 37.14
Formula
FeAs1.02S1.04
FeAs1.02S0.93
FeAs1.02S1.03
FeAs1.14S0.92
FeAs1.05S1.02
FeAs1.03S1.03
FeAs1.13S0.95
FeAs1.02S1.01
FeAs1.14S0.91
Co0.01FeAs1.14
S0.93
Comment
Vein or
massive type
arsenopyrite
associated
with
pyrrhotite,
outer part of
the grain
Vein or
massive type
arsenopyrite
associated
with
pyrrhotite,
adjacent to
core
Vein or
massive type
arsenopyrite
associated
with
pyrrhotite,
outer part of
the grain
Vein or
massive type
arsenopyrite
associated
with
pyrrhotite,
adjacent to
core
Vein or
massive type
arsenopyrite
associated
with
pyrrhotite,
outer part of
the grain
Vein or
massive type
arsenopyrite
associated
with
pyrrhotite,
outer part of
the grain
Vein or
massive type
arsenopyrite
associated
with
pyrrhotite,
adjacent to
core
Vein or
massive type
arsenopyrite
associated
with
pyrrhotite,
Vein or
massive type
arsenopyrite
associated
with
pyrrhotite,
Euhedral
arsenopyrite,
no zonation
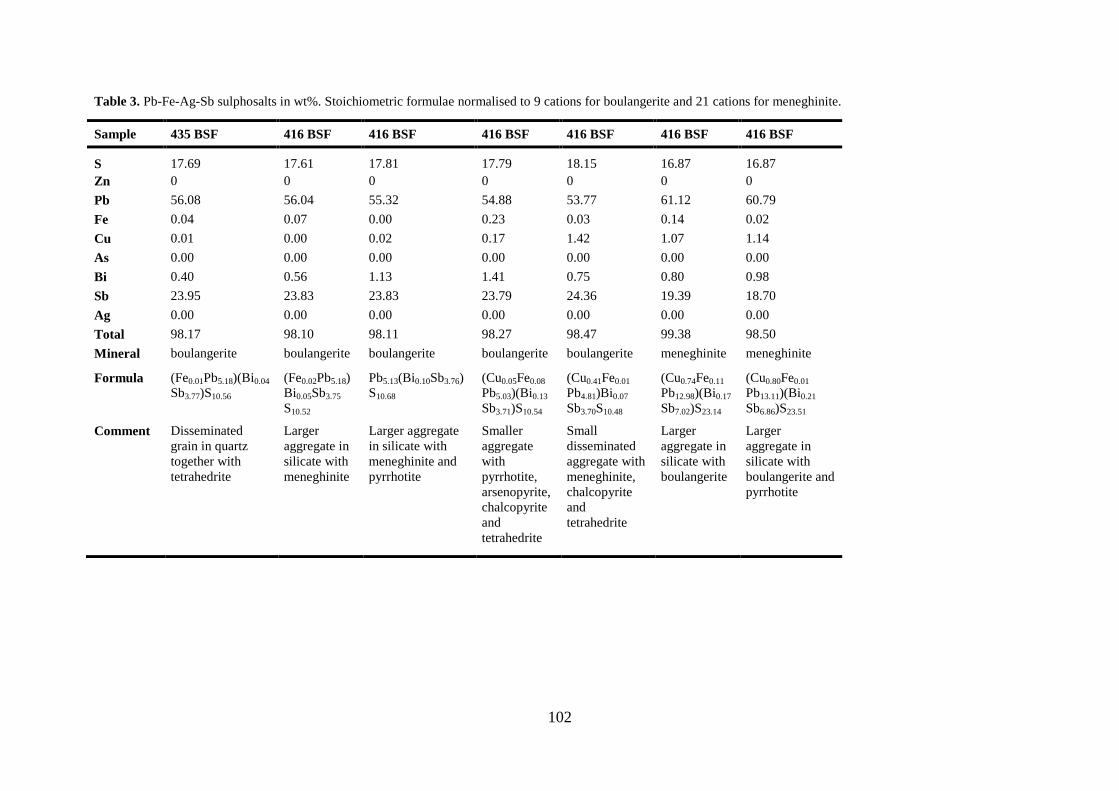
102
Table 3. Pb-Fe-Ag-Sb sulphosalts in wt%. Stoichiometric formulae normalised to 9 cations for boulangerite and 21 cations for meneghinite.
Sample 435 BSF 416 BSF 416 BSF 416 BSF 416 BSF 416 BSF 416 BSF
S 17.69 17.61 17.81 17.79 18.15 16.87 16.87
Zn 0 0 0 0 0 0 0
Pb 56.08 56.04 55.32 54.88 53.77 61.12 60.79
Fe 0.04 0.07 0.00 0.23 0.03 0.14 0.02
Cu 0.01 0.00 0.02 0.17 1.42 1.07 1.14
As 0.00 0.00 0.00 0.00 0.00 0.00 0.00
Bi 0.40 0.56 1.13 1.41 0.75 0.80 0.98
Sb 23.95 23.83 23.83 23.79 24.36 19.39 18.70
Ag 0.00 0.00 0.00 0.00 0.00 0.00 0.00
Total 98.17 98.10 98.11 98.27 98.47 99.38 98.50
Mineral boulangerite boulangerite boulangerite boulangerite boulangerite meneghinite meneghinite
Formula
(Fe0.01Pb5.18)(Bi0.04
Sb3.77)S10.56
(Fe0.02Pb5.18)
Bi0.05Sb3.75
S10.52
Pb5.13(Bi0.10Sb3.76)
S10.68
(Cu0.05Fe0.08
Pb5.03)(Bi0.13
Sb3.71)S10.54
(Cu0.41Fe0.01
Pb4.81)Bi0.07
Sb3.70S10.48
(Cu0.74Fe0.11
Pb12.98)(Bi0.17
Sb7.02)S23.14
(Cu0.80Fe0.01
Pb13.11)(Bi0.21
Sb6.86)S23.51
Comment
Disseminated
grain in quartz
together with
tetrahedrite
Larger
aggregate in
silicate with
meneghinite
Larger aggregate
in silicate with
meneghinite and
pyrrhotite
Smaller
aggregate
with
pyrrhotite,
arsenopyrite,
chalcopyrite
and
tetrahedrite
Small
disseminated
aggregate with
meneghinite,
chalcopyrite
and
tetrahedrite
Larger
aggregate in
silicate with
boulangerite
Larger
aggregate in
silicate with
boulangerite and
pyrrhotite
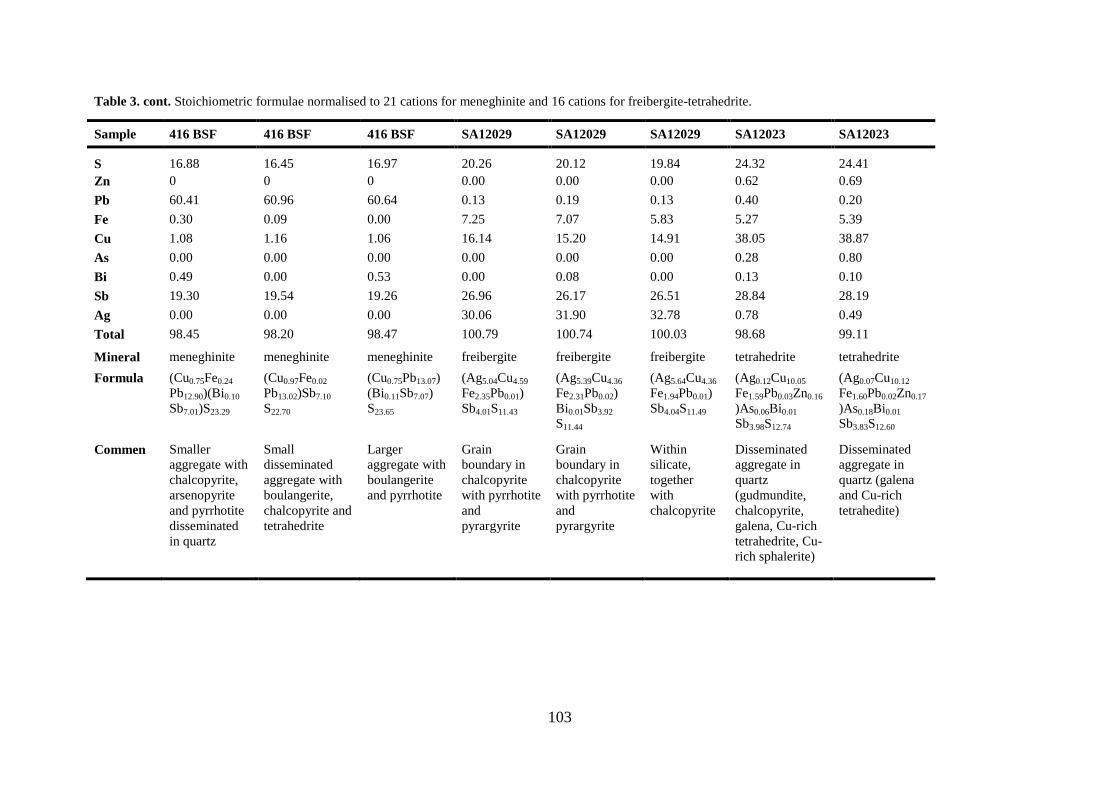
103
Table 3. cont. Stoichiometric formulae normalised to 21 cations for meneghinite and 16 cations for freibergite-tetrahedrite.
Sample 416 BSF 416 BSF 416 BSF SA12029 SA12029 SA12029 SA12023 SA12023
S 16.88 16.45 16.97 20.26 20.12 19.84 24.32 24.41
Zn 0 0 0 0.00 0.00 0.00 0.62 0.69
Pb 60.41 60.96 60.64 0.13 0.19 0.13 0.40 0.20
Fe 0.30 0.09 0.00 7.25 7.07 5.83 5.27 5.39
Cu 1.08 1.16 1.06 16.14 15.20 14.91 38.05 38.87
As 0.00 0.00 0.00 0.00 0.00 0.00 0.28 0.80
Bi 0.49 0.00 0.53 0.00 0.08 0.00 0.13 0.10
Sb 19.30 19.54 19.26 26.96 26.17 26.51 28.84 28.19
Ag 0.00 0.00 0.00 30.06 31.90 32.78 0.78 0.49
Total 98.45 98.20 98.47 100.79 100.74 100.03 98.68 99.11
Mineral meneghinite meneghinite meneghinite freibergite freibergite freibergite tetrahedrite tetrahedrite
Formula
(Cu0.75Fe0.24
Pb12.90)(Bi0.10
Sb7.01)S23.29
(Cu0.97Fe0.02
Pb13.02)Sb7.10
S22.70
(Cu0.75Pb13.07)
(Bi0.11Sb7.07)
S23.65
(Ag5.04Cu4.59
Fe2.35Pb0.01)
Sb4.01S11.43
(Ag5.39Cu4.36
Fe2.31Pb0.02)
Bi0.01Sb3.92
S11.44
(Ag5.64Cu4.36
Fe1.94Pb0.01)
Sb4.04S11.49
(Ag0.12Cu10.05
Fe1.59Pb0.03Zn0.16
)As0.06Bi0.01
Sb3.98S12.74
(Ag0.07Cu10.12
Fe1.60Pb0.02Zn0.17
)As0.18Bi0.01
Sb3.83S12.60
Commen Smaller
aggregate with
chalcopyrite,
arsenopyrite
and pyrrhotite
disseminated
in quartz
Small
disseminated
aggregate with
boulangerite,
chalcopyrite and
tetrahedrite
Larger
aggregate with
boulangerite
and pyrrhotite
Grain
boundary in
chalcopyrite
with pyrrhotite
and
pyrargyrite
Grain
boundary in
chalcopyrite
with pyrrhotite
and
pyrargyrite
Within
silicate,
together
with
chalcopyrite
Disseminated
aggregate in
quartz
(gudmundite,
chalcopyrite,
galena, Cu-rich
tetrahedrite, Cu-
rich sphalerite)
Disseminated
aggregate in
quartz (galena
and Cu-rich
tetrahedite)
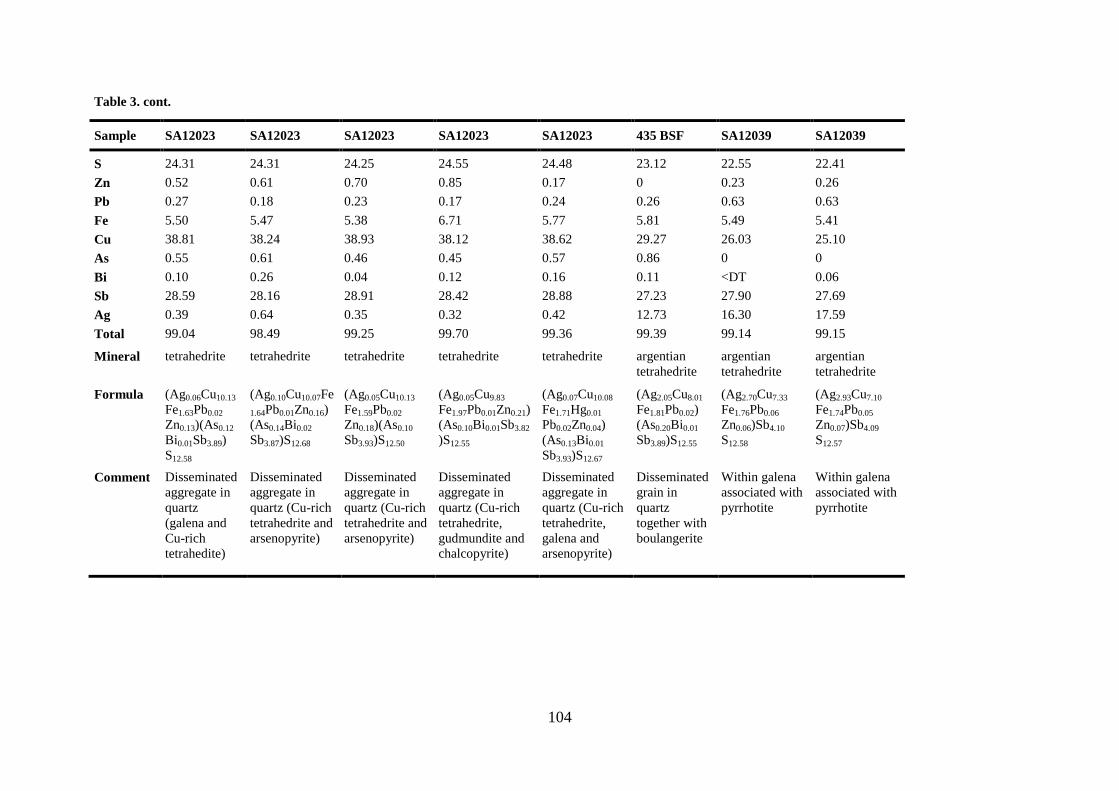
104
Table 3. cont.
Sample SA12023 SA12023 SA12023 SA12023 SA12023 435 BSF SA12039 SA12039
S 24.31 24.31 24.25 24.55 24.48 23.12 22.55 22.41
Zn 0.52 0.61 0.70 0.85 0.17 0 0.23 0.26
Pb 0.27 0.18 0.23 0.17 0.24 0.26 0.63 0.63
Fe 5.50 5.47 5.38 6.71 5.77 5.81 5.49 5.41
Cu 38.81 38.24 38.93 38.12 38.62 29.27 26.03 25.10
As 0.55 0.61 0.46 0.45 0.57 0.86 0 0
Bi 0.10 0.26 0.04 0.12 0.16 0.11 <DT 0.06
Sb 28.59 28.16 28.91 28.42 28.88 27.23 27.90 27.69
Ag 0.39 0.64 0.35 0.32 0.42 12.73 16.30 17.59
Total 99.04 98.49 99.25 99.70 99.36 99.39 99.14 99.15
Mineral
tetrahedrite
tetrahedrite
tetrahedrite
tetrahedrite
tetrahedrite
argentian
tetrahedrite
argentian
tetrahedrite
argentian
tetrahedrite
Formula
(Ag0.06Cu10.13
Fe1.63Pb0.02
Zn0.13)(As0.12
Bi0.01Sb3.89)
S12.58
(Ag0.10Cu10.07Fe
1.64Pb0.01Zn0.16)
(As0.14Bi0.02
Sb3.87)S12.68
(Ag0.05Cu10.13
Fe1.59Pb0.02
Zn0.18)(As0.10
Sb3.93)S12.50
(Ag0.05Cu9.83
Fe1.97Pb0.01Zn0.21)
(As0.10Bi0.01Sb3.82
)S12.55
(Ag0.07Cu10.08
Fe1.71Hg0.01
Pb0.02Zn0.04)
(As0.13Bi0.01
Sb3.93)S12.67
(Ag2.05Cu8.01
Fe1.81Pb0.02)
(As0.20Bi0.01
Sb3.89)S12.55
(Ag2.70Cu7.33
Fe1.76Pb0.06
Zn0.06)Sb4.10
S12.58
(Ag2.93Cu7.10
Fe1.74Pb0.05
Zn0.07)Sb4.09
S12.57
Comment
Disseminated
aggregate in
quartz
(galena and
Cu-rich
tetrahedite)
Disseminated
aggregate in
quartz (Cu-rich
tetrahedrite and
arsenopyrite)
Disseminated
aggregate in
quartz (Cu-rich
tetrahedrite and
arsenopyrite)
Disseminated
aggregate in
quartz (Cu-rich
tetrahedrite,
gudmundite and
chalcopyrite)
Disseminated
aggregate in
quartz (Cu-rich
tetrahedrite,
galena and
arsenopyrite)
Disseminated
grain in
quartz
together with
boulangerite
Within galena
associated with
pyrrhotite
Within galena
associated with
pyrrhotite
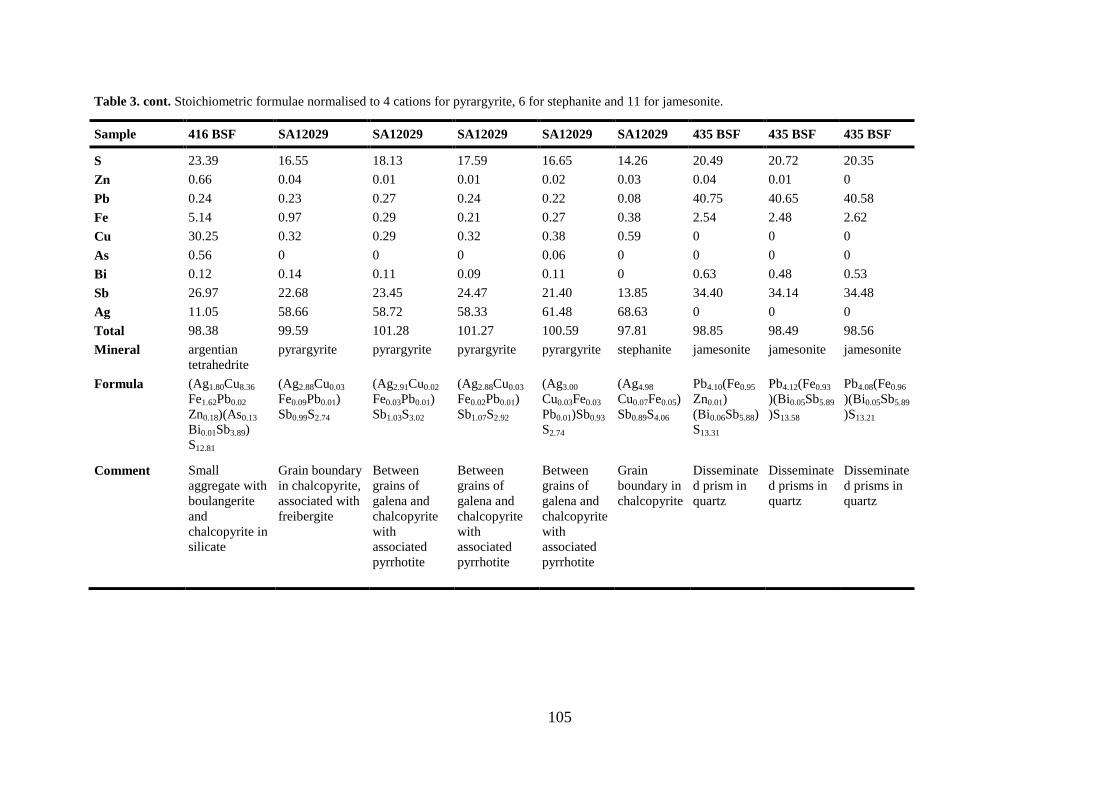
105
Table 3. cont. Stoichiometric formulae normalised to 4 cations for pyrargyrite, 6 for stephanite and 11 for jamesonite.
Sample 416 BSF SA12029 SA12029 SA12029 SA12029 SA12029 435 BSF 435 BSF 435 BSF
S 23.39 16.55 18.13 17.59 16.65 14.26 20.49 20.72 20.35
Zn 0.66 0.04 0.01 0.01 0.02 0.03 0.04 0.01 0
Pb 0.24 0.23 0.27 0.24 0.22 0.08 40.75 40.65 40.58
Fe 5.14 0.97 0.29 0.21 0.27 0.38 2.54 2.48 2.62
Cu 30.25 0.32 0.29 0.32 0.38 0.59 0 0 0
As 0.56 0 0 0 0.06 0 0 0 0
Bi 0.12 0.14 0.11 0.09 0.11 0 0.63 0.48 0.53
Sb 26.97 22.68 23.45 24.47 21.40 13.85 34.40 34.14 34.48
Ag 11.05 58.66 58.72 58.33 61.48 68.63 0 0 0
Total 98.38 99.59 101.28 101.27 100.59 97.81 98.85 98.49 98.56
Mineral
argentian
tetrahedrite
pyrargyrite
pyrargyrite
pyrargyrite
pyrargyrite
stephanite
jamesonite
jamesonite
jamesonite
Formula
(Ag1.80Cu8.36
Fe1.62Pb0.02
Zn0.18)(As0.13
Bi0.01Sb3.89)
S12.81
(Ag2.88Cu0.03
Fe0.09Pb0.01)
Sb0.99S2.74
(Ag2.91Cu0.02
Fe0.03Pb0.01)
Sb1.03S3.02
(Ag2.88Cu0.03
Fe0.02Pb0.01)
Sb1.07S2.92
(Ag3.00
Cu0.03Fe0.03
Pb0.01)Sb0.93
S2.74
(Ag4.98
Cu0.07Fe0.05)
Sb0.89S4.06
Pb4.10(Fe0.95
Zn0.01)
(Bi0.06Sb5.88)
S13.31
Pb4.12(Fe0.93
)(Bi0.05Sb5.89
)S13.58
Pb4.08(Fe0.96
)(Bi0.05Sb5.89
)S13.21
Comment
Small
aggregate with
boulangerite
and
chalcopyrite in
silicate
Grain boundary
in chalcopyrite,
associated with
freibergite
Between
grains of
galena and
chalcopyrite
with
associated
pyrrhotite
Between
grains of
galena and
chalcopyrite
with
associated
pyrrhotite
Between
grains of
galena and
chalcopyrite
with
associated
pyrrhotite
Grain
boundary in
chalcopyrite
Disseminate
d prism in
quartz
Disseminate
d prisms in
quartz
Disseminate
d prisms in
quartz
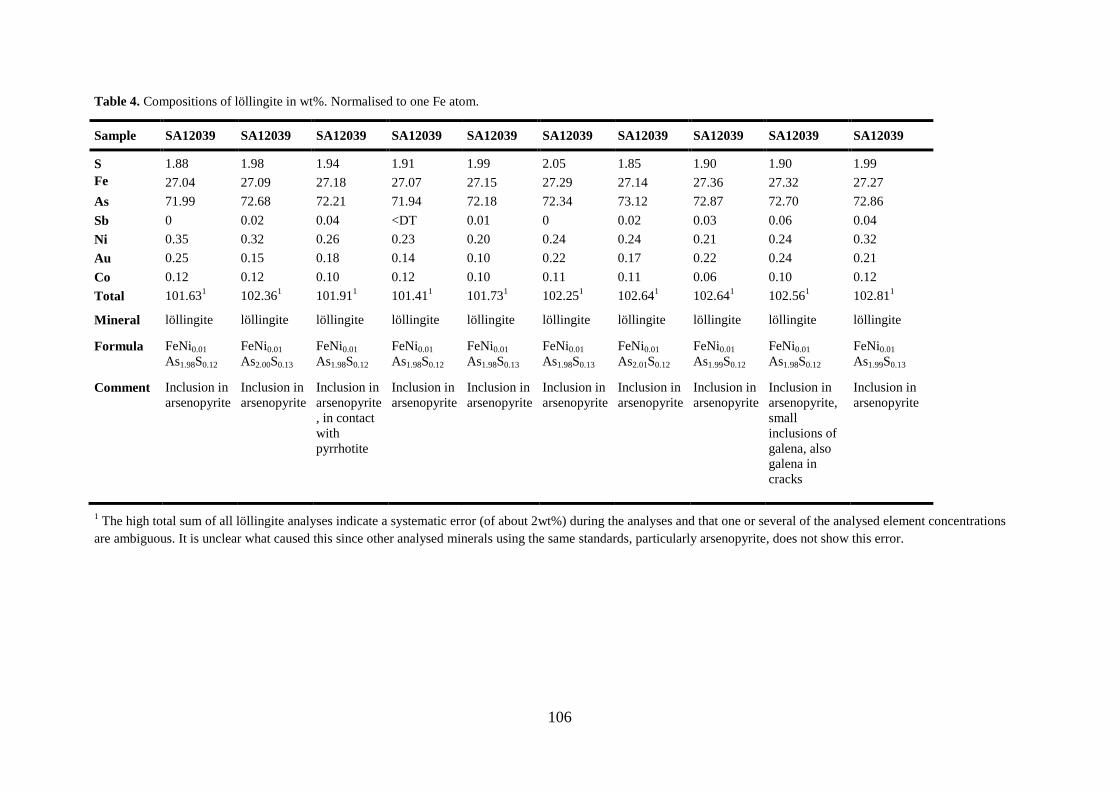
106
Table 4. Compositions of löllingite in wt%. Normalised to one Fe atom.
Sample SA12039 SA12039 SA12039 SA12039 SA12039 SA12039 SA12039 SA12039 SA12039 SA12039
S 1.88 1.98 1.94 1.91 1.99 2.05 1.85 1.90 1.90 1.99
Fe 27.04 27.09 27.18 27.07 27.15 27.29 27.14 27.36 27.32 27.27
As 71.99 72.68 72.21 71.94 72.18 72.34 73.12 72.87 72.70 72.86
Sb 0 0.02 0.04 <DT 0.01 0 0.02 0.03 0.06 0.04
Ni 0.35 0.32 0.26 0.23 0.20 0.24 0.24 0.21 0.24 0.32
Au 0.25 0.15 0.18 0.14 0.10 0.22 0.17 0.22 0.24 0.21
Co 0.12 0.12 0.10 0.12 0.10 0.11 0.11 0.06 0.10 0.12
Total 101.631 102.36
1 101.91
1 101.41
1 101.73
1 102.25
1 102.64
1 102.64
1 102.56
1 102.81
1
Mineral löllingite löllingite löllingite löllingite löllingite löllingite löllingite löllingite löllingite löllingite
Formula
FeNi0.01
As1.98S0.12
FeNi0.01
As2.00S0.13
FeNi0.01
As1.98S0.12
FeNi0.01
As1.98S0.12
FeNi0.01
As1.98S0.13
FeNi0.01
As1.98S0.13
FeNi0.01
As2.01S0.12
FeNi0.01
As1.99S0.12
FeNi0.01
As1.98S0.12
FeNi0.01
As1.99S0.13
Comment
Inclusion in
arsenopyrite
Inclusion in
arsenopyrite
Inclusion in
arsenopyrite
, in contact
with
pyrrhotite
Inclusion in
arsenopyrite
Inclusion in
arsenopyrite
Inclusion in
arsenopyrite
Inclusion in
arsenopyrite
Inclusion in
arsenopyrite
Inclusion in
arsenopyrite,
small
inclusions of
galena, also
galena in
cracks
Inclusion in
arsenopyrite
1 The high total sum of all löllingite analyses indicate a systematic error (of about 2wt%) during the analyses and that one or several of the analysed element concentrations
are ambiguous. It is unclear what caused this since other analysed minerals using the same standards, particularly arsenopyrite, does not show this error.
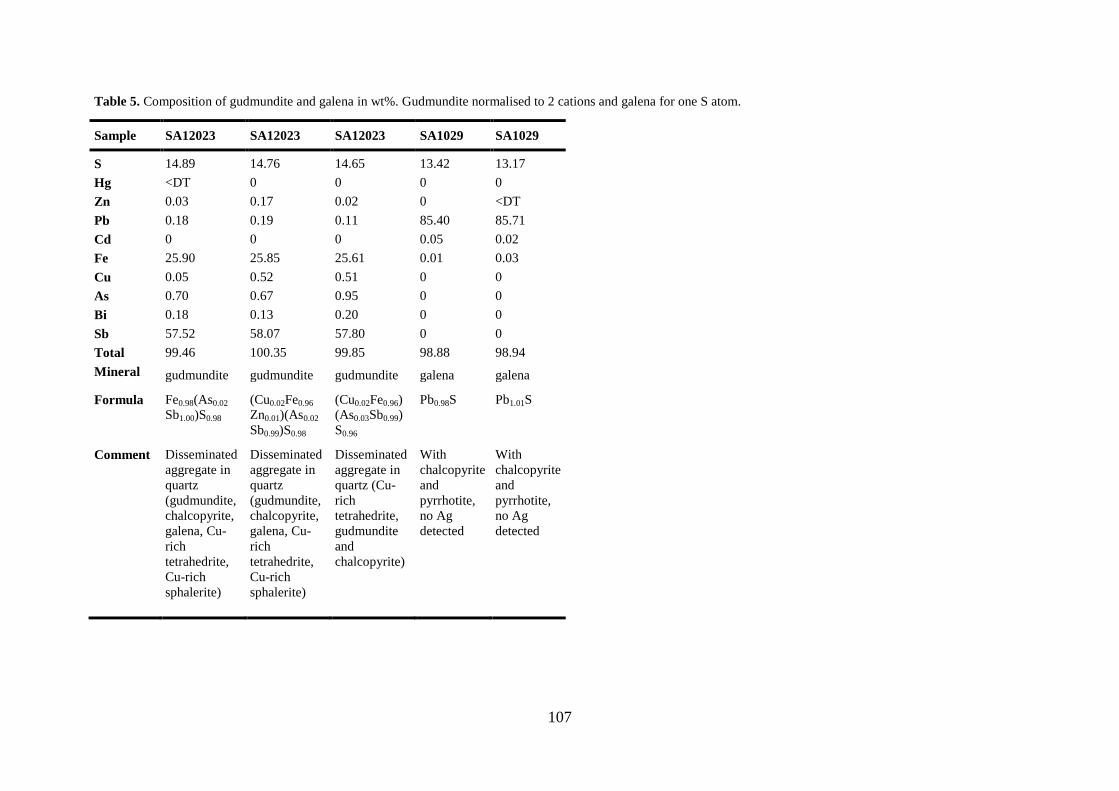
107
Table 5. Composition of gudmundite and galena in wt%. Gudmundite normalised to 2 cations and galena for one S atom.
Sample SA12023 SA12023 SA12023 SA1029 SA1029
S 14.89 14.76 14.65 13.42 13.17
Hg <DT 0 0 0 0
Zn 0.03 0.17 0.02 0 <DT
Pb 0.18 0.19 0.11 85.40 85.71
Cd 0 0 0 0.05 0.02
Fe 25.90 25.85 25.61 0.01 0.03
Cu 0.05 0.52 0.51 0 0
As 0.70 0.67 0.95 0 0
Bi 0.18 0.13 0.20 0 0
Sb 57.52 58.07 57.80 0 0
Total 99.46 100.35 99.85 98.88 98.94
Mineral gudmundite gudmundite gudmundite galena galena
Formula
Fe0.98(As0.02
Sb1.00)S0.98
(Cu0.02Fe0.96
Zn0.01)(As0.02
Sb0.99)S0.98
(Cu0.02Fe0.96)
(As0.03Sb0.99)
S0.96
Pb0.98S
Pb1.01S
Comment
Disseminated
aggregate in
quartz
(gudmundite,
chalcopyrite,
galena, Cu-
rich
tetrahedrite,
Cu-rich
sphalerite)
Disseminated
aggregate in
quartz
(gudmundite,
chalcopyrite,
galena, Cu-
rich
tetrahedrite,
Cu-rich
sphalerite)
Disseminated
aggregate in
quartz (Cu-
rich
tetrahedrite,
gudmundite
and
chalcopyrite)
With
chalcopyrite
and
pyrrhotite,
no Ag
detected
With
chalcopyrite
and
pyrrhotite,
no Ag
detected
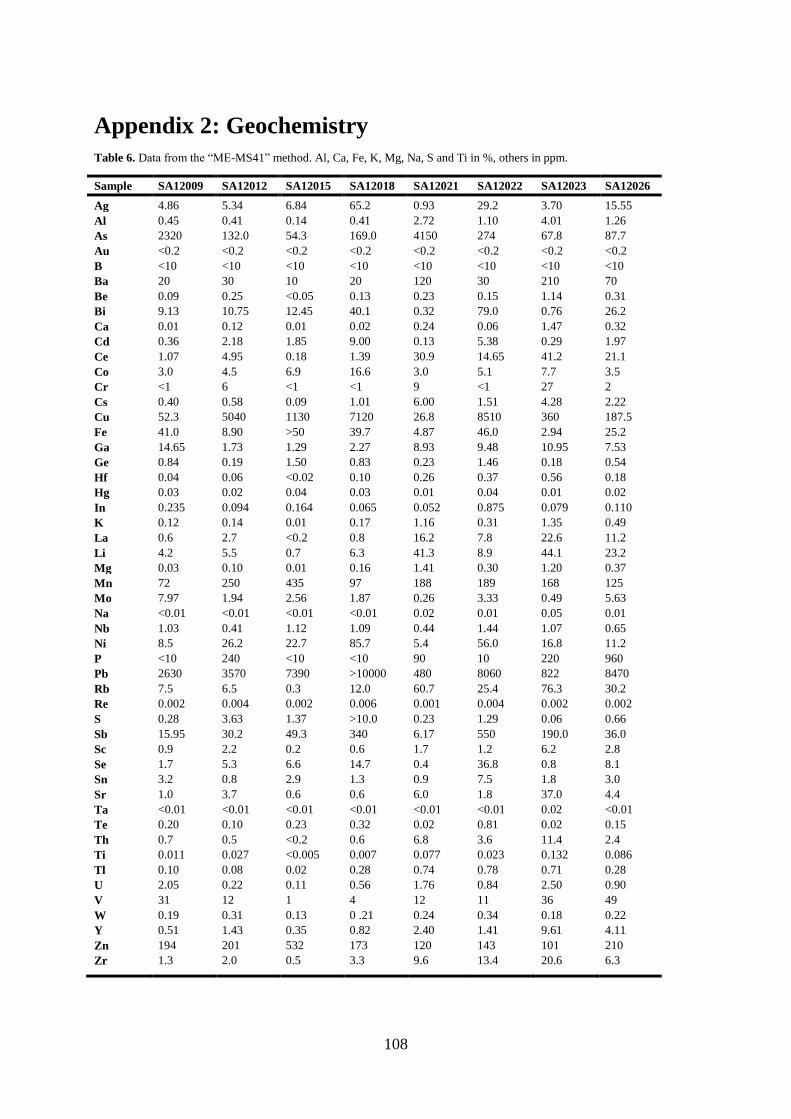
108
Appendix 2: Geochemistry
Table 6. Data from the “ME-MS41” method. Al, Ca, Fe, K, Mg, Na, S and Ti in %, others in ppm.
Sample SA12009 SA12012 SA12015 SA12018 SA12021 SA12022 SA12023 SA12026
Ag 4.86 5.34 6.84 65.2 0.93 29.2 3.70 15.55
Al 0.45 0.41 0.14 0.41 2.72 1.10 4.01 1.26
As 2320 132.0 54.3 169.0 4150 274 67.8 87.7
Au <0.2 <0.2 <0.2 <0.2 <0.2 <0.2 <0.2 <0.2
B <10 <10 <10 <10 <10 <10 <10 <10
Ba 20 30 10 20 120 30 210 70
Be 0.09 0.25 <0.05 0.13 0.23 0.15 1.14 0.31
Bi 9.13 10.75 12.45 40.1 0.32 79.0 0.76 26.2
Ca 0.01 0.12 0.01 0.02 0.24 0.06 1.47 0.32
Cd 0.36 2.18 1.85 9.00 0.13 5.38 0.29 1.97
Ce 1.07 4.95 0.18 1.39 30.9 14.65 41.2 21.1
Co 3.0 4.5 6.9 16.6 3.0 5.1 7.7 3.5
Cr <1 6 <1 <1 9 <1 27 2
Cs 0.40 0.58 0.09 1.01 6.00 1.51 4.28 2.22
Cu 52.3 5040 1130 7120 26.8 8510 360 187.5
Fe 41.0 8.90 >50 39.7 4.87 46.0 2.94 25.2
Ga 14.65 1.73 1.29 2.27 8.93 9.48 10.95 7.53
Ge 0.84 0.19 1.50 0.83 0.23 1.46 0.18 0.54
Hf 0.04 0.06 <0.02 0.10 0.26 0.37 0.56 0.18
Hg 0.03 0.02 0.04 0.03 0.01 0.04 0.01 0.02
In 0.235 0.094 0.164 0.065 0.052 0.875 0.079 0.110
K 0.12 0.14 0.01 0.17 1.16 0.31 1.35 0.49
La 0.6 2.7 <0.2 0.8 16.2 7.8 22.6 11.2
Li 4.2 5.5 0.7 6.3 41.3 8.9 44.1 23.2
Mg 0.03 0.10 0.01 0.16 1.41 0.30 1.20 0.37
Mn 72 250 435 97 188 189 168 125
Mo 7.97 1.94 2.56 1.87 0.26 3.33 0.49 5.63
Na <0.01 <0.01 <0.01 <0.01 0.02 0.01 0.05 0.01
Nb 1.03 0.41 1.12 1.09 0.44 1.44 1.07 0.65
Ni 8.5 26.2 22.7 85.7 5.4 56.0 16.8 11.2
P <10 240 <10 <10 90 10 220 960
Pb 2630 3570 7390 >10000 480 8060 822 8470
Rb 7.5 6.5 0.3 12.0 60.7 25.4 76.3 30.2
Re 0.002 0.004 0.002 0.006 0.001 0.004 0.002 0.002
S 0.28 3.63 1.37 >10.0 0.23 1.29 0.06 0.66
Sb 15.95 30.2 49.3 340 6.17 550 190.0 36.0
Sc 0.9 2.2 0.2 0.6 1.7 1.2 6.2 2.8
Se 1.7 5.3 6.6 14.7 0.4 36.8 0.8 8.1
Sn 3.2 0.8 2.9 1.3 0.9 7.5 1.8 3.0
Sr 1.0 3.7 0.6 0.6 6.0 1.8 37.0 4.4
Ta <0.01 <0.01 <0.01 <0.01 <0.01 <0.01 0.02 <0.01
Te 0.20 0.10 0.23 0.32 0.02 0.81 0.02 0.15
Th 0.7 0.5 <0.2 0.6 6.8 3.6 11.4 2.4
Ti 0.011 0.027 <0.005 0.007 0.077 0.023 0.132 0.086
Tl 0.10 0.08 0.02 0.28 0.74 0.78 0.71 0.28
U 2.05 0.22 0.11 0.56 1.76 0.84 2.50 0.90
V 31 12 1 4 12 11 36 49
W 0.19 0.31 0.13 0 .21 0.24 0.34 0.18 0.22
Y 0.51 1.43 0.35 0.82 2.40 1.41 9.61 4.11
Zn 194 201 532 173 120 143 101 210
Zr 1.3 2.0 0.5 3.3 9.6 13.4 20.6 6.3
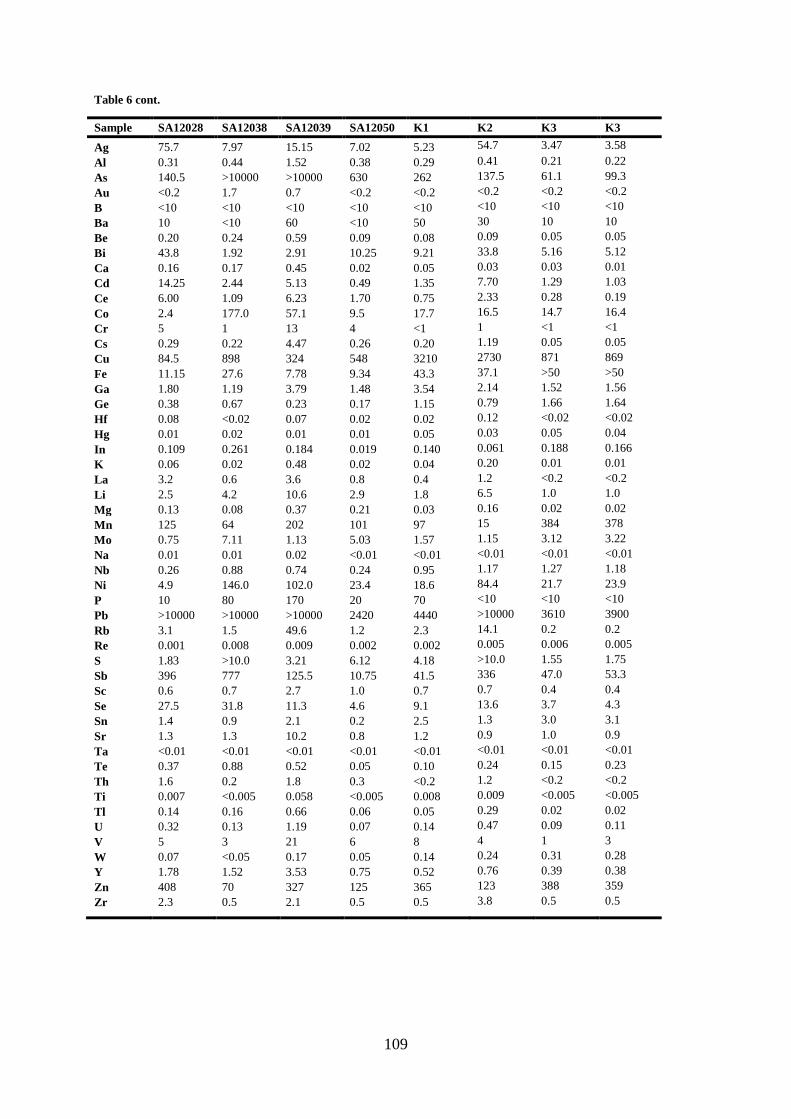
109
Table 6 cont.
Sample SA12028 SA12038 SA12039 SA12050 K1 K2 K3 K3
Ag 75.7 7.97 15.15 7.02 5.23 54.7 3.47 3.58
Al 0.31 0.44 1.52 0.38 0.29 0.41 0.21 0.22
As 140.5 >10000 >10000 630 262 137.5 61.1 99.3
Au <0.2 1.7 0.7 <0.2 <0.2 <0.2 <0.2 <0.2
B <10 <10 <10 <10 <10 <10 <10 <10
Ba 10 <10 60 <10 50 30 10 10
Be 0.20 0.24 0.59 0.09 0.08 0.09 0.05 0.05
Bi 43.8 1.92 2.91 10.25 9.21 33.8 5.16 5.12
Ca 0.16 0.17 0.45 0.02 0.05 0.03 0.03 0.01
Cd 14.25 2.44 5.13 0.49 1.35 7.70 1.29 1.03
Ce 6.00 1.09 6.23 1.70 0.75 2.33 0.28 0.19
Co 2.4 177.0 57.1 9.5 17.7 16.5 14.7 16.4
Cr 5 1 13 4 <1 1 <1 <1
Cs 0.29 0.22 4.47 0.26 0.20 1.19 0.05 0.05
Cu 84.5 898 324 548 3210 2730 871 869
Fe 11.15 27.6 7.78 9.34 43.3 37.1 >50 >50
Ga 1.80 1.19 3.79 1.48 3.54 2.14 1.52 1.56
Ge 0.38 0.67 0.23 0.17 1.15 0.79 1.66 1.64
Hf 0.08 <0.02 0.07 0.02 0.02 0.12 <0.02 <0.02
Hg 0.01 0.02 0.01 0.01 0.05 0.03 0.05 0.04
In 0.109 0.261 0.184 0.019 0.140 0.061 0.188 0.166
K 0.06 0.02 0.48 0.02 0.04 0.20 0.01 0.01
La 3.2 0.6 3.6 0.8 0.4 1.2 <0.2 <0.2
Li 2.5 4.2 10.6 2.9 1.8 6.5 1.0 1.0
Mg 0.13 0.08 0.37 0.21 0.03 0.16 0.02 0.02
Mn 125 64 202 101 97 15 384 378
Mo 0.75 7.11 1.13 5.03 1.57 1.15 3.12 3.22
Na 0.01 0.01 0.02 <0.01 <0.01 <0.01 <0.01 <0.01
Nb 0.26 0.88 0.74 0.24 0.95 1.17 1.27 1.18
Ni 4.9 146.0 102.0 23.4 18.6 84.4 21.7 23.9
P 10 80 170 20 70 <10 <10 <10
Pb >10000 >10000 >10000 2420 4440 >10000 3610 3900
Rb 3.1 1.5 49.6 1.2 2.3 14.1 0.2 0.2
Re 0.001 0.008 0.009 0.002 0.002 0.005 0.006 0.005
S 1.83 >10.0 3.21 6.12 4.18 >10.0 1.55 1.75
Sb 396 777 125.5 10.75 41.5 336 47.0 53.3
Sc 0.6 0.7 2.7 1.0 0.7 0.7 0.4 0.4
Se 27.5 31.8 11.3 4.6 9.1 13.6 3.7 4.3
Sn 1.4 0.9 2.1 0.2 2.5 1.3 3.0 3.1
Sr 1.3 1.3 10.2 0.8 1.2 0.9 1.0 0.9
Ta <0.01 <0.01 <0.01 <0.01 <0.01 <0.01 <0.01 <0.01
Te 0.37 0.88 0.52 0.05 0.10 0.24 0.15 0.23
Th 1.6 0.2 1.8 0.3 <0.2 1.2 <0.2 <0.2
Ti 0.007 <0.005 0.058 <0.005 0.008 0.009 <0.005 <0.005
Tl 0.14 0.16 0.66 0.06 0.05 0.29 0.02 0.02
U 0.32 0.13 1.19 0.07 0.14 0.47 0.09 0.11
V 5 3 21 6 8 4 1 3
W 0.07 <0.05 0.17 0.05 0.14 0.24 0.31 0.28
Y 1.78 1.52 3.53 0.75 0.52 0.76 0.39 0.38
Zn 408 70 327 125 365 123 388 359
Zr 2.3 0.5 2.1 0.5 0.5 3.8 0.5 0.5
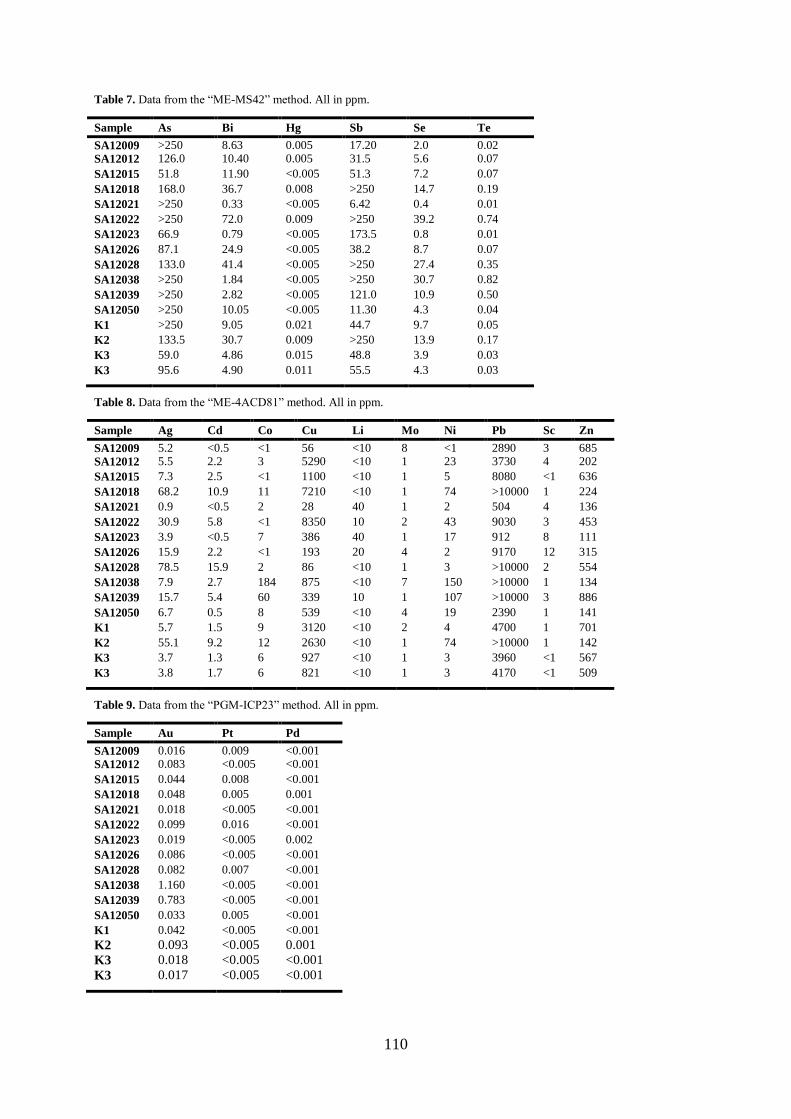
110
Table 7. Data from the “ME-MS42” method. All in ppm.
Sample As Bi Hg Sb Se Te
SA12009 >250 8.63 0.005 17.20 2.0 0.02
SA12012 126.0 10.40 0.005 31.5 5.6 0.07
SA12015 51.8 11.90 <0.005 51.3 7.2 0.07
SA12018 168.0 36.7 0.008 >250 14.7 0.19
SA12021 >250 0.33 <0.005 6.42 0.4 0.01
SA12022 >250 72.0 0.009 >250 39.2 0.74
SA12023 66.9 0.79 <0.005 173.5 0.8 0.01
SA12026 87.1 24.9 <0.005 38.2 8.7 0.07
SA12028 133.0 41.4 <0.005 >250 27.4 0.35
SA12038 >250 1.84 <0.005 >250 30.7 0.82
SA12039 >250 2.82 <0.005 121.0 10.9 0.50
SA12050 >250 10.05 <0.005 11.30 4.3 0.04
K1 >250 9.05 0.021 44.7 9.7 0.05
K2 133.5 30.7 0.009 >250 13.9 0.17
K3 59.0 4.86 0.015 48.8 3.9 0.03
K3 95.6 4.90 0.011 55.5 4.3 0.03
Table 8. Data from the “ME-4ACD81” method. All in ppm.
Sample Ag Cd Co Cu Li Mo Ni Pb Sc Zn
SA12009 5.2 <0.5 <1 56 <10 8 <1 2890 3 685
SA12012 5.5 2.2 3 5290 <10 1 23 3730 4 202
SA12015 7.3 2.5 <1 1100 <10 1 5 8080 <1 636
SA12018 68.2 10.9 11 7210 <10 1 74 >10000 1 224
SA12021 0.9 <0.5 2 28 40 1 2 504 4 136
SA12022 30.9 5.8 <1 8350 10 2 43 9030 3 453
SA12023 3.9 <0.5 7 386 40 1 17 912 8 111
SA12026 15.9 2.2 <1 193 20 4 2 9170 12 315
SA12028 78.5 15.9 2 86 <10 1 3 >10000 2 554
SA12038 7.9 2.7 184 875 <10 7 150 >10000 1 134
SA12039 15.7 5.4 60 339 10 1 107 >10000 3 886
SA12050 6.7 0.5 8 539 <10 4 19 2390 1 141
K1 5.7 1.5 9 3120 <10 2 4 4700 1 701
K2 55.1 9.2 12 2630 <10 1 74 >10000 1 142
K3 3.7 1.3 6 927 <10 1 3 3960 <1 567
K3 3.8 1.7 6 821 <10 1 3 4170 <1 509
Table 9. Data from the “PGM-ICP23” method. All in ppm.
Sample Au Pt Pd
SA12009 0.016 0.009 <0.001
SA12012 0.083 <0.005 <0.001
SA12015 0.044 0.008 <0.001
SA12018 0.048 0.005 0.001
SA12021 0.018 <0.005 <0.001
SA12022 0.099 0.016 <0.001
SA12023 0.019 <0.005 0.002
SA12026 0.086 <0.005 <0.001
SA12028 0.082 0.007 <0.001
SA12038 1.160 <0.005 <0.001
SA12039 0.783 <0.005 <0.001
SA12050 0.033 0.005 <0.001
K1 0.042 <0.005 <0.001
K2 0.093 <0.005 0.001
K3 0.018 <0.005 <0.001
K3 0.017 <0.005 <0.001
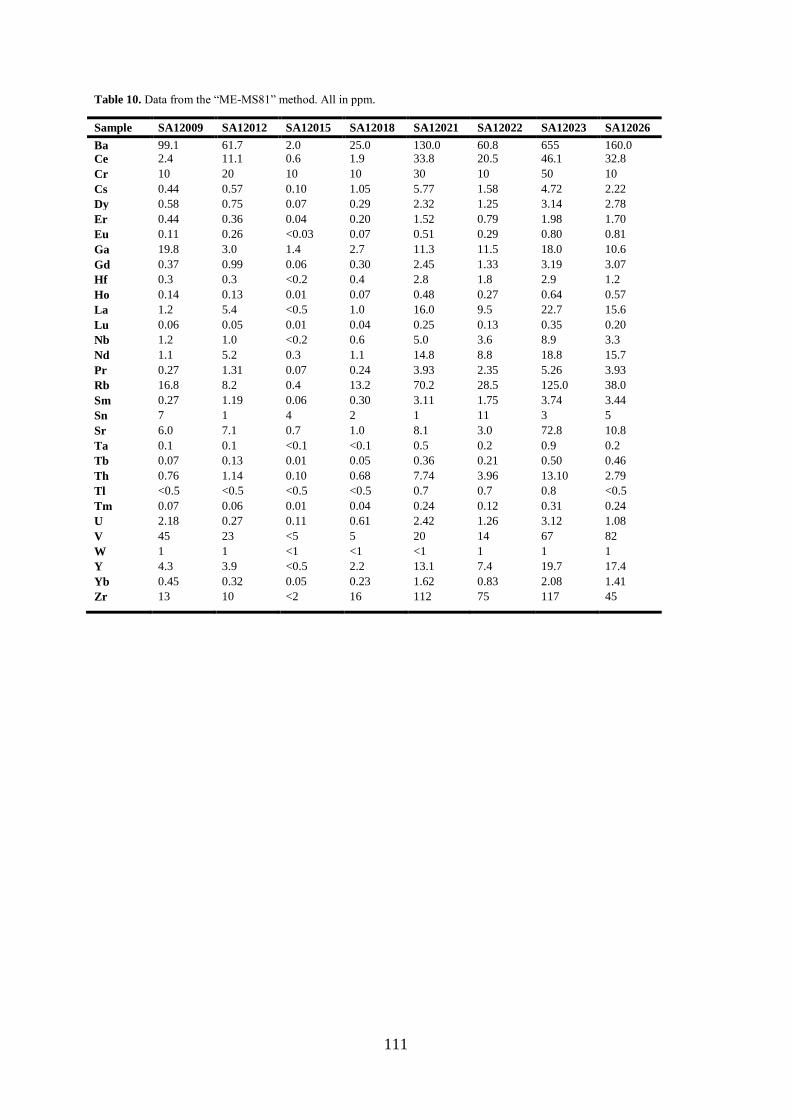
111
Table 10. Data from the “ME-MS81” method. All in ppm.
Sample SA12009 SA12012 SA12015 SA12018 SA12021 SA12022 SA12023 SA12026
Ba 99.1 61.7 2.0 25.0 130.0 60.8 655 160.0
Ce 2.4 11.1 0.6 1.9 33.8 20.5 46.1 32.8
Cr 10 20 10 10 30 10 50 10
Cs 0.44 0.57 0.10 1.05 5.77 1.58 4.72 2.22
Dy 0.58 0.75 0.07 0.29 2.32 1.25 3.14 2.78
Er 0.44 0.36 0.04 0.20 1.52 0.79 1.98 1.70
Eu 0.11 0.26 <0.03 0.07 0.51 0.29 0.80 0.81
Ga 19.8 3.0 1.4 2.7 11.3 11.5 18.0 10.6
Gd 0.37 0.99 0.06 0.30 2.45 1.33 3.19 3.07
Hf 0.3 0.3 <0.2 0.4 2.8 1.8 2.9 1.2
Ho 0.14 0.13 0.01 0.07 0.48 0.27 0.64 0.57
La 1.2 5.4 <0.5 1.0 16.0 9.5 22.7 15.6
Lu 0.06 0.05 0.01 0.04 0.25 0.13 0.35 0.20
Nb 1.2 1.0 <0.2 0.6 5.0 3.6 8.9 3.3
Nd 1.1 5.2 0.3 1.1 14.8 8.8 18.8 15.7
Pr 0.27 1.31 0.07 0.24 3.93 2.35 5.26 3.93
Rb 16.8 8.2 0.4 13.2 70.2 28.5 125.0 38.0
Sm 0.27 1.19 0.06 0.30 3.11 1.75 3.74 3.44
Sn 7 1 4 2 1 11 3 5
Sr 6.0 7.1 0.7 1.0 8.1 3.0 72.8 10.8
Ta 0.1 0.1 <0.1 <0.1 0.5 0.2 0.9 0.2
Tb 0.07 0.13 0.01 0.05 0.36 0.21 0.50 0.46
Th 0.76 1.14 0.10 0.68 7.74 3.96 13.10 2.79
Tl <0.5 <0.5 <0.5 <0.5 0.7 0.7 0.8 <0.5
Tm 0.07 0.06 0.01 0.04 0.24 0.12 0.31 0.24
U 2.18 0.27 0.11 0.61 2.42 1.26 3.12 1.08
V 45 23 <5 5 20 14 67 82
W 1 1 <1 <1 <1 1 1 1
Y 4.3 3.9 <0.5 2.2 13.1 7.4 19.7 17.4
Yb 0.45 0.32 0.05 0.23 1.62 0.83 2.08 1.41
Zr 13 10 <2 16 112 75 117 45
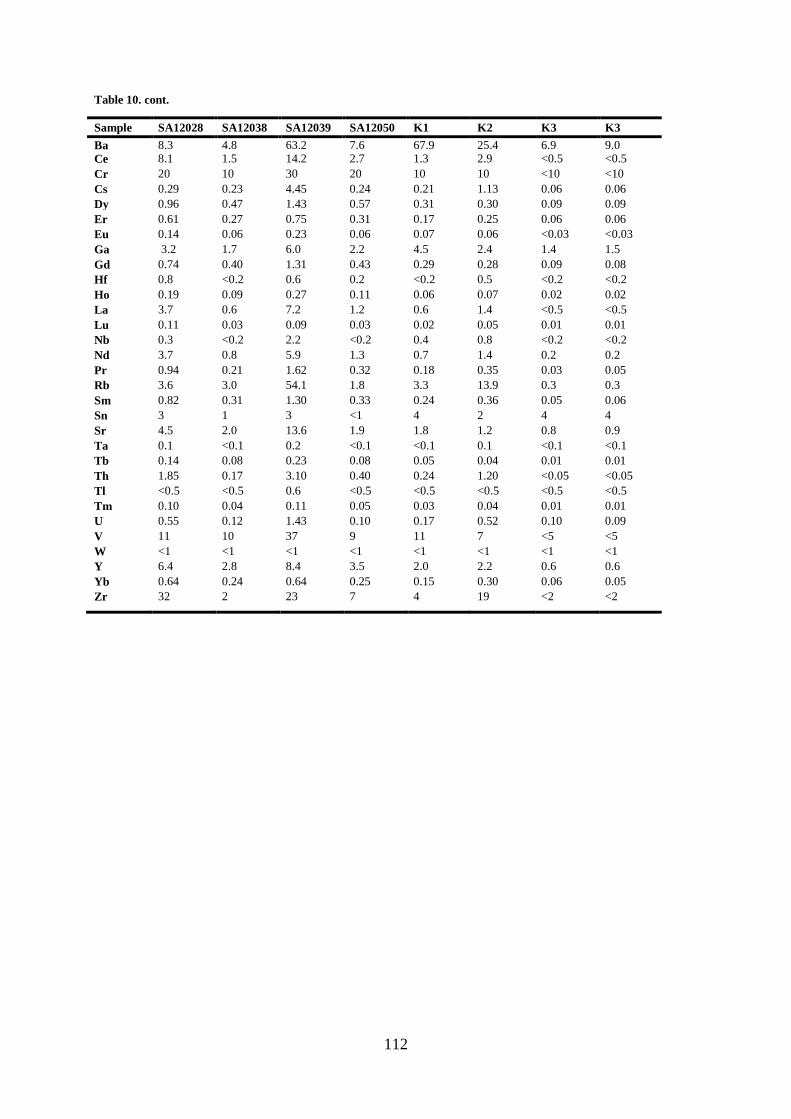
112
Table 10. cont.
Sample SA12028 SA12038 SA12039 SA12050 K1 K2 K3 K3
Ba 8.3 4.8 63.2 7.6 67.9 25.4 6.9 9.0
Ce 8.1 1.5 14.2 2.7 1.3 2.9 <0.5 <0.5
Cr 20 10 30 20 10 10 <10 <10
Cs 0.29 0.23 4.45 0.24 0.21 1.13 0.06 0.06
Dy 0.96 0.47 1.43 0.57 0.31 0.30 0.09 0.09
Er 0.61 0.27 0.75 0.31 0.17 0.25 0.06 0.06
Eu 0.14 0.06 0.23 0.06 0.07 0.06 <0.03 <0.03
Ga 3.2 1.7 6.0 2.2 4.5 2.4 1.4 1.5
Gd 0.74 0.40 1.31 0.43 0.29 0.28 0.09 0.08
Hf 0.8 <0.2 0.6 0.2 <0.2 0.5 <0.2 <0.2
Ho 0.19 0.09 0.27 0.11 0.06 0.07 0.02 0.02
La 3.7 0.6 7.2 1.2 0.6 1.4 <0.5 <0.5
Lu 0.11 0.03 0.09 0.03 0.02 0.05 0.01 0.01
Nb 0.3 <0.2 2.2 <0.2 0.4 0.8 <0.2 <0.2
Nd 3.7 0.8 5.9 1.3 0.7 1.4 0.2 0.2
Pr 0.94 0.21 1.62 0.32 0.18 0.35 0.03 0.05
Rb 3.6 3.0 54.1 1.8 3.3 13.9 0.3 0.3
Sm 0.82 0.31 1.30 0.33 0.24 0.36 0.05 0.06
Sn 3 1 3 <1 4 2 4 4
Sr 4.5 2.0 13.6 1.9 1.8 1.2 0.8 0.9
Ta 0.1 <0.1 0.2 <0.1 <0.1 0.1 <0.1 <0.1
Tb 0.14 0.08 0.23 0.08 0.05 0.04 0.01 0.01
Th 1.85 0.17 3.10 0.40 0.24 1.20 <0.05 <0.05
Tl <0.5 <0.5 0.6 <0.5 <0.5 <0.5 <0.5 <0.5
Tm 0.10 0.04 0.11 0.05 0.03 0.04 0.01 0.01
U 0.55 0.12 1.43 0.10 0.17 0.52 0.10 0.09
V 11 10 37 9 11 7 <5 <5
W <1 <1 <1 <1 <1 <1 <1 <1
Y 6.4 2.8 8.4 3.5 2.0 2.2 0.6 0.6
Yb 0.64 0.24 0.64 0.25 0.15 0.30 0.06 0.05
Zr 32 2 23 7 4 19 <2 <2
Tidigare utgivna publikationer i serien ISSN 1650-6553 Nr 1 Geomorphological mapping and hazard assessment of alpine areas in Vorarlberg, Austria, Marcus Gustavsson Nr 2 Verification of the Turbulence Index used at SMHI, Stefan Bergman Nr 3 Forecasting the next day’s maximum and minimum temperature in Vancouver, Canada by using artificial neural network models, Magnus Nilsson
Nr 4 The tectonic history of the Skyttorp-Vattholma fault zone, south-central Sweden, Anna Victoria Engström Nr 5 Investigation on Surface energy fluxes and their relationship to synoptic weather patterns on Storglaciären, northern Sweden, Yvonne Kramer Nr 272 Afrikas klimat med fokus på Västafrika, Eric Sönnert, January 2014 Nr 273 Shear-Wave Splitting Observed in Local Earthquake Data on the Reykjanes Peninsula, SW Iceland. Darina Buhcheva, February 2014 Nr 274 Unravelling Temporal Geochemical Changes in the Miocene Mogan and Fataga group ignimbrite succession on Gran Canaria, Canary Islands, Spain. Peter A. Nicholls, February 2014 Nr 275 Time Lapse VSP Monitoring of Small scale Injected CO2 in the Frio Formation, Texas, USA. Ershad Gholamrezaie, February 2014 Nr 276 A 2D Electrical Resistivity Survey of Palsas in Tavvavuoma, sub-arctic Sweden. Per Marklund, Mars 2014
Nr 277 Metamorphic Evolution of the Middle Seve Nappe in the Snasahögarna area, Scandinavian Caledonides. Åke Rosén, Mars 2014
Nr 278 Analogue Modelling of Ductile Deformation at Competent Lenses in Grängesberg, Bergslagen, Sweden. Sara Eklöf, Mars 2014
Nr 279 Stable Isotope Systematics of Skarn-hosted REE-silicate - Magnetite Mineralisations in Central Bergslagen, Sweden. Fredrik Sahlström, Mars 2014
Nr 280 Analys av växthusgasflöden och omgivningens påverkan på turbulens vid Erssjön – en typisk svensk skogssjö. Nitzan Cohen, Mars 2014
Nr 281 A Study of the Short-term Variability of Seawater pCO2 near Östergarnsholm.
Jennie Persson Söderman, Mars 2014
Nr 282 Prediction of the Start of the Rainy Season in West Africa. Eric Sönnert, Mars 2014
Nr 283 NAO Index: An Extreme Pressure Approach. Patrik Boström, April 2014