
Steamships Trading Company Limited For personal use only · 2013. 8. 30. · Freight Insurance ......
14
Appendix 4D Half yearly report Appendix 4D Page 1 Rules 4.2A Appendix 4D Half yearly results Name of entity Steamships Trading Company Limited ARBN Half year/financial year ended (‘current period’) 055836952 30 June 2013 Results for announcement to the market K'000 Revenues from continuing operations Up/Down 4.2% T 460,867 Profit (loss) from continuing operations after tax Up/Down 96.8% T 2,560 Profit (loss) attributable to members Up/Down 57.1% T 30,733 Dividends (distributions) Amount per security Franked amount per security Final Dividend – 2012 170t 0t Interim Dividend – 2013 50t 0t + Record date for determining entitlements to the dividend, 13 September 2013 Refer Page 9 & 10 for commentary This report is to be read in conjunction with the most recent annual financial report. For personal use only
Transcript of Steamships Trading Company Limited For personal use only · 2013. 8. 30. · Freight Insurance ......

Appendix 4D Half yearly report
Appendix 4D Page 1
Rules 4.2A
Appendix 4D
Half yearly results
Name of entity
Steamships Trading Company Limited ARBN Half year/financial year ended (‘current period’)
055836952
30 June 2013
Results for announcement to the market K'000
Revenues from continuing operations
Up/Down 4.2% T 460,867
Profit (loss) from continuing operations after tax
Up/Down 96.8% T 2,560
Profit (loss) attributable to members Up/Down 57.1% T 30,733
Dividends (distributions) Amount per security Franked amount per security
Final Dividend – 2012
170t 0t
Interim Dividend – 2013
50t
0t
+Record date for determining entitlements to the dividend,
13 September 2013
Refer Page 9 & 10 for commentary
This report is to be read in conjunction with the most recent annual financial report.
For
per
sona
l use
onl
y
Appendix 4D Half yearly report
Appendix 4D Page 2
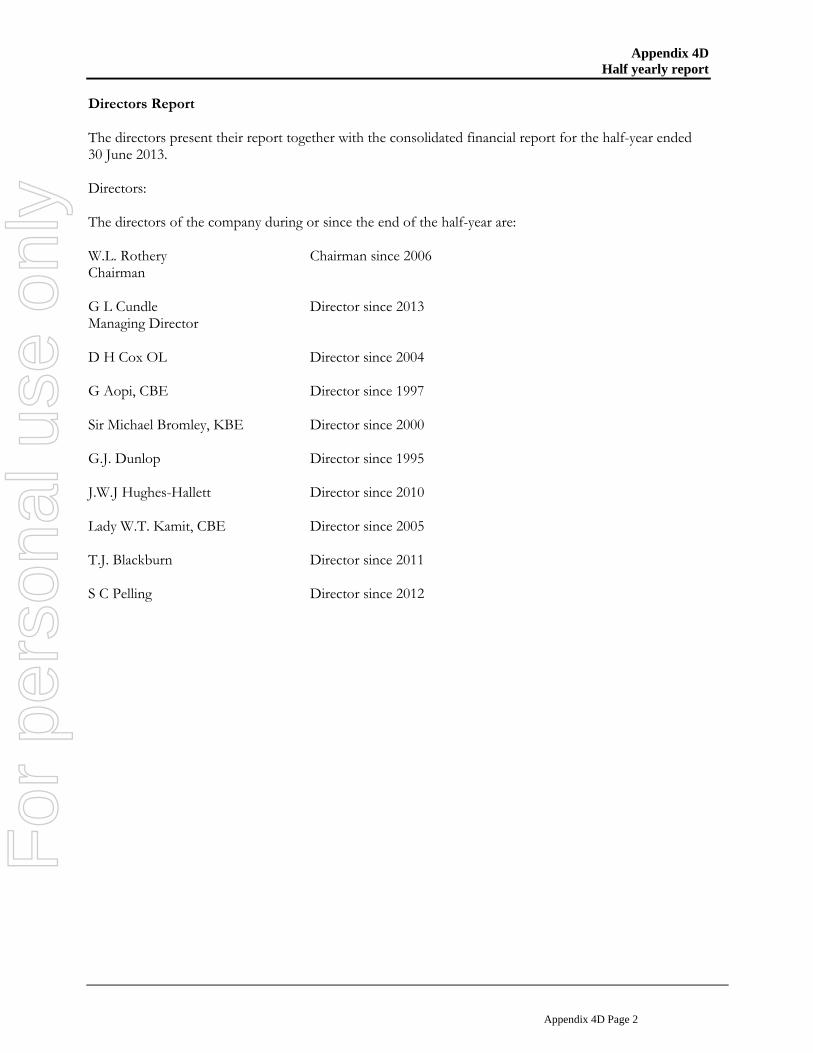
Directors Report The directors present their report together with the consolidated financial report for the half-year ended 30 June 2013. Directors: The directors of the company during or since the end of the half-year are: W.L. Rothery Chairman since 2006 Chairman G L Cundle Director since 2013 Managing Director D H Cox OL Director since 2004 G Aopi, CBE Director since 1997 Sir Michael Bromley, KBE Director since 2000 G.J. Dunlop Director since 1995 J.W.J Hughes-Hallett Director since 2010 Lady W.T. Kamit, CBE Director since 2005 T.J. Blackburn Director since 2011 S C Pelling Director since 2012
For
per
sona
l use
onl
y

Appendix 4D Half yearly report
Appendix 4D Page 3
Statement of comprehensive income For the 6 months ended 30 June 2013
6 months ended 30 June 2013
K'000
6 months ended 30 June 2012
K'000 Revenue Revenue from Continuing Operations Other income
460,867
709
481,009
7,967
Operating expenses Raw materials and consumables used Staff costs Depreciation & amortisation Impairment of ships Finance costs Freight Insurance Repairs & maintenance Occupancy costs Fuel Marketing Charter & port expenses Telecommunications Stevedoring expenses Other operating expenses
(78,166) (93,749) (52,967) (92,432) (15,238) (4,965)
(11,877) (17,571) (19,288) (24,814) (4,047) (7,693)
(10,795) (9,514)
(24,291)
(85,700) (90,795) (48,258)
- (14,916) (4,242)
(10,685) (16,357) (19,148) (25,536) (3,998)
(12,031) (10,031) (11,215) (31,501)
Share of net profit of associates accounted for using the equity method
6,400
6,872
Profit from continuing operations before income tax
569 111,435
Income tax expense
1,991
(30,828)
Profit for the six-month period
2,560 80,607
Other comprehensive income 0 0 Total comprehensive income for the six-month period
2,560
80,607
Profit/total comprehensive income is attributable to:
Owners of Steamships Trading Company Limited 30,733 71,711 Minority Interest (28,173) 8,896 2,560 80,607
Earnings per security (EPS) Basic EPS
Diluted EPS
99.1
99.1
231.3
231.3
For
per
sona
l use
onl
y

Appendix 4D Half yearly report
Appendix 4D Page 4
STATEMENT OF CHANGES IN EQUITY FOR THE PERIOD ENDED 30 JUNE 2013
Attributable to owners of Steamships Trading Company Limited
Contributed Retained Minority TotalEquity Reserves Earnings Total Interest Equity K’000 K’000 K’000 K’000 K’000 K’000
BALANCE AT 1 JANUARY 2012 24,200 0 554,349 578,549 75,365 653,914
Profit for the period 0 0 71,711 71,711 8,896 80,607
Other comprehensive income 0 0 0 0 0 0
Dividends provided for or paid 0 0 (43,412) (43,412) (3,354) (46,766)
Balance at 30 June 2012 24,200 0 582,648 606,848 80,907 687,755
Profit for the period 0 0 105,989 105,989 11,752 117,741
Other comprehensive income 0 0 0 0 0 0
Dividends provided for or paid 0 0 (35,659) (35,659) (8,337) (43,996)
Balance at 31 December 2012 24,200 0 652,978 677,178 84,322 761,500
Profit for the period 0 0 30,733 30,733 (28,173) 2,560
Other comprehensive income 0 0 0 0 0 0
Dividends provided for or paid 0 0 (52,714) (52,714) (2,976) (55,690)
Balance at 30 June 2013 24,200 0 630,997 655,197 53,173 708,370
For
per
sona
l use
onl
y

Appendix 4D Half yearly report
Appendix 4D Page 5
STATEMENT OF FINANCIAL POSITION - CONSOLIDATED
Current assets
As at 30 June 2013
K’000
As at 31 Dec 2012
K'000
As at 30 June 2012
K’000
Inventories 65,100 68,381 57,386 Receivables & prepayments 172,385 242,553 198,555Asset held for sale 9,633 8,426 -Loans to associates & joint ventures 74,778 50,745 29,324Cash, bank and short term deposits 14,593 21,508 1,881Other – financial asset 20,307 20,307 45,107Total current assets 356,796 411,920 332,253
Non-current assets
Investments 42,164 38,687 33,987Goodwill 26,183 17,183 17,183Property, plant and equipment 986,880 1,023,861 968,985Total non-current assets 1,055,227 1,079,731 1,020,155
Total assets 1,412,023 1,491,651 1,352,408
Current liabilities
Trade payables 50,763 74,098 53,133Other payables & accruals 93,143 74,909 91,230Provisions 12,197 12,658 20,268Loans from associates & joint ventures 19,072 14,314 8,122Loans from shareholder 15,160 16,133 10,160Borrowings 32,457 144,381 40,763Income tax payable 26,519 33,903 43,051Total current liabilities 249,311 370,396 266,727
Non-current liabilities
Deferred tax liability 6,578 32,898 11,806Borrowings 437,330 316,872 376,286Long service leave 10,434 9,985 9,834Total non-current liabilities 454,342 359,755 397,926Total liabilities 703,653 730,151 664,653Net assets 708,370 761,500 687,755Share capital and reserves Issued capital 24,200 24,200 24,200Retained earnings 615,493 600,264 546,989Proposed dividend 15,504 52,714 35,659Capital and reserves attributable to the company’s shareholders
655,197 677,178 606,848
Minority shareholders’ interest 53,173 84,322 80,907Total capital and reserves 708,370 761,500 687,755F
or p
erso
nal u
se o
nly

Appendix 4D Half yearly report
Appendix 4D Page 6
Consolidated statement of cash flows
6 months ended
30 June 2013 K'000
6 months ended
30 June 2012 K'000
Cash flows related to operating activities
Receipts from customers 480,251 480,437 Payments to suppliers and employees (307,818) (306,823) Interest and other items of similar nature received 36 86 Interest and other costs of finance paid (15,274) (15,002) Income taxes paid (31,713) (37,166) Net operating cash flows 125,482
121,532
Cash flows related to investing activities
Payment for purchases of property, plant and equipment (110,065) (79,970) Proceeds from sale of property, plant and equipment 51,149 1,505 Acquisition of business (9,000) - Dividends received from associates 2,923 1,330 Loans paid to other entities (20,248) (27,417) Net investing cash flows (85,241)
(104,552)
Cash flows related to financing activities
Proceeds from borrowings 40,000 120,000 Repayment of borrowings (23,142) (76,252) Dividends paid (55,690) (46,766) Net financing cash flows (38,832)
(3,018)
Net increase in cash held 1,409 13,962 Cash at beginning of period
(15,673) (47,044)
Cash at end of period (see reconciliation of cash)
(14,264)
(33,082)
Reconciliation of cash
Reconciliation of cash at the end of the period (as shown in the consolidated statement of cash flows) to the related items in the accounts is as follows.
Current period K'000
Previous corresponding
period K'000
Cash on hand and at bank 14,593
1,881
Bank overdraft (28,857)
(34,963)
Total cash at end of period (14,264)
(33,082)
For
per
sona
l use
onl
y

Appendix 4D Half yearly report
Appendix 4D Page 7
Other notes to the consolidated financial statements Ratios Current period
Previous
corresponding Period
Profit before tax / revenue Consolidated profit (loss) from ordinary activities before tax as a percentage of revenue
0.1%
23.2%
Profit after tax / equity interests Consolidated net profit (loss) from ordinary activities after tax attributable to members as a percentage of equity (similarly attributable) at the end of the period
4.7%
11.8%
Earnings per security (EPS)
Calculation of the following in accordance with IAS33: Earnings per Share (a) Basic EPS
(b) Diluted EPS
(c) Weighted average number of ordinary shares outstanding during the period used in the calculation of the Basic EPS
99.1t
99.1t
31,008,237
231.3t
231.3t
31,008,237
NTA backing
Net tangible asset backing per ordinary security
K22.00
K21.63
For
per
sona
l use
onl
y

Appendix 4D Half yearly report
Appendix 4D Page 8
Material interests in entities which are not controlled entities
Name of entity Percentage of ownership interest held at end of period
or date of disposal
Contribution to net profit (loss)
Equity accounted associates and joint venture entities
Current period
Previous
corresponding period
Current period - K'000
Previous
corresponding period- K'000
Colgate Palmolive Ltd Pacific Towing Ltd United Stevedoring Riback Stevedores Makerio Stevedoring Nikana Stevedoring Harbourside Development Limited
50 50 12 25 23 23 50
5050 12 25 23 23 50
8642,459
42,913
6793
-
2,199 2,181
4 2,213
162 113
-
Total
6,400
6,872
9. Details of entities over which control has been gained or lost during the period
Current Period Nil
Previous Corresponding Period Nil
10. Basis of Accounting This financial report has been prepared in accordance with International Financial Reporting Standards. There were no changes in significant accounting policies and these were consistently applied in the current half year.
For
per
sona
l use
onl
y

Appendix 4D Half yearly report
Appendix 4D Page 9
Half year Report to the Stock Exchange The Directors of Steamships Trading Company Limited (Steamships) advise an unaudited profit after tax and minority interests of K30.7 million for the 6 months to June 2013, a decrease of K41.0 million over the same period in 2012. The half year result includes an impairment of certain of the groups shipping assets with a net impact to shareholders of K33.0m. Excluding this impairment the underlying profit attributable to shareholders was K63.7 million, an 11.2% decline on the prior year and in line with our announcement on the 21 May 2013 of softening conditions. The ship impairments have arisen as a result of a number of factors; falling international ship prices, a reassessment of useful economic lives down from 30 to 25 years in the pursuit of more efficient re-fleeting, and increased coastal shipping competition in the face of reduced cargo volumes in a cooling economy. Sales of K460.9 million represent a 4.2 per cent decrease on 2012 sales of K481.0million. Depreciation, before ship impairments, in 2013 was K53.0 million against K48.3million in 2012, while interest on borrowings was K15.2 million against K14.9 million in 2012. The group continues to be committed to capital investment programs with expenditure for the 6 months being K110.1 million against K79.9 million in 2012. Further the group’s net operating cash flow generation remained strong at K125.5m against K121.5 million in 2012. An interim dividend of 50 toea per share has been declared and will be paid on the 30th September 2013. Logistics The Logistics Division has experienced a weak first half of the year as lower agricultural commodity prices reduced disposable income for rural communities that led to depressed demand for consumable items and consequently a fall in land and sea cargo volumes. The projected wind-down of the construction phase of the PNG LNG project had an earlier than anticipated impact on cargo volumes stevedored in Port Moresby and Lae. The fall in mineral commodity prices had a dampening effect on exploration and project development activity which caused a reduction in chartering of project vessels. Competition on most shipping routes also continued to compress margins. East-West Transport’s activity for the first half was also down on 2012 due to reduced customs clearances, local haulage and warehousing caused by a fall in imports, especially of project cargoes. As forecast, the winding down of the PNG LNG construction phase has diverted haulage capacity onto the open market with a negative impact upon freight rates. A focus on cost efficiency and enhanced service levels to retain and attract customers remains a critical focus for this business. Property & Hotels Pacific Palms Property recorded stable year on year revenue with occupancy of industrial and commercial property remaining firm. New residential stock entering the Port Moresby premium market had a negative impact upon rental reversions but occupancies, while down on prior year, have been satisfactory reflecting the quality of the residential portfolio. Coral Sea Hotels had a satisfactory start to the year with improved year on year revenue due to the now established and more mature operations of the Grand Papua Hotel. Occupancy and average rates have declined as the year progressed due to a reduced number of business travellers and growing competition in the mid-market segment in Port Moresby and Lae. The Highlands hotels have been impacted by the slowing of the Highlands economy.
For
per
sona
l use
onl
y

Appendix 4D Half yearly report
Appendix 4D Page 10
Commercial Laga Industries had a disappointing first half with slower sales and higher stocks in trade impacting performance for the first quarter. Volumes for cooking oil sales were stable but pricing fell due to commodity pricing and severe competition from imports. Tradewinds premixed ready-to-drink beverages lost market share due to aggressive competitor pricing. Gala ice cream maintained its dominant market position but sales growth declined as the economy slowed. Datec experienced slowing retail sales as the half year progressed due to weaker consumer spending. Revenue growth for the Internet Service Provider (ISP) business was strong but margins fell due to competitive pressure. Corporate sales have been satisfactory but there are signs of budgetary constraints starting to impact the spending of government departments. Sustainability Steamships has maintained its efforts to improve measures of sustainable development. Despite a slowing economy, the focus will remain on implementing sustainability programmes that improve health and safety, minimise the environmental impact of its business activities and support the development of staff and communities where it operates. Economic outlook The expected moderation in economic growth during the interim period until PNG LNG revenues come on stream has been amplified by the external forces of weakening hard and soft commodity prices. This combination of negative factors has been partially ameliorated by the Government introducing a deficit budget to inject much needed stimulus in health, law and order, education and infrastructure spending. It is anticipated that the PNG economy will remain challenging for business for the balance of 2013 and no significant improvement in the underlying operating results is expected for most of Steamships’ businesses.
For
per
sona
l use
onl
y

Appendix 4D Half yearly report
Appendix 4D Page 11
Divisional Segments The group operates in the following commercial areas:
Hotels& Commercial Logistics Finance& Total
Property Division Investment
K'000 K'000 K'000 K'000 K'000
2013 External Revenue 128,303 110,256 222,214 94 460,867Intersegmental Revenue 19,312 704 7,140 - 27,156Interest Revenue - 36 - - 36Interest Expense (4) (4) (2,870) (12,396) (15,274)
Segment Results 113,048 (2,494) (73,356) (43,029)
(5,831)Add: Share of Associate Profit - 864 5,536 - 6,400Total Segment result 113,048 (1,630) (67,820) (43,029) 569
Income tax expense (33,914) 748 22,007 13,150 1,991
Group Profit 79,134 (882) (45,813) (29,879) 2,560
Segment assets 618,686 132,706 384,132 276,499 1,412,023Segment liabilities 13,948 24,822 101,917 562,966 703,653Net Assets 604,738 107,884 282,215 (286,467) 708,370
Capital expenditure 56,033 8,317 45,025 690 110,065Depreciation 19,822 4,259 28,100 786 52,967Impairment of ships - - 92,432 - 92,432
For
per
sona
l use
onl
y

Appendix 4D Half yearly report
Appendix 4D Page 12
Hotels& Commercial Logistics Finance& Total
Property Division Investment
K'000 K'000 K'000 K'000 K'000
2012 External Revenue 125,304 127,637 227,995 73 481,009IntersegmentalRevenue 17,921 908 9,902 0 28,731Interest Revenue - 36 34 16 86Interest Expense (2,070) (20) (2,796) (10,116) (15,002)
Segment Results 96,932 9,147 37,829 (39,345)
104,563Add: Share of Associate Profit - 2,199 4,673 - 6,872Total Segment result 96,932 11,346 42,502 (39,345) 111,435
Income tax expense (29,080) (2,744)
(11,349) 12,345
(30,828)
Group Profit 67,852 8,602 31,153 (27,000) 80,607
Segment assets 575,009 135,917 441,010 200,472 1,352,408Segment liabilities 4,864 29,456 161,676 468,657 664,653Net Assets 570,145 106,461 279,334 (268,185) 687,755
Capital expenditure 19,284 6,257 30,139 24,290 79,970Depreciation 21,159 3,564 22,825 710 48,258
For
per
sona
l use
onl
y

For
per
sona
l use
onl
y

For
per
sona
l use
onl
y


