Status of the Marine Aquarium Fishery in Galle and Matara ... · Arjan Rajasuriya 4 Results show...
50
10/22/2009 Status of the Marine Aquarium Fishery in Galle and Matara Districts CENARA Reports: Marine Aquarium Fishery, south coast 2009 Arjan Rajasuriya
Transcript of Status of the Marine Aquarium Fishery in Galle and Matara ... · Arjan Rajasuriya 4 Results show...

10/22/2009
Status of the Marine Aquarium Fishery in Galle and Matara Districts CENARA Reports: Marine Aquarium Fishery, south coast 2009
Arjan Rajasuriya
1
Status of the Marine Aquarium Fishery in Galle and Matara Districts
CENARA Reports: Marine Aquarium Fishery, south coast 2009
Contents
Executive Summary ……………………………………………………………………………… 3
Introduction ………………………………………………………………………………………… 7
Materials and Methods …………………………………………………………………………… 8
Survey Design …………………………………………………………………… 8
Field Sampling …………………………………………………………………… 10
Data analysis …………………………………………………………………………………… 11
Results …………………………………………………………………………………………… 11
Standing Stock Estimates………………………………………………………………………… 11
Abundance, MSY, TAC …………………….…………………………………………… 12
Status of reef habitats in the study area……………………………………………………………. 14
The aquarium fishery in Galle and Matara Districts ……………………………………… 15
Management issues ……………………………………………………………………………… 18
Discussion………………………………………………………………………………………….. 19
Management Recommendations ………………………………………………………………….. 23
Acknowledgements………………………………………………………………………………. 26
Photocredits ………………………………………………………………………………………… 26
References ……………………………………………………………………………………………………… 27

Arjan Rajasuriya
2
Appendix 1 Description & status of Reef Habitats ………………………………………………… 30
Appendix 2 Description of the Fishery …………………………………………………………… 33
Appendix 3 Regulations and Management ……………………………………................................ 34
Appendix 4 Abundance, MSY & TAC for Galle District ……………………………………… 35
Appendix 5 Abundance, MSY & TAC for Matara District ……………………………………… 40
Appendix 6 List of marine aquarium species used for sampling…………………………………… 45
Appendix 7 List of protected marine aquarium fish in F.A.R. Act 1996 ……………………….. 50
Appendix 8 List of marine fish ‘Restricted Export’ category in F.A.R. Act 1996 …………… 51

3
Executive Summary _______________________________________________________ The marine aquarium fishery in Sri Lanka has been in existence for more than 70 years (Wabnitz et al., 2003). Presently this fishery is carried out in all coastal areas of the country except in northern coastal waters. All indigenous species are wild caught from reef areas. The current value of the marine aquarium sector of the ornamental fish industry is estimated to be about US $ 4 to 5 million annually. Wood (1996) reported that about 250 species of fish and about 50 species of invertebrates are utilized by this industry. These numbers have increased in the recent past and at present about 330 species of fish and about 50 species of invertebrates are exported from Sri Lanka (De Alwis, 2007). Marine aquarium species are exported mainly to western countries. Three main operational components constitute the industry, namely fish collectors, suppliers and exporters. It is believed that about 100o fish collectors, both scuba divers and snorkelers are engaged in this fishery island-wide. About half of them live in the southern coast within Galle and Matara Districts. The number of individuals that are engaged as aquarium keepers, packers, boat operators, compressor operators etc. is yet to be determined. Habitat damage to coral reefs due to fish collecting and over collection of aquarium species have been attributed to this industry (Wood, 1985; 1996; Mee, 1993; Beets, 1994). Some of these studies created the misconception that the collection of aquarium fish is the main cause of coral reef damage in the country, while the habitat quality was affected by a combination of natural and many human impacts extraneous to the activities of the marine aquarium fishery. The government of Sri Lanka introduced regulations to protect several species under the Fauna and Flora Protection Ordinance (GOSL, 1993) and the Fisheries and Aquatic Resources Act (GOSL, 1996). Because of the large number of species used by the industry it requires to be managed on the basis of individual species or species groups taking into consideration their ecological requirements, abundance and the rate of harvesting. However, the management authorities lacked information on the above aspects. The primary goal of the studies on the marine aquarium fishery of the CENARA project is to obtain the necessary data for adaptive management of the fishery. The survey was conducted in March 2009 from Unawatuna in the Galle District to Polhena in the Matara District. Information derived from the coral reef monitoring studies of NARA (Rajasuriya and De Silva, 1988; Ohman, Rajasuriya and Svensson, 1998; Rajasuriya Ohman and Svensson, 1998; Rajasuriya, 2005) and reports from Wood (1985, 1996) were used to select the study area. The survey was designed using GIS and 150 sites were randomly selected within the two districts in a reef area of 61,768 square meters. Sampling was carried out by snorkeling and scuba diving. Data was collected using the Fish Belt Transect method to record the abundance of selected aquarium fish species and the Point Intercept Transect method to collect data on benthic cover and a two meter belt transect to record the abundance of large invertebrates. In addition, focused interviews were carried out with the primary stakeholders to obtain data on catch and effort and information about the fishery. A major difficulty was encountered in the collection of catch data as the collectors and suppliers were concerned about providing this information as they believed that the data will be used to ban the fishery or bring in various regulations and taxation. The CENARA Data Systems Standard operating procedures were used to enter and analyse data. Abundance and the maximum sustainable yield for a total of 66 species were calculated and the total allowable catch (TAC) was estimated with 90% upper and lower confidence intervals.
Arjan Rajasuriya
4
Results show that the shallow coral reef habitats were highly degraded with a live hard coral cover of 23% in the Galle District and 21% in the Matara District respectively. The percentage of coral rubble was very high in both districts with 21% in Galle District and 22% in the Matara District respectively. The main causative factors of reef degradation were identified as the 1998 coral bleaching event and the impact of the 2004 tsunami coupled with various other human activities including the marine aquarium fishery, pollution and sedimentation due to poor landuse practices. The degradation of the habitat and the continued extraction appear to have a negative impact on several species. Some of the highly sought after species by the aquarium trade are in relatively low abundance, particularly the Powder blue surgeonfish (Acanthurus leucosternon), Orangespine unicorn surgeonfish (Naso lituratus) and some butterflyfish species (Chaetodontidae). Importantly, none of the presently protected species of aquarium fish were recorded and only 5 species listed under the restricted export category were recorded. Holding facilities of some suppliers were not properly maintained with several species of fish kept together in relatively small containers and tanks. Stress and mortality can be avoided by improving these facilities with adequate space and by appropriate handling of the specimens. It was also observed that the collectors still use the banned ‘moxy’ net and that many snorkelers damage the little coral that is present on the fringing reefs. Only a few collectors had licenses and snorkelers in particular lacked the permits to fish. The main issues raised by the stakeholders were the increasing number of collectors leading to over-harvesting, some of the inexperienced collectors were causing habitat damage and the collection of large breeding sized individual specimens reduced the reproductive potential of the stocks. Problems related to the use of scuba in deep water are relatively low in the southern coast, nevertheless it is important to educate divers on this aspect. As the marine aquarium fishery is directly affected by the quality of the reef environment, the fishery has to be managed taking into consideration all other impacts on the marine habitats. Therefore management has to be addressed not only with the stakeholders of the aquarium industry but with other users and abusers of the marine environment and the local government authorities that is responsible for pollution management and issuing of permits for coastal development. The main issues and management opportunities are listed below.
Issues Recommendations & Management opportunities • The study revealed that some species that are
important for the industry are in low abundance as their TAC is very low. (Intense harvesting of these species may result in their populations falling below a recovery stage).
• Discuss with all stakeholders and inform them of the current status of these species, especially in the light of serious habitat degradation.
• Harvesting should be carried out cautiously adhering to the ‘precautionary principal’ when harvesting species with low stock sizes.
• None of the ‘Protected species’ were recorded • Retain the currently protected species in Part 1 of the schedule under the Fisheries and Aquatic Resources Act of 1996.
• Only 3 species listed in the ‘Restricted Export’ category was recorded indicating that many other species are also uncommon.
• Re-evaluate the status of these species with surveys conducted in the northwestern and eastern coastal waters.
• Consider the possibility of shifting very rare species listed in the ‘Restricted Export’ category to the ‘Protected species’ list whilst species that are not under threat of over-exploitation should be considered for de-listing. (This should be carried out with caution and by comparing the results of the

5
studies in the east and northwestern waters). • Collection of very small size classes of fish. (This is
harmful as small juveniles of many species do not survive in captivity).
• Discuss with the exporters and agree on minimum size classes.
• Collection of very large size classes of fish. (These size classes are classified as ‘extra-large’ and are collected to cater to special orders for public aquaria. This is harmful as breeders are caught and exported. They are difficult to pack and travel poorly. Some tend to die during transit from collecting sites).
• Discuss with the exporters. Discourage the export of breeders.
• Use of moxy nets and other fishing methods that cause habitat degradation.
• Removal of corals to collect Gobiodon citrinus • Over-exploitation of fish stocks • Spear fishing, especially groupers that maintain the
habitats of the scarlet shrimps (Lysmata debelius) and painted shrimps (L. amboinensis)
• Implement the existing regulations. Strengthen the monitoring systems for illegal and destructive fishing.
• Include Gobiodon citrinus in the list of protected species in order to prevent fish collectors from damaging the coral habitat.
• Discuss with exporters and collectors and establish a ‘code of conduct’ using best practices to prevent habitat damage due to collecting.
• The fish collectors should be educated on the role of the groupers in maintaining the habitats of the reef shrimps (Lysmata spp.) and also of the fact that spear fishing is banned in Sri Lanka under the Fauna and Flora Protection Ordinance.
• Inability to obtain catch data from the collectors and suppliers. (It is important to obtain catch data from different areas because species and abundance can vary depending on locations).
• Catch data can be obtained from the record books maintained by every supplier. To obtain this data it is necessary to establish a system through the network of fisheries inspectors. A logbook can be supplied by the DFAR to each Assistant Director in charge of the different districts where the catch can be entered.
• Lack of registration of fish collectors and their operational and gear licenses.
• Lack of registration of suppliers.
• The network of fisheries inspectors of the DFAR in each district can be used to register all fish collectors.
• All the suppliers should also be registered although most are not actively engaged in collecting specimens.
• The registration of the suppliers should be linked to the data collection system.
• Lack of suitable holding facilities and improper handling of specimens.
• Conduct awareness programmes for suppliers on the proper maintenance of holding facilities.
• Conduct awareness programmes for collectors and suppliers on the proper handling of specimens.
• Develop a set of guidelines and best practices for holding facilities, handling and packing of specimens.
• Habitat degradation due to natural causes such as coral bleaching, storms etc.
• Improve the protection of coral reefs to enhance their resilience to perturbations.
• Habitat damage and alteration due to human • Implement the existing regulations through the

Arjan Rajasuriya
6
activities such as destructive fishing, pollution etc. (Ecosystems recover from serious damage if they are resilient to perturbations and if chronic negative impacts are absent).
relevant government organizations to prevent the use of destructive fishing methods and illegal activities such as coral mining and illegal construction.
• Seek the assistance of the Coast Guard Department to eliminate destructive fishing such as blast fishing.
• Conduct awareness programmes for all stakeholders including the local government authorities to impress that the health of the costal waters and reef habitats is critically important and that pollution from the towns and cities as well as other industries need to be managed.
• Lack of fish refuges to support breeding populations.
• Identify reef patches that can be set aside as fish refuges. This has to be done together with the primary stakeholders and the responsibility of caring for such areas should be vested with the primary stakeholders through the fisheries management committees.
Introduction ___________________________________________________________________
The marine aquarium fishery has been in existence in Sri Lanka since the 1930’s (Wabnitz et al., 2003). The present value of the marine ornamental sector of the aquarium fish industry is believed to be about 40% -50% of the total

7
value of the ornamental fish sector which is about US $ 9 million annually. Marine aquarium fish are collected by snorkeling and scuba diving in western, southern and eastern coastal waters of Sri Lanka. Aquarium fish collecting is carried out in the non-monsoon periods when the sea is calm and clear. Some fish collecting was done around the islands of the Jaffna Peninsula prior to 1985, but due to the internal conflict this area became out of bounds and collecting activities has not commenced yet. The southern coastal reefs are an important source of aquarium species such as butterflyfish (chaetodontidae), angelfish (Pomacanthidae), wrasses (Labridae), gobies (Gobiidae), damselfish (Pomacentridae), groupers (Serranidae), blennies (Blennidae), surgeonfish (Acanthuridae) and many species of invertebrates including the scarlet shrimps (Lysmata debelius) and painted shrimps (L. amboinensis).
The fishery in the southern coast is conducted during the calm season from October to March. Aquarium species are collected by snorkeling among shallow inshore reefs and by scuba diving on offshore reefs to a depth of about 40m. Over the years an increase in the number of species and volume has been recorded. Wood (1996) reported that about 250 species of marine fish and about 50 species of invertebrates were exported in the 1990’s. In a recent study, De Alwis (2007) reported that about 343 species of reef fish and around 50 species of invertebrates are exported at present, but this number also includes species that are imported for re-export. The industry operates at three basic levels; namely, aquarium fish collectors, suppliers and exporters. Although a complete census of all the fish collectors have not been done, it is believed that there are about 1000 individuals engaged in this activity island wide. At present there are about 500 aquarium fish collectors in the southern coastal areas from Galle to Matara. The number of individuals employed as aquarium keepers, packers, boat operators, compressor operators etc. have not been determined. Habitat damage to coral reefs due to fish collecting and over collection of aquarium species have been attributed to this industry (Wood, 1985, 1996; Mee, 1993; Beets, 1994). The earliest comprehensive study of the marine aquarium fish industry in Sri Lanka was carried out by Wood (1985). Thereafter Mee (1993) and Beets (1994) followed with an overview of the industry. Wood (1996) published management needs for the industry in Sri Lanka, based on a study conducted with the National Aquatic Resources Research and Development Agency. All of these studies pointed out that there is a need to manage the marine aquarium fishery and recommended to establish a quota based management system for the industry and to establish no-take zones and to protect rare and vulnerable species.
The Department of Fisheries and Aquatic Resources is responsible for the management of the marine aquarium fishery. In addition the Department of Wildlife Conservation is responsible for the protection of rare and vulnerable species as well as the custodian of marine protected areas. Regulations were gazetted under the Fauna and Flora Protection Ordinance (GOSL, 1993) and the Fisheries and Aquatic Resources Act (GOSL, 1996) to protect and control the export of several species considered as rare and vulnerable to over-exploitation. Although there has been a need to manage the fishery there is a lack of information for the management of individual species. The abundance of species is directly affected by the changes that occur to habitats and fishing pressure as well as natural mortality. Hence management measures have to take into consideration the dynamism of the above aspects. The marine aquarium fishery study of the CENARA project is designed to obtain the required information for adaptive management of the fishery.
Materials and methods _____________________________________________________________________
Survey Design

Arjan Rajasuriya
8
Fringing reefs are common along the southern coast of Sri Lanka. They occur as a narrow belt of coral, sandstone/limestone and rock reef habitats (Swan, 1983; Rajasuriya and De Silva, 1988). The majority of these fringing reefs extend about 500m offshore. Beyond this area there are patches of rock and sandstone/limestone platform reefs. The selection of survey areas were based on studies carried out by by the coral reef monitoring programme of NARA (Rajasuriya and De Silva, 1988; Ohman, Rajasuriya and Svensson, 1998; Rajasuriya, Ohman and Svensson, 1998; and Rajasuriya, 2005) and reports from Wood (1985, 1996). As the majority of fish collecting is carried out in the inshore reefs the study area was restricted to the fringing reefs. Areas devoid of fringing reefs were excluded from the survey area. The survey area was dived into 4 sections; from Unawatuna to Habaraduwa (section A), from Midigama to Weligama (section B), Mirissa (section C) and from Bandaramulla to Polhena (section D) (Fig. 1). The fringing reefs were further divided into two depth classes based on reef zonation. In the majority of these fringing reefs the back reef, reef crest and the upper reef slope extend from the shore to a distance of about 300m and the depth varied from 1 to 3m. The seaward reef slope extended approximately another 200m to a depth of about 10m. The survey was designed using GIS. The estimated total reef area in the Galle District was 28,445 square meters and 33,323 square meters in the Matara District. Using GIS, 150 randomly distributed sites were generated within the reef areas in Galle and Matara Districts. There were 73 and 77 sites in the Galle and Matara Districts respectively (Fig. 2).
Figure 1. Survey area from Unawatuna in Galle District to Polhena in the Matara District

9
Figure 2. Survey sites (sampling points) in Galle and Matara Districts.
Field sampling The survey was carried out in March 2009. Each site was surveyed to collect three sets of data on the substrate, aquarium fish and megabenthos (large invertebrates). In addition site details such as depth, location on the reef, sampling time, current intensity and weather were recorded. Reef substrate was sampled using the Point Intercept Transect method (PIT) along a 50m tape laid on the reef. Substrate was recorded at 75 points along the 50m transect by dividing the transect into three 10m sections and by recording the substrate at 25 points in each section along the first, third and fourth sections of the transect (modified from English et al., 1997). Large invertebrates (Megabenthos) such as starfish, lobsters, large molluscs occurring within 1m on either side of the 50m long transect were also recorded. Marine aquarium fish were recorded using the fish belt transect method (English et al., 1997) along the 50m transect used for the PIT covering an area of 250 square meters (2.5m on either side of the 50m tape).
A pair of divers collected data at each site. One diver collected substrate and megabenthos data while the other recorded the abundance of aquarium fish along the transect. Thirty minutes were allocated to complete each fish belt transect in order to standardize the time spent to record fish at each site. Two pairs of divers collected data at two sites simultaneously. Data was recorded on underwater slates and transferred to MS Excel data entry workbooks.
Species that are currently protected and exported under permits were given special consideration in the study (appendices 7 & 8). Their presence was noted even if they occurred outside the fish belt transect. Cryptic species such as gobies, blennies and some species that live in caves and ledges were recorded, however, their abundance may be affected by their cryptic behaviour. Similarly reef shrimps (Lysmata debelius and L. amboinensis) were not sampled in this study because they are highly cryptic and live in holes in the reef structures at a depth of 25 to 30m.
Arjan Rajasuriya
10
Moreover, it was impractical to sample Lysmata debelius and L. amboinensis due to limitations imposed by problems associated with scuba diving in deep water.
Sampling was carried out by snorkeling in shallow reefs less than 3m depth while all other sites were sampled using scuba. A total of 142 sites were sampled for aquarium fishes, substrate and megabenthos. Eight sites out of the 150 survey sites could not be sampled as they were in inaccessible locations such as the middle of rock outcrops or wave zones in the reef crest.
Collection of fishery data
Data was collected on the operational aspects of the fishery by focused interviews with fish collectors and suppliers at the village level and by interviewing several exporters. There was difficulty in obtaining catch and effort data as the fish collectors and suppliers were reluctant to provide this information as they believed that the data will be used to ban the collection of some species and that they might be subject to income tax. De Alwis (2007) also reported on the difficulty in obtaining catch data.
Data Analysis _____________________________________________________________________
The CENARA Data Systems Standard Operating Procedure (SOP) included MS Access queries to join the various worksheets in the Excel Data Entry workbook and to export the data for input into SPSS scripts where standing stock calculations were performed (CENARA Data Operations SOP, 2009).
The output from SPSS was entered into an Excel workbook for final formatting before being copied and pasted into this report.
Total Allowable Catch The total allowable catch (TAC) for each species was calculated using the formula TAC = MSY x Estimated mortality of an exploited stock (estimated at 0.5). This calculation was adopted with the assumption that the populations of reef fish are under high collecting pressure at a time when the reef habitats are also highly degraded due to the combined impacts of the unprecedented coral bleaching event of 1998 and the impacts of the tsunami in 2004 coupled with anthropogenic impacts such as pollution and increased sedimentation due to poor land use practices. Thus the calculated TAC is highly conservative and designed to prevent the overexploitation of species. Although the TAC can be based on the standing stock, the upper or lower 90% CIs, in order to protect species with a low abundance the TAC should ideally be based on the lower 90% CI for each species as variations in the patterns of spawning, recruitment and predation can also affect the populations.

11
Results ____________________________________________________________________ Standing stock estimates The standing stock presented in appendices 4 & 5 contain the abundance of the recorded species, the maximum sustainable yield (MSY) and the total allowable catch (TAC). A total of 66 species of aquarium reef fish were recorded divided among 20 families and 38 genera (Fig. 3). None of the marine fish species protected under the Fisheries and Aquatic Resources Act and the Fauna and Flora Protection Ordinance were recorded during this survey. Two species of butterflyfish (Chaetodontidae), one species of pygmy angelfish (Pomacanthidae) were the only 3 species that were recorded from a total number of 17 species listed in the ‘Restricted Export’ category in the Fisheries and Aquatic Resources Act of 1996.
Figure 3. Families, Genera and Species of aquarium fish recorded in Galle and Matara Districts.
Galle District
The abundance, maximum sustainable yield (MSY) and the total allowable catch (TAC) is given in appendix 4. The most abundant species in the Galle District were damselfish; Neopomacentrus asyzron, Abudefduf vaigiensis and Pomacentrus similis with an estimated abundance of 4,202,918, 2,276,756 and 1,931,662 individual fish respectively. The TAC for these three species of damselfish is 210,146 for Neopomacentrus asyzron, 113,838 for Abudefduf vaigiensisi and 96,583 for Pomacentrus similis. Among surgeon fish (Acanthuridae) used as aquarium species; Acanthurus lineatus and A. triostegus were common with an estimated TAC of 9,260 and 6,907 individuals respectively. The TAC for unidentified Acanthurids, mainly juveniles and sub adults amounted to 8,320 individuals.

Arjan Rajasuriya
12
The abundance of Acanthurus leucosternon and Naso lituratus was low with a TAC of 417 and 167 individuals respectively
Five species of angelfish (Pomacanthidae) were recorded. The abundance of Centropyge flavipectoralis was 3,333 whilst Centropyge multispinis was 9,998. The TAC for Centropyge flavipectoralis and Centropyge multispinis is 167 and 500 individuals respectively. The TAC for Pomacanthus annularis is 376 and the P. semicirculatus is 1,176 individuals.
Twelve species of butterflyfish (Chaetodontidae) were recorded and the species of highest abundance was Chaetodon vagabundus (127,380) whilst the lowest abundance was C. trifascialis (417). Accordingly the TAC for these two species is 6,369 and 21 individuals respectively. Only two species of butterflyfish listed in the Restricted Export category was recorded; both species had relatively low abundance and TAC. The TAC for Chaetodon lunula is 125, whilst the TAC for C. meyeri is 671 individuals. Due to the lower numbers recorded of Forcipiger flavissimus the TAC is only 126 individuals.
Fourteen species of wrasses (Labridae) were recorded. The TAC for Labroides dimiditatus (Cleaner wrasse) is 8,207. The TAC for Gomphosus caeruleus and Macropharyngodon bipartitus is 1,484 and 8,548 respectively. The abundance of Halichoeres hortulanus was low and the TAC was 213. Hemigymnus fasciatus was even lower and the TAC is only 21 individuals. The abundance of the scorpion fish Pterois volitans was very low and the TAC is 21 individuals only.
Matara District
The abundance, maximum sustainable yield (MSY) and the total allowable catch (TAC) is given in appendix 5. The abundance of pomacentrids in the Matara District was also similar to Galle District. The estimated abundance of Neopomacentrus asyzron, Abudefduf vaigiensis and Pomacentrus similis was 3,804,168, 1,706,727 and 795,449 respectively. Consequently the TAC for these three species is 190,208; 85,336 and 39,772 respectively. The abundance of clown fishes was low with both Amphiprion clarkii and A. sebae having the same abundance level at 457 individuals each. As a result the TAC for these two species of clown fish is 23 individuals only. Among the Acanthurids the highest abundance was of Acanthurus lineatus (88,111) followed by A. triostegus (52,628). The TAC for these two species is 4,406 and 2,631 individuals respectively. The abundance of Acanthurus leucosternon was low and Naso lituratus were low with 1,925 and 489 individuals respectively. Therefore the TAC for these two species is 96 (Acanthurus leucosternon) and 24 (Naso lituratus) respectively. Unidentified Acanthurids amounted to 49,480 individuals and the TAC is 2,474. Very low abundance was also recorded for Naso lituratus (489); the TAC is only 24 individuals.
Six species of angelfish were recorded. Among the larger species the estimated abundance of Pomacanthus semicirculatus was 22,432 individuals and P. annularis and P. imperator were 7,381 and 489 respectively. The TAC for these three species is 1,122 for Pomacanthus semicirculatus, 369 for P. annularis and 24 for P. imperator respectively. The TAC for Centropyge eibli is 137 whilst C. multispinis is 397.
Thirteen species of butterfly fish (Chaetodontidae) were recorded. The highest abundance was Chaetodon vagabundus with 97,492 individuals. The TAC for this species is 4,875. The next highest TAC is for Chaetodon lunula at 923 individuals. Chaetodon guttatisimus, C. kleini, C. xanthocephalus and C. lineolatus 46, 69, 49 and 91 respectively. Two species listed in the Restricted Export category were recorded; the TAC for Chaetodon xanthocephalus and Chaetodon meyeri were 49 and 562 individuals respectively.

13
Thirteen species of wrasses (Labridae) were recorded of which Labroides dimidiatus had the highest abundance at 86,249 individuals. The TAC for Labroides dimidiatus is 4,312. The next highest TAC is for Thallasoma lunare, Halichoeres marginatus and Gomphosus caeruleus with 2,864, 2,304 and 2,155 respectively. The abundance of Coris frerei is relatively low and the TAC is 485 individuals.
Status of the habitats of the marine aquarium fishes in the study areas.
Coral rock was the main substrate type within the study area. Percentage of coral rock in the Galle District was 32.98 and 26.55 in the Matara District. The major categories of organisms on the substrate were hard corals, soft corals, sponges, coralline algae, fleshy and filamentous algae. There were small patches of sea grass among sandy areas in back reef spaces. Percentage cover of hard corals was relatively low in the Galle and Matara Districts with 23.47% and 21.36% respectively while the percentage of coral rubble was very high (Table 1 & 2; Fig. 4).
Table 1. Percentage of benthic categories in the Galle District
Categories Percentage Hard coral 23.47 Soft coral 06.11 Sponge 01.08 Coralline algae 00.72 Sea grass 02.31 Fleshy & filamentous algae 07.35 Sand 04.35 Coral rubble 21.59 Coral rock 32.98
Table 2. Percentage of benthic categories in the Matara District
Categories Percentage Hard coral 21.36 Soft coral 10.14 Dead coral 00.04 Sponge 00.34 Ascidian 00.43 Anemone 00.06 Zoanthid 00.19 Coralline algae 00.70 Sea grass 02.45 Fleshy & filamentous algae 08.07 Sand 07.28 Coral rubble 22.37

Arjan Rajasuriya
14
Coral rock 26.55 Rock 00.02
Figure 4. Percentage of substrate type and benthic organisms within the study area
The aquarium fishery in Galle and Matara Districts _____________________________________________________________________ The marine aquarium fishery in Sri Lanka has three distinct components, namely the fish collectors, dealers or suppliers and the exporters. Fish collectors and suppliers are located at the village level whilst the exporters are based in and around Colombo and suburbs. There are only fish collectors and suppliers in the Galle and Matara Districts; their operations are supported by many individuals that maintain holding facilities, operate scuba compressors, boats etc. Specimens are collected by scuba diving and snorkeling. A joint study conducted by NARA and the Marine Conservation Society of UK in 1997 with the support of the Darwin Initiative revealed that there were about 500 aquarium fish collectors within the Galle and Matara Districts. Approximately 60% were snorkelers whilst 15% were scuba divers. About 25% engaged in both snorkeling and scuba diving. Snorkelers swim out from the shore to collect fish among inshore reefs and scuba divers use boats to work the offshore areas. There were approximately 15 crafts (6m fiber glass boats) that operated both in Galle and Matara Districts during the study period. The majority of fish collectors were located at Matara and Weligama followed by Mirissa and other locations (Fig. 5). Fish collectors and some suppliers migrate to the east coast during the southwest monsoon and thus they are able to engage in the fishery throughout the year. Almost all scuba divers are fulltime fish collectors whilst some

15
snorkelers are part time fish collectors. Most collectors are opportunistic and take advantage of the demand for other marine species such as sea cucumber and chanks (Wood, 1996). Collection of catch data proved to be a tremendous challenge. Due to past management initiatives by the Department of Wildlife Conservation to protected several species in 1993, the primary stakeholders are highly concerned about studies that provide information to management authorities. The difficulty in obtaining catch data was also reported by De Alwis (2007).
Figure 5. Distribution of 567 fish collectors in the coastal towns of Galle and Matara Districts.
Snorkelers operate within the back reef areas and on the seaward side of the fringing reefs to a depth of about 8m. Usually scuba divers operate from about 10m to a depth of about 40m. Collecting sites and the depth may vary depending on the availability of species. The main target species of the snorkelers are juvenile and sub-adult butterflyfish, wrasses, surgeonfish, gobies, blennies, scorpionfish and moray eels. The scuba divers collect all the species that the snorkelers target as well as reef shrimps, especially the painted shrimp (Lysmata amboinensis) and scarlet shrimp (Lysmata debelius) that are found on deeper reefs around 25 to 40m depth.
Collecting periods
Aquarium fish are collected in the southern coastal waters for a period of about 6 months; from mid October to end of March when the sea is calm and clear. Spring and neap tides are experienced during this period in conjunction with lunar cycles where the sea becomes rough for short periods and some of the inshore reef crests are exposed during the low tide. During such spells the visibility is reduced due to the swell action and the currents. Fish collecting is affected during such periods and only the protected back reef areas are accessible for snorkelers.
Collecting methods

Arjan Rajasuriya
16
The main collecting gears are the handnet, chaser net also called the tickler net or the night net, moxy net and the Barrier net. Barrier nets are used to capture medium to large individual fishes. Almost all the snorkelers use the moxy net although this is a banned fishing gear. The moxy net is used because it is difficult to catch small fish in the coral environment. Most snorkelers are also not skilled in the use of the hand nets, therefore they resort to the use of the moxy net even to collect species that can be easily collected with the use of the hand net. The scuba divers also use moxy nets, mainly to catch small angelfish, butterflyfish and other species that hide in crevices and holes in the reef structure. Greater damage to the reef structure is caused by the snorkelers working among the shallow coral patches. In Addition scuba divers use barrier nets. These are fairly large nets of about 8 to 10m in length and about 2 m in height. It is laid in a semicircle surrounding a patch of the reef where the target species are present and then the collector chases the fish into the net. Individual fish that get entangled in the net are collected with the night net and transferred to polythene bags held by the diver around his waist.
Holding facilities
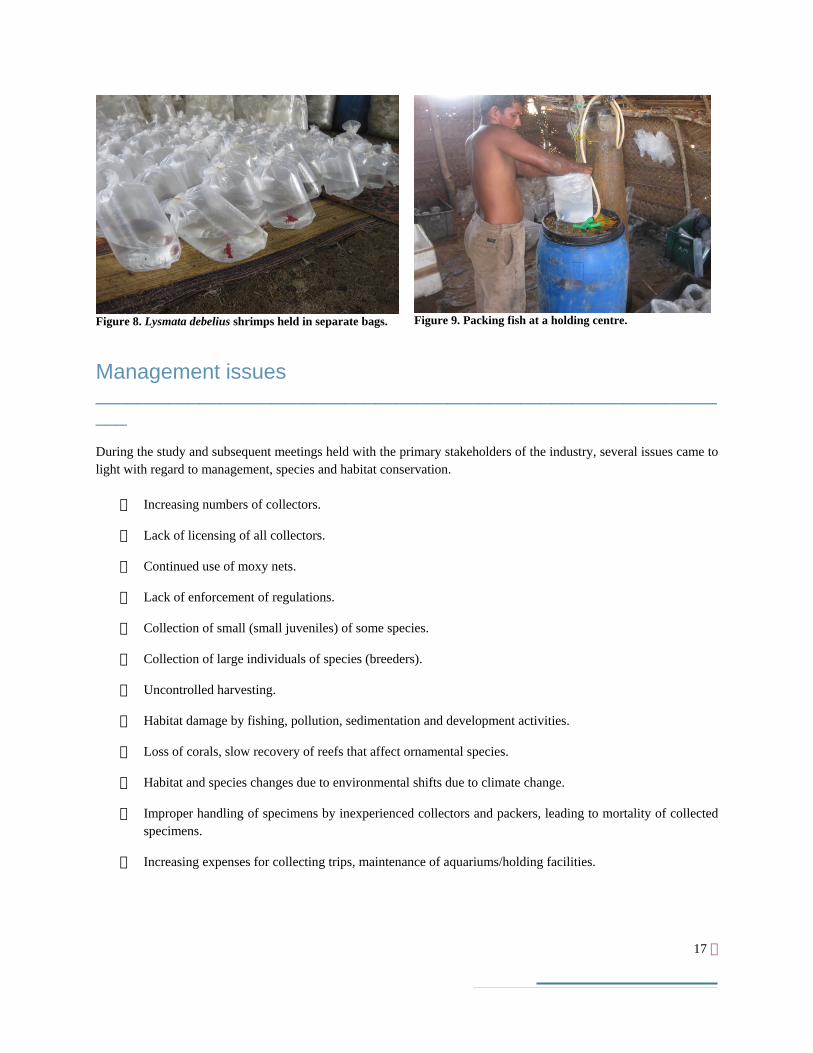
At the village level, collected fish are given to the suppliers who maintain a temporary holding facility. Each supplier has a few tanks made of glass and some are large 100 liter plastic barrels cut in half (Fig. 6). These serve as temporary holding containers. The fish and invertebrates are put into these tanks/containers and aerated. Species that are aggressive towards conspecifics such as the Acanthurus leucosternon are put into individual polythene bags with sufficient water and oxygen (Fig. 7). Other species such as Lyamata debelius that cannibalize on conspecifics are kept in perforated small plastic cups or perforated plastic bottles that are floated inside the aquariums or are packed individually in polythene bags (Fig. 8).
Usually specimens are kept only for a day or two at these collecting centers before they are transported to the exporters in Colombo. The specimens are packed in polythene bags with sufficient water and oxygen for the journey to Colombo (Fig. 9). This journey usually takes about 4 to 5 hours from the collecting centers in the southern coast.
Figure 6. Temporary holding tanks at a collecting centre.
Figure 7. Species aggressive towards conspecifics held in individual bags with paper screens inserted between the bags.
17
Figure 8. Lysmata debelius shrimps held in separate bags.
Figure 9. Packing fish at a holding centre.
Management issues _______________________________________________________________ During the study and subsequent meetings held with the primary stakeholders of the industry, several issues came to light with regard to management, species and habitat conservation.
Increasing numbers of collectors.
Lack of licensing of all collectors.
Continued use of moxy nets.
Lack of enforcement of regulations.
Collection of small (small juveniles) of some species.
Collection of large individuals of species (breeders).
Uncontrolled harvesting.
Habitat damage by fishing, pollution, sedimentation and development activities.
Loss of corals, slow recovery of reefs that affect ornamental species.
Habitat and species changes due to environmental shifts due to climate change.
Improper handling of specimens by inexperienced collectors and packers, leading to mortality of collected specimens.
Increasing expenses for collecting trips, maintenance of aquariums/holding facilities.

Arjan Rajasuriya
18
The need to use several scuba cylinders and venture into deeper water resulting in decompression problems.
Lack of knowledge on problems related to scuba diving.
Low prices for many species. Prices have not been revised in the recent past.
Discussion ________________________________________________________________________ Three species of damselfish; Neopomacentrus asyzron, Abudefduf vaigiensis and Pomacentrus similis were the most abundant among the 66 species recorded in Galle and Matara Districts. All three species occur among coral, sandstone/limestone and rock reef habitats within the study area as well as in other locations in Sri Lanka and are not specifically dependent on corals. Among the surgeonfish the abundance of Acanthurus leucosternon and Naso lituratus was very low. Juveniles of these two species live mainly among branching coral until they reach a size of 6 cm to 8 cm and the loss of branching corals due to reef degradation and the pressure of collection seem to be the cause of the decline of the two species of surgeonfish. Healthy populations of Labroides dimidiatus (cleaner wrasses) were found throughout the study area. This species is highly sought after by the aquarium industry, nevertheless the populations of Labroides dimidiatus seem to be stable. The population of Macropharyngodon bipartitus was also healthy as well as Gomphosus caeruleus. Halichoeres hortulanus had relatively low population density. Among the angelfish the populations of Centropyge flavipectoralis and C. eibli were low. Centropyge flavipectoralis which is also listed in the Restricted Export category was recorded only in the Galle District (TAC is 167 individuals). But the C. multispinis and both large species of angelfish Pomacanthus semicirculatus and P. annularis populations were not very low. The number and the distribution of large angelfish (Pomacanthus semicirculatus, P. annularis and P. imperator) in an area are limited because they are highly territorial and usually only mated pairs are found in a patch of reef. Pomacanthus imperator is also a species that has the largest territory and home range among the large angelfish in Sri Lanka and adults of this species is not found in large numbers. Furthermore their preferred habitat is among the shallow reefs; hence the numbers recorded were low. The pygmy angelfish (Centropyge spp.) are more gregarious and forms harems. The three species of Centropyge recorded in this study have preferred depth ranges, usually between 10 & 20m. They are also not specifically found on coral reefs. They prefer sandstone/limestone habitats with low coral cover. Therefore the low number recorded in this study is because much of their habitat was not within the sampled area since the study was limited to the shallow coral reef habitats.
Thirteen species of butterflyfish (Chaetodontidae) were recorded with the highest abundance recorded for Chaetodon vagabundus. Other species, however, recorded fairly low numbers with Chaetodon xanthocephalus which is a sought after species in low numbers. Forcipiger longirostris is uncommon in shallow coral reefs; hence the low TAC recorded is because its preferred habitat is outside the sampling area. Pterois volitans is a cryptic species and therefore the low abundance and TAC could be due to this reason. Pomacanthus imperator is a species that prefers deeper water below 15m along the southern coast, hence the estimated low TAC of 24 for this species. None of the Triggerfishes (Balistidae) listed under the Restricted Export category was sighted. Sea anemones and Clown fish (Amphirpion spp.) are uncommon to rare in the shallow coral areas in the southern coastal waters; hence their abundance was very low. Two species of clown fish were recorded in the Matara District.
19
From 12 species of butterflyfish (Chaetodontidae) listed under the Restricted Export category only two species were recorded in the Matara District Chaetodon xanthocephalus (TAC is 49 individuals) and Chaetodon meyeri (TAC 562). Only one species of butterflyfish (Chaetodon meyeri) was recorded in the Galle District (TAC 671).
The relatively low numbers recorded for many of the important aquarium species could be attributed to several factors. Habitat loss, habitat alteration, high levels of extraction and other unknown factors such as changes in breeding, larval survival, recruitment, availability of food and mortality due to predation could be causes for the low abundance recorded for many species. Habitat quality of nearshore reefs was very poor with large amounts of coral rubble (21.59% in Galle District and 22.37% in Matara District) which is almost equal to the percentage of live coral cover for the two districts (23.47% for Galle District and 21.36% for the Matara District). This is a the result of the 1998 coral bleaching event and the death of hard corals and the subsequent erosion of reef structures due to lack of reef recovery in terms of recruitment and growth of new hard corals. Furthermore, the tsunami in 2004, damaged reef structure and reduced much of the dead corals to coral of rubble and altered reef habitats drastically (Rajasuriya, 2005; Rajasuriya et al. 2005). Reef recovery has been slow and variable and is highly influenced by anthropogenic impacts (Rajasuriya, 2005, 2008). Another factor that has contributed to reef degradation for several decades was severe coral mining for the production of lime for construction activities (De Silva, 1985; CCD, 1990; Perera, 2003). Although it is much less now, this activity is still present in some coastal stretches. Kumara et al. (2008) report on the damage caused to coral reef structure at Bandaramulla, Matara District, which is located within the survey area.
The study revealed that the ornamental fish collecting methods can be highly damaging to the reef structure especially where fragile live corals are present. The habitat damage caused by the inexperienced snorkelers has been reported previously by Wood (1985), However habitat damage cannot be attributed to aquarium fish collecting alone as there are many other forms of fishing that is highly detrimental to the marine environment. The use of bottom set nets to catch spiny lobsters causes much habitat degradation as well as blast fishing (Ohman et al. 1993, Dayaratne et al. 1997, Rajasuriya, 2005). Although all of these fishing methods are illegal they are rampant today due to lack of enforcement of the fisheries regulations (Rajasuriya, 2008). Therefore the marine aquarium fishery should be managed as part of overall fisheries management for the whole country, as all of the destructive fishing activities have a negative impact on the quality of the reef habitats and the ocean environment.
Habitat quality is a critical factor for the well being of reef organisms including reef fish (Pilliam and Danielson, 1991, Roberts 1996, Munday, 2002). Damage and alteration to habitats can have a serious impact on populations of reef fish (Sale 1991, Sadovy 1996). Reef fish depend heavily on the quality of their habitat for survival, reproduction and recruitment (Sale, 1978; 1991). They are particularly vulnerable at the recruitment stage where avoidance of predators and the availability of the right types of food are the most important factors that ensure survival. Habitat complexity (Roberts, 1996) and substrate quality (Luckhurst and Luckhurst, 1978; Roberts and Ormand, 1987) are also important and is linked to survival of juveniles, and mortality is very high among reef fish due to predation, particularly at the stage of settling from the plankton and immediately thereafter (Roberts, 1996). Roberts and Ormand, (1987) determined in a study conducted among the Red Sea coral reefs that 77% of the variance in fish abundances on reefs was due to the availability of refuge holes.
Marine refuges can play a key role in the protection of habitats and for populations of reef fish to recover (Roberts et al. 2001, TNC 2008). The types of habitats available in the southern coast are very specific and because of the seabed structure coral reefs are found only along the coast (Swan 1983, Ohman et al. 1998). Therefore, there are no similar coral reef habitats in the offshore areas and this leaves only the shallow fished areas to be protected. Most of the species used in the aquarium trade are species that recruit, spend their juvenile stages as well as adult stages in the same habitat. Ideally, protected areas should include the following; Representation and Replication, Critical areas, and Connectivity (TNC, 2008). However it is not always possible to find all of these components in small

Arjan Rajasuriya
20
inshore reefs. Most of the aquarium species are ‘broadcast spawners’ and their breeding patterns are linked to the monsoon seasons. The origin of these populations and the connectivity of these small reefs are not well understood. However, a basic understanding on the recruitment patterns can be derived for some species based on observations of the appearance of juvenile fishes in the reef system. Although the exact period of recruitment pulses is not known due to lack of studies on this aspect, the appearance of juveniles of some species of butterflyfish (Chaetodontidae), angelfish (Pomacentridae), wrasses (Labridae) and surgeon fish (Acanthuridae) is well known. For example the Bluering angelfish (Pomacanthus annularis) and the Koran angelfish (P. semicirculatus) are both species that prefer relatively silty environments where there is freshwater input. This fact is well established with regard to their distribution patterns both in Sri Lanka and also in the Indian Ocean Region. Both species are rare among oceanic islands and reef systems such as the Maldives and Chagos Archipelago where there is no river runoff. Along the coast of Sri Lanka both species occur in greater abundance where freshwater input is relatively high such as in the west coast. This is particularly noticeable when considering the recruitment pulses and subsequent appearance of juveniles on coastal reefs. In the study area juveniles of both species are found close to the Polwathumodera River in the Weligama Bay in the southern coast. Every season fish collectors catch the juveniles close to this area. This indicates that although both species are broadcast spawners their juveniles appear to recruit into nearby areas. However, this situation may not apply to many other species, where their larvae might be carried along greater distances before they finally recruit onto suitable habitats. Scientific literature related to breeding, larval dispersion and recruitment of most species used in the aquarium trade is lacking, hence it is prudent to use a ‘precautionary approach’ in the utilization of these species.
Fish refuges can be created by temporary closures during breeding and recruitment stages for highly migratory species (Roberts 2001). However, these refuges need to be sufficiently large for them to be effective, taking into consideration that larval dispersal and suitable areas for recruitment is extremely important to maintain viable breeding populations. Although the reef areas are quite small in the southern coast of Sri Lanka, a similar approach can be taken by setting up seasonal or periodical closures for fish collecting when the spawning and recruitment periods for target species are known. Reproductive patterns in reef fish are characterized by diversity and the reproductive output is highly variable within and among species (Sadovy, 1996). In some years juveniles of some species of butterflyfish and surgeonfish occur twice during the collecting period; the first time in the collecting season in December -January and then again in March -April. There may be several species that breed throughout the year and for such species closed seasons may not be necessary. Furthermore, spawning periods may vary between oceanic regions and even within the different coastal regions of a country that experience different oceanographic and climatic conditions. Therefore much more detailed information on the biology of individual species pertaining to this region is necessary. Many stakeholders in the aquarium fishery believe that a closed season is present naturally in the form of the southwest monsoon where conditions are not favourable for collecting. However, this reasoning appears to be incorrect due to the fact that juveniles of most species used in the trade is not seen among the inshore back reef areas during the southwest monsoon. Furthermore the absence of juveniles immediately after the monsoon also indicates that fish may not be breeding as expected during the southwest monsoon or their larvae are in offshore currents and have not reached the required level of maturity for settlement. Therefore the monsoon period cannot be considered as a closed season. In fact many juveniles of the desirable sizes are present only a month or two later after the end of the monsoon. Taking into consideration the planktonic life cycles and periods of several reef fishes (Benjamin 1991, Doherty 1991), it appears that some species used in the aquarium fishery spawn in the latter part of the monsoon and that larvae recruit immediately after the monsoon when the inshore shallow reefs are relatively calm and then appear as small juveniles among the reefs a few weeks
21
later. Settlement and survival until adulthood also depends much on the habitat, predators, food and on intra and inter-specific competition (Jones 1988; 1991).
In this study the total allowable (TAC) catch for species has been determined at 5% of the population, calculated for all species regardless of their abundance. Ochavillo & Hodgson (2006), recommend different TAC levels for species groups of aquarium fish, namely families of damselfish (20% to 25% of population depending on species), wrasses (10% of the population), angelfish (5% of population) and butterflyfish (10% to 15% of population depending on species). According to them their TAC limits for different species groups is very conservative because due to the high structural complexity of the coral reefs there are plenty of hiding spaces for reef fish and this could lead to underestimating their abundance. However, in relatively degraded habitats with low reef recovery and high levels of extraction such as in Sri Lanka, the TAC recommended by this study which is based on 5% of the population for all species is reasonable although it can be considered as highly conservative.
In the present study none of the currently protected species (appendix 7) were recorded indicating that those species are very rare. The scarcity of these species is mainly because they are naturally rare in Sri Lanka and therefore it is essential to protect them in the future. However, some of these species such as the Pygoplites diacanthus is a common angelfish in the Maldives and is currently imported to Sri Lanka for re-export. Only 3 species of fish were recorded from a total number of 17 species listed under the ‘Restricted Export’ category of the Fisheries and Aquatic Resources Act (appendix 8). This indicates that some of these species are relatively uncommon to rare in the shallow coral reef habitats in the southern coast.
Often very small size classes of some of the most sought after species are collected. These species are Cleaner wrasses (Labroides dimidiatus), Clown coris (Coris freirei), Checkerboard wrasse (Halichores hortulanus), Blue ring angelfish (Pomacanthus annularis), Koran angelfish (Pomacanthus semicirculatus), and some species of butterflyfish (Chaetodontidae). These small juvenile fish do not survive well in captivity. In the wild they feed constantly as they have to grow quickly to avoid being predated. Most aquarists that purchase these small fish in the importing countries may not have the correct type of feed to sustain the small juveniles at this critically important growth stage. As a result the small juveniles die soon after they are purchased by the aquarists. Therefore it is an utter waste to catch and export these small size classes. At the other end of the scale, it is harmful to the stocks when large individuals of species are collected and exported. The demand for large breeding size individuals comes from public aquaria. These special orders are catered to by some exporters and collectors use barrier nets to catch these fish. Species that are most vulnerable to this type of extraction are large Emperor angelfish (Pomacanthus imperator), Koran angelfish (Pomacanthus semicirculatus), Blue ring angelfish (Pomacanthus annularis), Clown triggerfish (Balistoides conspicillum), Jigsaw triggerfish (Pseudobalistes fuscus) and Powder blue surgeonfish (Acanthurus leucosternon).
Management recommendations _____________________________________________________________________
Considering the degraded status of the coral reef habitats in the southern coastal waters it is important to adhere to the ‘precautionary principal’ in harvesting aquarium species. Recovery of the populations of aquarium species depends much on the improvement of the habitat and the survival of viable breeding populations. At present the reefs in the southern coastal waters are highly impacted by human activities and aquarium fish collecting is only one aspect of the threats to the populations of reef fish and many species of invertebrates. The following recommendations are made in view of the above.

Arjan Rajasuriya
22
Aquarium fish collectors catch the required species in all size classes due to the demand and management measures designed to control fish collecting through the divers is unlikely to succeed if the exporters purchase the catch. The most effective approach to control harvesting and to adopt responsible collecting methods is to implement management actions through the exporters. The results of this survey can be used as a guide to control harvesting of species. However, for the recommendation of species based quotas it is necessary to obtain the number of each species harvested. At present the collectors refuse to part with this information because they fear that the authorities would take management actions that are detrimental to their earning capability. Due to the patchy distribution of species it is necessary to obtain catch data by area or reef section or at larger spatial scales by district.
Although the marine aquarium trade utilizes a large number of species, it relies on several high value species to retain a hold in the highly competitive world market. Today the foreign buyers have the opportunity to browse the World Wide Web and select the required species from a vast array of suppliers. Many species with a high value have low abundances naturally. Others such as the powder blue surgeonfish (Acanthurus leucosternon) is a highly sought after species and is required for almost every consignment. Management recommendations for such species should take into consideration the possible impacts on the industry as well as the effect on the populations of these fishes.
Species
The results indicate that some of the most sought after species Acanthurus leucosternon and Naso lituratus have a very low abundance. Both species are highly important for the aquarium trade and exporters need these two species among several other species to maintain their orders in the international market. Although the TAC can be based on the standing stock or the upper or lower 90% CIs, in order to protect species with a low abundance the TAC should ideally be based on the number given under the TAC and not the upper 90% CI indicated for such species. However, due to prevailing market preferences species with very low abundance need to be harvested in order to maintain the trade. Therefore it is recommended that the ‘precautionary principal’ is applied in such situations and that these species are harvested at the level estimated by the TAC.
None of the species listed under ‘Protected species’ list of the Fisheries and Aquatic Resources Act and the Fauna and Flora Protection Ordinance were recorded during this study. Therefore these species should be retained in the list of protected species.
Only 3 species out of 17 species listed in the ‘Restricted Export’ category of the Fisheries and Aquatic Resources Act 1996 were recorded during the study. Therefore the status of the species in the Restricted Category requires re-evaluation. The status of these species can be assessed further by examining results of the northwestern and eastern coastal waters under this project and recommendations can be made accordingly.
The export of small juveniles and large breeding stage adult fishes are harmful to the wild stocks and the exporters should be educated on the detrimental aspects of harvesting unsuitable size classes. However it is difficult to enforce restrictions on size classes as it is impractical to measure fish sizes at the time of exporting. Therefore it is suggested to establish a mechanism such as a monitoring team from the relevant management organizations to visit aquaria periodically to ensure that unsuitable size classes are not stocked. Furthermore, it is highly desirable for the exporters to voluntarily stop the export of unsuitable size classes.
Collecting methods

23
The use of the illegal moxy net should not be allowed. However, policing the coastal waters to prevent the use of moxy nets is extremely difficult if not impossible because of the small size of the moxy net and its use has to be checked underwater.
Fish collectors break coral branches to catch the Gobiodon citrinus. This activity causes much damage to branching corals and should be banned. It is recommended that this species be included in the protected list of species in order to prevent the habitat damage caused by their collection.
Although the barrier net does not cause habitat damage its use is harmful for some species as large breeding sized fishes can be caught with it. Therefore catching the breeders should be prevented. This is a matter that should be discussed with exporters as they can stop the export of large specimens.
Conduct awareness programmes and develop publications such as leaflets to educate the divers on the negative impacts of spear fishing, and the role of the groupers in maintaining the habitats of the scarlet shrimps (Lysmata debelius) and painted shrimps (L. amboinensis) and in proper collecting methods and post harvest care.
Catch data
It is recommended that a mechanism to obtain catch data be established through the network of fisheries inspectors and the Assistant Director of Fisheries for each District. Every fish collector and supplier maintains catch data in a personal record book. The exporter pays the collectors based on these lists. However, collecting the list from individual fish collectors is not practical and therefore it is recommended that the DFAR make it mandatory for the supplier to provide this list to the Assistant Director of Fisheries of the District. A logbook supplied by the DFAR to each Assistant Director of Fisheries would support this process.
Licensing
Issue licenses to all ornamental fish collectors and list the types of gear that can be used by the collectors. These should be listed in the permit itself.
Suppliers are not registered at present because they are not engaged in collecting the fish. But the registration of suppliers is important and a license issued, because they can control the size classes of fish when purchasing and they should be the primary source of catch data collection.
Holding facilities
The temporary holding facilities maintained by the suppliers should be improved as many have inadequate facilities with poorly maintained water quality. The suppliers are not concerned about the quality of these facilities because the fish are sent to the exporters daily or every few days. Therefore they do not think that it is necessary to improve the quality of the holding facilities. The DFAR should visit the holding facilities regularly and supervise these facilities.
Fish collectors should be educated in techniques of responsible harvesting, handling and care of the specimens. A series of regular lectures on a set of Best Practices together with diving safety should be conducted to educate them.
Protection of habitats

Arjan Rajasuriya
24
The marine aquarium fishery cannot be managed in isolation because the habitats of reef fish are being affected by various other human activities as well as natural impacts such as coral bleaching. The main causes of reef degradation due to human activities are; indiscriminate netting to catch spiny lobsters, pollution form land-based sources, blast fishing and coral mining. These should be controlled or eliminated by implementing the existing regulations. Assistance should be sought from the newly established Coast Guard Department to implement some of these regulations.
Declaration of protected areas
Although large areas cannot be declared as protected areas along the southern coastal waters, small reef sections or patches can be set aside as breeding areas. Because of planktonic larval dispersion of most reef fish species even small areas can serve as refuges. These sites should be identified with the participation and support of all stakeholders, particularly the fish collectors and suppliers in order to assure compliance. Ideally the responsibility of looking after such areas should be vested in the local fisheries management committees.
Acknowledgements
____________________________________________________ I wish to thank the financial support provided by CIDA, IFAD and FAO and the assistance given by the staff of the CENARA project and staff members of NARA without which this survey would not have been possible. The support extended by the following individuals in particular is gratefully acknowledged.
National Project Coordinator (CENARA Project): Mr. H.S.G. Fernando
National Project Director (CENARA Project): Dr. (Mrs.) Champa Amarasiri
GIS & Resource assessment specialist/ International Consultant: Dr. Brian Long
GIS specialist (CENARA Project): Mr. Tithira Fernando
Survey Assistant (NARA): Mr. Chaminda Karunarathna
Hired Divers: Mr. Stanley De Kauwe
Mr. Thaminda Kumara
Mr. Shantha Jayawardene
Photo credits All photographs: Arjan Rajasuriya – Survey team leader & lead researcher

25
References Beets, J. (1994). Preliminary Review of the Marine Segment of the Ornamental Fish Industry in Sri Lanka, pp. 14.
The Agro-Enterprise Development Project (AgEnt Report No. 24). Benjamin, C.V. (1991) Settlement Strategies and Biogeography of Reef Fishes. In Sale, P.F. (ed.), The Ecology of
Fishes on Coral Reefs. Academic Press, London, pp. 231 - 260. CCD. (1990) Coastal Zone Management Plan. Coast Conservation Department, Sri Lanka, Colombo.
Dayaratne, P., Linden, O. and De Silva, M.W.R.N. (1997) The Puttalam/Mundel Estuarine System and Associated Coastal Waters. In. NARA, NARESA, Sida/SAREC, Stockholm University, p. 98.
De Alwis, A. (2007). Artificial breeding of marine Clarke’s Anemone fish / Clown fish (Amphiprion clarkii) and surveys on the catch statistics of marine ornamental fish species in the west and east coast of Sri Lanka. University of Sri Jayawardenepura (Unpublished report).
De Silva, M.W.R.N. (1985) Status of coral reefs of Sri Lanka. In Proceedings of the Fifth International Coral Reef Symposium, Tahiti, 1985, Vol. 6, pp. 515-518.
Doherty, P.J. (1991) Spatial and Temporal Patterns in Recruitment. In Sale, P.F. (ed.), The Ecology of Fishes on Coral Reefs. Academic Press, London, pp. 261 - 293.
English, S., Wilkinson C. & Baker, V. (1997) Survey Manual for Tropical Marine Resources. 2nd edition. ASEAN-Australian Marine Science Project, Australian Institute of Marine Science, Townsville, 390 p.
Hale, L.Z. and Kumin, E. (1992) Implementing a Coastal Resource Management Policy, The Case of Prohibiting Coral Mining in Sri Lanka. Coastal Resources Center, University of Rhode Island, 30 p.
Jones, G.P. (1988) Experimental evaluation of the effects of habitat structure and competitive interactions on the
juveniles of two coral reef fishes. Journal of Experimental Marine Biology and Ecology., 123,, 115-126. Jones, G.P. (1991) Post Recruitment Processes in the Ecology of Coral Reef Fish Populations: A Multifactorial
Perspective. In Sale, P.F. (ed.), The Ecology of Fishes on Coral Reefs. Academic Press, London, pp. 294 - 328.
Kumara, P. B. T. P., W. A. A. U. Kumara, H. A. A. Sandaruwan, R. G. A. Iroshanie, H. B. L. Upendra, and P. R. T.
Cumaranatunga. (2008). Impacts of Reef Related Resource Exploitation on Coral Reefs: Some Cases from Southern Sri Lanka. Pages 23 - 38 in D. O. Obura, J. Tamelander, and O. Linden, editors. Ten Years after bleaching - facing the consequences of climate change in the Indian Ocean. CORDIO Status Report 2008. CORDIO/Sida - SAREC, Mombasa.
Luckhurst, B.E. and Luckhurst, K. (1978) Analysis of the influence of substrate variables on coral reef fish communities. Mar. Biol., 49. 317 – 23.
Mee, J. K. L. (1993). An Overview of the Ornamental Aquatic Sector in Sri Lanka, pp. 50. Agro-enterprise
Development Project (AgEnt report No. 1), Colombo.

Arjan Rajasuriya
26
Munday, P. L. (2002). Does habitat availability determine geographical-scale abundances of coral-dwelling fishes? — Coral Reefs 21, 105-116.
Ochavillo, D. and G. Hodgson (2006). MAQTRAC marine aquarium trade coral reef monitoring protocol data
analysis and interpretation manual. California., Reef Check Foundation, USA.: 39. Ohman, M.C., Rajasuriya, A. and Linden, O. (1993) Human disturbances on coral reefs in Sri Lanka: A case study.
AMBIO, 22, No.7, 474-480. Ohman, M. C., Rajasuriya, A., and Svensson, S. (1998). The Use of Butterflyfishes (Chaetodontidae) as
Bioindicators of Habitat Structure and Human Disturbance. AMBIO 27, 8, 708-716. Perera, N. (ed). (2003) Alternative Livelihoods through Income Diversification: An Option for Sustainable Coral
Reef and Associated Ecosystem Management in Sri Lanka. South Asia Environment Programme (SACEP) and Coral Reef Degradation in the Indian Ocean (CORDIO).
Pulliam, H. R. & Danielson, B. J. (1991). Sources, sinks and habitat selection: a landscape perspective on population
dynamics. — American Naturalist 137, S50 - S66. Rajasuriya, A. 2002. Status Report on the Condition of Reef Habitats in Sri Lanka (2002). Pages 139-148 in O.
Linden, D. Souter, D. Wilhelmsson, and D. Obura, editors. Coral Reef Degradation in the Indian Ocean: Status Report 2002. CORDIO, Department of Biology and Environmental Science, University of Kalmar, Sweden.
Rajasuriya, A. (2005). Status of coral reefs in Sri Lanka in the aftermath of the 1998 coral bleaching event and 2004
tsunami. Pages 83 - 96 in D. Souter and O. Linden, editors. Coral Reef Degradation in the Indian Ocean: Status Report 2005. CORDIO, Department of Biology and Environmental Science, University of Kalmar, Sweden, University of Kalmar, Sweden.
Rajasuriya, A., N. Perera, C. Karunarathna, M. Fernando, and J. Tamelander. (2005). Status of Coral Reefs in Sri
Lanka after the Tsunami. Pages 99-110 in C. Wilkinson, D. Souter, and J. Goldberg, editors. Status of Coral Reefs in Tsunami Affected Countries: 2005. Australian Institute of Marine Science.
Rajasuriya A., De Silva M.W.R.N. (1988) Stony Corals of the Fringing Reefs of the Western, Southwestern and
Southern Coasts of Sri Lanka Proc 6th International Coral Reef Symposium, Australia, pp 287-296 Rajasuriya A. (2005) Status of coral reefs in Sri Lanka in the aftermath of the 1998 coral bleaching event and 2004
tsunami. In: Souter D., Linden O. (eds) Coral Reef Degradation in the Indian Ocean: Status Report 2005. CORDIO, Department of Biology and Environmental Science, University of Kalmar, Sweden, University of Kalmar, Sweden, pp 83 - 96
Rajasuriya, A., De Silva, M. W. R. N., and Ohman, M. C. (1995). Coral reefs of Sri Lanka: Human disturbance and
management issues. AMBIO 24, 428-437 Rajasuriya, A., Ohman, M. C., and Svensson, S. (1998). Coral and Rock Reef Habitats in Southern Sri Lanka:
Patterns in the Distribution of Coral Communities. AMBIO 27: 8, 723-728. Rajasuriya, A. (2008). Status of Coral Reefs in the Northern, Western and Southern Coastal Waters of Sri Lanka.
Pages 11 - 22 in D. Obura, J. Tamelander, and O. Linden, editors. Ten Years after bleaching - facing the consequences of climate change in the Indian Ocean. CORDIO Status Report 2008. CORDIO/Sida - SAREC, Mombasa.

27
Roberts, C. M. (1996). Settlement and beyond: population regulation and community structure of reef fishes. Pages 85 - 135 in N. V. C. Pollunin and C. M. Roberts, editors. Reef Fisheries. Chapman & Hall.
Roberts, C.M. and Ormand, R.F.G. (1987) Habitat complexity and coral reef fish diversity and abundance on Red Sea fringing reefs. Mar. Ecol. – Progr. Ser., 41, 1 – 8.
Roberts, C., Halpern, B., Palumbi, S.R., & Warner, R.R. (2001) Designing Marine Reserve Networks: Why small,
isolated protected areas are not enough. Conservation Biology in Practice., 10 - 17. Sadovy, Y. J. (1996). Reproduction of reef fishery species. Pages 15 - 59 in N. V. C. Polunin and C. M. Roberts,
editors. Reef Fisheries. Chapman & Hall. Sale, P.F. (1978) Coexistence of coral reef fishes - a lottery for living space. Environmental Biology of Fishes., 3,
No. 1, 85-102. Sale, P.F. (ed). (1991) The Ecology of Fishes on Coral Reefs. Department of Zoology, University of New
Hampshire, Durham, New Hampshire. 754p. Swan B. (1983) An introduction to the Coastal Geomorphology of Sri Lanka. National Museums of Sri Lanka,
Colombo TNC, (2008). Reef Resilience Toolkit: A manager’s guide to building resilience into coral reef ecosystems. The
Nature Conservancy. Wilkinson, C., editor. 2000. Status of Coral Reefs of the World: 2000. Australian Institute of Marine Science,
Townsville. Wilkinson, C. 2008. Status of Coral Reefs of the World: 2008. Global Coral Reef Monitoring Network and Reef and
Rainforest Research Centre., Townsville, Australia. Wood E.M. (1985) Exploitation of Coral Reef Fishes for the Aquarium Trade. Marine Conservation Society, UK Wood E.M., Rajasuriya A. (1996) Handbook of Protected Marine Species in Sri Lanka. Marine Conservation
Society and National Aquatic Resources Research and Development Agency Wood E.M. (1996) The Marine Ornamental Fishery in Sri Lanka: Current Status and Management Needs. Marine
Conservation Society, UK. 47p. Wood E.M. (2001) Collection of Coral Reef Fish for Aquaria: Global trade, conservation issues and management
strategies. Marine Conservation Society, U.K. (GOSL. 1993) Fauna and Flora Protection (Amendment) Act, No. 49 of 1993, pp 59 (GOSL. 1996) Fisheries and Aquatic Resources Act, No. 2 of 1996, pp 35

Arjan Rajasuriya
28
Appendix 1: Description & status of reef habitats Three types of reef habitats have been described in Sri Lanka; coral reefs, rock and sandstone (Swan, 1983; Rajasuriya and De Silva, 1988). Sandstone reefs are a conglomerate of sandstone and coral rock or limestone (Rajasuriya et al. 1995). All three types of reefs are found in the southern coastal waters (Rajasuriya et al., 1998). All coral reefs in the southern area are fringing reefs that occur as a narrow band located adjacent to the coast (Fig. 10). They are characterised by having a narrow back-reef area that form small reef lagoons where patches of branching, foliose, massive and encrusting corals grow (Figs. 11 & 13). A narrow reef crest and a seaward reef slope extend to about 500m offshore. In addition there are rock reef patches and rock outcrops among the fringing reefs (Fig. 12). All of these fringing reefs are in shallow water and the maximum depth at the edge of the seaward reef slope is about 10m. Rock reefs and sandstone/limestone reefs extend further offshore to a distance of about 5km and a depth of about 80m.
Figure 10. Typical fringing reef in the southern coast.
Figure 11. Live coral patch in back-reef lagoon at Weligama.
Figure 12. Rock reef habitat.
Figure 13. Typical upper reef slope with adult aquarium
fishes.
Reefs along the southern coast are subject to many human influences (De Silva, 1985; Rajasuriya et al. 1998) that continue to degrade them. Use of destructive fishing methods, uncontrolled harvesting, sedimentation, pollution and coral mining continue to damage nearshore reefs (Figs. 15 - 20). Studies on coral mining has been carried out
29
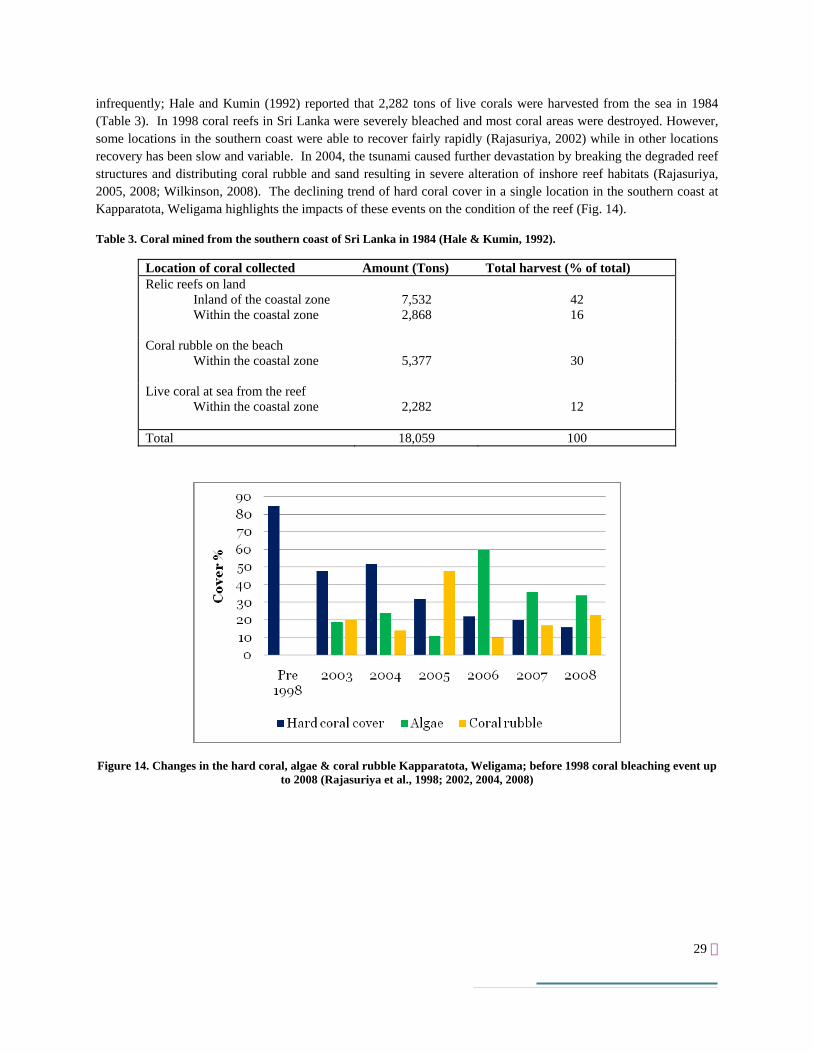
infrequently; Hale and Kumin (1992) reported that 2,282 tons of live corals were harvested from the sea in 1984 (Table 3). In 1998 coral reefs in Sri Lanka were severely bleached and most coral areas were destroyed. However, some locations in the southern coast were able to recover fairly rapidly (Rajasuriya, 2002) while in other locations recovery has been slow and variable. In 2004, the tsunami caused further devastation by breaking the degraded reef structures and distributing coral rubble and sand resulting in severe alteration of inshore reef habitats (Rajasuriya, 2005, 2008; Wilkinson, 2008). The declining trend of hard coral cover in a single location in the southern coast at Kapparatota, Weligama highlights the impacts of these events on the condition of the reef (Fig. 14).
Table 3. Coral mined from the southern coast of Sri Lanka in 1984 (Hale & Kumin, 1992).
Location of coral collected Amount (Tons) Total harvest (% of total) Relic reefs on land
Inland of the coastal zone Within the coastal zone
7,532 2,868
42 16
Coral rubble on the beach Within the coastal zone
5,377
30
Live coral at sea from the reef Within the coastal zone
2,282
12
Total 18,059 100
Figure 14. Changes in the hard coral, algae & coral rubble Kapparatota, Weligama; before 1998 coral bleaching event up to 2008 (Rajasuriya et al., 1998; 2002, 2004, 2008)

Arjan Rajasuriya
30
Figure 15. Sediment accumulation on coral reefs.
Figure 16. Non-biodegradable material stuck on reef.
Figure 17. Discarded nets smother corals.
Figure 18. Proliferation of Didemnid tunicates on degraded reefs may indicate eutrophication.
Figure 19. Acanthurus leucosternon among coral rubble.
Figure 20. Anchor rope of fishing boats tied around coral head.

31
Appendix 2: Description of the Fishery The marine aquarium fishery has three operational levels; fish collectors (divers), suppliers and exporters. The suppliers are the agents between the fish collectors and the exporter. A supplier can be a fish collector or a businessman. The supplier maintains a holding facility in the area where fish are collected. The exporters obtain the catch from the suppliers; however, some exporters prefer to buy the fish directly from the fish collectors. There are only collectors and suppliers in the study area. Organisms are collected by snorkeling or scuba diving. Snorkelers operate from the shore among the inshore fringing reef habitats while scuba divers operate on the offshore rock and sandstone/limestone reefs.
Small 6.5m fiberglass boats with out board motors are used in the fishery. The engine capacity varies from 9hp to 25hp. All engines use a mixture of kerosene and 2 stroke oil. Crafts are owned by fish collectors or suppliers. Exporters may also own some of crafts. Only scuba divers use boats and there are dedicated boat operators. Most fish collectors own their diving equipment. Sometimes exporters or suppliers provide equipment and boats; in such instances the fish are purchased at a lower price. Some collectors hire the equipment and the boats from the suppliers. The cost of hiring boats and the operator fee has to be borne by the fish collectors and may vary in different areas. Typically, a boat carries 2 divers and an operator. A collecting trip by boat may vary between Rs. 3000 to 5000 depending on the distance to sites. Due to increasing collecting pressure and the expanding numbers of fish collectors they are forced to travel further and dive deeper, particularly in search of the Lysmata spp, and fish that are on deep reefs. This has resulted in an increase in the incidences of decompression sickness. Many scuba divers have experienced the bends at varying levels and they often cure themselves by in-water recompression which is dangerous. However, they have no alternative as the only accessible decompression chamber is in the navy base at Trincomalee and requires several hours of travelling from distant collecting sites.
Four types of nets are used in the fishery. The species to be collected, the type of habitat determine the collecting method and the type of gear used. The four gear types are; 1. Hand net, 2. Night net/chaser net (tickler net), 3. Moxy net, 4. Barrier net. The moxy net is an illegal fishing gear but its use is widespread. There has not been any attempt to enforcement the regulations. Fish collectors are opportunistic hunters and may collect spiny lobsters, sea cucumber and chanks. Some also use hand spears or spear guns with scuba to shoot edible fish species such as groupers and snappers. Although it’s a harmful practice and the use of spear guns and spears is illegal under the Fauna and Flora Protection Ordinance, the regulations are not enforced.
Figure 21. Fish collectors using moxy net.
Figure 22. A fish collector using hand nets.
Arjan Rajasuriya
32
Appendix 3: Regulations and management ________________________________________________________________________
The Department of Fisheries and Aquatic Resources (DFAR) is responsible for the management of this industry. Fisheries administration in each district is carried out by an Assistant Director of Fisheries. There are a number of fisheries inspectors in each district functioning under the Assistant Director of the district. Up to now the administration of the marine aquarium fishery has been limited to the issue of fishing licenses to divers and permits for crafts. Even then all fish collectors have not been registered. There is no mechanism for the DFAR to collect catch data. The only form of data available is from the exports which can be obtained from the customs department. This information is based on the packing lists that exporters have to provide with each shipment. The lists are not sorted and stored in a proper manner; as a result it is extremely difficult to access this data.
The Fauna and Flora Protection Ordinance (Chapter 469) and its amendment in 1993 and the Fisheries and Aquatic Resources Act of 1996 are the two main pieces of legislation for the protection and control of harvesting of marine organisms for the aquarium trade. The DFAR issues export permits for species listed under the ‘Restricted Export’ category (appendix 8). In addition, the Department of Wildlife Conservation (DWLC) together with DFAR ensures that protected species (appendix 7) under the Fauna and Flora Protection Ordinance are not exported. The Biodiversity Conservation Unit of the Sri Lanka Customs Department ensures that the exporters conform to the current regulations. However, some protected species have been exported illegally (De Alwis, 2007). Problems due to identification of some species at the Customs Department may contribute to illegal exports (De Alwis, 2007). Problems have arisen among different stakeholders (government agencies, non-governmental organisations and exporters) in the implementation of the regulations partly due to communication problems (Wood, 1996). Those in the industry feel that the regulations are affecting their livelihoods and that there has not been adequate participation in the process of framing regulations and the protection of some organisms such as soft corals (Sarcophyton and Dendronephthya spp), tube worms and fan worms (Sabellestarte spp). However, exporters and collectors do not have much disagreement about the species of fish, molluscs and crustaceans that have been protected (Wood, 1996). In order to resolve some of these problems it is necessary to have a forum between the management authorities and the primary stakeholders in the industry. It is only through a transparent participatory process that such issues can be resolved.
Appendix 4

33
The abundance, maximum sustainable yield and the Total Allowable Catch for the recorded fish species in the Galle District.
Species Abundance MSY TAC Abudefduf vaigiensis Total 2,276,756 227,676 113,838 Upper 90% CI 2,698,232 269,823 134,912 Lower 90% CI 1,855,281 185,528 92,764 Acanthurus leucosternon Total 8,345 835 417 Upper 90% CI 11,619 1,162 581 Lower 90% CI 5,072 507 254 Acanthurus lineatus Total 185,196 18,520 9,260 Upper 90% CI 214,710 21,471 10,735 Lower 90% CI 155,682 15,568 7,784 Acanthurus spp. Total 166,396 16,640 8,320 Upper 90% CI 195,422 19,542 9,771 Lower 90% CI 137,371 13,737 6,869 Acanthurus tennentii Total 2,500 250 125 Upper 90% CI 4,845 484 242 Lower 90% CI 154 15 8 Acanthurus triostegus Total 138,132 13,813 6,907 Upper 90% CI 167,226 16,723 8,361 Lower 90% CI 109,038 10,904 5,452 Acanthurus tristis Total 3,333 333 167 Upper 90% CI 7,594 759 380 Lower 90% CI - - - Aethaloperca rogaa Total 833 83 42 Upper 90% CI 1,898 190 95 Lower 90% CI - - - Apogon spp Total 64,489 6,449 3,224 Upper 90% CI 117,491 11,749 5,875 Lower 90% CI 11,487 1,149 574 Apolemichthys xanthurus Total 14,284 1,428 714 Upper 90% CI 22,971 2,297 1,149 Lower 90% CI 5,597 560 280 Arothron spp Total 9,675 967 484 Upper 90% CI 14,610 1,461 730 Lower 90% CI 4,740 474 237 Carcharhinus melanopterus Total 1,250 125 62 Upper 90% CI 2,848 285 142 Lower 90% CI - - - Centropyge eibli Total 3,359 336 168 Upper 90% CI 5,885 588 294 Lower 90% CI 834 83 42

Arjan Rajasuriya
34
Centropyge flavipectoralis Total 3,333 333 167 Upper 90% CI 7,594 759 380 Lower 90% CI - - - Centropyge multispinis Total 9,998 1,000 500 Upper 90% CI 15,708 1,571 785 Lower 90% CI 4,288 429 214 Cephalopholis argus Total 20,516 2,052 1,026 Upper 90% CI 35,119 3,512 1,756 Lower 90% CI 5,913 591 296 Cephalopholis formosa Total 10,978 1,098 549 Upper 90% CI 16,874 1,687 844 Lower 90% CI 5,082 508 254 Chaetodon auriga Total 26,415 2,642 1,321 Upper 90% CI 33,079 3,308 1,654 Lower 90% CI 19,751 1,975 988 Chaetodon citrinellus Total 47,888 4,789 2,394 Upper 90% CI 59,897 5,990 2,995 Lower 90% CI 35,879 3,588 1,794 Chaetodon decussatus Total 21,403 2,140 1,070 Upper 90% CI 29,606 2,961 1,480 Lower 90% CI 13,200 1,320 660 Chaetodon guttatissimus Total 8,332 833 417 Upper 90% CI 13,898 1,390 695 Lower 90% CI 2,765 277 138 Chaetodon lineolatus Total 1,720 172 86 Upper 90% CI 3,027 303 151 Lower 90% CI 412 41 21 Chaetodon lunula Total 2,500 250 125 Upper 90% CI 5,695 570 285 Lower 90% CI - - - Chaetodon meyeri Total 13,411 1,341 671 Upper 90% CI 17,486 1,749 874 Lower 90% CI 9,335 934 467 Chaetodon plebeius Total 847 85 42 Upper 90% CI 1,556 156 78 Lower 90% CI 137 14 7 Chaetodon trifascialis Total 417 42 21 Upper 90% CI 949 95 47 Lower 90% CI - - - Chaetodon trifasciatus Total 7,552 755 378 Upper 90% CI 11,155 1,116 558 Lower 90% CI 3,949 395 197

35
Chaetodon vagabundus Total 127,380 12,738 6,369 Upper 90% CI 145,519 14,552 7,276 Lower 90% CI 109,241 10,924 5,462 Chromis spp Total 502,535 50,253 25,127 Upper 90% CI 758,882 75,888 37,944 Lower 90% CI 246,187 24,619 12,309 Chrysiptera leucopoma Total 46,448 4,645 2,322 Upper 90% CI 59,099 5,910 2,955 Lower 90% CI 33,798 3,380 1,690 Cirrhilabrus rubrisquamis Total 1,290 129 64 Upper 90% CI 2,695 269 135 Lower 90% CI - - - Cirrhitichthys oxycephalus Total 11,704 1,170 585 Upper 90% CI 19,692 1,969 985 Lower 90% CI 3,717 372 186 Coris frerei Total 11,784 1,178 589 Upper 90% CI 16,178 1,618 809 Lower 90% CI 7,390 739 370 Ctenochaetus striatus Total 14,148 1,415 707 Upper 90% CI 21,837 2,184 1,092 Lower 90% CI 6,458 646 323 Diodon hystrix Total 2,150 215 107 Upper 90% CI 3,818 382 191 Lower 90% CI 481 48 24 Forcipiger flavissimus Total 2,526 253 126 Upper 90% CI 4,275 428 214 Lower 90% CI 777 78 39 Gomphosus caeruleus Total 29,684 2,968 1,484 Upper 90% CI 39,171 3,917 1,959 Lower 90% CI 20,198 2,020 1,010 Halichoeres argus Total 6,275 628 314 Upper 90% CI 11,530 1,153 576 Lower 90% CI 1,021 102 51 Halichoeres hortulanus Total 4,259 426 213 Upper 90% CI 7,226 723 361 Lower 90% CI 1,293 129 65 Halichoeres marginatus Total 112,150 11,215 5,607 Upper 90% CI 140,479 14,048 7,024 Lower 90% CI 83,820 8,382 4,191 Halichoeres spp Total 11,851 1,185 593 Upper 90% CI 17,426 1,743 871 Lower 90% CI 6,276 628 314

Arjan Rajasuriya
36
Hemigymnus fasciatus Total 430 43 21 Upper 90% CI 898 90 45 Lower 90% CI - - - Labroides dimidiatus Total 164,139 16,414 8,207 Upper 90% CI 190,905 19,090 9,545 Lower 90% CI 137,372 13,737 6,869 Macropharyngodon bipartitus Total 170,952 17,095 8,548 Upper 90% CI 209,783 20,978 10,489 Lower 90% CI 132,121 13,212 6,606 Macropharyngodon ornatus Total 4,729 473 236 Upper 90% CI 9,881 988 494 Lower 90% CI - - - Naso lituratus Total 3,333 333 167 Upper 90% CI 6,662 666 333 Lower 90% CI 3 0 0 Nemateleotris magnifica Total 4,166 417 208 Upper 90% CI 7,938 794 397 Lower 90% CI 394 39 20 Neopomacentrus azysron Total 4,202,918 420,292 210,146 Upper 90% CI 5,195,567 519,557 259,778 Lower 90% CI 3,210,270 321,027 160,513 Parupeneus bifasciatus Total 430 43 21 Upper 90% CI 898 90 45 Lower 90% CI - - - Parupeneus indicus Total 2,150 215 107 Upper 90% CI 4,491 449 225 Lower 90% CI - - - Parupeneus macronema Total 4,582 458 229 Upper 90% CI 8,663 866 433 Lower 90% CI 502 50 25 Parupeneus spp. Total 42,486 4,249 2,124 Upper 90% CI 56,397 5,640 2,820 Lower 90% CI 28,574 2,857 1,429 Plectorhinchus vittatus Total 5,846 585 292 Upper 90% CI 9,506 951 475 Lower 90% CI 2,185 218 109 Pomacanthus annularis Total 7,512 751 376 Upper 90% CI 10,725 1,072 536 Lower 90% CI 4,299 430 215 Pomacanthus semicirculatus Total 23,516 2,352 1,176 Upper 90% CI 29,935 2,994 1,497 Lower 90% CI 17,096 1,710 855
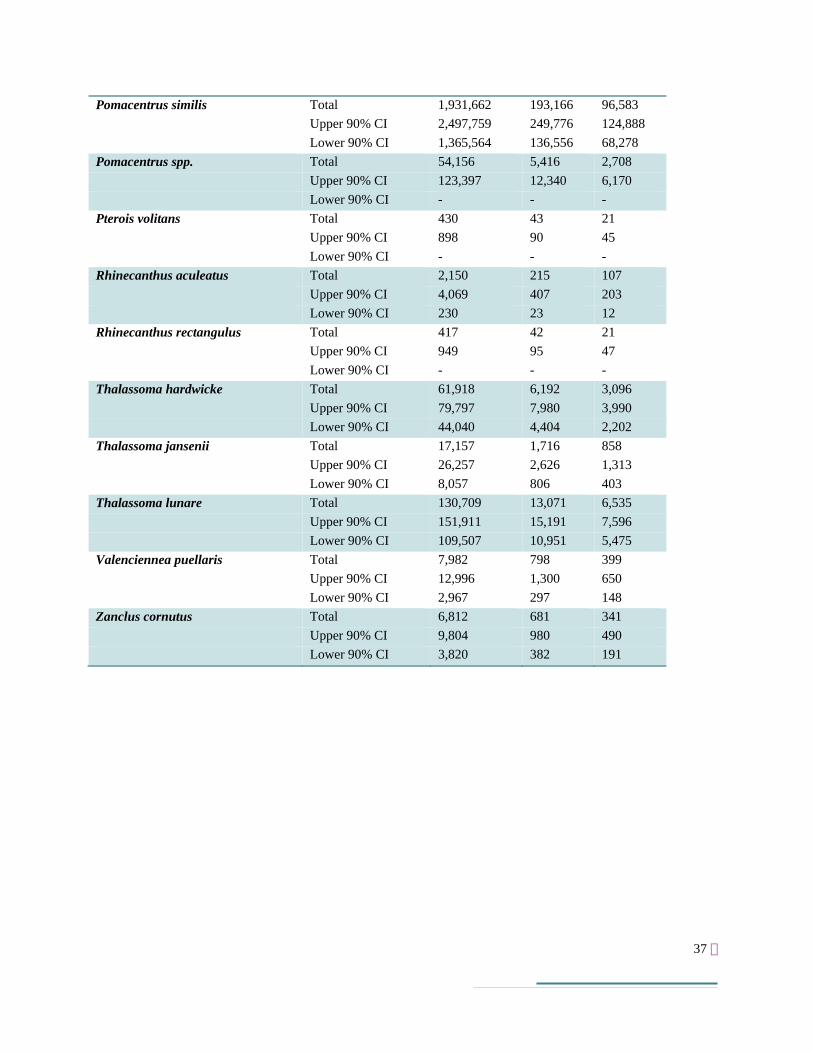
37
Pomacentrus similis Total 1,931,662 193,166 96,583 Upper 90% CI 2,497,759 249,776 124,888 Lower 90% CI 1,365,564 136,556 68,278 Pomacentrus spp. Total 54,156 5,416 2,708 Upper 90% CI 123,397 12,340 6,170 Lower 90% CI - - - Pterois volitans Total 430 43 21 Upper 90% CI 898 90 45 Lower 90% CI - - - Rhinecanthus aculeatus Total 2,150 215 107 Upper 90% CI 4,069 407 203 Lower 90% CI 230 23 12 Rhinecanthus rectangulus Total 417 42 21 Upper 90% CI 949 95 47 Lower 90% CI - - - Thalassoma hardwicke Total 61,918 6,192 3,096 Upper 90% CI 79,797 7,980 3,990 Lower 90% CI 44,040 4,404 2,202 Thalassoma jansenii Total 17,157 1,716 858 Upper 90% CI 26,257 2,626 1,313 Lower 90% CI 8,057 806 403 Thalassoma lunare Total 130,709 13,071 6,535 Upper 90% CI 151,911 15,191 7,596 Lower 90% CI 109,507 10,951 5,475 Valenciennea puellaris Total 7,982 798 399 Upper 90% CI 12,996 1,300 650 Lower 90% CI 2,967 297 148 Zanclus cornutus Total 6,812 681 341 Upper 90% CI 9,804 980 490 Lower 90% CI 3,820 382 191

Arjan Rajasuriya
38
Appendix 5 The abundance, maximum sustainable yield and the Total Allowable Catch for the recorded fish species in the Matara District.
Species Abundance MSY TAC Abudefduf vaigiensis Total 1,706,727 170,673 85,336 Upper 90%CI 2,082,322 208,232 104,116 Lower 90%CI 1,331,132 133,113 66,557 Acanthurus leucosternon Total 1,925 193 96 Upper 90%CI 3,601 360 180 Lower 90%CI 250 25 12 Acanthurus lineatus Total 88,111 8,811 4,406 Upper 90%CI 105,911 10,591 5,296 Lower 90%CI 70,311 7,031 3,516 Acanthurus spp. Total 49,480 4,948 2,474 Upper 90%CI 64,119 6,412 3,206 Lower 90%CI 34,841 3,484 1,742 Acanthurus triostegus Total 52,628 5,263 2,631 Upper 90%CI 67,659 6,766 3,383 Lower 90%CI 37,598 3,760 1,880 Acanthurus tristis Total 915 91 46 Upper 90%CI 2,060 206 103 Lower 90%CI - - - Amphiprion clarkii Total 457 46 23 Upper 90%CI 1,030 103 51 Lower 90%CI - - - Amphiprion sebae Total 457 46 23 Upper 90%CI 1,030 103 51 Lower 90%CI - - - Apogon spp Total 172,713 17,271 8,636 Upper 90%CI 331,179 33,118 16,559 Lower 90%CI 14,246 1,425 712 Apolemichthys xanthurus Total 1,372 137 69 Upper 90%CI 3,089 309 154 Lower 90%CI - - - Arothron spp Total 979 98 49 Upper 90%CI 2,028 203 101 Lower 90%CI - - - Cantherhines pardalis Total 979 98 49 Upper 90%CI 2,028 203 101 Lower 90%CI - - -

39
Canthigaster solandri Total 1,468 147 73 Upper 90%CI 2,354 235 118 Lower 90%CI 582 58 29 Centropyge eibli Total 2,744 274 137 Upper 90%CI 4,655 465 233 Lower 90%CI 833 83 42 Centropyge multispinis Total 7,935 793 397 Upper 90%CI 12,571 1,257 629 Lower 90%CI 3,298 330 165 Cephalopholis argus Total 8,817 882 441 Upper 90%CI 11,802 1,180 590 Lower 90%CI 5,833 583 292 Chaetodon auriga Total 14,295 1,430 715 Upper 90%CI 20,981 2,098 1,049 Lower 90%CI 7,609 761 380 Chaetodon citrinellus Total 14,880 1,488 744 Upper 90%CI 21,279 2,128 1,064 Lower 90%CI 8,482 848 424 Chaetodon collare Total 2,446 245 122 Upper 90%CI 3,986 399 199 Lower 90%CI 907 91 45 Chaetodon decussatus Total 11,551 1,155 578 Upper 90%CI 16,987 1,699 849 Lower 90%CI 6,115 611 306 Chaetodon guttatissimus Total 915 91 46 Upper 90%CI 2,060 206 103 Lower 90%CI - - - Chaetodon kleinii Total 1,372 137 69 Upper 90%CI 2,634 263 132 Lower 90%CI 110 11 6 Chaetodon lineolatus Total 1,829 183 91 Upper 90%CI 3,189 319 159 Lower 90%CI 470 47 23 Chaetodon lunula Total 18,454 1,845 923 Upper 90%CI 27,648 2,765 1,382 Lower 90%CI 9,260 926 463 Chaetodon meyeri Total 11,232 1,123 562 Upper 90%CI 15,177 1,518 759 Lower 90%CI 7,287 729 364 Chaetodon plebeius Total 7,935 793 397 Upper 90%CI 11,431 1,143 572 Lower 90%CI 4,438 444 222

Arjan Rajasuriya
40
Chaetodon trifasciatus Total 13,125 1,313 656 Upper 90%CI 20,662 2,066 1,033 Lower 90%CI 5,588 559 279 Chaetodon vagabundus Total 97,492 9,749 4,875 Upper 90%CI 109,711 10,971 5,486 Lower 90%CI 85,273 8,527 4,264 Chaetodon xanthocephalus Total 979 98 49 Upper 90%CI 2,028 203 101 Lower 90%CI - - - Cheilinus chlorourus Total 1,829 183 91 Upper 90%CI 4,119 412 206 Lower 90%CI - - - Chromis spp Total 871,301 87,130 43,565 Upper 90%CI 1,267,852 126,785 63,393 Lower 90%CI 474,749 47,475 23,737 Chrysiptera leucopoma Total 54,032 5,403 2,702 Upper 90%CI 66,913 6,691 3,346 Lower 90%CI 41,152 4,115 2,058 Coris frerei Total 9,700 970 485 Upper 90%CI 14,104 1,410 705 Lower 90%CI 5,296 530 265 Ctenochaetus striatus Total 489 49 24 Upper 90%CI 1,014 101 51 Lower 90%CI - - - Ecsenius bicolor Total 1,829 183 91 Upper 90%CI 3,419 342 171 Lower 90%CI 239 24 12 Gomphosus caeruleus Total 43,098 4,310 2,155 Upper 90%CI 53,293 5,329 2,665 Lower 90%CI 32,902 3,290 1,645 Halichoeres hortulanus Total 3,691 369 185 Upper 90%CI 5,544 554 277 Lower 90%CI 1,837 184 92 Halichoeres marginatus Total 46,087 4,609 2,304 Upper 90%CI 60,773 6,077 3,039 Lower 90%CI 31,401 3,140 1,570 Halichoeres spp Total 5,946 595 297 Upper 90%CI 12,305 1,231 615 Lower 90%CI - - - Hemigymnus fasciatus Total 489 49 24 Upper 90%CI 1,014 101 51 Lower 90%CI - - -

41
Labroides dimidiatus Total 86,249 8,625 4,312 Upper 90%CI 97,938 9,794 4,897 Lower 90%CI 74,560 7,456 3,728 Lutjanus kasmira Total 3,425 342 171 Upper 90%CI 7,099 710 355 Lower 90%CI - - - Macropharyngodon bipartitus Total 14,189 1,419 709 Upper 90%CI 26,220 2,622 1,311 Lower 90%CI 2,158 216 108 Macropharyngodon ornatus Total 43,311 4,331 2,166 Upper 90%CI 63,333 6,333 3,167 Lower 90%CI 23,289 2,329 1,164 Naso lituratus Total 489 49 24 Upper 90%CI 1,014 101 51 Lower 90%CI - - - Nemateleotris magnifica Total 6,860 686 343 Upper 90%CI 12,949 1,295 647 Lower 90%CI 771 77 39 Neopomacentrus azysron Total 3,804,168 380,417 190,208 Upper 90%CI 5,133,797 513,380 256,690 Lower 90%CI 2,474,539 247,454 123,727 Parupeneus bifasciatus Total 915 91 46 Upper 90%CI 2,060 206 103 Lower 90%CI - - - Parupeneus indicus Total 979 98 49 Upper 90%CI 1,712 171 86 Lower 90%CI 246 25 12 Parupeneus spp. Total 4,829 483 241 Upper 90%CI 9,182 918 459 Lower 90%CI 476 48 24 Platax teira Total 1,829 183 91 Upper 90%CI 3,620 362 181 Lower 90%CI 39 4 2 Plectorhinchus vittatus Total 489 49 24 Upper 90%CI 1,014 101 51 Lower 90%CI - - - Pomacanthus annularis Total 7,381 738 369 Upper 90%CI 11,682 1,168 584 Lower 90%CI 3,081 308 154 Pomacanthus imperator Total 489 49 24 Upper 90%CI 1,014 101 51 Lower 90%CI - - -

Arjan Rajasuriya
42
Pomacanthus semicirculatus Total 22,432 2,243 1,122 Upper 90%CI 27,939 2,794 1,397 Lower 90%CI 16,925 1,692 846 Pomacentrus similis Total 795,449 79,545 39,772 Upper 90%CI 1,105,374 110,537 55,269 Lower 90%CI 485,524 48,552 24,276 Pomacentrus spp. Total 3,659 366 183 Upper 90%CI 8,238 824 412 Lower 90%CI - - - Rhinecanthus aculeatus Total 8,392 839 420 Upper 90%CI 13,693 1,369 685 Lower 90%CI 3,090 309 155 Scarus spp Total 3,425 342 171 Upper 90%CI 5,667 567 283 Lower 90%CI 1,182 118 59 Scomberomorus spp Total 979 98 49 Upper 90%CI 2,028 203 101 Lower 90%CI - - - Thalassoma hardwicke Total 19,156 1,916 958 Upper 90%CI 26,018 2,602 1,301 Lower 90%CI 12,294 1,229 615 Thalassoma jansenii Total 20,422 2,042 1,021 Upper 90%CI 30,252 3,025 1,513 Lower 90%CI 10,591 1,059 530 Thalassoma lunare Total 57,276 5,728 2,864 Upper 90%CI 75,015 7,502 3,751 Lower 90%CI 39,537 3,954 1,977 Valenciennea puellaris Total 1,893 189 95 Upper 90%CI 3,447 345 172 Lower 90%CI 340 34 17 Zanclus cornutus Total 6,297 630 315 Upper 90%CI 10,765 1,077 538 Lower 90%CI 1,828 183 91 Zebrasoma scopas Total 915 91 46 Upper 90%CI 2,060 206 103 Lower 90%CI - - -
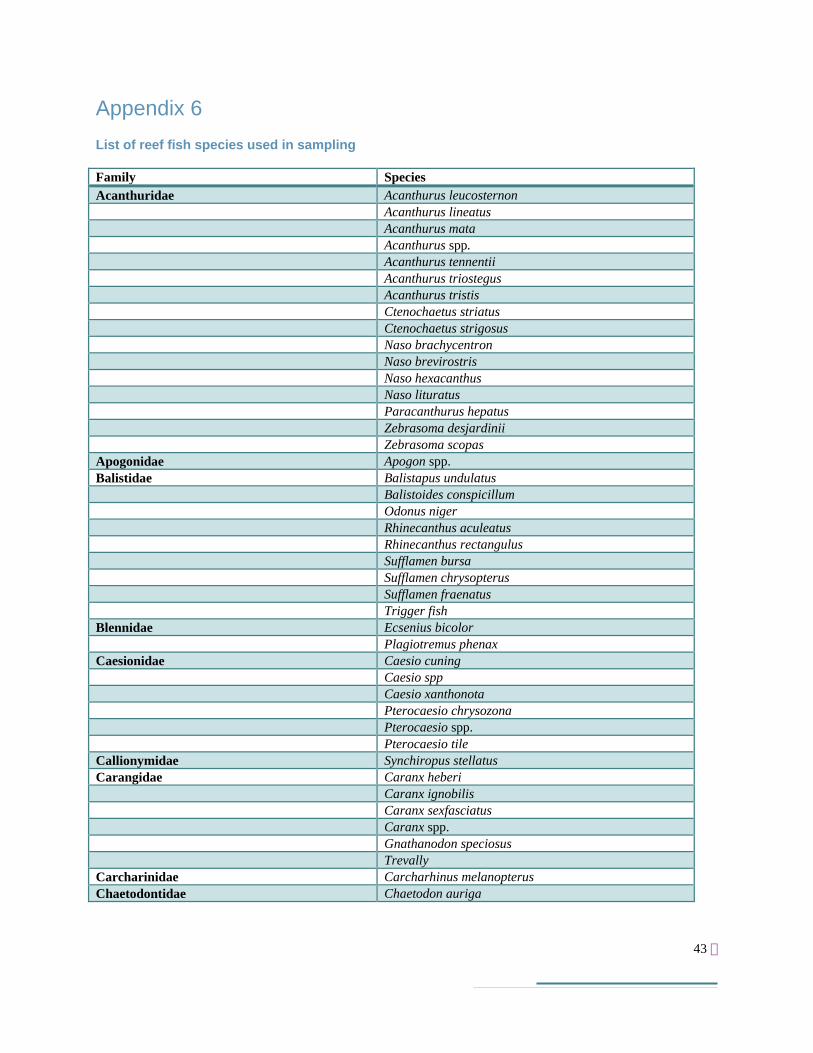
43
Appendix 6 List of reef fish species used in sampling
Family Species Acanthuridae Acanthurus leucosternon Acanthurus lineatus Acanthurus mata Acanthurus spp. Acanthurus tennentii Acanthurus triostegus Acanthurus tristis Ctenochaetus striatus Ctenochaetus strigosus Naso brachycentron Naso brevirostris Naso hexacanthus Naso lituratus Paracanthurus hepatus Zebrasoma desjardinii Zebrasoma scopas Apogonidae Apogon spp. Balistidae Balistapus undulatus Balistoides conspicillum Odonus niger Rhinecanthus aculeatus Rhinecanthus rectangulus Sufflamen bursa Sufflamen chrysopterus Sufflamen fraenatus Trigger fish Blennidae Ecsenius bicolor Plagiotremus phenax Caesionidae Caesio cuning Caesio spp Caesio xanthonota Pterocaesio chrysozona Pterocaesio spp. Pterocaesio tile Callionymidae Synchiropus stellatus Carangidae Caranx heberi Caranx ignobilis Caranx sexfasciatus Caranx spp. Gnathanodon speciosus Trevally Carcharinidae Carcharhinus melanopterus Chaetodontidae Chaetodon auriga
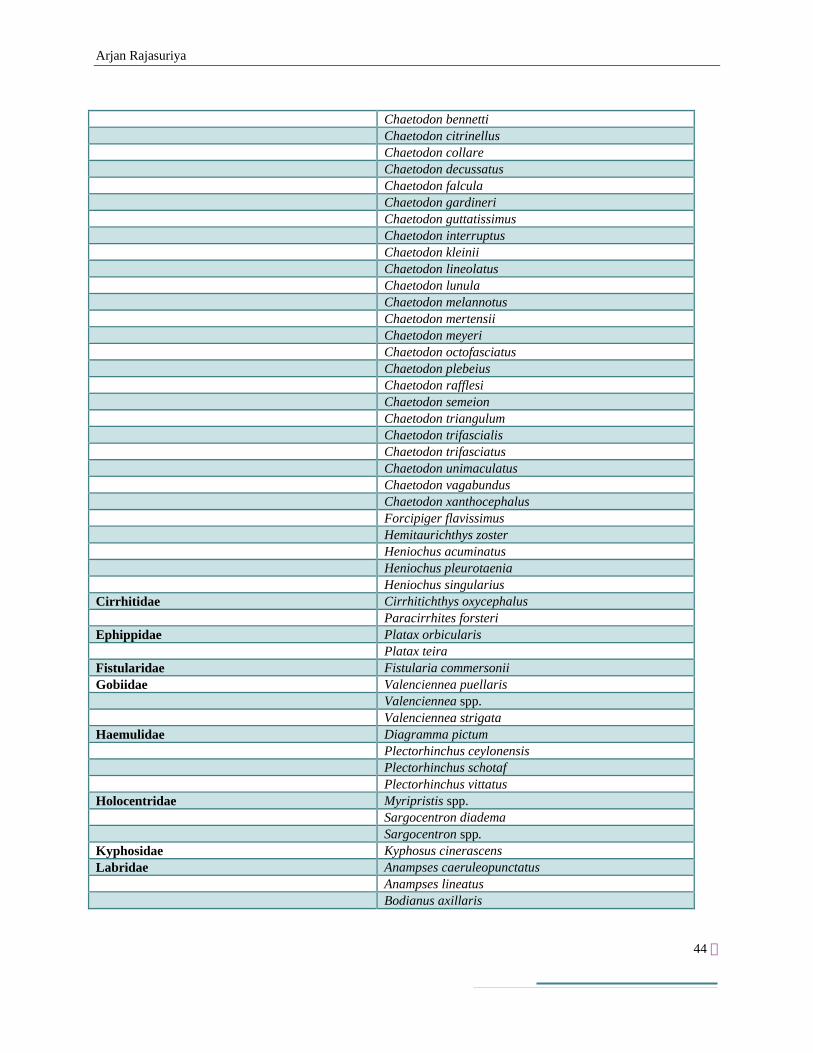
Arjan Rajasuriya
44
Chaetodon bennetti Chaetodon citrinellus Chaetodon collare Chaetodon decussatus Chaetodon falcula Chaetodon gardineri Chaetodon guttatissimus Chaetodon interruptus Chaetodon kleinii Chaetodon lineolatus Chaetodon lunula Chaetodon melannotus Chaetodon mertensii Chaetodon meyeri Chaetodon octofasciatus Chaetodon plebeius Chaetodon rafflesi Chaetodon semeion Chaetodon triangulum Chaetodon trifascialis Chaetodon trifasciatus Chaetodon unimaculatus Chaetodon vagabundus Chaetodon xanthocephalus Forcipiger flavissimus Hemitaurichthys zoster Heniochus acuminatus Heniochus pleurotaenia Heniochus singularius Cirrhitidae Cirrhitichthys oxycephalus Paracirrhites forsteri Ephippidae Platax orbicularis Platax teira Fistularidae Fistularia commersonii Gobiidae Valenciennea puellaris Valenciennea spp. Valenciennea strigata Haemulidae Diagramma pictum Plectorhinchus ceylonensis Plectorhinchus schotaf Plectorhinchus vittatus Holocentridae Myripristis spp. Sargocentron diadema Sargocentron spp. Kyphosidae Kyphosus cinerascens Labridae Anampses caeruleopunctatus Anampses lineatus Bodianus axillaris

45
Bodianus diana Bodianus neilli Cheilinus chlorourus Cheilinus undulatus Cirrhilabrus rubrisquamis Coris frerei Gomphosus caeruleus Halichoeres argus Halichoeres hortulanus Halichoeres leucoxanthus Halichoeres marginatus Halichoeres spp. Hemigymnus fasciatus Hemigymnus melapterus Labroides bicolor Labroides dimidiatus Macropharyngodon bipartitus Macropharyngodon meleagris Macropharyngodon ornatus Novaculichthys taeniourus Stethojulis spp. Thalassoma hardwicke Thalassoma jansenii Thalassoma lunare Lethrinidae Lethrinus harak Lethrinus nebulosus Lethrinus spp. Lutjanidae Lutjanus argentimaculatus Lutjanus biguttatus Lutjanus bohar Lutjanus decussatus Lutjanus fulviflamma Lutjanus fulvus Lutjanus gibbus Lutjanus kasmira Lutjanus lunulatus Lutjanus malabaricus Lutjanus quinquelineatus Lutjanus rivulatus Lutjanus spp. Microdesmidae Nemateleotris magnifica Ptereleotris evides Ptereleotris heteroptera Ptereleotris spp. Monacanthidae Cantherhines pardalis Mullidae Mulloidichthys flavolineatus Mulloidichthys vanicolensis Parupeneus bifasciatus

Arjan Rajasuriya
46
Parupeneus indicus Parupeneus macronema Parupeneus spp. Nemipteridae Scolopsis spp. Ostraciidae Ostracion cubicus Ostracion meleagris Pinguipedidae Parapercis clathrata Pomacanthidae Apolemichthys xanthurus Centropyge eibli Centropyge flavipectoralis Centropyge multispinis Pomacanthus annularis Pomacanthus imperator Pomacanthus semicirculatus Pomacentridae Abudefduf vaigiensis Amphiprion clarkii Amphiprion nigripes Amphiprion sebae Chromis dimidiata Chromis spp. Chrysiptera kuiteri Chrysiptera leucopoma Dascyllus aruanus Dascyllus carneus Dascyllus spp. Dascyllus trimaculatus Neopomacentrus azysron Neopomacentrus cyanomos Pomacentrus similis Pomacentrus spp. Pseudochromidae Pseudochromis fuscus Scaridae Chlorurus rhakoura Parrot fish Scarus ghobban Scarus niger Scarus rubroviolaceus Scarus sordidus Scarus spp. Scombridae Scomberomorus spp Scorpaenidae Pterois antennata Pterois miles Pterois volitans Serranidae Aethaloperca rogaa Cephalopholis argus Cephalopholis formosa Cephalopholis miniata Cephalopholis sonnerati Cephalopholis spp.

47
Epinephelus caeruleopunctatus Epinephelus fasciatus Epinephelus faveatus Epinephelus flavocaeruleus Epinephelus fuscoguttatus Epinephelus hexagonatus Epinephelus malabaricus Epinephelus merra Epinephelus polyphekadion Epinephelus quoyanus Epinephelus spp. Plectropomus areolatus Plectropomus laevis Plectropomus leopardus Plectropomus spp. Pseudanthias spp. Pseudanthias squamipinnis Variola louti Siganidae Siganus javus Siganus lineatus Siganus rivulatus Siganus spp. Sphyraenidae Sphyraena barracuda Sphyraena spp. Tetraodontidae Arothron hispidus Arothron spp. Canthigaster solandri Canthigaster valentini Diodon holocanthus Diodon hystrix Zanclidae Zanclus cornutus

Arjan Rajasuriya
48
Appendix 7 List of species of fish and invertebrates prohibited from export in live form (Part 1) under the Fisheries and Aquatic Resources Act No. 2 of 1996
Family Species Chaetodontidae Chaetodon semeion Pomacanthidae Centropyge bispinosus Pygoplites diacanthus Labridae Coris aygula Labroides bicolor Scorpaenidae Pterois radiata Ephippidae Platax pinnatus Serranidae Epinephelus lanceolatus Epinephelus flavocaeruleus Haemulidae Plectorhinchus obscurum Plectorhinchus albovittatus Pomacentridae Chrysiptera kuiteri

49
Appendix 8 List of species of marine fish (Restricted Export) that require a permit for export in live form (Part II) under the Fisheries and Aquatic Resources Act No. 2 of 1996
Family Species Chaetodontidae Chaetodon octofasciatus Chaetodon ornatissimus Chaetodon falcula Chaetodon xanthocephalus Chaetodon ephippium Chaetodon unimaculatus Chaetodon madagascariensis Chaetodon bennetti Chaetodon meyeri Chaetodon triangulum Heniochus monoceros Heniochus pleurotaenia Pomacanthidae Centropyge flavipectoralis Balistidae Balistoides conspicillum Pseudobalistes fuscus Serranidae Variola louti Variola albimarginata