Stat.Presentation Of Data Swine Flu
28
-
Upload
angelina-pascua-lumbre -
Category
Education
-
view
874 -
download
3
description
Lesson on Mean, Median and Mode for grouped data
Transcript of Stat.Presentation Of Data Swine Flu


Ungrouped data1st term grades of iii-reverence in math
for the sy 2008-2009
GradesGrades Frequency (Frequency (ff))
68 1
73 1
74 4
75 3
76 1
77 1
78 6
79 7
80 6
81 7
82 2
86 3
89 2

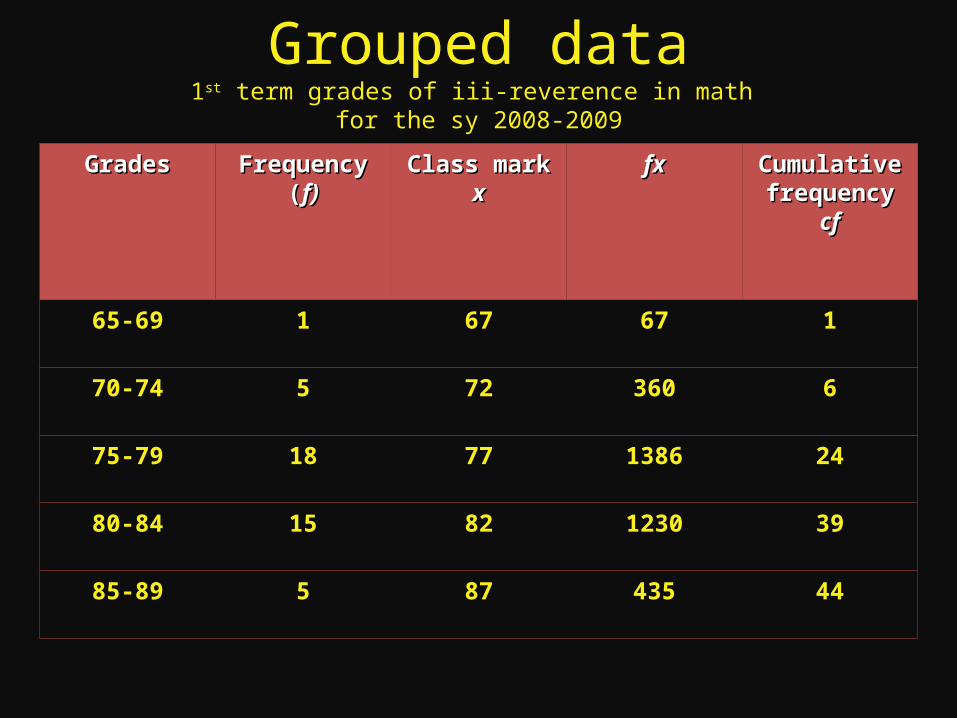
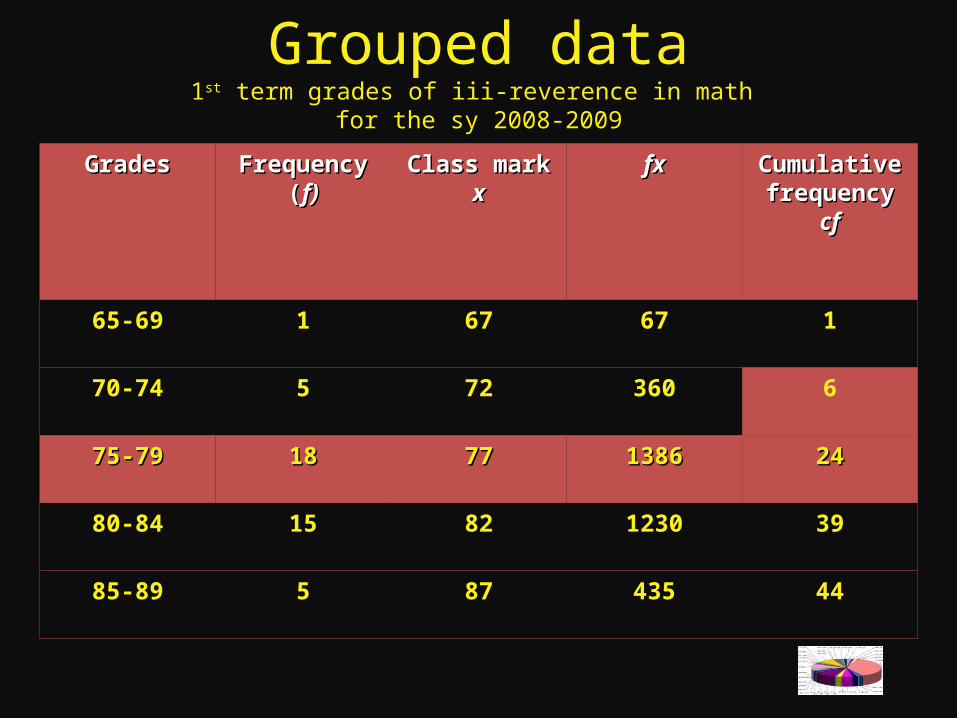
Grouped data1st term grades of iii-reverence in math
for the sy 2008-2009
GradesGrades Frequency Frequency ((ff))
Class markClass markxx
fxfx Cumulative Cumulative frequencyfrequency
cfcf
65-69 1 67 67 1
70-74 5 72 360 6
75-79 18 77 1386 24
80-84 15 82 1230 39
85-89 5 87 435 44

Presentation of dataFor grouped data:
histogram
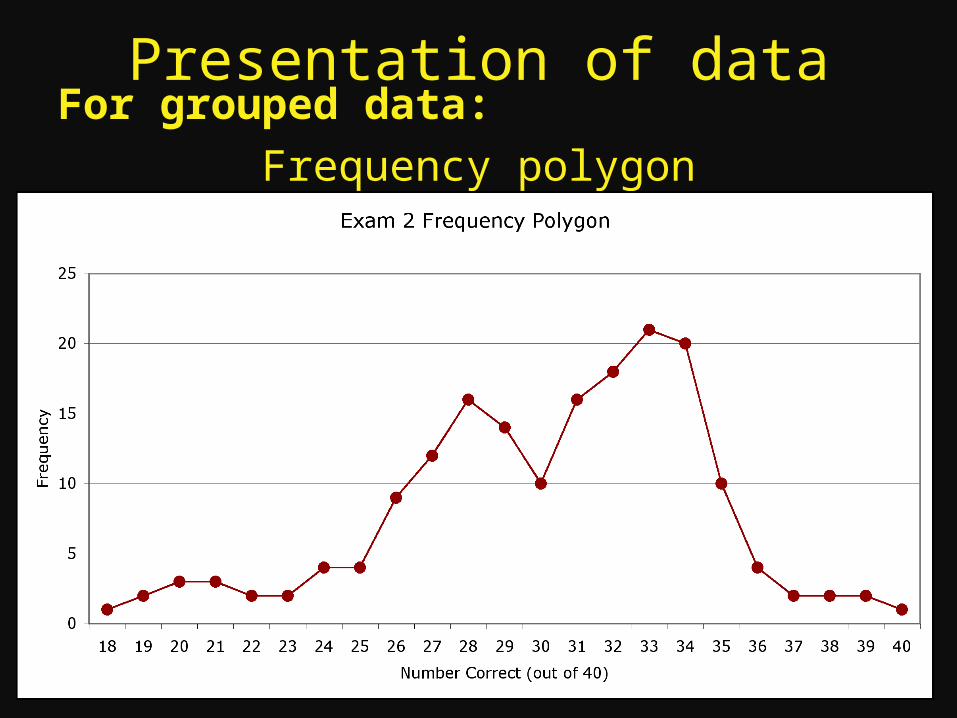
Presentation of dataFor grouped data:
Frequency polygon
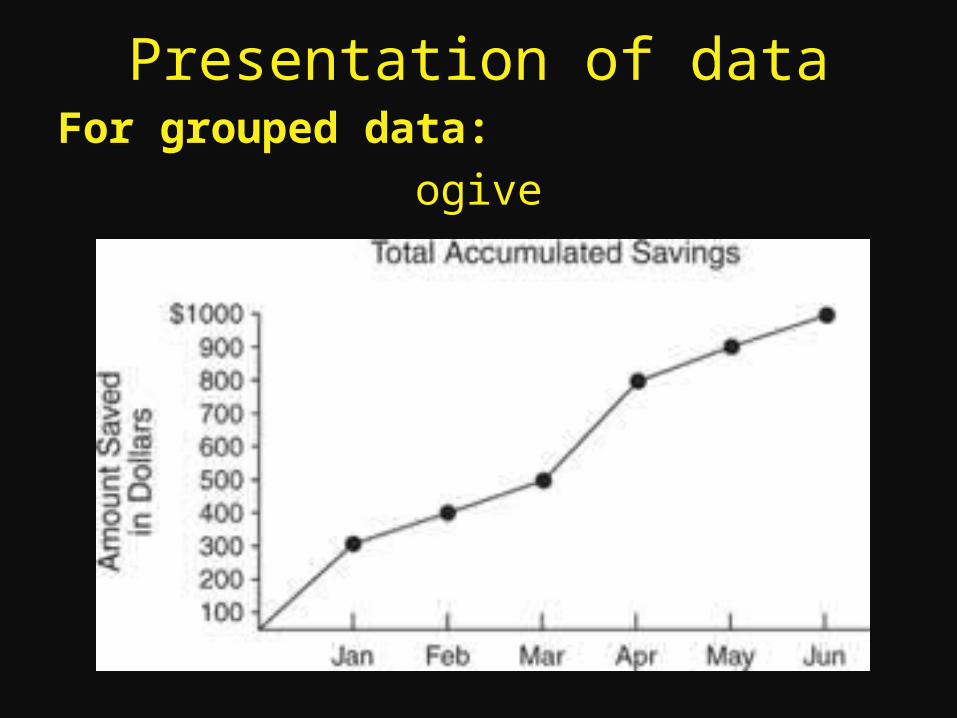
Presentation of dataFor grouped data:
ogive
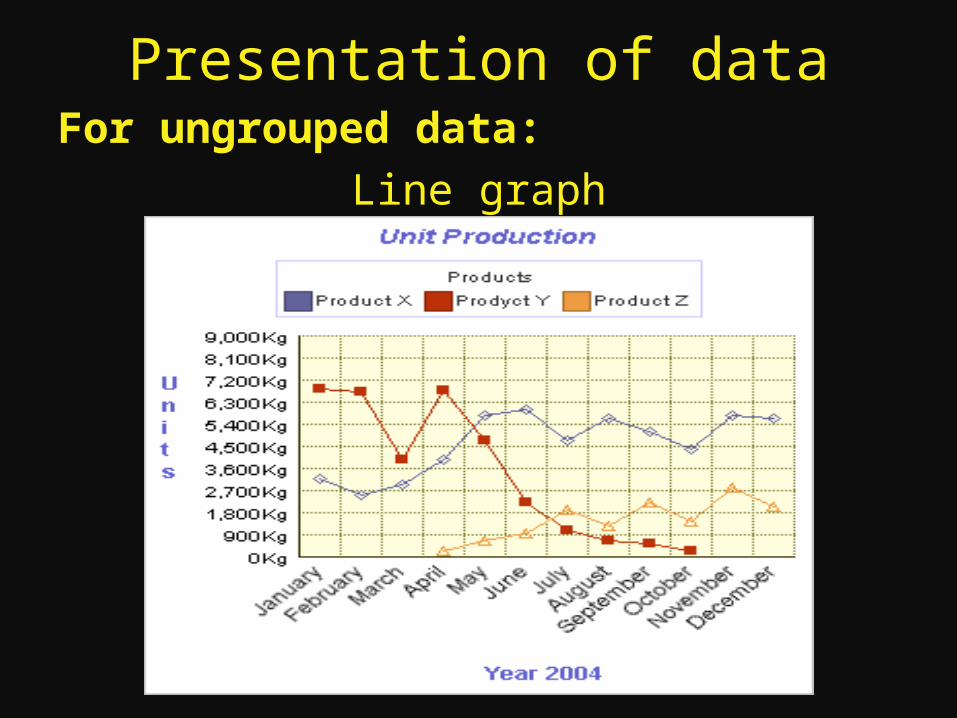
Presentation of dataFor ungrouped data:
Line graph
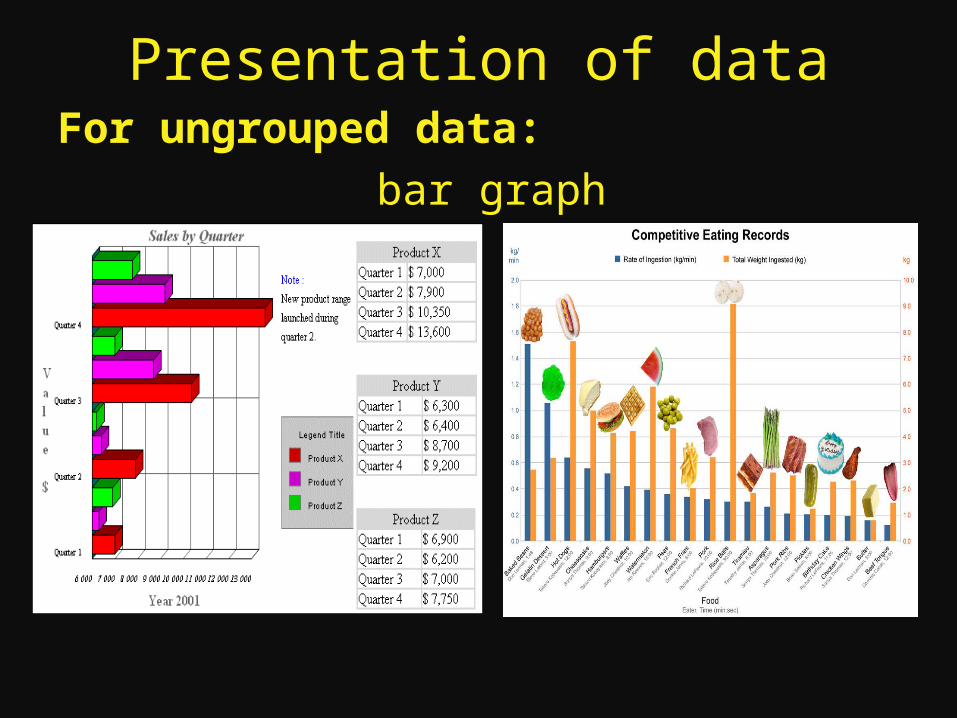
Presentation of dataFor ungrouped data:
bar graph
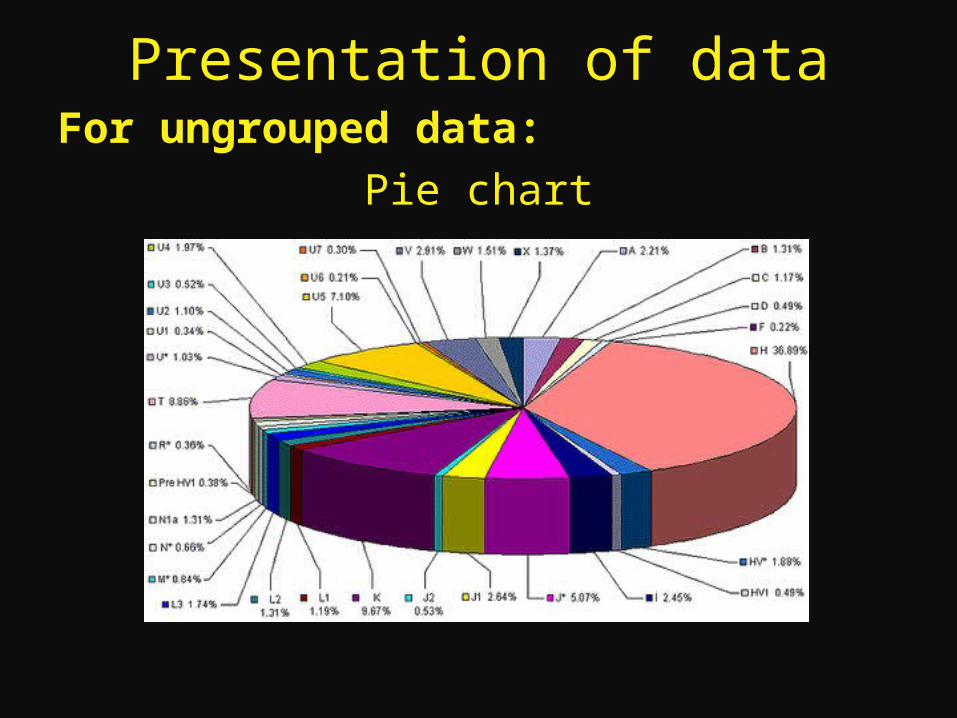
Presentation of dataFor ungrouped data:
Pie chart
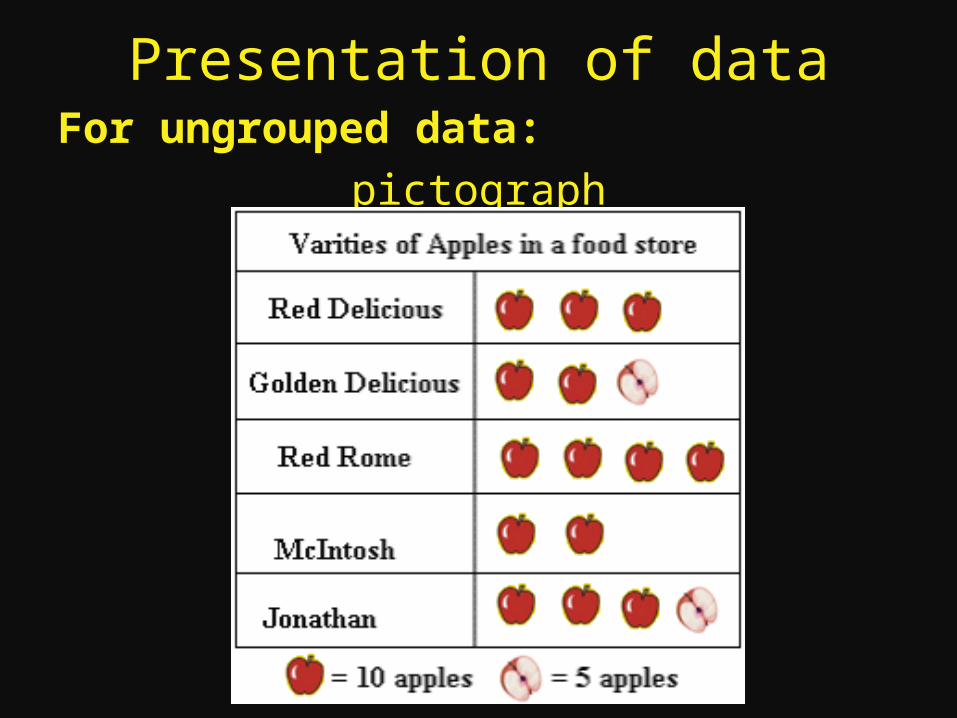
Presentation of dataFor ungrouped data:
pictograph
Grouped data
To solve for the mean Divide the sum of the product of all the
class marks and frequency by the sum of all the frequency.
Grouped data
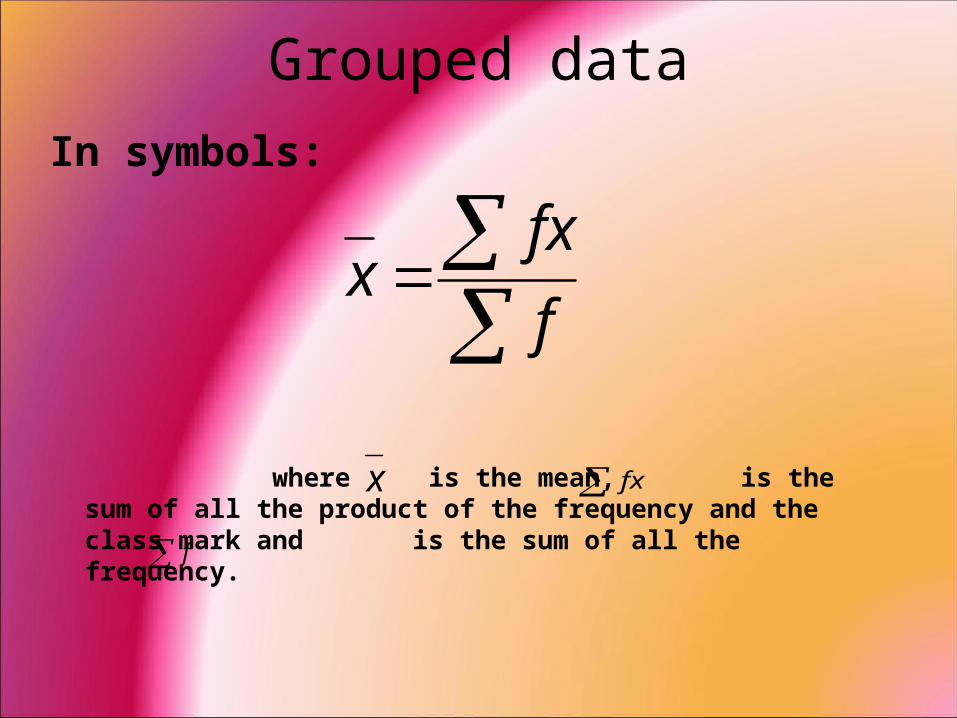
In symbols:
where is the mean, is the sum of
all the product of the frequency and the class mark and is the sum of all the frequency.
f
fxx
x fx
f

Grouped data1st term grades of iii-reverence in math
for the sy 2008-2009
GradesGrades Frequency Frequency ((ff))
Class markClass markxx
fxfx Cumulative Cumulative frequencyfrequency
cfcf
65-69 1 67 67 1
70-74 5 72 360 6
75-79 18 77 1386 24
80-84 15 82 1230 39
85-89 5 87 435 44

Grouped data
To solve for the median 1. Locate the median class (the
interval that contains the middle point of the observation). This is found through the cumulative frequency column.
Grouped data1st term grades of iii-reverence in math
for the sy 2008-2009
GradesGrades Frequency Frequency ((ff))
Class markClass markxx
fxfx Cumulative Cumulative frequencyfrequency
cfcf
65-69 1 67 67 1
70-74 5 72 360 6
75-79 18 77 1386 24
80-84 15 82 1230 39
85-89 5 87 435 44

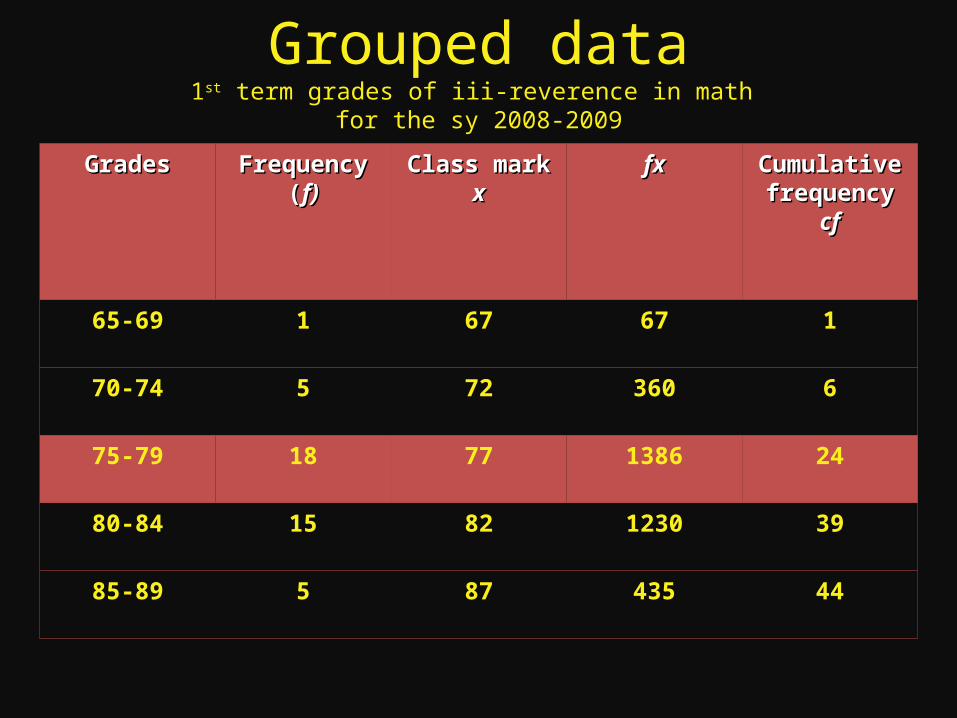
Grouped data1st term grades of iii-reverence in math
for the sy 2008-2009
GradesGrades Frequency Frequency ((ff))
Class markClass markxx
fxfx Cumulative Cumulative frequencyfrequency
cfcf
65-69 1 67 67 1
70-74 5 72 360 6
75-7975-79 1818 7777 13861386 2424
80-84 15 82 1230 39
85-89 5 87 435 44
Grouped data
To solve for the median 2. Identify the lower class boundary of
the median class, the cumulative frequency of the interval before the median class and the class width.

Grouped data1st term grades of iii-reverence in math
for the sy 2008-2009
GradesGrades Frequency Frequency ((ff))
Class markClass markxx
fxfx Cumulative Cumulative frequencyfrequency
cfcf
65-69 1 67 67 1
70-74 5 72 360 6
75-7975-79 1818 7777 13861386 2424
80-84 15 82 1230 39
85-89 5 87 435 44
Grouped data
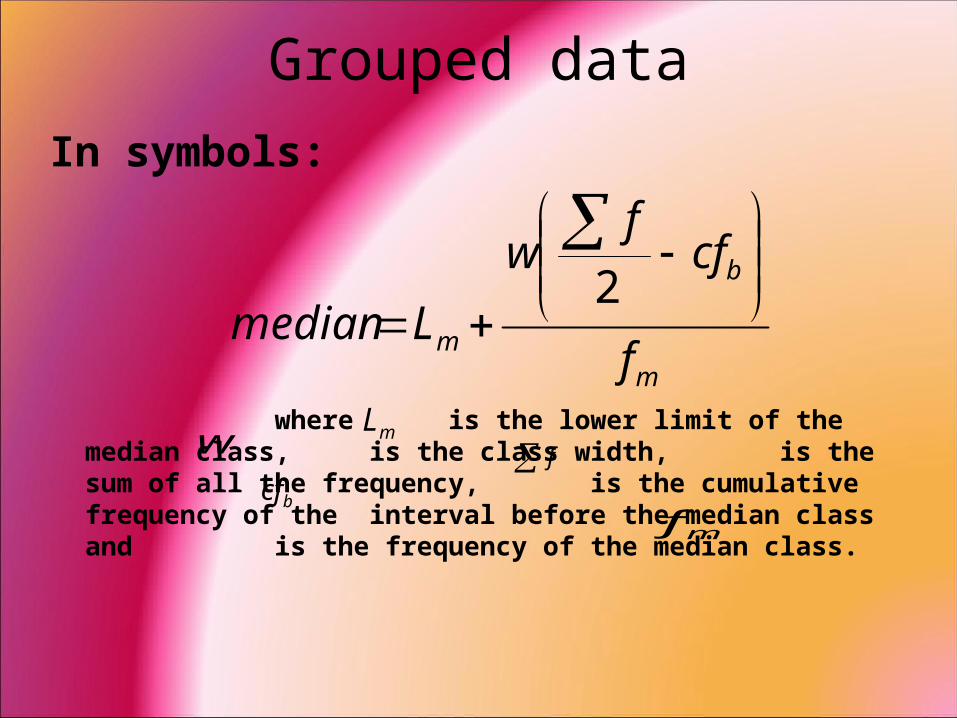
In symbols:
where is the lower limit of the
median class, is the class width, is the sum of all the frequency, is the cumulative frequency of the interval before the median class and is the frequency of the median class.
f
m
b
m f
cff
w
Lmedian
2
mLw
bcfmf
Grouped data1st term grades of iii-reverence in math
for the sy 2008-2009
GradesGrades Frequency Frequency ((ff))
Class markClass markxx
fxfx Cumulative Cumulative frequencyfrequency
cfcf
65-69 1 67 67 1
70-74 5 72 360 6
75-7975-79 1818 7777 13861386 2424
80-84 15 82 1230 39
85-89 5 87 435 44

Grouped data
To solve for the mode Simply identify the midpoint of the
interval with the largest number of class frequency.

Grouped data1st term grades of iii-reverence in math
for the sy 2008-2009
GradesGrades Frequency Frequency ((ff))
Class markClass markxx
fxfx Cumulative Cumulative frequencyfrequency
cfcf
65-69 1 67 67 1
70-74 5 72 360 6
75-79 18 77 1386 24
80-84 15 82 1230 39
85-89 5 87 435 44
Grouped data1st term grades of iii-reverence in math
for the sy 2008-2009
GradesGrades Frequency Frequency ((ff))
Class markClass markxx
fxfx Cumulative Cumulative frequencyfrequency
cfcf
65-69 1 67 67 1
70-74 5 72 360 6
75-79 18 77 1386 24
80-84 15 82 1230 39
85-89 5 87 435 44
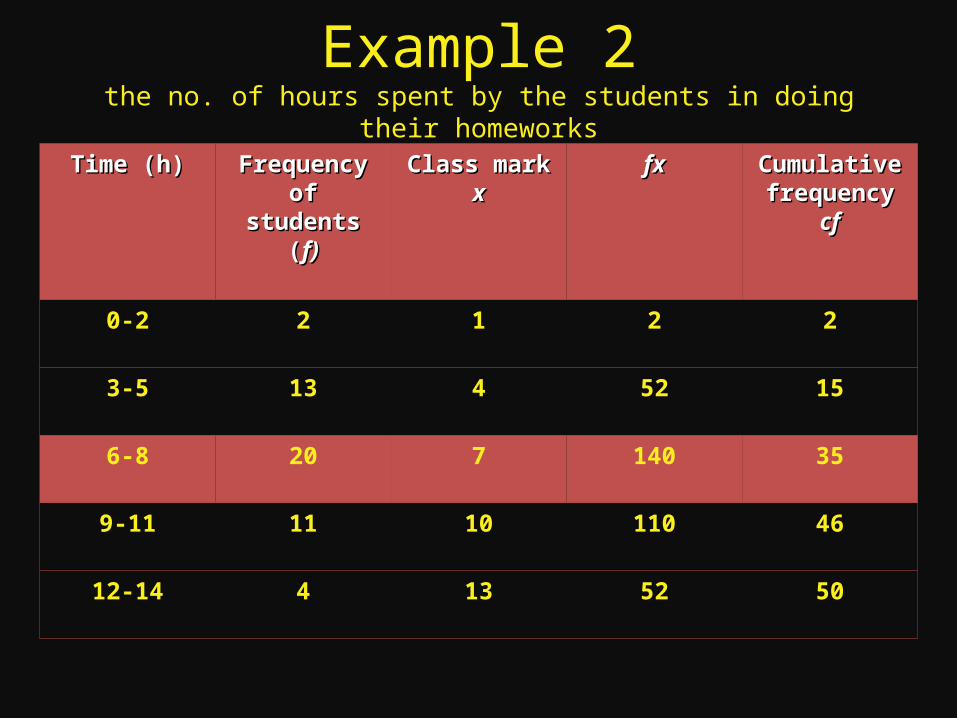
Example 2the no. of hours spent by the students in doing their
homeworksTime (h)Time (h) Frequency Frequency
of studentsof students((ff))
Class markClass markxx
fxfx Cumulative Cumulative frequencyfrequency
cfcf
0-2 2 1 2 2
3-5 13 4 52 15
6-8 20 7 140 35
9-11 11 10 110 46
12-14 4 13 52 50

synthesis
1. Recite the formula for solving the mean, median and mode.
2. How can we use this lesson in real life?
3. discuss way/s on how you can easily memorize the formula for solving the mean, median and mode?
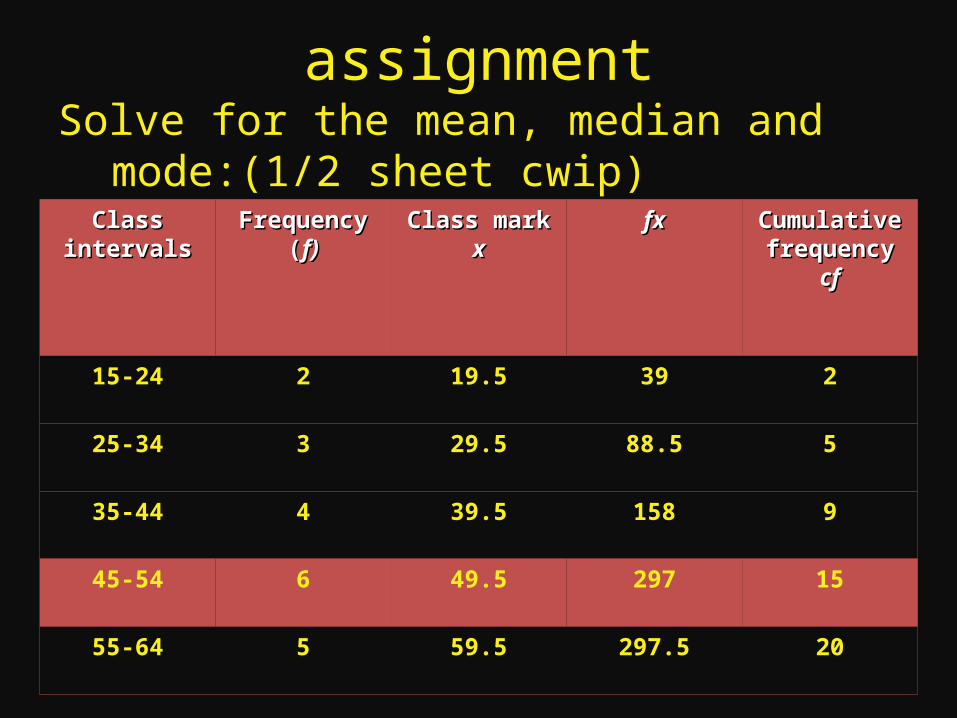
assignmentSolve for the mean, median and mode:
(1/2 sheet cwip) Class Class intervalsintervals
Frequency Frequency ((ff))
Class markClass markxx
fxfx Cumulative Cumulative frequencyfrequency
cfcf
15-24 2 19.5 39 2
25-34 3 29.5 88.5 5
35-44 4 39.5 158 9
45-54 6 49.5 297 15
55-64 5 59.5 297.5 20