
Statistiek I - Questionnaires
19
Motivation Correlation Cronbach’s α Statistiek I Questionnaires John Nerbonne CLCG, Rijksuniversiteit Groningen http://www.let.rug.nl/nerbonne/teach/Statistiek-I/ John Nerbonne 1/17
Transcript of Statistiek I - Questionnaires

Motivation Correlation Cronbach’s α
Statistiek IQuestionnaires
John Nerbonne
CLCG, Rijksuniversiteit Groningen
http://www.let.rug.nl/nerbonne/teach/Statistiek-I/
John Nerbonne 1/17
Motivation Correlation Cronbach’s α
Motivation: Questionnaires — a simple way to get data
Do people find foreign accents attractive? (Martijn Wieling, MonaTimmermeister, Kaitlin Mignella)Do teenagers trust information from health organizations? (EllenHoogstraten)How effective are (health) campaigns appealing to fear? (Carel Jansen)
Just ask! ... noting obvious potential problems (honesty, “correctness”, ...)
Analyse data as numerical (Likkert scale data) or categorical (as proportions),which have been treated earlier in the course.
John Nerbonne 2/17

Motivation Correlation Cronbach’s α
Problem: How to ask the right question?
Example: Do teenagers trust information from the community health center?
Is it important what sort of information is being sought?—Ask questions about different sorts of information?
How many teenagers link the abstract question to concrete events, e.g.being worried about sexually transmitted diseases?How many know the community health center by name?
—Or is it enough to show the sort of information offered(screenshot)?
To solve some of these problems, researchers typically ask several questions,all aimed at acquiring similar information.
If the answers CORRELATE well, the results of the questionnaire are moreRELIABLE.
John Nerbonne 3/17

Motivation Correlation Cronbach’s α
Reliability and Validity in Tests
Cronbach’s α shows how to combine questionnaire items to improve reliability.John Nerbonne 4/17

Motivation Correlation Cronbach’s α
Correlation
We often wish to compare two different variables
Examples: compare results on two distinct testsage and abilityeducation (in years) and incomespeed and accuracy
Methods to compare two (or more) variables:Correlation coefficient
Notice:Correlation only for numeric variables!
—Yes/No will be converted to 0/1
John Nerbonne 5/17

Motivation Correlation Cronbach’s α
Correlation coefficient
How do you know if you are going to do well in a stats course?
Suppose you spend a lot of time on the material—more than your averageclass mate—then you’ll have a high z-score in the distribution of study time.
You know that, generally, study time predicts grades.
So you know that you should have a high z-score in the distribution of grades.
If your final grade is not so good, you probably didn’t spend much timestudying. You would be below the mean in both distributions and havenegative z-scores.
John Nerbonne 6/17

Motivation Correlation Cronbach’s α
Correlation coefficient
If x = (x1, . . . , xn) is study time, and y = (y1, . . . , yn) are grades, we can measurecorrelation between the two variables as
rxy = 1n−1
n∑i=1
zxi · zyi
compute everyone’s z-score (study time and grades)
multiply both z-scores and sum for everyone in class
divide by the degrees of freedom (# students −1)
Note: positive sum results from multiplying two positive or negative z-scores for x andy (positive correlation)
Negative sum (correlation) results from multiplying positive and negative z-scores (andvice versa)
No correlation results from mixed-sign z-scores with sum close to zero.
John Nerbonne 7/17

Motivation Correlation Cronbach’s α
Correlation coefficient
Correlation coefficient aka “Pearson’s product-moment coefficient”
rxy = 1n−1
n∑i=1
zxi · zyi
rxy reflects the strength of the relation between x and yrxy = 0 no correlationrxy = 1 perfect positive correlation (all data points on a straight line withpositive slope)rxy = −1 perfect negative correlation
no necessary dependence!shoe size and reading ability correlate—both dependent on age
John Nerbonne 8/17
Motivation Correlation Cronbach’s α
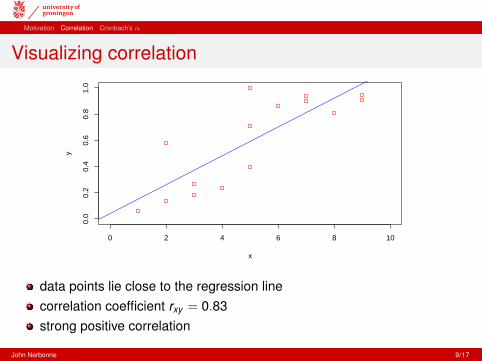
Visualizing correlation
0 2 4 6 8 10
0.0
0.2
0.4
0.6
0.8
1.0
x
y
data points lie close to the regression linecorrelation coefficient rxy = 0.83strong positive correlation
John Nerbonne 9/17

Motivation Correlation Cronbach’s α
Visualizing correlation
0 2 4 6 8 10
0.0
0.2
0.4
0.6
0.8
1.0
x
y
data points scatter in a cloud around regression linecorrelation coefficient rxy = 0.1no correlation (there might be correlation in both subsets)
John Nerbonne 10/17

Motivation Correlation Cronbach’s α
Visualizing correlation
0 2 4 6 8 10
0.0
0.2
0.4
0.6
0.8
1.0
x
y
data points close to regression line with negative slopecorrelation coefficient rxy = −0.77correlation, but negative
John Nerbonne 11/17
Motivation Correlation Cronbach’s α
Cronbach’s α
Cronbach’s α: If we ask n questions, & answers correlate r (mean correlationcoefficient), then we can derive a measure of reliability, Cronbach’s α.
Another way of looking at this: If we split the questions, how well would thetwo halves of the questionnaire agree? And if there are lots of questions, howwell would they agree if we looked at all the ways of splitting?
John Nerbonne 12/17

Motivation Correlation Cronbach’s α
Cronbach’s α depends on number of items and r
n
0
50
100
150
200
r
0.0
0.2
0.4
0.6
0.8
1.0
z
0.0
0.2
0.4
0.6
0.8
1.0
Cronbach Alpha
The higher the inter-item correlation, the higher the reliability. The more items(with a high inter-item correlation), the higher the reliability.
John Nerbonne 13/17

Motivation Correlation Cronbach’s α
Cronbach’s α can rise with fewer items if r rises
Yfke Ongena (CIW) works on the European Social Survey (ESS 2010)600 Variables (!)38.000 respondentenFour variables indicating interest in politics and trust in people
John Nerbonne 14/17

Motivation Correlation Cronbach’s α
Reliability example in ESS 2010
Cronbach’s α ≈ 0.5, even 0.63 too unreliableExamine inter-item correlations
Problem with variable “interested politically”Inter-item correlation 5 = 0.2Let’s try eliminating the negatively correlating variable
John Nerbonne 15/17

Motivation Correlation Cronbach’s α
Reliability example in ESS 2010
Cronbach’s α ≈ 0.5, even 0.63 too unreliableExamine inter-item correlations
Problem with variable “interested politically”Inter-item correlation 5 = 0.2Let’s try eliminating the negatively correlating variable
John Nerbonne 15/17
Motivation Correlation Cronbach’s α
Reliability example in ESS 2010
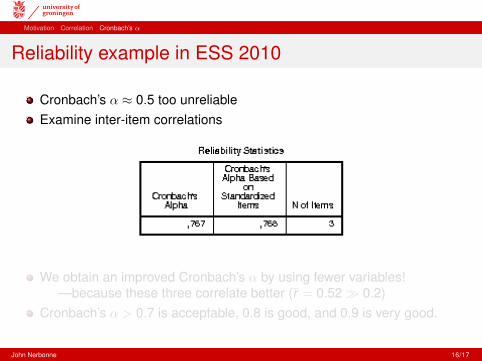
Cronbach’s α ≈ 0.5 too unreliableExamine inter-item correlations
We obtain an improved Cronbach’s α by using fewer variables!—because these three correlate better (r = 0.52 � 0.2)
Cronbach’s α > 0.7 is acceptable, 0.8 is good, and 0.9 is very good.
John Nerbonne 16/17

Motivation Correlation Cronbach’s α
Reliability example in ESS 2010
Cronbach’s α ≈ 0.5 too unreliableExamine inter-item correlations
We obtain an improved Cronbach’s α by using fewer variables!—because these three correlate better (r = 0.52 � 0.2)
Cronbach’s α > 0.7 is acceptable, 0.8 is good, and 0.9 is very good.
John Nerbonne 16/17

Motivation Correlation Cronbach’s α
Cronbach’s α — Summary
Cronbach’s α measures RELIABILITY of (different) measurements, takentogether
A measure is RELIABLE when it consistently yields the same result.Reliability 6= validity (i.e., whether a measure serves its purpose)
Cronbach’s α rises w. iter-item correlation and w. number of itemsα may rise when a questionnaire item is removed (when r rises)Once a good set is identified, mean values of the items may be used inthe derived measure.Caution required
Reliability 6= validityNegatively correlating items will degrade α
John Nerbonne 17/17