Statistics report Renewables Information
30
Statistics report Renewables Information 2020 Overview
Transcript of Statistics report Renewables Information
Statistics report
Renewables Information
2020
Overview
Renewables Information: Overview (2020 Edition)
PAGE | 2 IEA
. All
right
s re
serv
ed.
Introduction and highlights
This overview summarises the key messages from the Renewables Information
data set. It is the result of a yearlong team effort by colleagues in the Energy Data
Centre of the International Energy Agency in coordination with representatives in
OECD member countries and in other countries worldwide, providing the definitive
set of energy data for the world. These data are used not only by IEA analysts but also
by energy ministries, businesses, journalists, students and many others.
Some of the main messages from the overview are:
Renewable energy sources comprised 13.5 percent of the 1 931 Mtoe ofTotal Energy Supply (TES) in 2018, up from 1 875 Mtoe in 2017. Since 1990,they have grown at an average annual rate of 2.0%, which is slightly higherthan the growth rate of world TES, 1.8%.
Growth has been especially high for solar PV and wind power, which grewat average annual rates of 36.5% and 23.0% respectively.
Between 1990 and 2018, the average annual growth rate of hydroelectricpower in non-OECD countries was 3.9%, considerably higher than inOECD countries (0.7%). Growth was driven by mainly by China, whichaccounted for 51.7% of the hydro power increase.
Africa, which accounted for only 5.9% of the world’s total TES in 2018,accounted for 33.3% of the world’s solid biofuels supply.
Renewables are the second largest contributor to global electricityproduction. They accounted for 25.2% of world generation in 2018, aftercoal (38.2%) and ahead of natural gas (23.1%).
In the OECD, there has been a diversification of renewables demand, withthe most significant trend being the steep growth of biofuels used fortransport. In 2018, liquid biofuels and biogases used for transportconstituted 10.3% of renewables consumption.
The 2019 share of renewables in electricity production in the OECD was27.0%, which was ahead of coal (22.5%) and behind natural gas (29.7%).
Please note that the timeframes for different data sets vary throughout this overview. When discussing the world, only data through 2018 are available. For OECD
countries, supply data are available through 2019 while consumption and capacity
data are available through 2018.
Renewables Information: Overview (2020 Edition)
PAGE | 3 IEA
. All
right
s re
serv
ed.
Renewables and waste worldwide
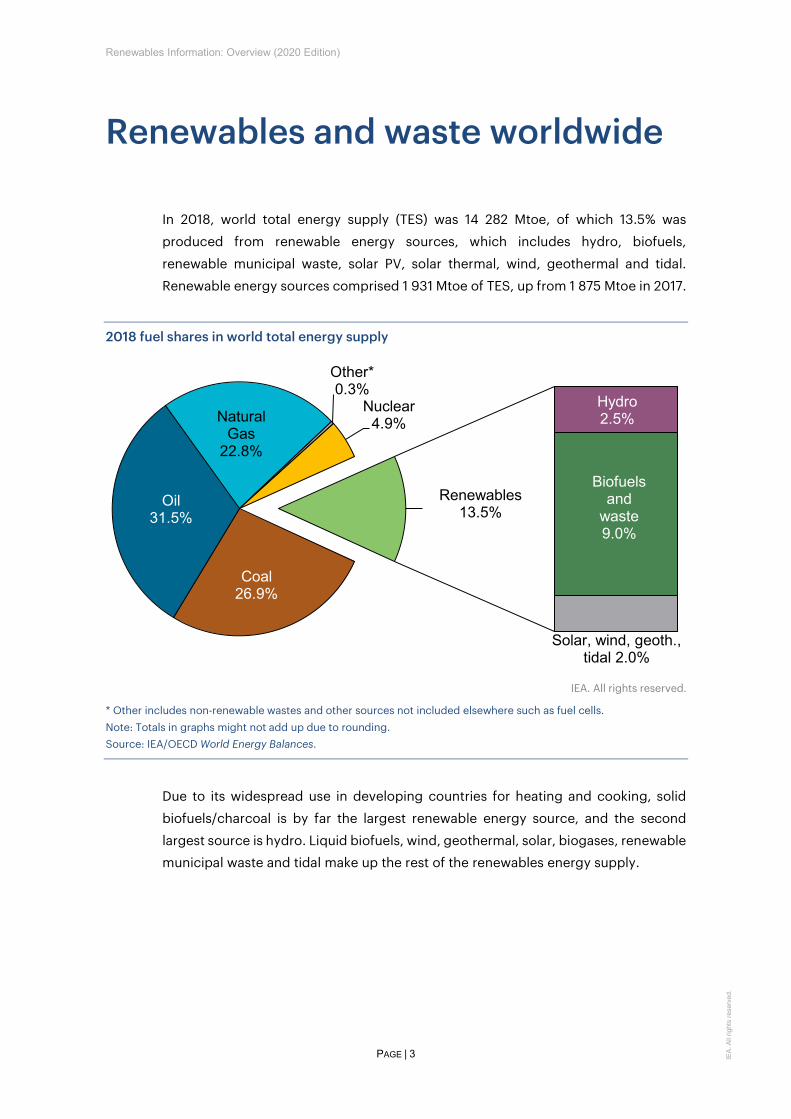
In 2018, world total energy supply (TES) was 14 282 Mtoe, of which 13.5% was
produced from renewable energy sources, which includes hydro, biofuels,
renewable municipal waste, solar PV, solar thermal, wind, geothermal and tidal.
Renewable energy sources comprised 1 931 Mtoe of TES, up from 1 875 Mtoe in 2017.
2018 fuel shares in world total energy supply
IEA. All rights reserved.
* Other includes non-renewable wastes and other sources not included elsewhere such as fuel cells. Note: Totals in graphs might not add up due to rounding. Source: IEA/OECD World Energy Balances.
Due to its widespread use in developing countries for heating and cooking, solid
biofuels/charcoal is by far the largest renewable energy source, and the second
largest source is hydro. Liquid biofuels, wind, geothermal, solar, biogases, renewable municipal waste and tidal make up the rest of the renewables energy supply.
Coal26.9%
Oil31.5%
Natural Gas
22.8%
Other*0.3%
Nuclear4.9%
Hydro2.5%
Biofuels and
waste9.0%
Solar, wind, geoth., tidal 2.0%
Renewables13.5%
Renewables Information: Overview (2020 Edition)
PAGE | 4 IEA
. All
right
s re
serv
ed.
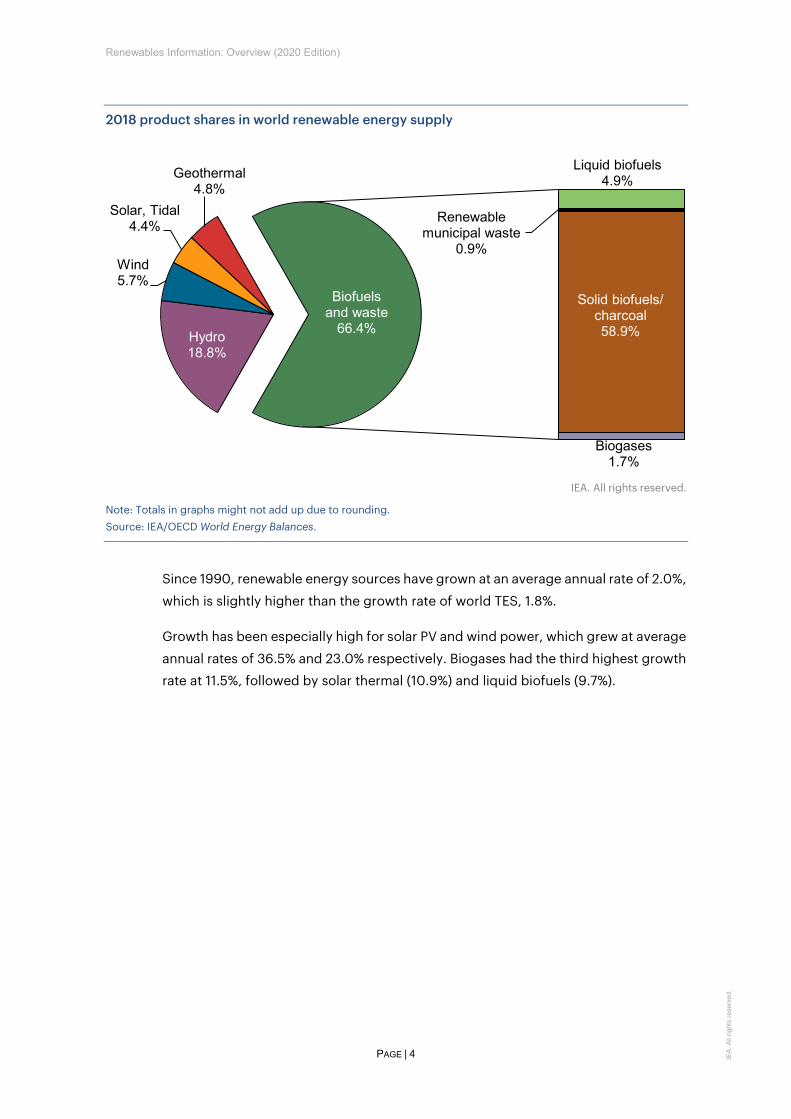
2018 product shares in world renewable energy supply
IEA. All rights reserved.
Note: Totals in graphs might not add up due to rounding. Source: IEA/OECD World Energy Balances.
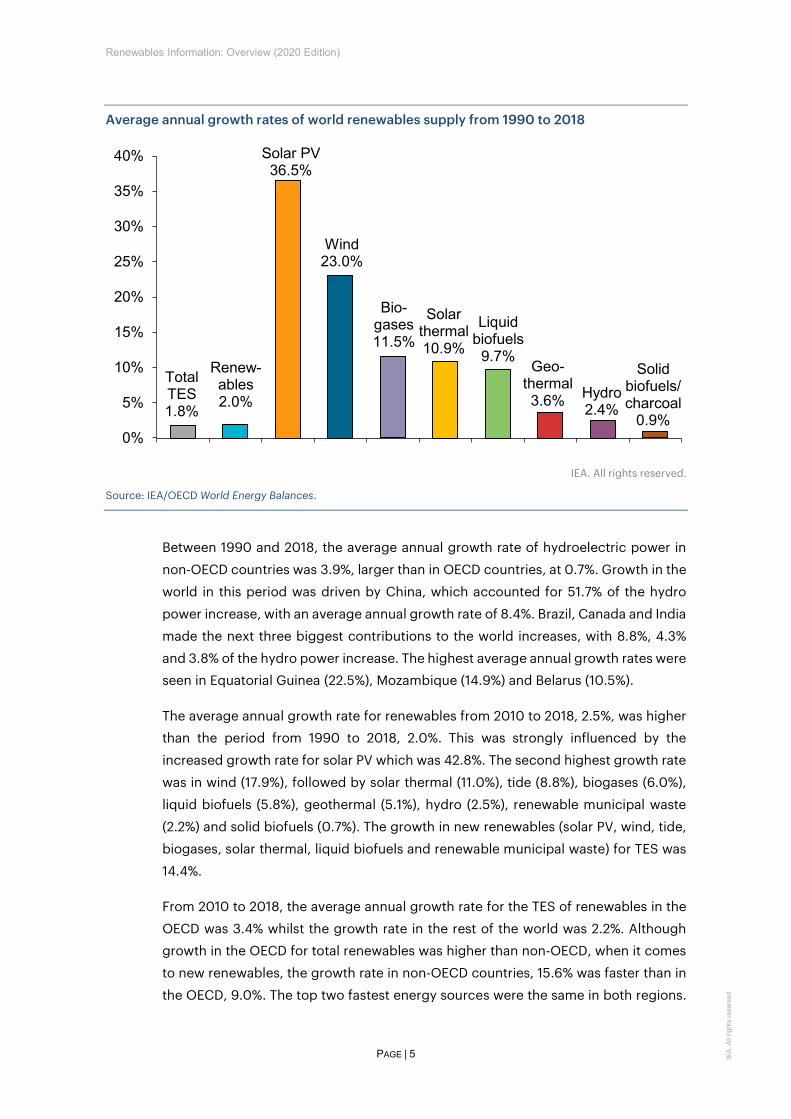
Since 1990, renewable energy sources have grown at an average annual rate of 2.0%,
which is slightly higher than the growth rate of world TES, 1.8%.
Growth has been especially high for solar PV and wind power, which grew at average
annual rates of 36.5% and 23.0% respectively. Biogases had the third highest growth rate at 11.5%, followed by solar thermal (10.9%) and liquid biofuels (9.7%).
Hydro18.8%
Wind5.7%
Solar, Tidal4.4%
Geothermal4.8%
Liquid biofuels4.9%
Renewable municipal waste
0.9%
Solid biofuels/ charcoal58.9%
Biogases1.7%
Biofuelsand waste
66.4%
Renewables Information: Overview (2020 Edition)
PAGE | 5 IEA
. All
right
s re
serv
ed.
Average annual growth rates of world renewables supply from 1990 to 2018
IEA. All rights reserved.
Source: IEA/OECD World Energy Balances.
Between 1990 and 2018, the average annual growth rate of hydroelectric power in
non-OECD countries was 3.9%, larger than in OECD countries, at 0.7%. Growth in the
world in this period was driven by China, which accounted for 51.7% of the hydro
power increase, with an average annual growth rate of 8.4%. Brazil, Canada and India
made the next three biggest contributions to the world increases, with 8.8%, 4.3%
and 3.8% of the hydro power increase. The highest average annual growth rates were seen in Equatorial Guinea (22.5%), Mozambique (14.9%) and Belarus (10.5%).
The average annual growth rate for renewables from 2010 to 2018, 2.5%, was higher than the period from 1990 to 2018, 2.0%. This was strongly influenced by the
increased growth rate for solar PV which was 42.8%. The second highest growth rate
was in wind (17.9%), followed by solar thermal (11.0%), tide (8.8%), biogases (6.0%),
liquid biofuels (5.8%), geothermal (5.1%), hydro (2.5%), renewable municipal waste
(2.2%) and solid biofuels (0.7%). The growth in new renewables (solar PV, wind, tide,
biogases, solar thermal, liquid biofuels and renewable municipal waste) for TES was
14.4%.
From 2010 to 2018, the average annual growth rate for the TES of renewables in the
OECD was 3.4% whilst the growth rate in the rest of the world was 2.2%. Although growth in the OECD for total renewables was higher than non-OECD, when it comes
to new renewables, the growth rate in non-OECD countries, 15.6% was faster than in
the OECD, 9.0%. The top two fastest energy sources were the same in both regions.
Total TES1.8%
Renew-ables 2.0%
Solar PV36.5%
Wind 23.0%
Bio-gases11.5%
Solarthermal10.9%
Liquidbiofuels
9.7%Geo-
thermal3.6% Hydro
2.4%
Solidbiofuels/charcoal
0.9%0%
5%
10%
15%
20%
25%
30%
35%
40%
Renewables Information: Overview (2020 Edition)
PAGE | 6 IEA
. All
right
s re
serv
ed.
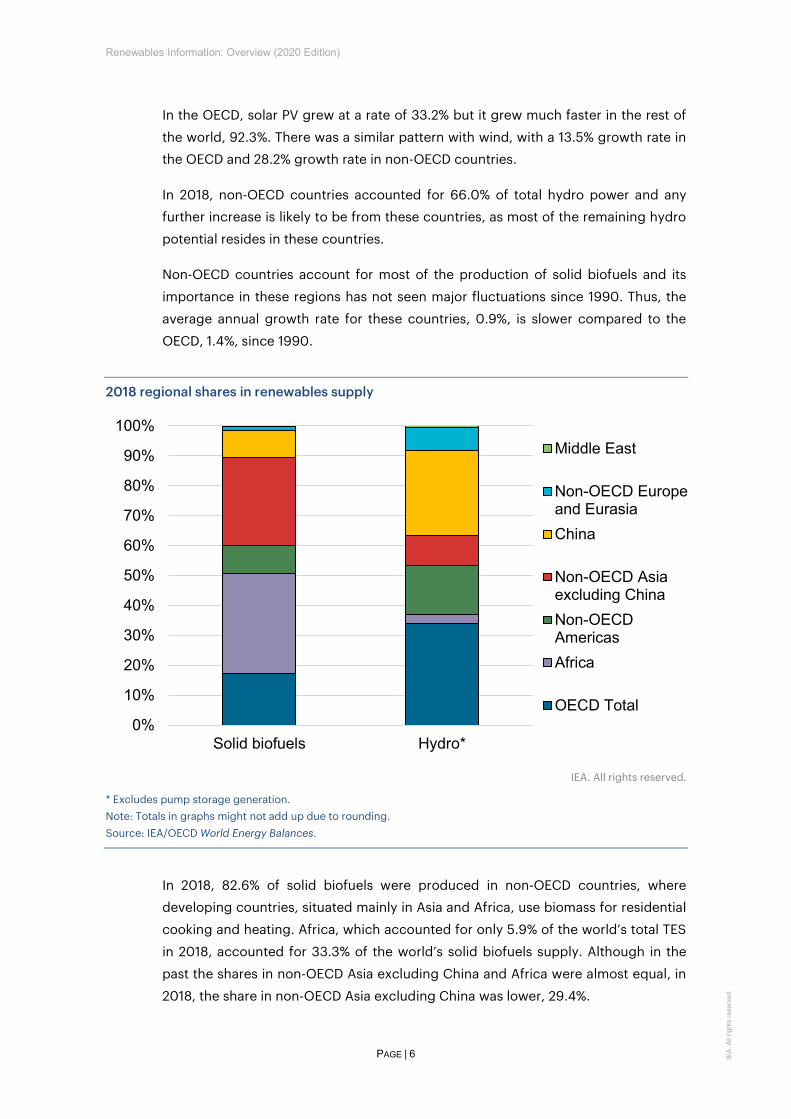
In the OECD, solar PV grew at a rate of 33.2% but it grew much faster in the rest of
the world, 92.3%. There was a similar pattern with wind, with a 13.5% growth rate in the OECD and 28.2% growth rate in non-OECD countries.
In 2018, non-OECD countries accounted for 66.0% of total hydro power and any further increase is likely to be from these countries, as most of the remaining hydro
potential resides in these countries.
Non-OECD countries account for most of the production of solid biofuels and its
importance in these regions has not seen major fluctuations since 1990. Thus, the
average annual growth rate for these countries, 0.9%, is slower compared to the
OECD, 1.4%, since 1990.
2018 regional shares in renewables supply
IEA. All rights reserved.
* Excludes pump storage generation. Note: Totals in graphs might not add up due to rounding. Source: IEA/OECD World Energy Balances.
In 2018, 82.6% of solid biofuels were produced in non-OECD countries, where developing countries, situated mainly in Asia and Africa, use biomass for residential
cooking and heating. Africa, which accounted for only 5.9% of the world’s total TES
in 2018, accounted for 33.3% of the world’s solid biofuels supply. Although in the
past the shares in non-OECD Asia excluding China and Africa were almost equal, in
2018, the share in non-OECD Asia excluding China was lower, 29.4%.
0%
10%
20%
30%
40%
50%
60%
70%
80%
90%
100%
Solid biofuels Hydro*
Middle East
Non-OECD Europeand EurasiaChina
Non-OECD Asiaexcluding ChinaNon-OECDAmericasAfrica
OECD Total
Renewables Information: Overview (2020 Edition)
PAGE | 7 IEA
. All
right
s re
serv
ed.
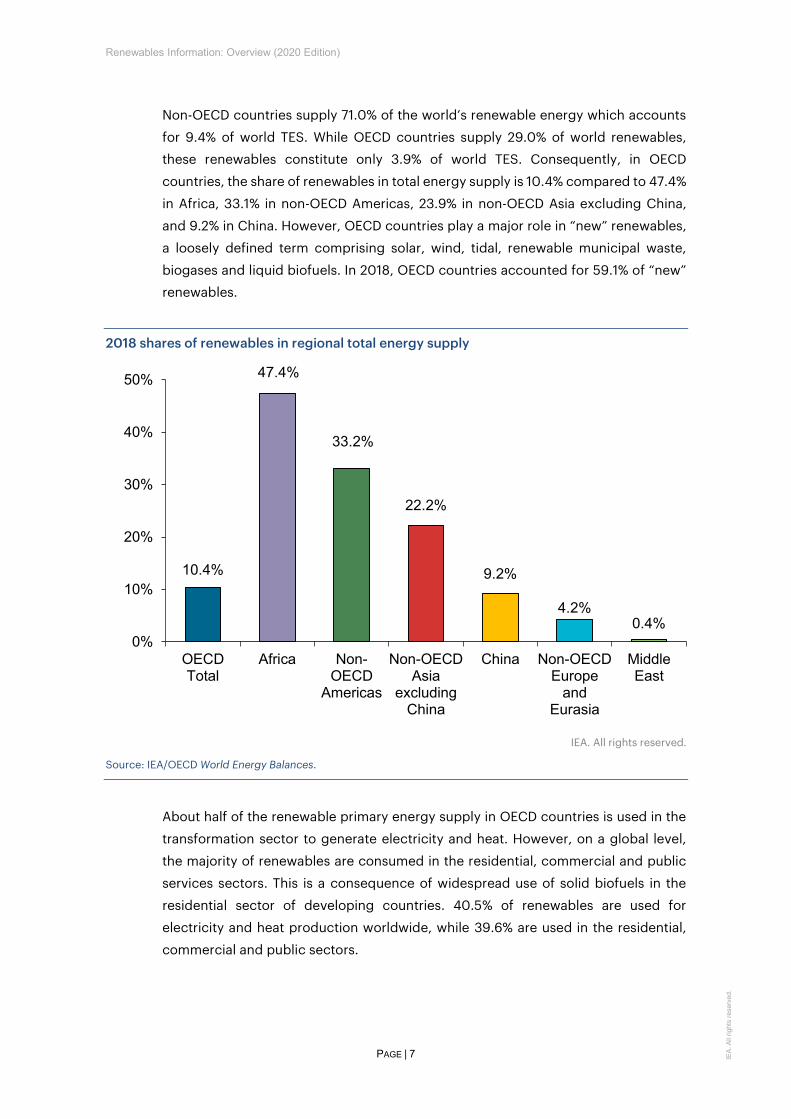
Non-OECD countries supply 71.0% of the world’s renewable energy which accounts
for 9.4% of world TES. While OECD countries supply 29.0% of world renewables, these renewables constitute only 3.9% of world TES. Consequently, in OECD
countries, the share of renewables in total energy supply is 10.4% compared to 47.4%
in Africa, 33.1% in non-OECD Americas, 23.9% in non-OECD Asia excluding China,
and 9.2% in China. However, OECD countries play a major role in “new” renewables,
a loosely defined term comprising solar, wind, tidal, renewable municipal waste,
biogases and liquid biofuels. In 2018, OECD countries accounted for 59.1% of “new” renewables.
2018 shares of renewables in regional total energy supply
IEA. All rights reserved.
Source: IEA/OECD World Energy Balances.
About half of the renewable primary energy supply in OECD countries is used in the
transformation sector to generate electricity and heat. However, on a global level,
the majority of renewables are consumed in the residential, commercial and public
services sectors. This is a consequence of widespread use of solid biofuels in the
residential sector of developing countries. 40.5% of renewables are used for
electricity and heat production worldwide, while 39.6% are used in the residential,
commercial and public sectors.
10.4%
47.4%
33.2%
22.2%
9.2%
4.2%0.4%
0%
10%
20%
30%
40%
50%
OECDTotal
Africa Non-OECD
Americas
Non-OECDAsia
excludingChina
China Non-OECDEurope
andEurasia
MiddleEast
Renewables Information: Overview (2020 Edition)
PAGE | 8 IEA
. All
right
s re
serv
ed.
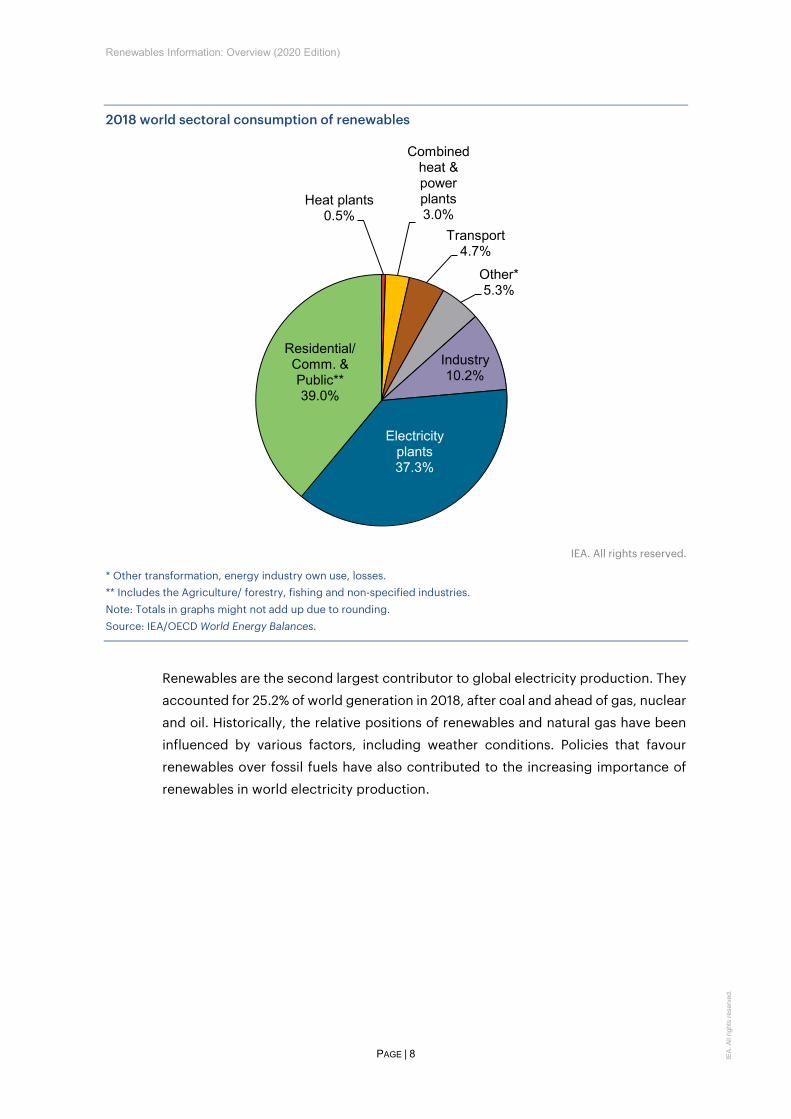
2018 world sectoral consumption of renewables
IEA. All rights reserved.
* Other transformation, energy industry own use, losses. ** Includes the Agriculture/ forestry, fishing and non-specified industries. Note: Totals in graphs might not add up due to rounding. Source: IEA/OECD World Energy Balances.
Renewables are the second largest contributor to global electricity production. They
accounted for 25.2% of world generation in 2018, after coal and ahead of gas, nuclear
and oil. Historically, the relative positions of renewables and natural gas have been
influenced by various factors, including weather conditions. Policies that favour
renewables over fossil fuels have also contributed to the increasing importance of
renewables in world electricity production.
Heat plants0.5%
Combined heat & power plants3.0%
Transport4.7%
Other*5.3%
Industry10.2%
Electricity plants37.3%
Residential/ Comm. & Public**39.0%

Renewables Information: Overview (2020 Edition)
PAGE | 9 IEA
. All
right
s re
serv
ed.
2018 fuel shares of world electricity production
IEA. All rights reserved.
* Other includes electricity from non-renewable wastes and other sources not included elsewhere such as fuel cells and chemical heat, etc. ** Excludes pump storage generation. Note: Totals in graphs might not add up due to rounding. Source: IEA/OECD World Energy Balances.
Hydroelectricity supplies the vast majority of renewable electricity, generating 15.8%
of world electricity, and 62.9% of total renewable electricity. Although growing
rapidly, geothermal, solar, wind and tidal energies accounted for 7.2% of world
electricity production, which is 28.8% of total renewable electricity in 2018. Biofuels
and waste, including solid biofuels, play a minor role in electricity generation,
supplying 2.1% of world electricity.
Since 1990, renewable electricity generation worldwide grew on average by 3.9% per
annum, which is greater than the average growth rate of total electricity generation, 2.9%. Whilst 19.4% of global electricity in 1990 was produced from renewable
sources, this share increased to 25.2% by 2018. Over this period, hydroelectric power
saw its share of total world electricity production falling from 18.1% in 1990 to 15.8%
in 2018. The share of the remaining renewable sources used to produce electricity
grew from 1.3% in 1990 to 9.3% in 2018.
The worldwide average annual growth rate for renewable electricity generation from
2010 to 2018 was 6.0%. This was strongly influenced by high growth rates in solar PV
Coal38.2%
Oil2.9%
NaturalGas
23.1%
Other*0.4%
Nuclear10.2%
Hydro**15.8%
Biofuels and waste2.1%
Solar, wind, geoth., tidal
7.2%
Renewables25.2%
Renewables Information: Overview (2020 Edition)
PAGE | 10 IEA
. All
right
s re
serv
ed.
(42.8%), solar thermal (27.3%) and wind (17.9%). The remaining growth rates were tide
(8.8%), biogases (8.4%), solid biofuels (8.1%), liquid biofuels (6.6%), geothermal (3.4%), hydro (2.5%), renewable municipal waste (2.0%). The growth in new
renewables electricity production was 20.0%.
From 2010 to 2018, the average annual growth rate for renewable electricity
production in the OECD was 5.1% whilst the growth rate in the rest of the world was
6.8%. These growth rates exceeded the growth rates in total electricity for both
regions. Although growth in the OECD for total renewables was higher than non-
OECD, when it comes to new renewables, the growth rate in non-OECD countries,
33.6% was faster than in the OECD, 15.1%. The fastest growing electricity source in
non-OECD countries was solar thermal (144%) which grew from 2 GWh to 2 511.2 GWh. Next was solar PV (92.3%), followed by liquid biofuels (86.8%), wind
(28.2%), biogases (19.8%), solid biofuels (13.3%), tide (5.4%), renewable municipal
waste (4.7%), geothermal (4.1%) and hydro (3.6%).
Renewables Information: Overview (2020 edition)
PAGE | 11 IEA
. All
right
s re
serv
ed.
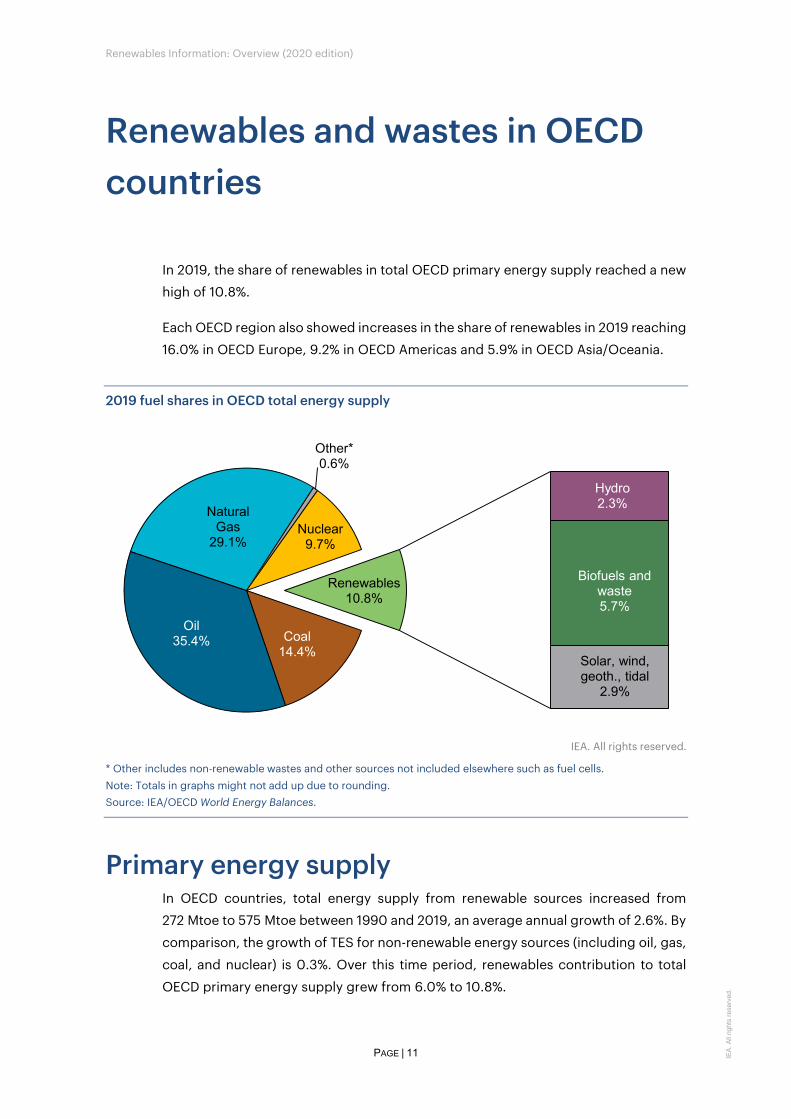
Renewables and wastes in OECD countries
In 2019, the share of renewables in total OECD primary energy supply reached a new high of 10.8%.
Each OECD region also showed increases in the share of renewables in 2019 reaching 16.0% in OECD Europe, 9.2% in OECD Americas and 5.9% in OECD Asia/Oceania.
2019 fuel shares in OECD total energy supply
IEA. All rights reserved.
* Other includes non-renewable wastes and other sources not included elsewhere such as fuel cells. Note: Totals in graphs might not add up due to rounding. Source: IEA/OECD World Energy Balances.
Primary energy supply In OECD countries, total energy supply from renewable sources increased from 272 Mtoe to 575 Mtoe between 1990 and 2019, an average annual growth of 2.6%. By
comparison, the growth of TES for non-renewable energy sources (including oil, gas,
coal, and nuclear) is 0.3%. Over this time period, renewables contribution to total
OECD primary energy supply grew from 6.0% to 10.8%.
Coal14.4%
Oil35.4%
NaturalGas
29.1%
Other*0.6%
Nuclear9.7%
Hydro2.3%
Biofuels and waste5.7%
Solar, wind, geoth., tidal
2.9%
Renewables10.8%

Renewables Information: Overview (2020 edition)
PAGE | 12 IEA
. All
right
s re
serv
ed.
The largest proportion of renewable primary energy supply in the OECD comes from
biofuels and waste, which accounts for 52.4% of the renewable supply. Of this category, solid biofuels, including wood, wood wastes, other solid wastes and
charcoal, constitutes the largest share, 35.0%, of the supply. The second largest
renewable energy source is hydroelectric power, providing 20.8% of renewable
primary energy supply. These two renewable energy sources constituted 55.8% of
the total OECD primary renewable energy supply in 2019.
2019 product shares in OECD renewable energy supply
IEA. All rights reserved.
Note: Totals in graphs might not add up due to rounding. Source: IEA/OECD World Energy Balances.
Renewables showed a larger increase in average annual growth from 2000 to 2019
at 3.1% than from 1990 to 2000 at 0.9%. The growth of renewables has been
accelerating recently with 3.0% in the period from 2000 to 2010 and 3.3% in 2010 to 2019. By contrast, the average annual growth rates in modern renewables, such as
solar, wind, liquid biofuels, biogases, renewable municipal wastes and tidal, seem to
be slowing down for the same time periods. In the period 2000 to 2010, the growth
rate was 15.2% while for 2010 to 2019 it was 8.8%. The drop in growth rate in the latter
period was influenced by reduced growth in liquid biofuels, biogases and renewable
municipal wastes.
Hydro20.8%
Wind12.5%
Solar, Tidal7.2%
Geothermal7.0%
Liquid biofuels10.9%Renewable
municipal waste2.7%
Solid biofuels/ charcoal35.0%
Biogases3.8%
Biofuelsand waste
52.4%
Renewables Information: Overview (2020 edition)
PAGE | 13 IEA
. All
right
s re
serv
ed.
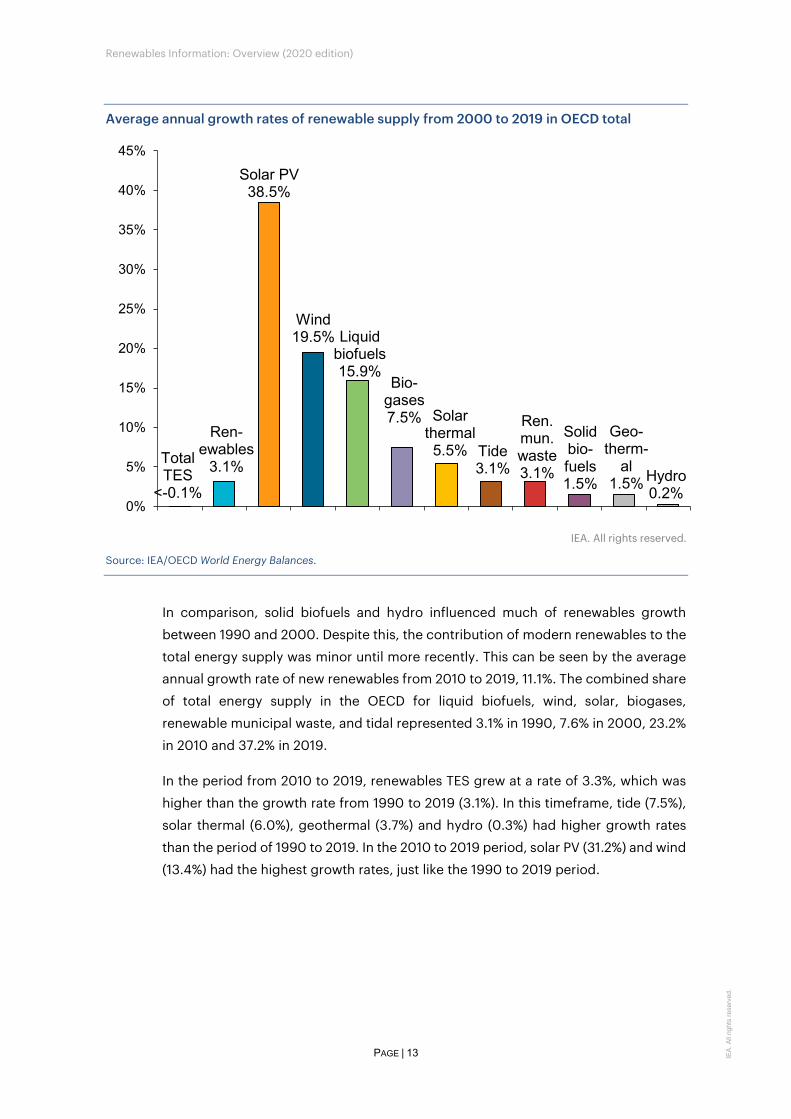
Average annual growth rates of renewable supply from 2000 to 2019 in OECD total
IEA. All rights reserved.
Source: IEA/OECD World Energy Balances.
In comparison, solid biofuels and hydro influenced much of renewables growth
between 1990 and 2000. Despite this, the contribution of modern renewables to the
total energy supply was minor until more recently. This can be seen by the average annual growth rate of new renewables from 2010 to 2019, 11.1%. The combined share
of total energy supply in the OECD for liquid biofuels, wind, solar, biogases,
renewable municipal waste, and tidal represented 3.1% in 1990, 7.6% in 2000, 23.2%
in 2010 and 37.2% in 2019.
In the period from 2010 to 2019, renewables TES grew at a rate of 3.3%, which was
higher than the growth rate from 1990 to 2019 (3.1%). In this timeframe, tide (7.5%),
solar thermal (6.0%), geothermal (3.7%) and hydro (0.3%) had higher growth rates
than the period of 1990 to 2019. In the 2010 to 2019 period, solar PV (31.2%) and wind
(13.4%) had the highest growth rates, just like the 1990 to 2019 period.
Total TES
<-0.1%
Ren-ewables
3.1%
Solar PV38.5%
Wind19.5% Liquid
biofuels15.9%
Bio-gases7.5% Solar
thermal5.5% Tide
3.1%
Ren. mun. waste3.1%
Solid bio-fuels1.5%
Geo-therm-
al1.5% Hydro
0.2%0%
5%
10%
15%
20%
25%
30%
35%
40%
45%
Renewables Information: Overview (2020 edition)
PAGE | 14 IEA
. All
right
s re
serv
ed.
Shares of OECD Renewable Energy Supply by Product
IEA. All rights reserved.
Source: IEA/OECD World Energy Balances.
Among the different OECD regions, OECD Europe has the highest share of primary
energy supply from renewable sources, with 16.0% in 2018. It is also the OECD area
that has experienced the largest increase (from 6.0%) in its renewable share since
1990. The increase of the renewable share in OECD Europe has certainly been the
consequence of the implementation of supporting policies introduced in the late
1990s and 2000s. The renewable share of TES in OECD Americas reached a new high
of 9.2% in 2019 from 6.7% in 1990. In OECD Asia Oceania the share of renewable primary energy supply increased from 4.0% in 1990 to reach 5.9% in 2019.
0%
10%
20%
30%
40%
50%
60%
70%
80%
90%
100%
Hydro Solid Biofuels/ Charcoal
Geothermal Solar, wind, tidal
Renewables Information: Overview (2020 edition)
PAGE | 15 IEA
. All
right
s re
serv
ed.
OECD regional shares of renewable energy supply
IEA. All rights reserved.
Source: IEA/OECD World Energy Balances.
In the OECD, the majority of the consumption of renewables has been in the
transformation sector for the last three decades. In the other sectors, there has been
a diversification of renewables demand, with the most significant trend being the steep growth of biofuels used for transport. In 2018, liquid biofuels and biogases used
for transport constituted 10.3% of renewables consumption.
0%
2%
4%
6%
8%
10%
12%
14%
16%
18% OECDTotal
OECDAmericas
OECDAsiaOceania
OECDEurope
Renewables Information: Overview (2020 edition)
PAGE | 16 IEA
. All
right
s re
serv
ed.
OECD sectoral consumption of renewables
IEA. All rights reserved.
* Includes the Agriculture/ forestry, fishing and non-specified industries. ** Represents less than 0.05%. Note: Totals in graphs might not add up due to rounding. Source: IEA/OECD World Energy Balances.
Electricity production OECD gross electricity production from renewable products1 reached 2 964.2 TWh
in 2019, 3.7% higher than the 2018 level of 2 859.3 TWh. This represents more than
one quarter (27.0%) of total OECD electricity production in 2019, which is the largest
share of renewables in gross electricity production and now exceeds coal.
1 Excluding generation from pumped storage plants.
0%
10%
20%
30%
40%
50%
60%
70%
80%
90%
100%
1990 2018
Residential/Commercial & Public*
Transport**
Industry
Other
Heat plants
Combined heat &power plants
Electricity plants
Renewables Information: Overview (2020 edition)
PAGE | 17 IEA
. All
right
s re
serv
ed.
Renewable shares in OECD electricity production in 2019
IEA. All rights reserved.
* Other includes electricity from non-renewable wastes and other sources not included elsewhere such as fuel cells and chemical heat, etc. Note: Totals in graphs might not add up due to rounding. Source: IEA/OECD World Energy Statistics.
Since 1990, OECD electricity generation from renewable energy sources has been
growing at an average rate of 2.8% per year, more than double the rate for total
electricity generation (1.2%), reflecting the strong growth in “new” renewable
products, such as solar PV, wind, renewable municipal waste and biogases for
electricity production in recent years.
In the OECD, hydro power production makes up the largest share of renewable
sources in power production – but it had the lowest average growth rate of any
renewable electricity source from 1990 to 2019. Wind grew from 0.3% in 1990 to 28.3% of renewable electricity in 2019, a 20.4% average annual growth rate, making
it the second largest renewable source for electricity. The share of solar PV in OECD
renewable electricity production had a 33.1% average annual growth rate in the same
time period. Liquid biofuels have not been included in this group because there was
no electricity production from liquid biofuels in 1990 so the average annual growth
rate for this time period can’t be calculated.
Coal22.5%
Oil1.8%
NaturalGas
29.7%
Other*0.9%
Nuclear18.1% Hydro
12.7%Biofuels
and waste2.8%
Wind7.6%Solar
PV3.2%
Solar thermal,
geothermal, tidal0.6%
Renewables27.0%
Renewables Information: Overview (2020 edition)
PAGE | 18 IEA
. All
right
s re
serv
ed.
Average annual growth rates of electricity production between 1990 and 2019 in OECD countries
IEA. All rights reserved.
Source: IEA/OECD World Energy Statistics.
With growth in other types of renewables, the hydroelectricity share of electricity
from renewable energy sources declined from 89.4% in 1990 to 47.0% in 2019. In
1990, largest contributors to the share of renewables were solid biofuels (67.4%) and
geothermal energy (20.4%), whilst solar PV and wind were only 2.8%. However,
between 1990 and 2019, solar PV and wind grew much faster than any other power
source and now comprise 40.2% of all renewable electricity sources.
The average annual growth rate for renewable electricity generation from 2010 to
2019 was 4.9%. This was strongly influenced by high growth rates in solar PV (31.2%),
solar thermal (22.6%) and wind (13.4%). The remaining growth rates were tide (7.5%), biogases (6.7%), liquid biofuels (3.9%), solid biofuels (3.2%), geothermal (2.9%),
renewable municipal waste (1.4%) and hydro (0.3%). Growth in electricity production
from new renewables was 14.9% for this timeframe.
0.6% 1.2%
8.7%
33.1%
20.4%
11.3%
5.1%2.4% 2.3%
0%
5%
10%
15%
20%
25%
30%
35% Hydro
Total
Non-hydrorenewablesSolar PV
Wind
Biogases
Ren. mun.wasteSolid biofuels
Geothermal
Renewables Information: Overview (2020 edition)
PAGE | 19 IEA
. All
right
s re
serv
ed.
Shares in OECD renewable electricity production in 1990 and 2019
IEA. All rights reserved.
Source: IEA/OECD World Energy Statistics.
Renewable electricity production in OECD Europe grew 3.8% on an average annual
basis since 1990. This growth rate is higher than other OECD regions, 2.1% for OECD
Americas and 2.6% for OECD Asia Oceania. The shares of electricity from renewables increased from 18.5% in 1990 to 23.7% in 2019 in OECD Americas, and from 17.5% to
38.1% in OECD Europe, and from 12.4% in 1990 to 15.6% in 2018 in OECD Asia
Oceania. As a result of these increases, the OECD region as a whole produced its
highest share of electricity from renewable sources from 1990 (17.2%) to 2019
(27.0%).
0%
10%
20%
30%
40%
50%
60%
70%
80%
90%
100%
1990 2019
Hydro
Solar thermal, tidal
Renewablemunicipal wasteBiogases
Liquid biofuels
Solid biofuels
Solar PV
Wind
Geothermal
Renewables Information: Overview (2020 edition)
PAGE | 20 IEA
. All
right
s re
serv
ed.
OECD regional shares in renewable electricity production from 1990 to 2019
IEA. All rights reserved.
Source: IEA/OECD World Energy Balances.
Installed generating capacity2 From 1990 to 2018, the renewable shares of generating capacities for OECD countries have increased and the average annual growth rates of renewables and
waste generating capacities (3.8%) have outpaced the average annual growth rates
of non-renewable generating capacities (1.4%).
At the end of 2018, approximately 1 140.3 GW, or 37.0%, of total OECD generating
capacity, was renewable energy and waste sources. Compared to 2017, total capacity
had increased by 61.8 GW, driven by solar PV and wind, increasing 31.4 GW and
21.0 GW, respectively.
2 Capacity data is only available for OECD countries through the end of 2018 at the time of publication.
0%5%
10%15%20%25%30%35%40%45%
OECDTotal
OECDAmericas
OECDAsiaOceania
OECDEurope
Renewables Information: Overview (2020 edition)
PAGE | 21 IEA
. All
right
s re
serv
ed.
OECD generating capacity 2018
IEA. All rights reserved.
* The capacities of plants which co-fire biofuels and waste with fossil fuels (e.g. solid biofuels that are co-fired with coal) are included under the dominant fuel. ** Other: fuel cells, waste/chemical heat. *** Includes pumped hydro. Note: Totals in graphs might not add up due to rounding. Generating capacities include pure hydro, mixed hydro and pure pumped storage. Source: IEA/OECD Electricity Statistics.
The largest share (53.4%) of total generating capacity in 2018 was from combustible
fossil fuels, 1 646.9 GW, which is dominated by natural gas and coal. This is followed
by 495.7 GW of total generating capacity from hydroelectric plants (16.1%), 308.4 GW
from wind (10.0%), 295.4 GW from nuclear (9.6%), 251.3 GW from solar PV (8.1%),
72.5 GW from biofuels and waste (2.3%), 7.8 GW geothermal (0.3%) and 4.6 GW from
solar thermal and tidal (0.1%). Within biofuels and waste, 37.0 GW was solid biofuel capacity, biogases were 16.0 GW, municipal waste was 13.8 GW, and liquid biofuels
was 2.4 GW. While renewables and wastes have made some recent strides in the
share of total generating capacity for OECD countries, further progress can still be
made.
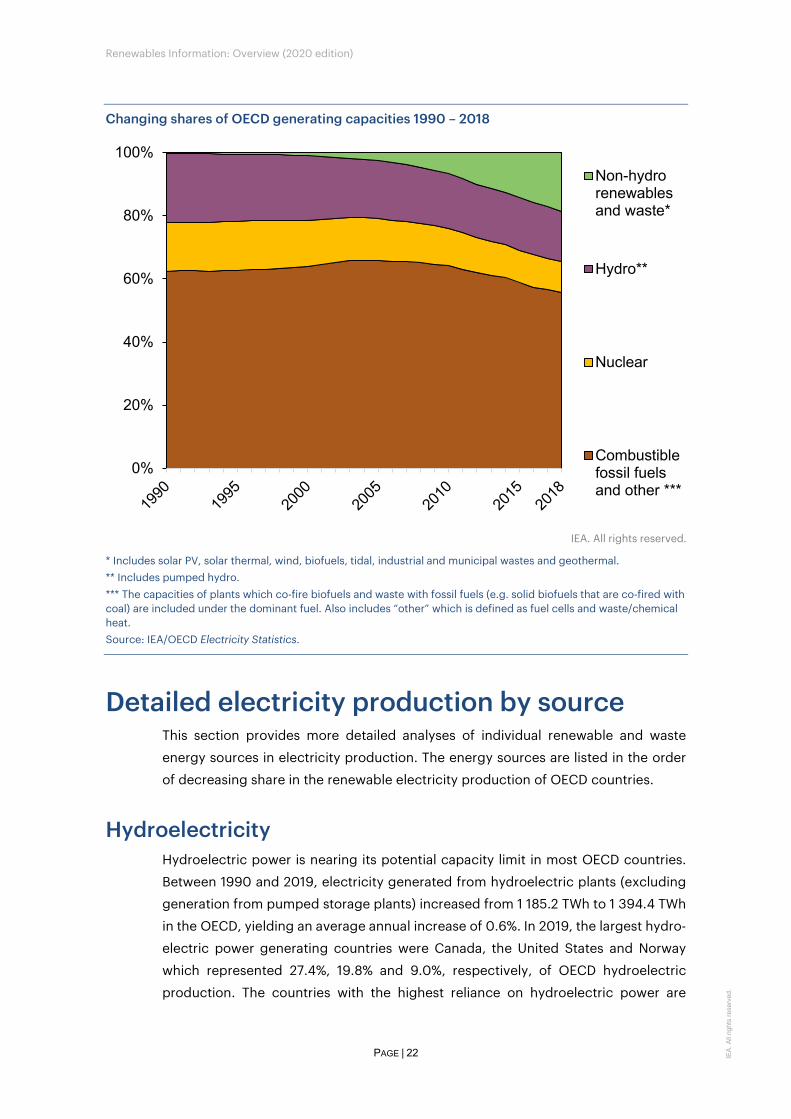
From 1990 to 2018, the renewable shares of generating capacities for OECD
countries have increased. Over this time period, the average annual growth rates of
renewables and waste generating capacities (3.7%) have outpaced the average
annual growth rates of non-renewable generating capacities (1.4%).
Nuclear9.6%
Combustible fossil fuels*
53.4%
Other**0.1%
Hydro***16.1%
Biofuels and waste2.3%
Geothermal0.3%
Solar PV8.1%
Wind10.0%
Solar thermal, Tidal0.1%
Non-hydro renewables &
waste20.9%
Renewables Information: Overview (2020 edition)
PAGE | 22 IEA
. All
right
s re
serv
ed.
Changing shares of OECD generating capacities 1990 – 2018
IEA. All rights reserved.
* Includes solar PV, solar thermal, wind, biofuels, tidal, industrial and municipal wastes and geothermal. ** Includes pumped hydro. *** The capacities of plants which co-fire biofuels and waste with fossil fuels (e.g. solid biofuels that are co-fired with coal) are included under the dominant fuel. Also includes “other” which is defined as fuel cells and waste/chemical heat. Source: IEA/OECD Electricity Statistics.
Detailed electricity production by source This section provides more detailed analyses of individual renewable and waste
energy sources in electricity production. The energy sources are listed in the order
of decreasing share in the renewable electricity production of OECD countries.
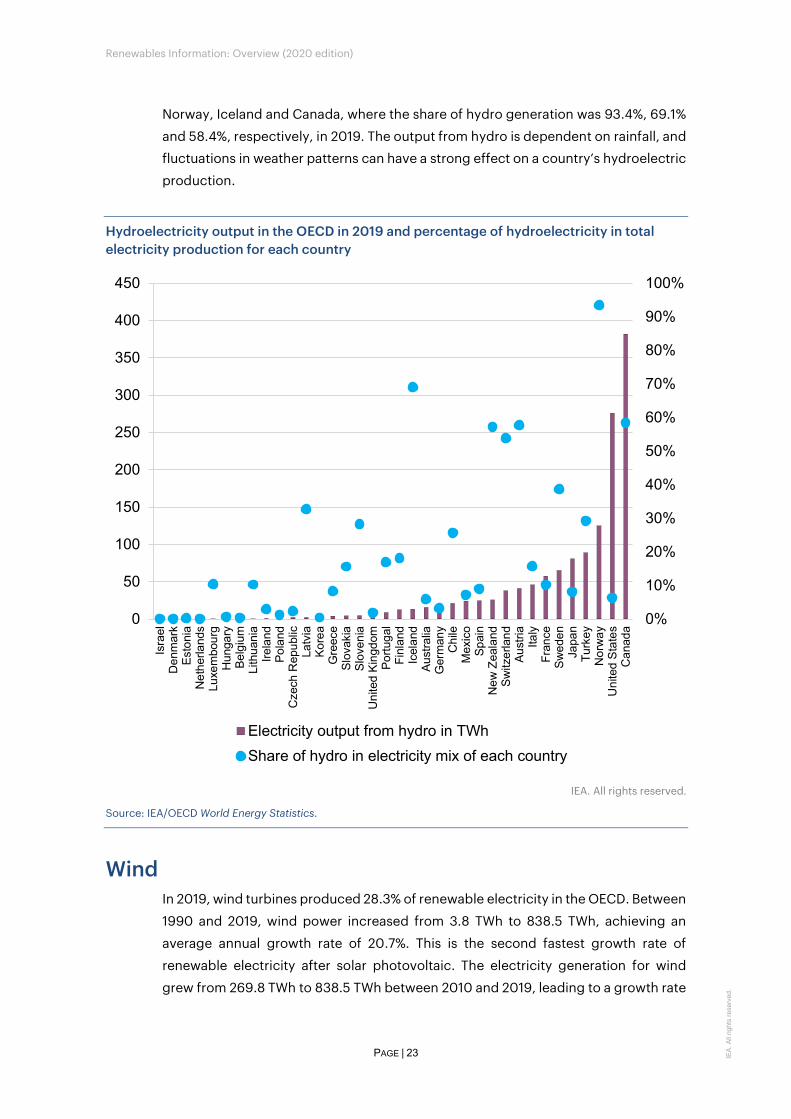
Hydroelectricity Hydroelectric power is nearing its potential capacity limit in most OECD countries.
Between 1990 and 2019, electricity generated from hydroelectric plants (excluding generation from pumped storage plants) increased from 1 185.2 TWh to 1 394.4 TWh
in the OECD, yielding an average annual increase of 0.6%. In 2019, the largest hydro-
electric power generating countries were Canada, the United States and Norway
which represented 27.4%, 19.8% and 9.0%, respectively, of OECD hydroelectric
production. The countries with the highest reliance on hydroelectric power are
0%
20%
40%
60%
80%
100%Non-hydrorenewablesand waste*
Hydro**
Nuclear
Combustiblefossil fuelsand other ***
Renewables Information: Overview (2020 edition)
PAGE | 23 IEA
. All
right
s re
serv
ed.
Norway, Iceland and Canada, where the share of hydro generation was 93.4%, 69.1%
and 58.4%, respectively, in 2019. The output from hydro is dependent on rainfall, and fluctuations in weather patterns can have a strong effect on a country’s hydroelectric
production.
Hydroelectricity output in the OECD in 2019 and percentage of hydroelectricity in total electricity production for each country
IEA. All rights reserved.
Source: IEA/OECD World Energy Statistics.
Wind In 2019, wind turbines produced 28.3% of renewable electricity in the OECD. Between
1990 and 2019, wind power increased from 3.8 TWh to 838.5 TWh, achieving an
average annual growth rate of 20.7%. This is the second fastest growth rate of
renewable electricity after solar photovoltaic. The electricity generation for wind
grew from 269.8 TWh to 838.5 TWh between 2010 and 2019, leading to a growth rate
0%
10%
20%
30%
40%
50%
60%
70%
80%
90%
100%
0
50
100
150
200
250
300
350
400
450
Isra
elD
enm
ark
Esto
nia
Net
herla
nds
Luxe
mbo
urg
Hun
gary
Belg
ium
Lith
uani
aIre
land
Pola
ndC
zech
Rep
ublic
Latv
iaKo
rea
Gre
ece
Slov
akia
Slov
enia
Uni
ted
Kin
gdom
Portu
gal
Finl
and
Icel
and
Aust
ralia
Ger
man
yC
hile
Mex
ico
Spai
nN
ew Z
eala
ndSw
itzer
land
Aust
riaIta
lyFr
ance
Swed
enJa
pan
Turk
eyN
orw
ayU
nite
d S
tate
sC
anad
a
Electricity output from hydro in TWhShare of hydro in electricity mix of each country
Renewables Information: Overview (2020 edition)
PAGE | 24 IEA
. All
right
s re
serv
ed.
of 13.4%. Wind had the third fastest growth rate in this period, behind solar PV (31.2%)
and solar thermal (22.6%). Among OECD regions, wind electricity production is the highest in OECD Europe, with 53.4% of the total OECD production in 2019 and an
average growth rate of 24.5% per annum since 1990. In absolute terms, the
United States, Germany and the United Kingdom are the largest producers of
electricity from wind in 2019 within the OECD, producing 303.4 TWh, 126.0 TWh and
64.1 TWh, respectively.
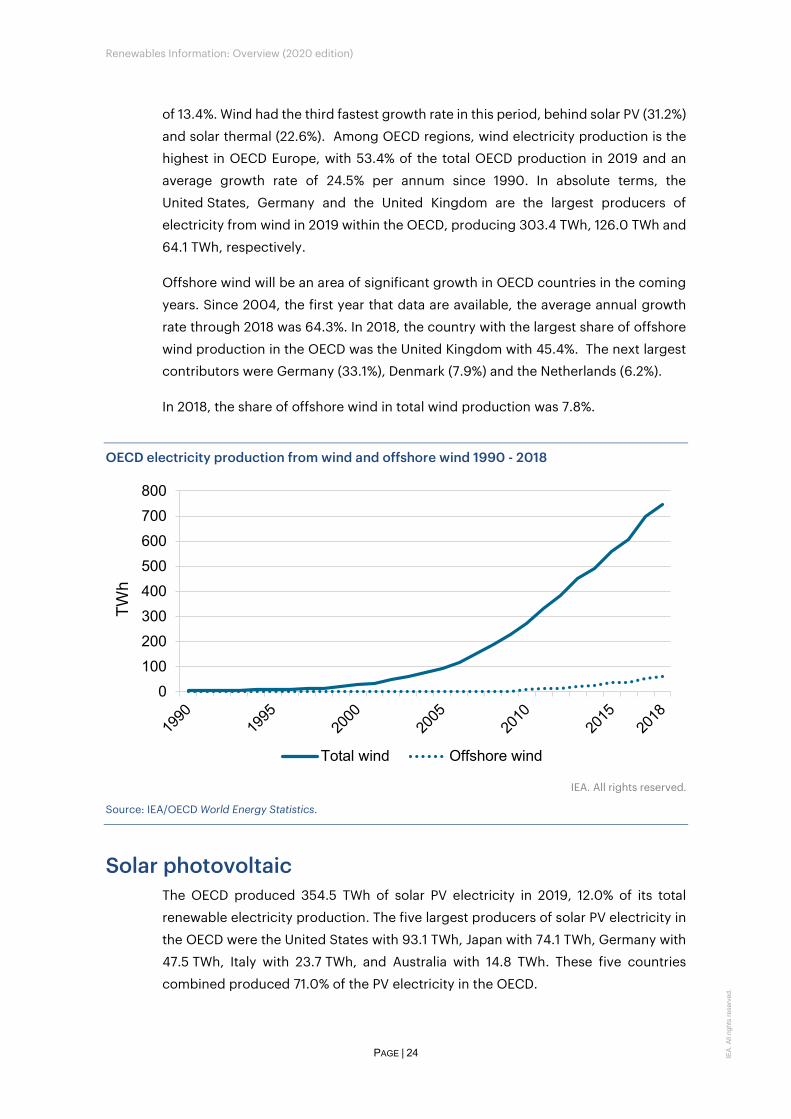
Offshore wind will be an area of significant growth in OECD countries in the coming
years. Since 2004, the first year that data are available, the average annual growth
rate through 2018 was 64.3%. In 2018, the country with the largest share of offshore
wind production in the OECD was the United Kingdom with 45.4%. The next largest contributors were Germany (33.1%), Denmark (7.9%) and the Netherlands (6.2%).
In 2018, the share of offshore wind in total wind production was 7.8%.
OECD electricity production from wind and offshore wind 1990 - 2018
IEA. All rights reserved.
Source: IEA/OECD World Energy Statistics.
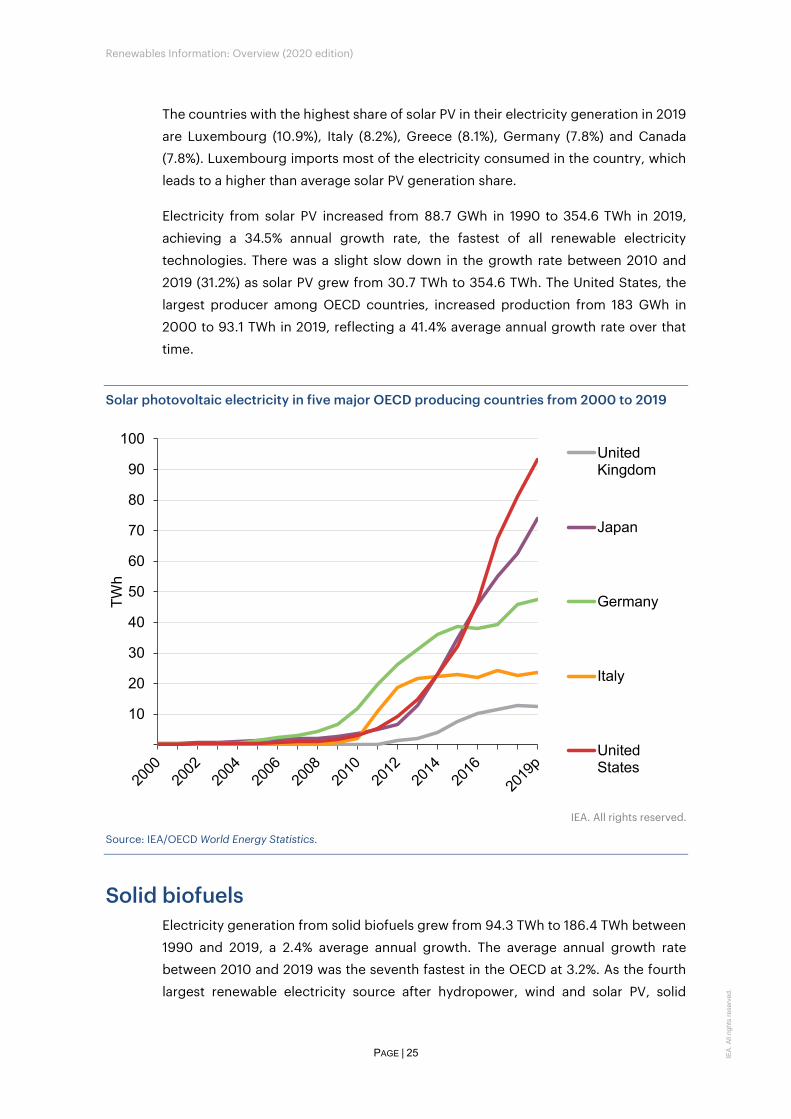
Solar photovoltaic The OECD produced 354.5 TWh of solar PV electricity in 2019, 12.0% of its total
renewable electricity production. The five largest producers of solar PV electricity in
the OECD were the United States with 93.1 TWh, Japan with 74.1 TWh, Germany with
47.5 TWh, Italy with 23.7 TWh, and Australia with 14.8 TWh. These five countries
combined produced 71.0% of the PV electricity in the OECD.
0100200300400500600700800
TWh
Total wind Offshore wind
Renewables Information: Overview (2020 edition)
PAGE | 25 IEA
. All
right
s re
serv
ed.
The countries with the highest share of solar PV in their electricity generation in 2019
are Luxembourg (10.9%), Italy (8.2%), Greece (8.1%), Germany (7.8%) and Canada (7.8%). Luxembourg imports most of the electricity consumed in the country, which
leads to a higher than average solar PV generation share.
Electricity from solar PV increased from 88.7 GWh in 1990 to 354.6 TWh in 2019,
achieving a 34.5% annual growth rate, the fastest of all renewable electricity
technologies. There was a slight slow down in the growth rate between 2010 and
2019 (31.2%) as solar PV grew from 30.7 TWh to 354.6 TWh. The United States, the
largest producer among OECD countries, increased production from 183 GWh in
2000 to 93.1 TWh in 2019, reflecting a 41.4% average annual growth rate over that
time.
Solar photovoltaic electricity in five major OECD producing countries from 2000 to 2019
IEA. All rights reserved.
Source: IEA/OECD World Energy Statistics.
Solid biofuels Electricity generation from solid biofuels grew from 94.3 TWh to 186.4 TWh between
1990 and 2019, a 2.4% average annual growth. The average annual growth rate between 2010 and 2019 was the seventh fastest in the OECD at 3.2%. As the fourth
largest renewable electricity source after hydropower, wind and solar PV, solid
10
20
30
40
50
60
70
80
90
100
TWh
UnitedKingdom
Japan
Germany
Italy
UnitedStates
Renewables Information: Overview (2020 edition)
PAGE | 26 IEA
. All
right
s re
serv
ed.
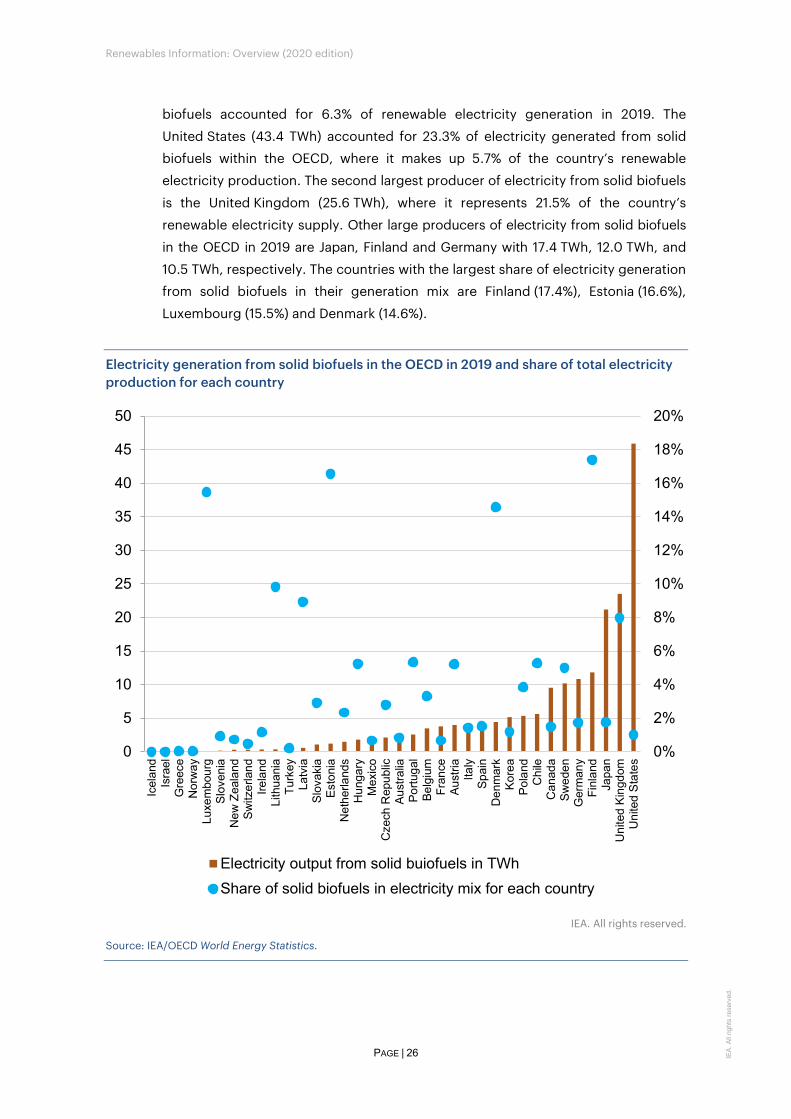
biofuels accounted for 6.3% of renewable electricity generation in 2019. The
United States (43.4 TWh) accounted for 23.3% of electricity generated from solid biofuels within the OECD, where it makes up 5.7% of the country’s renewable
electricity production. The second largest producer of electricity from solid biofuels
is the United Kingdom (25.6 TWh), where it represents 21.5% of the country’s
renewable electricity supply. Other large producers of electricity from solid biofuels
in the OECD in 2019 are Japan, Finland and Germany with 17.4 TWh, 12.0 TWh, and
10.5 TWh, respectively. The countries with the largest share of electricity generation from solid biofuels in their generation mix are Finland (17.4%), Estonia (16.6%),
Luxembourg (15.5%) and Denmark (14.6%).
Electricity generation from solid biofuels in the OECD in 2019 and share of total electricity production for each country
IEA. All rights reserved.
Source: IEA/OECD World Energy Statistics.
0%
2%
4%
6%
8%
10%
12%
14%
16%
18%
20%
0
5
10
15
20
25
30
35
40
45
50
Icel
and
Isra
elG
reec
eN
orw
ayLu
xem
bour
gSl
oven
iaN
ew Z
eala
ndSw
itzer
land
Irela
ndLi
thua
nia
Turk
eyLa
tvia
Slov
akia
Esto
nia
Net
herla
nds
Hun
gary
Mex
ico
Cze
ch R
epub
licAu
stra
liaPo
rtuga
lBe
lgiu
mFr
ance
Aust
riaIta
lySp
ain
Den
mar
kKo
rea
Pola
ndC
hile
Can
ada
Swed
enG
erm
any
Finl
and
Japa
nU
nite
d K
ingd
omU
nite
d S
tate
s
Electricity output from solid buiofuels in TWhShare of solid biofuels in electricity mix for each country
Renewables Information: Overview (2020 edition)
PAGE | 27 IEA
. All
right
s re
serv
ed.
Biogases Electricity in the OECD from biogases grew from 3.7 TWh in 1990 to 81.4 TWh in 2019.
Production of electricity from biogases grew by an average annual rate of 11.3% since
1990, making it the fourth fastest growing source of renewable electricity in the
OECD. In the period of 2010 to 2019, biogases were the fifth fastest growing source
of renewable electricity at 6.7%. The driver of this growth is OECD Europe, which
accounted for 81.2% of OECD production in 2019. Much of the growth is attributable
to Germany, where electricity production from biogases grew by an average growth rate of 18.5% per annum since 1990 to 33.7 TWh in 2019, making it the largest
producer in the OECD with 41.4% of the total OECD electricity generation from
biogases.
The second largest OECD producer in 2019 is the United States which produced
11.7 TWh, or 14.3% of electricity from biogases in the OECD. However, despite its large
share in OECD production, the United States average annual growth rate (5.5% since
1990) has been much slower than many of the European Union countries that use
biogases, e.g. 33.2% in Italy and 18.6% in Belgium. The third and fourth largest OECD
producers were also located in Europe. Italy produced 8.1 TWh or 10.0% of OECD production, and the United Kingdom produced 7.2 TWh (8.9%).
Geothermal Similar to hydroelectric power, geothermal electricity production has not
experienced significant growth between 1990 and 2019. It grew at an average annual
rate of 2.3%, from 28.6 TWh to 56.0 TWh. During the timeframe of 2010 to 2019,
geothermal electricity grew from 43.4 TWh to 56.0 TWh, leading to an average annual growth rate of 2.9%. The United States is the largest producer with 32.5% of the OECD
total in 2019, with a production of 18.2 TWh, slightly above the 16.0 TWh level in 1990.
The second largest producer is Turkey, with 8.9 TWh in 2019, representing 15.9% of
total OECD production and 2.9% of its total electricity generation. Other major
producers are New Zealand (14.2% of total OECD in 2019), Italy (10.8%) and Iceland
(10.7%).
Renewable municipal waste3 Renewable municipal waste represented 1.2% of renewable electricity generation in
2019 in OECD countries, making it one of the smallest portions of the renewable
3 It should be noted that sometimes data are estimates rather than observations because the energy classification systems of some countries do not separate renewable and non-renewable municipal waste.
Renewables Information: Overview (2020 edition)
PAGE | 28 IEA
. All
right
s re
serv
ed.
electricity portfolio. The United States had the highest generation of electricity from
renewables municipal waste with 7.1 TWh. This represented 20.8% of total OECD electricity production. The second highest producer was Germany with 5.8 TWh,
followed by the United Kingdom with 3.7 TWh and France with 2.3 TWh. In 2019,
34.4 TWh of electricity was produced from renewable waste in the OECD.
Solar thermal Solar thermal power production experienced rapid growth in the 1990’s reaching
887 GWh in 1998, but stagnated in the following years. From 2007, solar thermal electricity production grew in Spain, followed by the U.S., with average annual
growth rates of 73.0% and 17.2%, respectively. These two countries account for
almost 100% of solar thermal electricity production in 2019 with 5.7 TWh in Spain and
4.5 TWh in the United States. The remaining 4.5 GWh were produced in Australia.
Liquid biofuels Liquid biofuels for electricity production is a relatively new technology. The first country to report electricity production of this type was Germany in 2001 with only
15 GWh. Since then, an increasing number of countries have produced substantial
amounts of electricity from liquid biofuels. In 2019, 14 countries reported a total of
7.0 TWh of production. The largest producer was Italy with 4.4 TWh. Liquid biofuels
are also commonly used for blending with fossil fuels or in final consumption.
Tide, wave, ocean In 2019, at least one country in each OECD region used tide, wave and ocean motion
to produce electricity. Some of the main producers were France (480 GWh), Korea
(474 GWh) and the United Kingdom (13 GWh).
The IEA examines the full spectrum of energy issues including oil, gas and coal supply and demand, renewable energy technologies, electricity markets, energy efficiency, access to energy, demand side management and much more. Through its work, the IEA advocates policies that will enhance the reliability, affordability and sustainability of energy in its 30 member countries, 8 association countries and beyond.
Please note that this publication is subject to specific restrictions that limit its use and distribution. The terms and conditions are available online at www.iea.org/t&c/
Source: IEA. All rights reserved.International Energy Agency Website: www.iea.org
IEA member countries:
Australia Austria BelgiumCanadaCzech Republic DenmarkEstoniaFinland France Germany Greece HungaryIreland ItalyJapanKorea Luxembourg Mexico Netherlands New Zealand NorwayPoland Portugal Slovak Republic Spain Sweden Switzerland Turkey United Kingdom United States
The European Commission also participates in the work of the IEA
IEA association countries:
BrazilChinaIndiaIndonesiaMoroccoSingaporeSouth AfricaThailand
INTERNATIONAL ENERGYAGENCY
This publication reflects the views of the IEA Secretariat but does not necessarily reflect those of individual IEA member countries. The IEA makes no representation or warranty, express or implied, in respect of the publication’s contents (including its completeness or accuracy) and shall not be responsible for any use of, or reliance on, the publication. Unless otherwise indicated, all material presented in figures and tables is derived from IEA data and analysis.
This publication and any map included herein are without prejudice to the status of or sovereignty over any territory, to the delimitation of international frontiers and boundaries and to the name of any territory, city or area.
IEA. All rights reserved.IEA PublicationsInternational Energy Agency Website: www.iea.orgContact information: www.iea.org/about/contact
Typeset in France by IEA - July 2020 Cover design: IEA