
Statistics on the ATLAS collaboration based on...
28
Statistics on the ATLAS collaboration based on authorship database as of 8 May 2008 Study done from two different view points 1. Gender perspective 2. National perspective 1
-
Upload
nguyenhanh -
Category
Documents
-
view
219 -
download
0
Transcript of Statistics on the ATLAS collaboration based on...
Statistics on the ATLAS
collaboration based on authorship database as of 8 May 2008
Study done from two different view points1. Gender perspective
2. National perspective
1

Statistics based on the ATLAS authorship database as of May 8th, 2008 and CERN database
All names were removed to maintain privacy For elected/appointed positions, information was
gathered from various websites or from the minutes of the Collaboration Board meetings
The spreadsheets will soon be made public to allow people to check/correct their content
All mistakes are mine
2
15-April-2008 ATLAS RRB 3
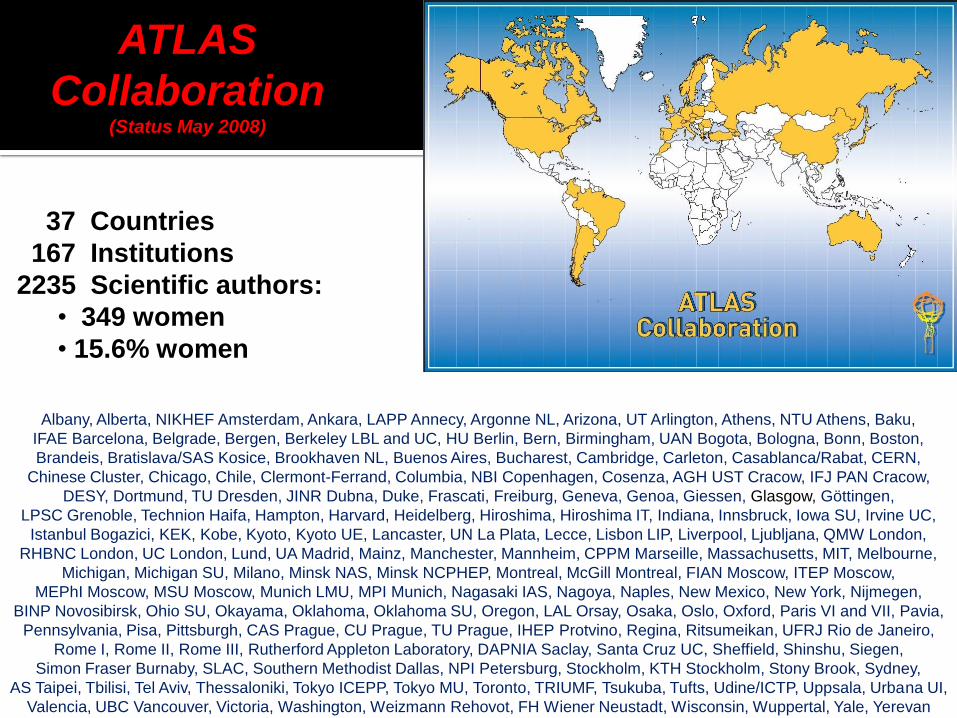
ATLAS
Collaboration(Status May 2008)
37 Countries
167 Institutions
2235 Scientific authors:
• 349 women
• 15.6% women
Albany, Alberta, NIKHEF Amsterdam, Ankara, LAPP Annecy, Argonne NL, Arizona, UT Arlington, Athens, NTU Athens, Baku,
IFAE Barcelona, Belgrade, Bergen, Berkeley LBL and UC, HU Berlin, Bern, Birmingham, UAN Bogota, Bologna, Bonn, Boston,
Brandeis, Bratislava/SAS Kosice, Brookhaven NL, Buenos Aires, Bucharest, Cambridge, Carleton, Casablanca/Rabat, CERN,
Chinese Cluster, Chicago, Chile, Clermont-Ferrand, Columbia, NBI Copenhagen, Cosenza, AGH UST Cracow, IFJ PAN Cracow,
DESY, Dortmund, TU Dresden, JINR Dubna, Duke, Frascati, Freiburg, Geneva, Genoa, Giessen, Glasgow, Göttingen,
LPSC Grenoble, Technion Haifa, Hampton, Harvard, Heidelberg, Hiroshima, Hiroshima IT, Indiana, Innsbruck, Iowa SU, Irvine UC,
Istanbul Bogazici, KEK, Kobe, Kyoto, Kyoto UE, Lancaster, UN La Plata, Lecce, Lisbon LIP, Liverpool, Ljubljana, QMW London,
RHBNC London, UC London, Lund, UA Madrid, Mainz, Manchester, Mannheim, CPPM Marseille, Massachusetts, MIT, Melbourne,
Michigan, Michigan SU, Milano, Minsk NAS, Minsk NCPHEP, Montreal, McGill Montreal, FIAN Moscow, ITEP Moscow,
MEPhI Moscow, MSU Moscow, Munich LMU, MPI Munich, Nagasaki IAS, Nagoya, Naples, New Mexico, New York, Nijmegen,
BINP Novosibirsk, Ohio SU, Okayama, Oklahoma, Oklahoma SU, Oregon, LAL Orsay, Osaka, Oslo, Oxford, Paris VI and VII, Pavia,
Pennsylvania, Pisa, Pittsburgh, CAS Prague, CU Prague, TU Prague, IHEP Protvino, Regina, Ritsumeikan, UFRJ Rio de Janeiro,
Rome I, Rome II, Rome III, Rutherford Appleton Laboratory, DAPNIA Saclay, Santa Cruz UC, Sheffield, Shinshu, Siegen,
Simon Fraser Burnaby, SLAC, Southern Methodist Dallas, NPI Petersburg, Stockholm, KTH Stockholm, Stony Brook, Sydney,
AS Taipei, Tbilisi, Tel Aviv, Thessaloniki, Tokyo ICEPP, Tokyo MU, Toronto, TRIUMF, Tsukuba, Tufts, Udine/ICTP, Uppsala, Urbana UI,
Valencia, UBC Vancouver, Victoria, Washington, Weizmann Rehovot, FH Wiener Neustadt, Wisconsin, Wuppertal, Yale, Yerevan
4
0
50
100
150
200
250
300
350
400
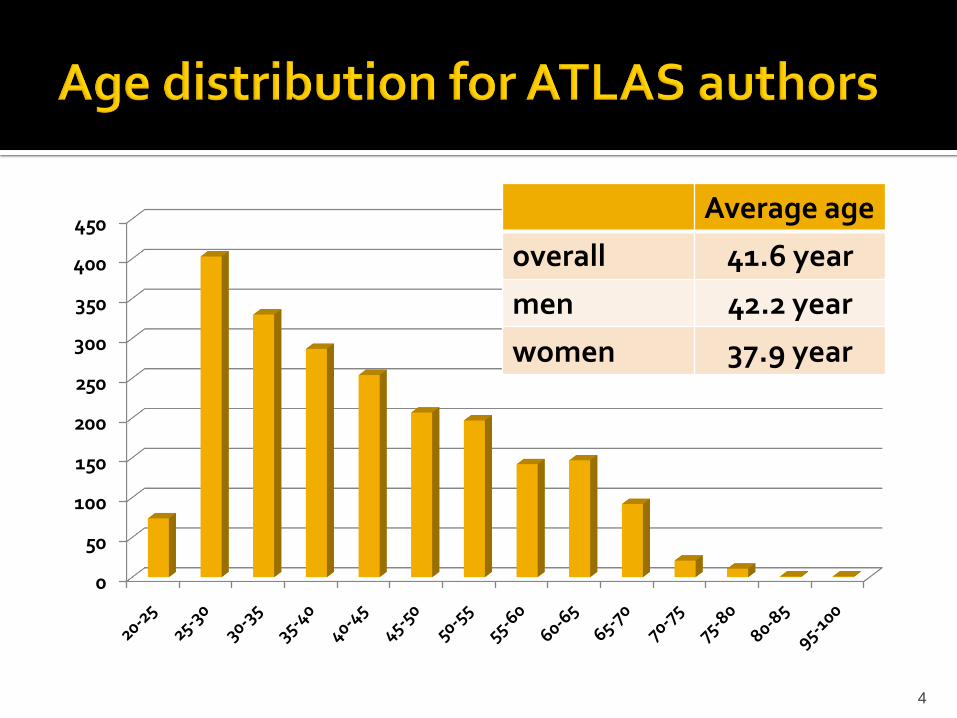
450Average age
overall 41.6 year
men 42.2 year
women 37.9 year
5
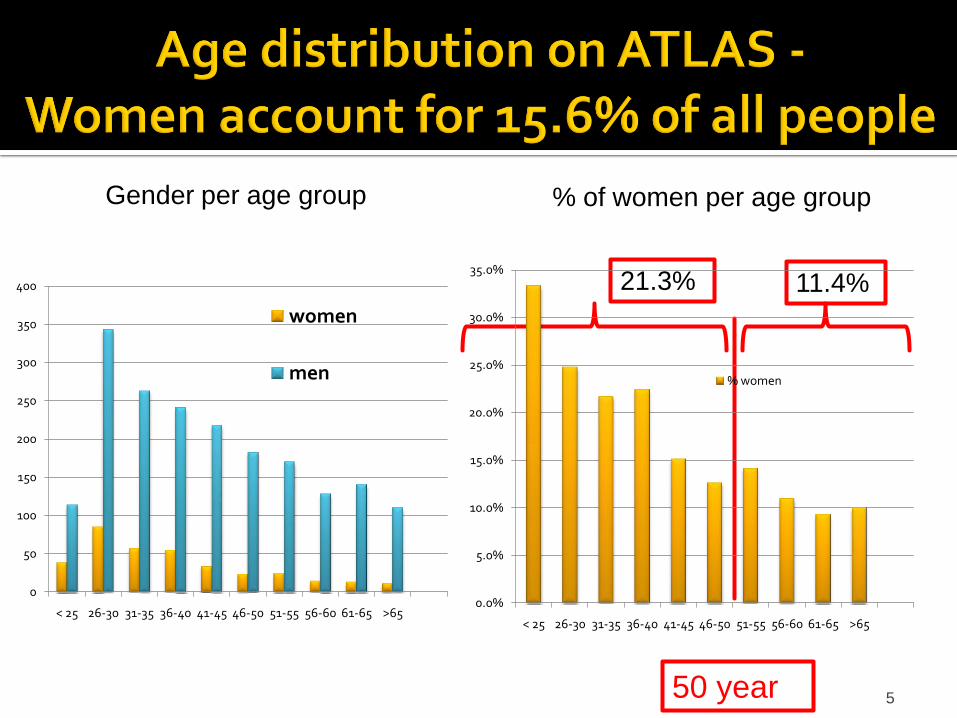
Gender per age group % of women per age group
11.4%21.3%
50 year
0
50
100
150
200
250
300
350
400
< 25 26-30 31-35 36-40 41-45 46-50 51-55 56-60 61-65 >65
women
men
0.0%
5.0%
10.0%
15.0%
20.0%
25.0%
30.0%
35.0%
< 25 26-30 31-35 36-40 41-45 46-50 51-55 56-60 61-65 >65
% women

Country women men total% women at
institute% women nationality
Grand Total 341 1825 2166 15.6% 15.6%
Italy 47 151 198 23.7% 24.1%
France 27 113 140 19.3% 18.0%
UK 35 170 205 17.1% 15.3%
Germany 37 222 259 14.3% 11.2%
Canada 12 74 86 14.0% 17.9%
USA 56 385 441 12.7% 10.2%
CERN 15 105 120 12.5% -
Czech Republic 5 58 63 7.9% 8.5%
Switzerland 2 25 27 7.4% 4.3%
Japan 4 78 82 4.9% 5.7%
Russia 5 105 110 4.5% 6.7%
6
country educating more women
physicists than hiring
country hiring more than
educating women in physics

7
Best on ATLASPhD's
Nationality
in ATLAS Worse on ATLAS PhD's
Nationality
in ATLAS
Country % % Country % %
France 27 18 China-Taipei 13 8
Poland 23 35 United States 13 10
Norway 23 15 Sweden 13 12
Ukraine 23 - Canada 12 18
Australia 22 20 Mexico 10 ---
Turkey 21 40 Germany 9 11
India 20 - Switzerland 9 4
Denmark 17 14 The Netherlands 9 7
Lithuania 17 - South Korea 8 -
United Kingdom 16 15 Japan 8 6
Data from 1996-2001 Source: Statistical Research Center, International Study of Women in Physics.

Nationality # women # men total % women % error
Romanian 11 16 27 40.7% 9.5%
Turkish 8 12 20 40.0% 11.0%
Polish 12 22 34 35.3% 8.2%
Greek 17 34 51 33.3% 6.6%
Spanish 23 59 82 28.0% 5.0%
Italian 66 217 283 23.3% 2.5%
Israeli 7 26 33 21.2% 7.1%
French 28 132 160 17.5% 3.0%
Canadian 12 59 71 16.9% 4.4%
ATLAS average 349 1886 2235 15.7% 0.8%
8

9
Nationality # women # men total % women % error
British 28 153 181 15.5% 2.7%
Norwegian 3 17 20 15.0% 8.0%
Swedish 4 30 34 11.8% 5.5%
German 31 247 278 11.2% 1.9%
American 26 223 249 10.4% 1.9%
Czech 6 67 73 8.2% 3.2%
Chinese 4 49 53 7.5% 3.6%
Dutch 3 41 44 6.8% 3.8%
Portuguese 2 29 31 6.5% 4.4%
Russian 9 132 141 6.4% 2.1%
Japanese 5 86 91 5.5% 2.4%
Austrian 1 20 21 4.8% 4.6%
Swiss 1 22 23 4.3% 4.3%
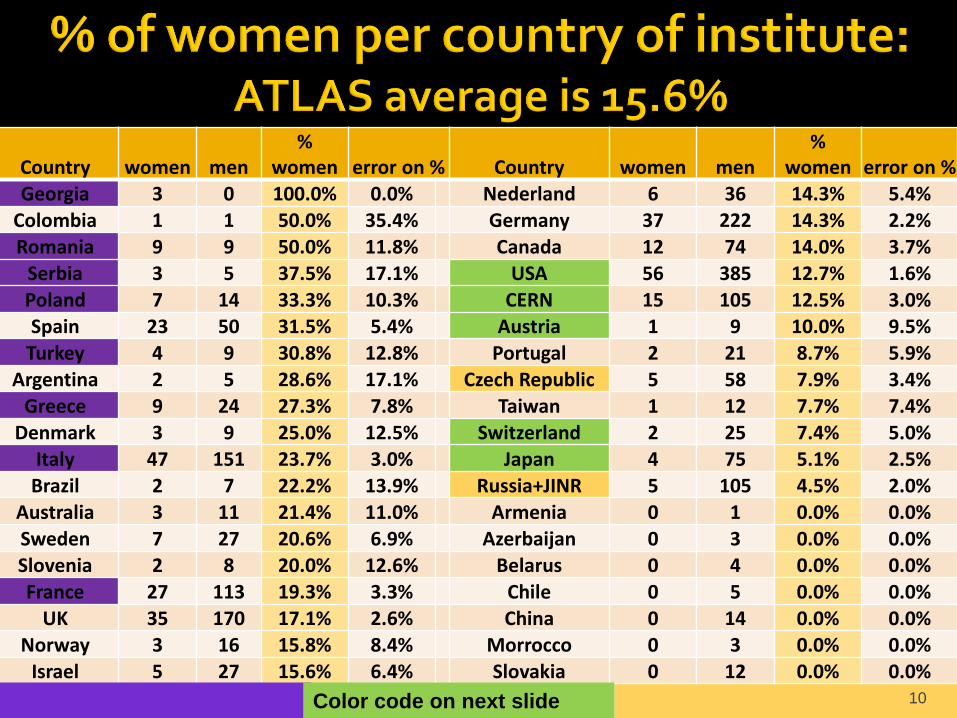
Country women men%
women error on % Country women men%
women error on %Georgia 3 0 100.0% 0.0% Nederland 6 36 14.3% 5.4%
Colombia 1 1 50.0% 35.4% Germany 37 222 14.3% 2.2%
Romania 9 9 50.0% 11.8% Canada 12 74 14.0% 3.7%Serbia 3 5 37.5% 17.1% USA 56 385 12.7% 1.6%
Poland 7 14 33.3% 10.3% CERN 15 105 12.5% 3.0%Spain 23 50 31.5% 5.4% Austria 1 9 10.0% 9.5%
Turkey 4 9 30.8% 12.8% Portugal 2 21 8.7% 5.9%
Argentina 2 5 28.6% 17.1% Czech Republic 5 58 7.9% 3.4%
Greece 9 24 27.3% 7.8% Taiwan 1 12 7.7% 7.4%Denmark 3 9 25.0% 12.5% Switzerland 2 25 7.4% 5.0%
Italy 47 151 23.7% 3.0% Japan 4 75 5.1% 2.5%
Brazil 2 7 22.2% 13.9% Russia+JINR 5 105 4.5% 2.0%Australia 3 11 21.4% 11.0% Armenia 0 1 0.0% 0.0%
Sweden 7 27 20.6% 6.9% Azerbaijan 0 3 0.0% 0.0%
Slovenia 2 8 20.0% 12.6% Belarus 0 4 0.0% 0.0%
France 27 113 19.3% 3.3% Chile 0 5 0.0% 0.0%UK 35 170 17.1% 2.6% China 0 14 0.0% 0.0%
Norway 3 16 15.8% 8.4% Morrocco 0 3 0.0% 0.0%Israel 5 27 15.6% 6.4% Slovakia 0 12 0.0% 0.0%
10Color code on next slide
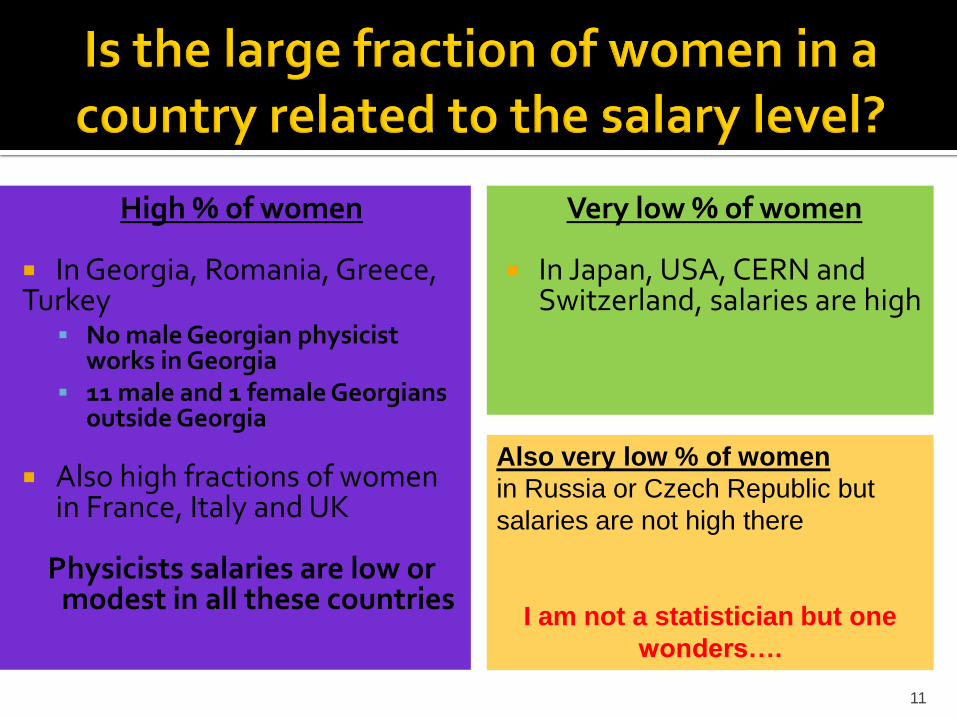
High % of women
In Georgia, Romania, Greece, Turkey No male Georgian physicist
works in Georgia 11 male and 1 female Georgians
outside Georgia
Also high fractions of women in France, Italy and UK
Physicists salaries are low or modest in all these countries
Very low % of women
In Japan, USA, CERN and Switzerland, salaries are high
11
Also very low % of women
in Russia or Czech Republic but
salaries are not high there
I am not a statistician but one
wonders….
12
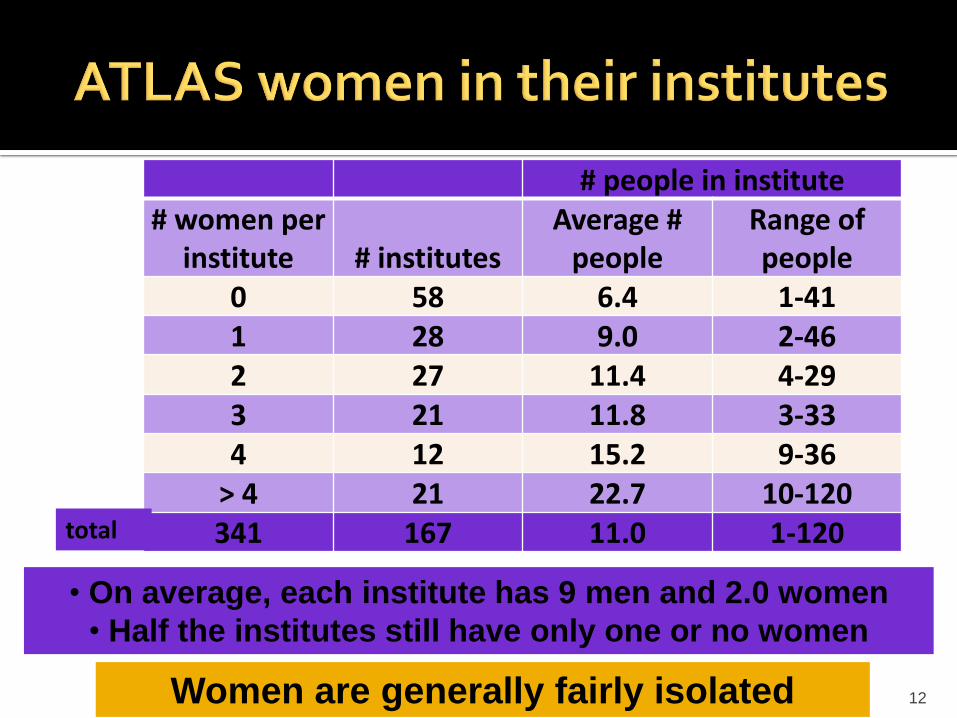
• On average, each institute has 9 men and 2.0 women
• Half the institutes still have only one or no women
# people in institute # women per
institute # institutesAverage #
peopleRange of people
0 58 6.4 1-411 28 9.0 2-462 27 11.4 4-293 21 11.8 3-334 12 15.2 9-36
> 4 21 22.7 10-120341 167 11.0 1-120total
Women are generally fairly isolated
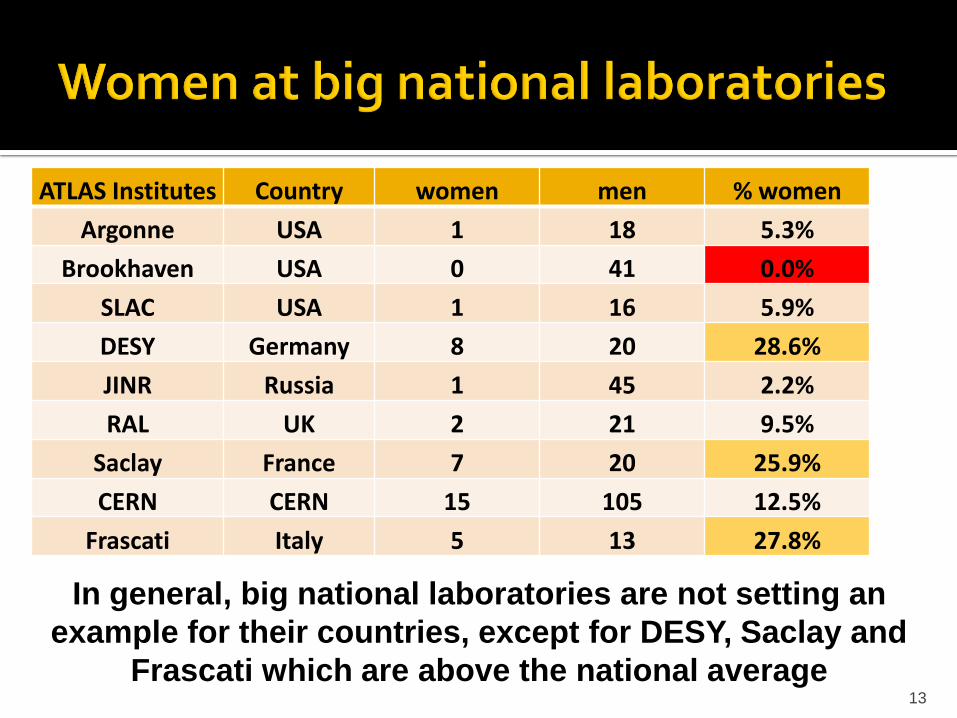
ATLAS Institutes Country women men % women
Argonne USA 1 18 5.3%
Brookhaven USA 0 41 0.0%
SLAC USA 1 16 5.9%
DESY Germany 8 20 28.6%
JINR Russia 1 45 2.2%
RAL UK 2 21 9.5%
Saclay France 7 20 25.9%
CERN CERN 15 105 12.5%
Frascati Italy 5 13 27.8%
13
In general, big national laboratories are not setting an
example for their countries, except for DESY, Saclay and
Frascati which are above the national average
14
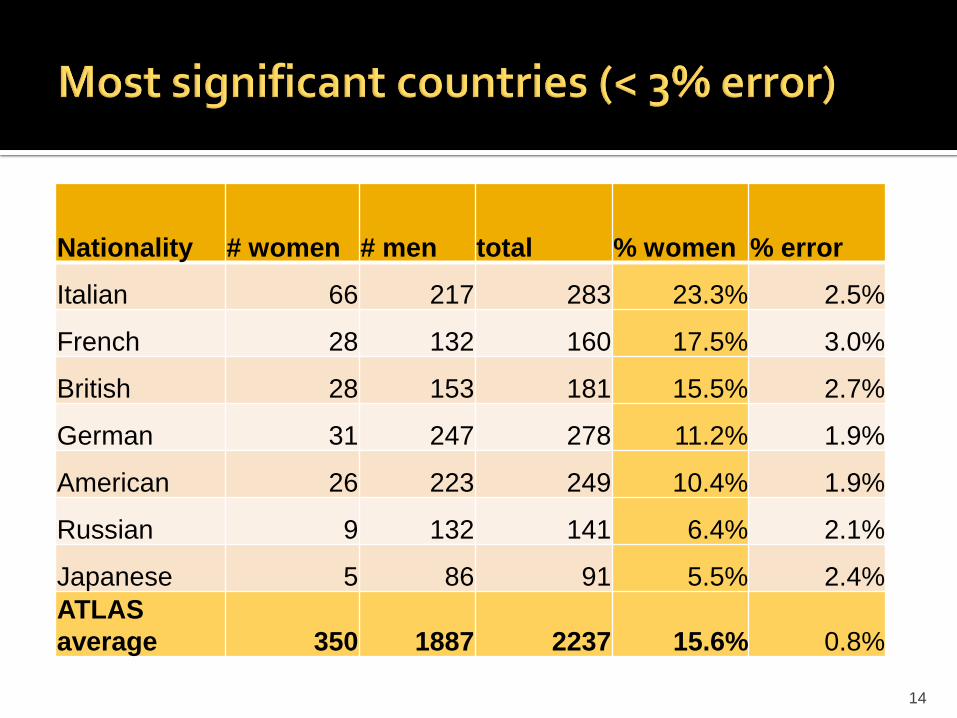
Nationality # women # men total % women % error
Italian 66 217 283 23.3% 2.5%
French 28 132 160 17.5% 3.0%
British 28 153 181 15.5% 2.7%
German 31 247 278 11.2% 1.9%
American 26 223 249 10.4% 1.9%
Russian 9 132 141 6.4% 2.1%
Japanese 5 86 91 5.5% 2.4%
ATLAS
average 350 1887 2237 15.6% 0.8%
15
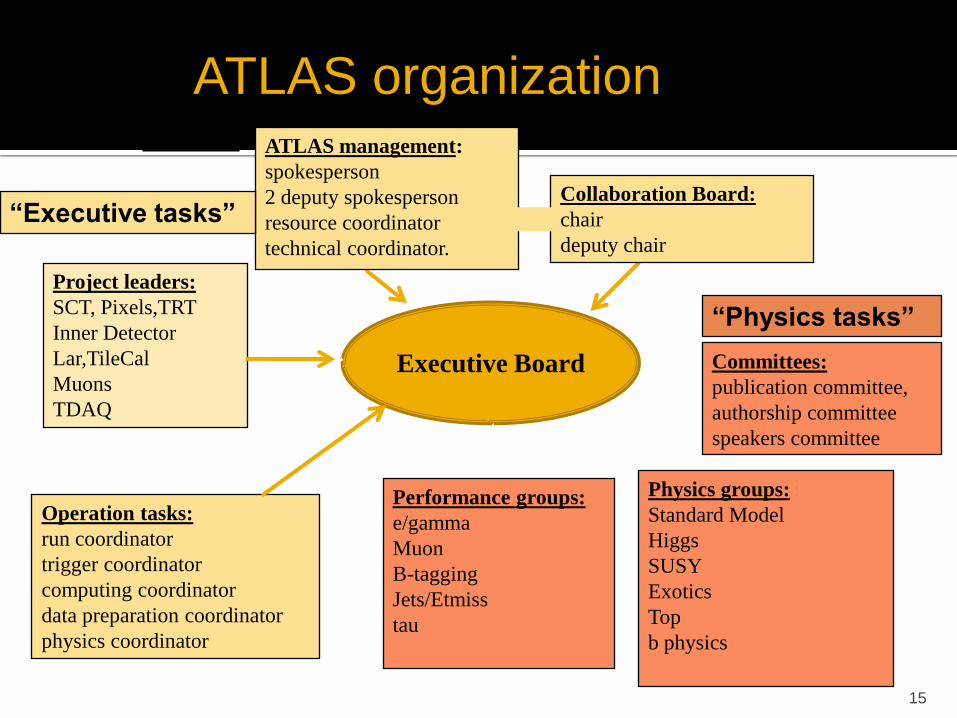
ATLAS organization
Operation tasks:
run coordinator
trigger coordinator
computing coordinator
data preparation coordinator
physics coordinator
Project leaders:
SCT, Pixels,TRT
Inner Detector
Lar,TileCal
Muons
TDAQ
Executive Board
ATLAS management:
spokesperson
2 deputy spokesperson
resource coordinator
technical coordinator.
Collaboration Board:
chair
deputy chair
“Executive tasks”
Committees:
publication committee,
authorship committee
speakers committee
Physics groups:
Standard Model
Higgs
SUSY
Exotics
Top
b physics
Performance groups:
e/gamma
Muon
B-tagging
Jets/Etmiss
tau
“Physics tasks”

“Executive” tasks
0.0%5.0%
10.0%15.0%20.0%25.0%30.0%35.0%40.0%
Physics tasksExecutive tasks

0
0.05
0.1
0.15
0.2
0.25
0.3
0.35
0.4
0.45
0.5
1 2 3 4 5 6 7 8 9 10
management 2000-08 (7 person per year)
project leaders 2000-08 (8 person peryear)
operation tasks 2003-08 (5-12 person per year)
physics conveners 2004-09 (18 person per year)
performance 2005-08 (9 person per year)
committees 2001-08 (19 person per year)2000 2001 2002 2003 2004 2005 2006 2007 2008 2009
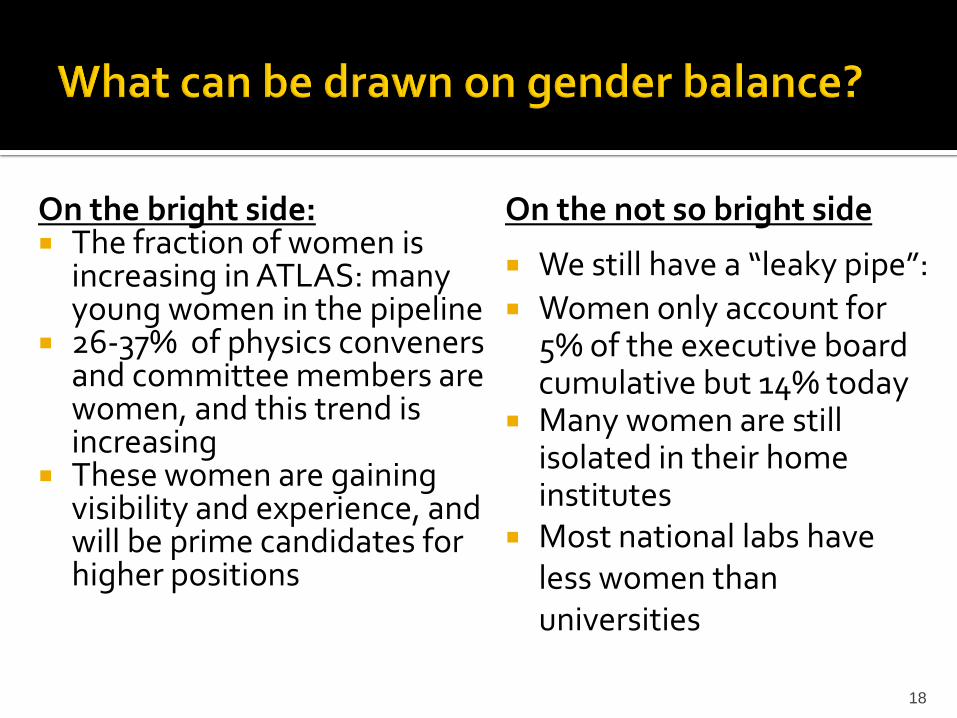
On the bright side: The fraction of women is
increasing in ATLAS: many young women in the pipeline
26-37% of physics conveners and committee members are women, and this trend is increasing
These women are gaining visibility and experience, and will be prime candidates for higher positions
18
On the not so bright side
We still have a “leaky pipe”:
Women only account for 5% of the executive board cumulative but 14% today
Many women are still isolated in their home institutes
Most national labs have less women than universities
19

Home institute country
% of ATLAS
Home institute country
% of ATLAS
USA 20.4% Nederland 1.9%Germany 12.0% Sweden 1.6%UK 9.5% Greece 1.5%Italy 9.1% Israel 1.5%France 6.5% Switzerland 1.2%CERN 5.5% Portugal 1.1%Russia 5.1% Poland 1.0%Canada 4.0% Norway 0.9%Japan 3.8% Romania 0.8%Spain 3.4% Australia 0.7%Czech Republic 2.9% Others (17) 6.5%
20
51 %
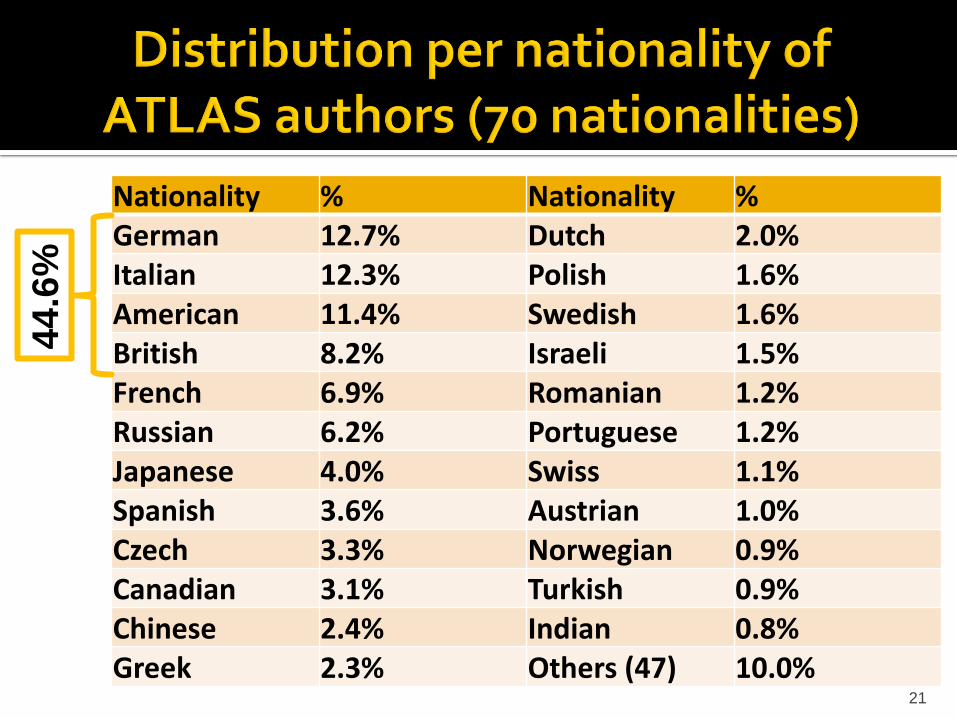
Nationality % Nationality %German 12.7% Dutch 2.0%Italian 12.3% Polish 1.6%American 11.4% Swedish 1.6%British 8.2% Israeli 1.5%French 6.9% Romanian 1.2%Russian 6.2% Portuguese 1.2%Japanese 4.0% Swiss 1.1%Spanish 3.6% Austrian 1.0%Czech 3.3% Norwegian 0.9%Canadian 3.1% Turkish 0.9%Chinese 2.4% Indian 0.8%Greek 2.3% Others (47) 10.0%
21
44
.6%
22
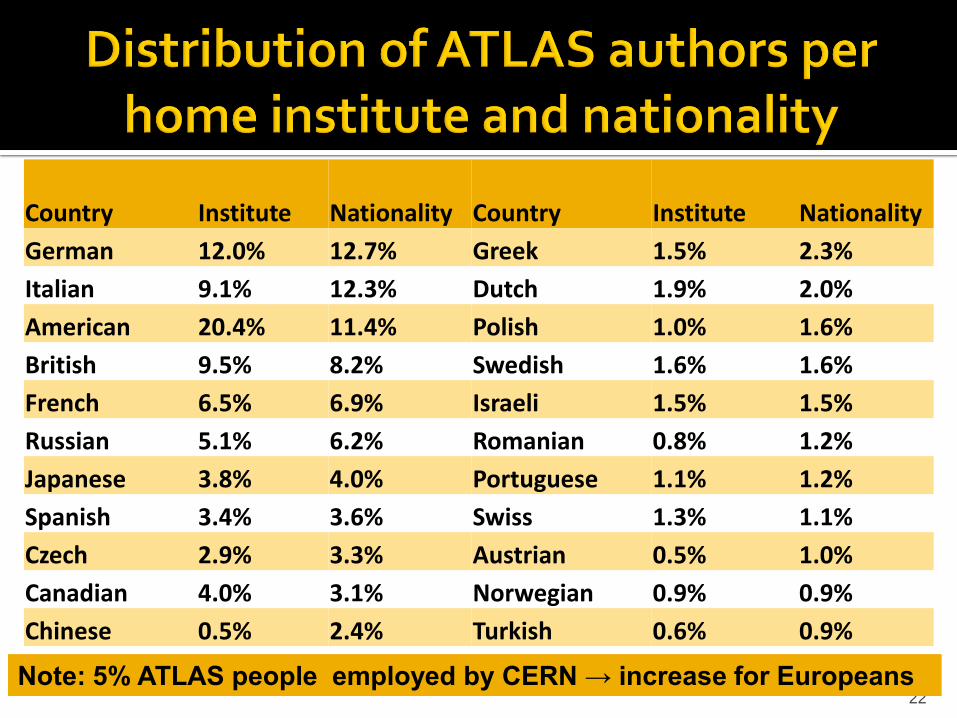
Country Institute Nationality Country Institute Nationality
German 12.0% 12.7% Greek 1.5% 2.3%
Italian 9.1% 12.3% Dutch 1.9% 2.0%
American 20.4% 11.4% Polish 1.0% 1.6%
British 9.5% 8.2% Swedish 1.6% 1.6%
French 6.5% 6.9% Israeli 1.5% 1.5%
Russian 5.1% 6.2% Romanian 0.8% 1.2%
Japanese 3.8% 4.0% Portuguese 1.1% 1.2%
Spanish 3.4% 3.6% Swiss 1.3% 1.1%
Czech 2.9% 3.3% Austrian 0.5% 1.0%
Canadian 4.0% 3.1% Norwegian 0.9% 0.9%
Chinese 0.5% 2.4% Turkish 0.6% 0.9%
Note: 5% ATLAS people employed by CERN → increase for Europeans
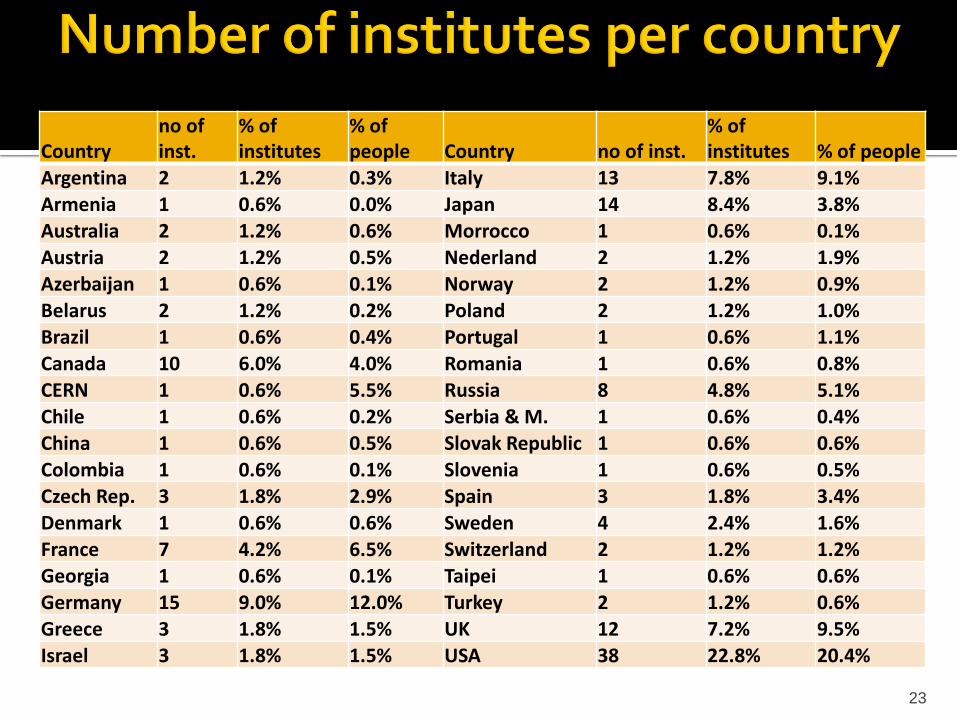
Countryno of inst.
% of institutes
% of people Country no of inst.
% of institutes % of people
Argentina 2 1.2% 0.3% Italy 13 7.8% 9.1%Armenia 1 0.6% 0.0% Japan 14 8.4% 3.8%
Australia 2 1.2% 0.6% Morrocco 1 0.6% 0.1%Austria 2 1.2% 0.5% Nederland 2 1.2% 1.9%
Azerbaijan 1 0.6% 0.1% Norway 2 1.2% 0.9%Belarus 2 1.2% 0.2% Poland 2 1.2% 1.0%
Brazil 1 0.6% 0.4% Portugal 1 0.6% 1.1%Canada 10 6.0% 4.0% Romania 1 0.6% 0.8%CERN 1 0.6% 5.5% Russia 8 4.8% 5.1%
Chile 1 0.6% 0.2% Serbia & M. 1 0.6% 0.4%China 1 0.6% 0.5% Slovak Republic 1 0.6% 0.6%
Colombia 1 0.6% 0.1% Slovenia 1 0.6% 0.5%Czech Rep. 3 1.8% 2.9% Spain 3 1.8% 3.4%
Denmark 1 0.6% 0.6% Sweden 4 2.4% 1.6%
France 7 4.2% 6.5% Switzerland 2 1.2% 1.2%
Georgia 1 0.6% 0.1% Taipei 1 0.6% 0.6%Germany 15 9.0% 12.0% Turkey 2 1.2% 0.6%Greece 3 1.8% 1.5% UK 12 7.2% 9.5%
Israel 3 1.8% 1.5% USA 38 22.8% 20.4%
23
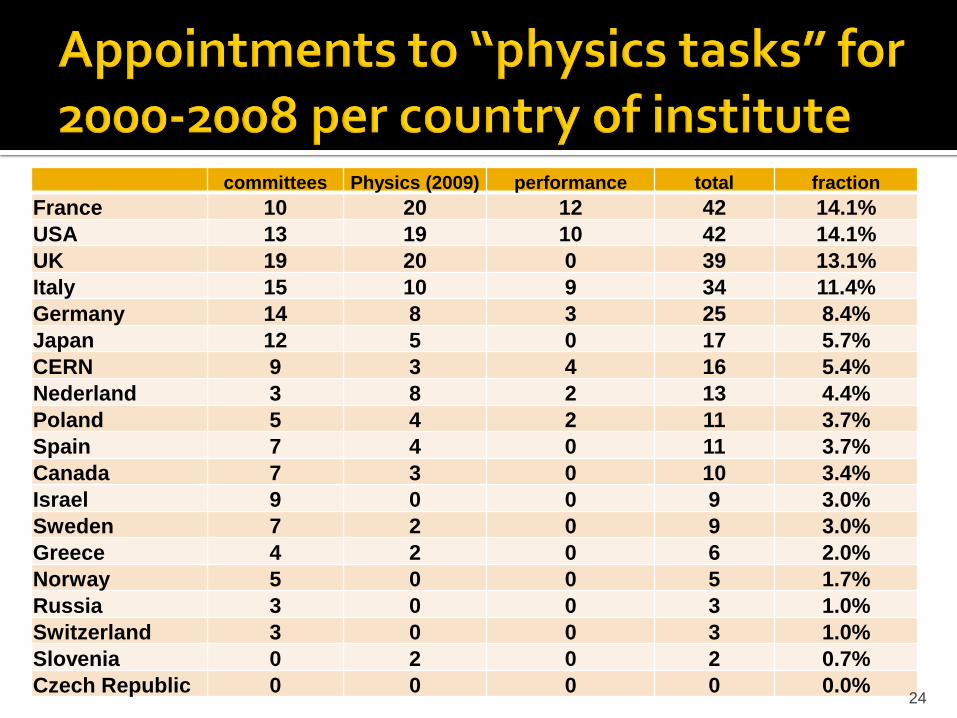
committees Physics (2009) performance total fraction
France 10 20 12 42 14.1%
USA 13 19 10 42 14.1%
UK 19 20 0 39 13.1%
Italy 15 10 9 34 11.4%
Germany 14 8 3 25 8.4%
Japan 12 5 0 17 5.7%
CERN 9 3 4 16 5.4%
Nederland 3 8 2 13 4.4%
Poland 5 4 2 11 3.7%
Spain 7 4 0 11 3.7%
Canada 7 3 0 10 3.4%
Israel 9 0 0 9 3.0%
Sweden 7 2 0 9 3.0%
Greece 4 2 0 6 2.0%
Norway 5 0 0 5 1.7%
Russia 3 0 0 3 1.0%
Switzerland 3 0 0 3 1.0%
Slovenia 0 2 0 2 0.7%
Czech Republic 0 0 0 0 0.0%24
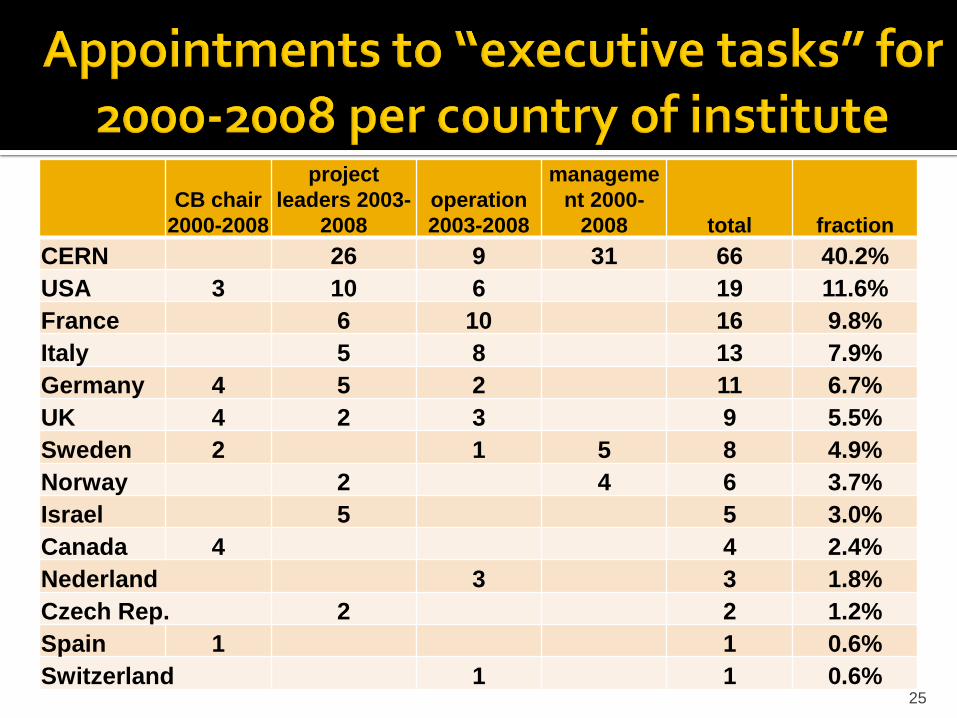
CB chair
2000-2008
project
leaders 2003-
2008
operation
2003-2008
manageme
nt 2000-
2008 total fraction
CERN 26 9 31 66 40.2%
USA 3 10 6 19 11.6%
France 6 10 16 9.8%
Italy 5 8 13 7.9%
Germany 4 5 2 11 6.7%
UK 4 2 3 9 5.5%
Sweden 2 1 5 8 4.9%
Norway 2 4 6 3.7%
Israel 5 5 3.0%
Canada 4 4 2.4%
Nederland 3 3 1.8%
Czech Rep. 2 2 1.2%
Spain 1 1 0.6%
Switzerland 1 1 0.6%25
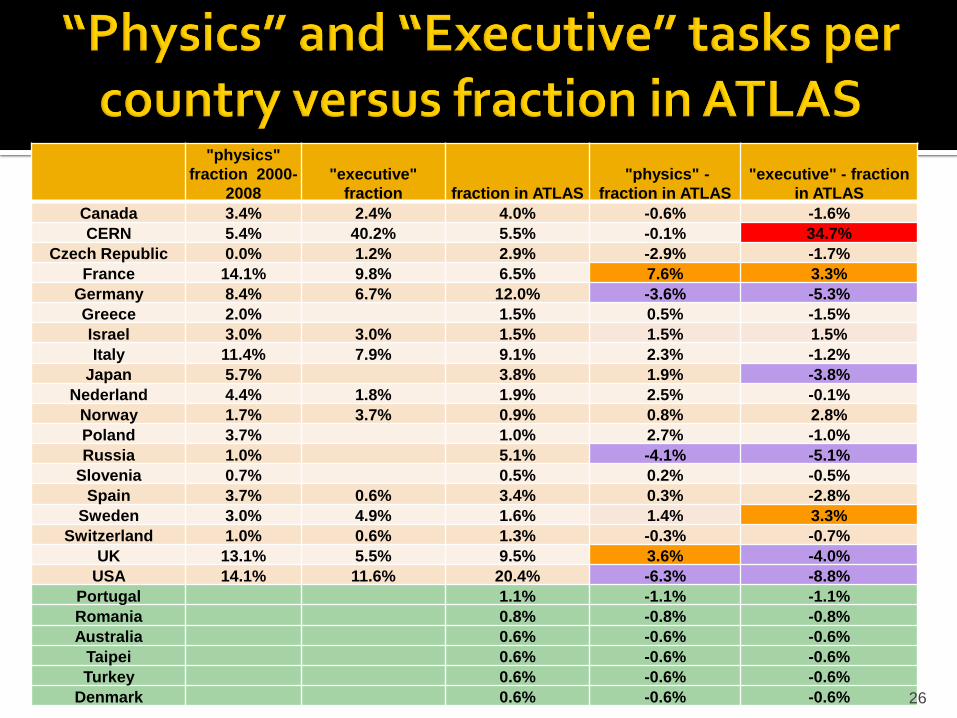
"physics"
fraction 2000-
2008
"executive"
fraction fraction in ATLAS
"physics" -
fraction in ATLAS
"executive" - fraction
in ATLAS
Canada 3.4% 2.4% 4.0% -0.6% -1.6%
CERN 5.4% 40.2% 5.5% -0.1% 34.7%
Czech Republic 0.0% 1.2% 2.9% -2.9% -1.7%
France 14.1% 9.8% 6.5% 7.6% 3.3%
Germany 8.4% 6.7% 12.0% -3.6% -5.3%
Greece 2.0% 1.5% 0.5% -1.5%
Israel 3.0% 3.0% 1.5% 1.5% 1.5%
Italy 11.4% 7.9% 9.1% 2.3% -1.2%
Japan 5.7% 3.8% 1.9% -3.8%
Nederland 4.4% 1.8% 1.9% 2.5% -0.1%
Norway 1.7% 3.7% 0.9% 0.8% 2.8%
Poland 3.7% 1.0% 2.7% -1.0%
Russia 1.0% 5.1% -4.1% -5.1%
Slovenia 0.7% 0.5% 0.2% -0.5%
Spain 3.7% 0.6% 3.4% 0.3% -2.8%
Sweden 3.0% 4.9% 1.6% 1.4% 3.3%
Switzerland 1.0% 0.6% 1.3% -0.3% -0.7%
UK 13.1% 5.5% 9.5% 3.6% -4.0%
USA 14.1% 11.6% 20.4% -6.3% -8.8%
Portugal 1.1% -1.1% -1.1%
Romania 0.8% -0.8% -0.8%
Australia 0.6% -0.6% -0.6%
Taipei 0.6% -0.6% -0.6%
Turkey 0.6% -0.6% -0.6%
Denmark 0.6% -0.6% -0.6% 26

Small mistakes still need to be corrected Many different factors have also contributed
such as, for example:
Time since an institute joined ATLAS
Ratio of junior/senior people in a group
Geographical location: people nearer CERN can more easily accept a position at CERN
Availability and interest of the individuals proposed at each level
27
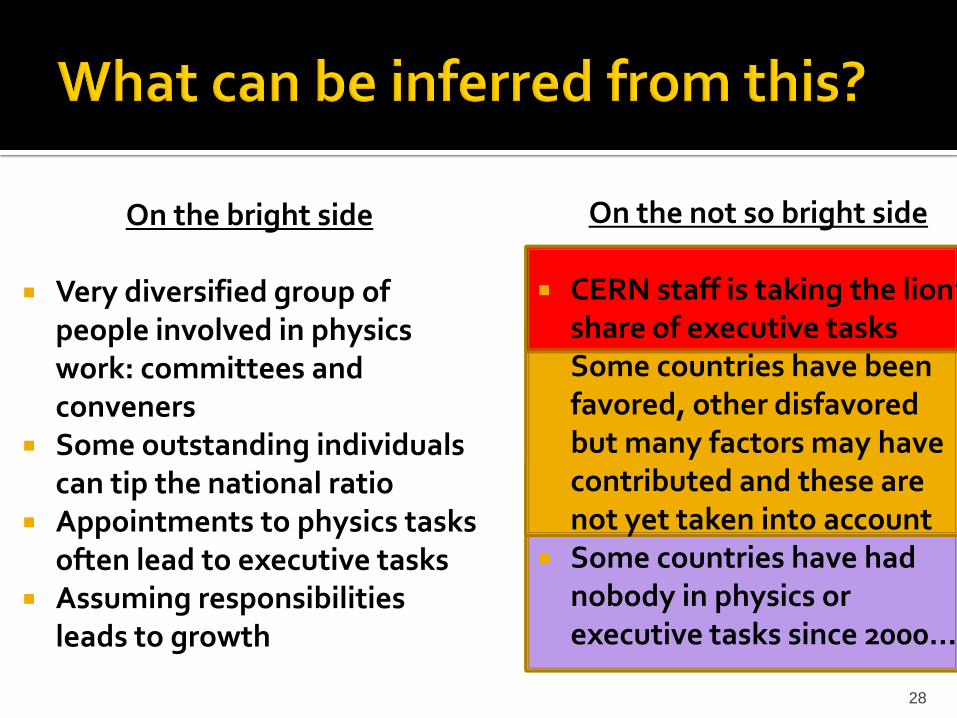
On the bright side
Very diversified group of people involved in physics work: committees and conveners
Some outstanding individuals can tip the national ratio
Appointments to physics tasks often lead to executive tasks
Assuming responsibilities leads to growth
On the not so bright side
CERN staff is taking the lion’s share of executive tasks
Some countries have been favored, other disfavored
but many factors may have contributed and these are not yet taken into account
Some countries have had nobody in physics or executive tasks since 2000…
28


