
STATISTICS OF VEGETABLES AND MELONS · STATISTICS OF VEGETABLES AND MELONS This chapter contains...
43
IV–1 CHAPTER IV STATISTICS OF VEGETABLES AND MELONS This chapter contains statistics on potatoes, sweet potatoes, and commercial vegetables and melons. For potatoes and sweet potatoes, the estimates of area, production, value, and farm disposition per- tain to the total crop and include quantities produced both for sale and for use on farms where grown. Potato statistics are shown on a within-year seasonal grouping of winter, spring, summer, and fall crops, by States. Some States have production in more than one seasonal group. Commercial vegetables for fresh market include 24 principal vegetable and melon crops in the major producing States. These estimates relate to crops which are grown primarily for sale and do not include vegetables and melons produced in farm and non-farm gardens. The bulk of the produc- tion of the principal vegetable and melon crops is for consumption in the fresh state. The commercial estimates of these crops include local market production from areas near consuming centers as well as production from well recognized commercial areas which specialize in producing supplies for ship- ment to distant markets. For fresh market vegetables and melons, value per unit and total value are on an f.o.b. basis. For processing vegetables, the estimates of area, production, and value for each of 10 crops relate to production used by commercial canners, freezers, and other processors, except dehydrators. These estimates include raw products grown by processors themselves and those grown under contract or purchased on the open market. This production and the actual area harvested are not duplicated in the fresh market estimates for the same commodities. The production of those vegetables used for processing for which regular processing estimates are not made is included in the fresh market esti- mates. The processed segment of production for asparagus, broccoli, and cauliflower, combined with fresh market production during the year, is published separately at the end of the season. For proc- essed vegetables, value per unit and total value are at processing plant door. Beginning in 2016, acreage and yield estimates for fresh market and processing utilizations were discontinued. Total production and utilized production are estimated for each crop. Harvested not sold estimates were added to the estimating program. This is defined as the difference between total pro- duction and total utilized production.
Transcript of STATISTICS OF VEGETABLES AND MELONS · STATISTICS OF VEGETABLES AND MELONS This chapter contains...

IV–1
CHAPTER IV
STATISTICS OF VEGETABLES AND MELONS
This chapter contains statistics on potatoes, sweet potatoes, and commercial vegetables and melons.
For potatoes and sweet potatoes, the estimates of area, production, value, and farm disposition per-tain to the total crop and include quantities produced both for sale and for use on farms where grown. Potato statistics are shown on a within-year seasonal grouping of winter, spring, summer, and fall crops, by States. Some States have production in more than one seasonal group.
Commercial vegetables for fresh market include 24 principal vegetable and melon crops in the major producing States. These estimates relate to crops which are grown primarily for sale and do not include vegetables and melons produced in farm and non-farm gardens. The bulk of the produc-tion of the principal vegetable and melon crops is for consumption in the fresh state. The commercial estimates of these crops include local market production from areas near consuming centers as well as production from well recognized commercial areas which specialize in producing supplies for ship-ment to distant markets. For fresh market vegetables and melons, value per unit and total value are on an f.o.b. basis.
For processing vegetables, the estimates of area, production, and value for each of 10 crops relate to production used by commercial canners, freezers, and other processors, except dehydrators. These estimates include raw products grown by processors themselves and those grown under contract or purchased on the open market. This production and the actual area harvested are not duplicated in the fresh market estimates for the same commodities. The production of those vegetables used for processing for which regular processing estimates are not made is included in the fresh market esti-mates. The processed segment of production for asparagus, broccoli, and cauliflower, combined with fresh market production during the year, is published separately at the end of the season. For proc-essed vegetables, value per unit and total value are at processing plant door.
Beginning in 2016, acreage and yield estimates for fresh market and processing utilizations were discontinued. Total production and utilized production are estimated for each crop. Harvested not sold estimates were added to the estimating program. This is defined as the difference between total pro-duction and total utilized production.

IV–2 STATISTICS OF VEGETABLES AND MELONS
Table 4-1.—Vegetables, commercial: Area, production, and value of principal crops, United States, 2007-2016
Year Area 1
Fresh market 2 Processing 3
Acres Acres
2007 ..................... 1,784,290 1,249,230 2008 ..................... 1,710,884 1,224,410 2009 ..................... 1,681,774 1,264,849 2010 ..................... 1,685,155 1,142,000 2011 ..................... 1,624,535 1,057,480 2012 ..................... 1,626,510 1,135,605 2013 ..................... 1,628,010 1,053,160 2014 ..................... 1,571,860 1,097,770 2015 ..................... 1,561,350 1,075,750 2016 4 .................. (NA) (NA)
Year Production 5
Fresh market 2 Processing 3
1,000 cwt Tons
2007 ..................... 459,421 17,799,410 2008 ..................... 445,551 17,473,670 2009 ..................... 437,980 19,518,030 2010 ..................... 438,324 17,599,990 2011 ..................... 426,656 17,001,540 2012 ..................... 429,988 18,225,775 2013 ..................... 418,009 17,168,580 2014 ..................... 409,104 19,248,660 2015 ..................... 404,590 19,371,595 2016 ..................... 375,305 19,985,548
Year Value 6
Fresh market 2 Processing 3
1,000 dollars 1,000 dollars
2007 ..................... 10,047,825 1,609,544 2008 ..................... 10,297,645 1,896,796 2009 ..................... 10,757,613 2,102,214 2010 ..................... 10,777,069 1,659,332 2011 ..................... 10,532,246 1,771,192 2012 ..................... 9,797,128 2,002,481 2013 ..................... 11,488,248 2,092,316 2014 ..................... 10,729,140 2,326,419 2015 ..................... 12,451,434 2,196,736 2016 ..................... 11,084,467 2,280,068
Note: Beginning in 2016, Acreage and Yield estimates for fresh market and processing utilizations were discontinued. Total Production and Utilized Production are estimated for each crop. Harvested Not Sold estimates were added to the esti-mating program. This is defined as the difference between Total Production and Total Utilized Production. For Table 4-1, 2016 will only have fresh market production, processing production, fresh market value, and processing value.
1 Area for fresh market is area for harvest, including any partially harvested or not harvested because of low prices or other economic factors. Area for processing is area harvested. 2 Area, production, and farm value of the following crops for which regular seasonal estimates are prepared in major producing States: Artichokes, asparagus, snap beans, broccoli, cab-bage, cantaloups, carrots, cauliflower, celery, sweet corn, cucumbers, garlic, honeydew melons, head lettuce, leaf lettuce, romaine lettuce, onions, bell peppers, chile peppers, pumpkins, spinach, squash, tomatoes, and watermelons. 3 Area, pro-duction, and farm value of the following 8 crops in all States: Lima beans, snap beans, carrots, sweet corn, cucumbers (pickles), green peas, spinach, and tomatoes. Production of other vegetables processed included in fresh market series of estimates. 4 Beginning in 2016, acreage estimates for fresh market and processing utilizations were discontinued.
5 Production for fresh market excludes some quantities not marketed because of low prices or other economic fac-tors. 6 Value for all fresh market vegetables. For processing vegetables, value at processing plant door.
NASS, Crops Branch, (202) 720–2127.

IV–3 AGRICULTURAL STATISTICS 2017
Table 4-2.—Vegetables, commercial: Area of principal crops, by State and United States, 2014–2016 1
State Fresh market 2 Processing 3 Total acres harvested 4
2014 2015 2014 2015 2016
Acres Acres Acres Acres Acres
Alabama .................. 5,000 4,900 .......................... .......................... 3,500 Arizona .................... 110,000 112,800 .......................... .......................... 124,600 Arkansas ................. 2,500 2,300 .......................... .......................... .........................................California ................. 727,900 711,900 308,460 313,550 1,017,800 Colorado ................. 12,100 11,750 .......................... .......................... (D) Connecticut ............. 4,000 3,600 .......................... .......................... .........................................Delaware ................. 6,000 5,900 27,800 28,000 (D) Florida ..................... 150,200 154,500 .......................... .......................... 162,600 Georgia ................... 87,200 90,100 2,050 2,750 93,100 Idaho ....................... 6,900 8,000 .......................... .......................... 11,700 Illinois ...................... 25,900 20,800 30,100 36,100 55,400 Indiana .................... 15,520 14,400 .......................... .......................... 30,900 Maine ...................... 1,600 1,400 .......................... .......................... .........................................Maryland ................. 9,180 8,670 12,990 11,490 17,700 Massachusetts ........ 4,300 3,300 .......................... .......................... .........................................Michigan ................. 48,500 47,900 .......................... .......................... 104,700 Minnesota ............... .......................... .......................... 178,030 158,000 156,600 Mississippi .............. 2,100 1,800 .......................... .......................... .........................................Missouri .................. 2,700 2,600 (D) (D) 2,700 Nevada ................... 4,150 4,200 .......................... .......................... .........................................New Hampshire ...... 1,400 1,300 .......................... .......................... .........................................New Jersey ............. 22,900 22,600 4,200 3,800 26,500 New Mexico ............ 12,800 13,300 .......................... .......................... 14,800 New York ................ 58,470 56,210 39,320 39,510 83,600 North Carolina ........ 30,500 28,300 .......................... .......................... 38,200 Ohio ........................ 30,800 29,100 10,900 9,700 37,000 Oklahoma ............... 2,600 4,000 .......................... .......................... .........................................Oregon .................... 27,750 29,400 53,000 51,800 (D) Pennsylvania .......... 21,860 18,730 .......................... .......................... 23,900 Rhode Island .......... 690 (D) .......................... .......................... .........................................South Carolina ........ 15,500 14,500 .......................... .......................... 14,300 Tennessee .............. 10,130 10,990 .......................... .......................... 15,600 Texas ...................... 52,230 49,050 8,500 8,270 62,100 Utah ........................ 1,400 1,300 .......................... .......................... .........................................Vermont .................. 910 (D) .......................... .......................... .........................................Virginia .................... 8,370 8,360 (D) .......................... (D) Washington ............. 39,700 54,100 115,900 127,930 174,200 Wisconsin ............... 8,100 8,000 177,700 172,220 (D) Other States 5 ......... (X) 1,290 128,820 112,630 294,400
United States .......... 1,571,860 1,561,350 1,097,770 1,075,750 2,565,900
Note: Beginning in 2016, Acreage and Yield estimates for fresh market and processing utilizations were discontinued. Total Production and Utilized Production are estimated for each crop. Harvested Not Sold estimates were added to the esti-mating program. This is defined as the difference between Total Production and Total Utilized Production. Table 4-2 shows total area harvested.
(D) Withheld to avoid disclosing data for individual operations. (X) Not applicable. 1 Area for fresh market and for proc-essing is area harvested. 2 Area of the following crops for which regular seasonal estimates are prepared in major pro-ducing States: Artichokes, asparagus, snap beans, broccoli, cabbage, cantaloups, carrots, cauliflower, celery, sweet corn, cucumbers, garlic, honeydew melons, head lettuce, leaf lettuce, romaine lettuce, onions, bell peppers, Chile pepper, spin-ach, tomatoes, and watermelons. 3 Includes Lima beans, snap beans, carrots, sweet corn, cucumbers (pickles), green peas, spinach, and tomatoes. Other vegetables processed (dual purpose) included in fresh market series of esti-mates. 4 Beginning in 2016, acreage and yeild estimates for fresh market and processing utilizations were discontinued. Harvested not sold estimates were added to the estimating program. This is defined as the difference between total produc-tion and total utilized production. 5 Other States include Alabama, Arkansas, Florida, Iowa, Idaho, Indiana, Massachusetts, Michigan, North Carolina, Pennsylvania, and South Carolina.
NASS, Crops Branch, (202) 720–2127.

IV–4 STATISTICS OF VEGETABLES AND MELONS
Table 4-3.—Vegetables, commercial: Production of principal crops, by State and United States, 2014–2016
State Fresh market 1 Processing 2
2014 2015 2016 2014 2015 2016
1,000 cwt 1,000 cwt 1,000 cwt Tons Tons Tons
Alabama .............. 957 860 ........................ ........................ ........................ 16,450 Arizona ................ 31,816 29,510 35,480 ........................ ........................ 5,700 Arkansas .............. 473 490 ........................ ........................ ........................ ........................California ............. 209,678 207,069 197,205 14,150,110 14,483,930 13,571,200 Colorado .............. 4,601 4,462 1,322 ........................ ........................ 200 Connecticut .......... 260 209 ........................ ........................ ........................ ........................Delaware ............. 1,190 1,150 1,268 104,400 99,190 89,450 Florida .................. 29,317 31,177 31,069 ........................ ........................ 100,900 Georgia ................ 16,258 18,540 18,765 11,020 15,390 22,243 Idaho .................... 5,658 5,760 4,868 ........................ ........................ 103,800 Illinois ................... 8,227 3,759 2,464 148,420 153,950 401,350 Indiana ................. 3,952 3,018 4,562 ........................ ........................ 254,830 Maine ................... 112 85 ........................ ........................ ........................ ........................Maryland .............. 1,484 1,398 1,397 55,620 50,780 47,850 Massachusetts ..... 284 251 ........................ ........................ ........................ ........................Michigan .............. 8,153 8,054 6,525 ........................ ........................ 551,025 Minnesota ............ ........................ ........................ 513 858,650 905,855 812,644 Mississippi ........... 378 315 ........................ ........................ ........................ ........................Missouri ............... 837 572 1,015 (D) (D) 1,950 Nevada ................ 1,364 1,369 ........................ ........................ ........................ ........................New Hampshire ... 91 88 ........................ ........................ ........................ ........................New Jersey .......... 3,977 3,789 3,061 19,490 16,710 33,300 New Mexico ......... 4,234 5,142 3,798 ........................ ........................ 56,000 New York ............. 10,097 9,658 7,786 175,150 174,320 177,700 North Carolina ..... 4,284 5,303 5,816 ........................ ........................ 45,560 Ohio ..................... 4,599 4,192 3,649 194,950 133,690 193,410 Oklahoma ............ 364 540 ........................ ........................ ........................ ........................Oregon ................. 15,750 15,555 8,084 299,650 316,040 666,403 Pennsylvania ....... 2,612 2,168 1,625 ........................ ........................ 22,520 Rhode Island ....... 46 (D) ........................ ........................ ........................ ........................South Carolina ..... 3,547 4,173 4,112 ........................ ........................ 2,950 Tennessee ........... 1,677 1,489 1,849 ........................ ........................ 13,400 Texas ................... 11,337 9,821 13,958 75,270 76,080 81,700 Utah ..................... 742 715 ........................ ........................ ........................ ........................Vermont ............... 46 (D) ........................ ........................ ........................ ........................Virginia ................. 1,315 1,252 879 (D) ........................ ........................Washington .......... 17,479 20,579 12,511 904,550 982,660 1,500,790 Wisconsin ............ 1,908 2,018 1,724 1,068,500 1,035,130 1,212,223 Other States 3 ...... (X) 60 ........................ 1,182,880 927,870 ........................
United States ....... 409,104 404,590 375,305 19,248,660 19,371,595 19,985,548
(D) Withheld to avoid disclosing data for individual operations. (X) Not applicable. 1 Production of the following crops for which regular seasonal estimates are prepared in major producing States: Artichokes, asparagus, snap beans, broccoli, cabbage, cantaloups, carrots, cauliflower, celery, sweet corn, cucumbers, garlic, honeydew melons, head lettuce, leaf let-tuce, romaine lettuce, onions, bell peppers, Chile peppers, spinach, squash, tomatoes, and watermelons. 2 Includes Lima beans, snap beans, carrots, sweet corn, cucumbers (pickles), green peas, spinach, and tomatoes. Other vegetables proc-essed (dual purpose) included in fresh market series of estimates. 3 Other States include Alabama, Arkansas, Florida, Iowa, Idaho, Indiana, Massachusetts, Michigan, North Carolina, Pennsylvania, and South Carolina.
NASS, Crops Branch, (202) 720–2127.

IV–5 AGRICULTURAL STATISTICS 2017
Table 4-4.—Vegetables, commercial: Value of principal crops, by State and United States, 2014–2016
State Fresh market 1 Processing 2
2014 2015 2016 2014 2015 2016
1,000 1,000 1,000 1,000 1,000 1,000 dollars dollars dollars dollars dollars dollars
Alabama ............... 20,111 27,376 - ........................ ........................ 4,442 Arizona ................ 685,608 1,040,269 1,303,175 ........................ ........................ 4,275 Arkansas .............. 13,646 13,970 (NA) ........................ ........................ ........................California .............. 6,328,525 7,262,285 6,098,876 1,434,537 1,382,592 1,304,306 Colorado .............. 67,591 77,462 22,639 ........................ ........................ 240 Connecticut .......... 9,620 10,450 (NA) ........................ ........................ ........................Delaware .............. 19,754 18,451 24,923 29,255 27,293 20,153 Florida .................. 1,044,176 1,102,153 1,138,376 ........................ ........................ 53,368 Georgia ................ 405,264 470,261 439,033 4,354 6,673 6,602 Idaho .................... 44,083 49,803 24,397 ........................ ........................ 10,846 Illinois ................... 64,205 21,798 70,702 22,608 19,587 36,709 Indiana ................. 53,230 53,844 71,184 ........................ ........................ 30,527 Maine ................... 5,040 3,825 (NA) ........................ ........................ ........................Maryland .............. 26,323 24,036 23,564 12,764 11,662 9,174 Massachusetts ..... 14,200 10,040 (NA) ........................ ........................ ........................Michigan .............. 173,711 209,590 173,788 ........................ ........................ 106,034 Minnesota ............ ........................ ........................ 18,496 134,945 125,256 81,711 Mississippi ........... 4,423 3,780 (NA) ........................ ........................ 35 Missouri ............... 7,868 4,976 12,180 (D) (D) ........................Nevada ................ 45,012 45,177 (NA) ........................ ........................ ........................New Hampshire ... 5,005 4,840 (NA) ........................ ........................ ........................New Jersey .......... 132,080 156,510 134,211 4,765 3,745 8,123 New Mexico ......... 95,917 147,714 104,735 ........................ ........................ 40,320 New York ............. 289,250 276,984 201,926 53,502 34,841 45,772 North Carolina ..... 112,377 142,874 160,019 ........................ ........................ 15,927 Ohio ..................... 127,182 135,446 131,144 29,379 19,289 23,912 Oklahoma ............ 4,295 7,290 (NA) ........................ ........................ ........................Oregon ................. 132,338 177,341 176,926 53,692 57,835 108,491 Pennsylvania ....... 80,583 81,045 47,822 ........................ ........................ 6,027 Rhode Island ....... 2,438 (D) (NA) ........................ ........................ ........................South Carolina ..... 78,887 91,541 85,713 ........................ ........................ 1,198 Tennessee ........... 76,184 76,550 74,527 ........................ ........................ 3,710 Texas ................... 213,212 162,677 215,984 16,306 12,405 17,258 Utah ..................... 7,835 8,385 (NA) ........................ ........................ ........................Vermont ............... 3,128 (D) (NA) ........................ ........................ ........................Virginia ................. 43,572 52,668 34,584 (D) (D) - Washington .......... 259,064 435,325 259,992 115,646 129,801 197,540 Wisconsin ............ 33,403 40,818 35,540 157,920 157,759 143,377 Other States 3 ...... ........................ 3,880 - 256,746 207,998 ........................
United States ....... 10,729,140 12,451,434 11,084,456 2,326,419 2,196,736 2,280,077
(D) Withheld to avoid disclosing data for individual operations. (NA) Not available. 1 Value of the following crops for which regular seasonal estimates are prepared in major producing States: Artichokes, asparagus, snap beans, broccoli, cab-bage, cantaloups, carrots, cauliflower, celery, sweet corn, cucumbers, garlic, honeydew melons, head lettuce, leaf lettuce, romaine lettuce, onions, bell peppers, Chile peppers, spinach, tomatoes, and watermelons. 2 Includes Lima beans, snap beans, carrots, sweet corn, cucumbers (pickles), green peas, spinach, and tomatoes. Other vegetables processed (dual pur-pose) included in fresh market series of estimates. 3 Other States include Alabama, Arkansas, Florida, Iowa, Idaho, Indi-ana, Massachusetts, Michigan, North Carolina, Pennsylvania, and South Carolina.
NASS, Crops Branch, (202) 720–2127.

IV–6 STATISTICS OF VEGETABLES AND MELONS
Table 4-5.— Artichokes for fresh market and processing, commercial crop: Area, yield, production, value, and total value, United States, 2007-2016
Year Area harvested Yield per acre Utilized Production Value
Per cwt Total
Acres Cwt 1,000 cwt Dollars 1,000 dollars
2007 ..................... 9,600 110 1,056 55.00 58,080 2008 ..................... 8,800 130 1,144 47.80 54,683 2009 ..................... 8,600 125 1,075 56.20 60,415 2010 ..................... 7,200 120 864 50.20 43,373 2011 ..................... 7,400 135 999 51.10 51,049 2012 ..................... 7,300 145 1,059 54.30 57,504 2013 ..................... 7,100 135 959 61.00 58,499 2014 ..................... 7,300 130 949 57.60 54,662 2015 ..................... 6,800 135 918 87.80 80,600 2016 ..................... 6,800 145 986 70.10 69,119
Note: Beginning in 2016, Acreage and Yield estimates for fresh market and processing utilizations were discontinued. Total Production and Utilized Production are estimated for each crop. Harvested Not Sold estimates were added to the esti-mating program. This is defined as the difference between Total Production and Total Utilized Production. Table 4-5, 2016 includes utilized production.
NASS, Crops Branch, (202) 720–2127.
Table 4-6.—Artichokes for fresh market and processing: Area, production, and value per hundredweight, California, 2014–2016
Crop Area harvested Production Value per unit
2014 2015 2016 2014 2015 2016 2014 2015 2016
1,000 1,000 1,000 Dollars Dollars Dollars Acres Acres Acres cwt cwt cwt per cwt per cwt per cwt
California ............. 7,300 6,800 6,800 949 918 986 57.60 87.80 70.10
NASS, Crops Branch, (202) 720–2127.
Table 4-7.—Asparagus, commercial crop: Area, yield, production, value per hundredweight and per ton, and total value, United States, 2011-2016
Year
Total crop
Area for harvest Yield per acre Utilized Production Value 1
Per cwt Total
1,000 1,000 Acres Cwt cwt Dollars dollars
2011 ..................... 26,800 31 820 112.00 91,896 2012 ..................... 25,300 30 761 110.00 83,662 2013 ..................... 24,500 31 762 121.00 92,448 2014 ..................... 23,800 31 743 99.30 73,782 2015 ..................... 21,700 29 629 108.00 67,864 2016 ..................... 22,000 32 705 106.00 74,991
Year
Fresh market Processing
Production Value 1
Production Value 2
Per cwt Total Per ton Total
1,000 cwt 1,000 dollars 1,000 dollars Dollars Tons Dollars
2011 ..................... 650 122.00 79,047 8,500 1,510.00 12,849 2012 ..................... 620 117.00 72,592 7,050 1,570.00 11,070 2013 ..................... 620 131.00 81,332 7,100 1,570.00 11,116 2014 ..................... 568 106.00 60,432 8,750 1,530.00 13,350 2015 ..................... 474 116.00 55,086 7,750 1,650.00 12,778 2016 ..................... 546 113.00 61,694 7,940 1,670.00 13,297
Note: Beginning in 2016, Acreage and Yield estimates for fresh market and processing utilizations were discontinued. Total Production and Utilized Production are estimated for each crop. Harvested Not Sold estimates were added to the esti-mating program. This is defined as the difference between Total Production and Total Utilized Production. Table 4-7, 2016 includes utilized production.
1 Price and value at point of first sale. 2 Price and value at processing plant door. NASS, Crops Branch, (202) 720–2127.

IV–7 AGRICULTURAL STATISTICS 2017
Table 4-8.—Asparagus for Fresh Market and Processing, commercial crop: Area planted and harvested, yield, production, price and value - by State and United States, 2014–2016
State Area planted Area harvested
2014 2015 2016 2014 2015 2016
Acres Acres Acres Acres Acres Acres California ................ 11,500 9,500 8,500 11,000 9,000 8,000 Michigan ................ 10,300 10,000 10,200 9,000 8,900 9,200 New Jersey 1 .......... (NA) (NA) 1,500 (NA) (NA) 1,400 Washington ............ 4,000 4,000 3,600 3,800 3,800 3,400
United States ......... 25,800 23,500 23,800 23,800 21,700 22,000
State Yield per acre Utilized Production
2014 2015 2016 2014 2015 2016
Cwt Cwt Cwt 1,000 cwt 1,000 cwt 1,000 cwt California ................ 31 26 26 341 234 208 Michigan ................ 24 26 25 220 228 230 New Jersey 1 .......... (NA) (NA) 40 (NA) (NA) 56 Washington ............ 48 44 62 182 167 211
United States ......... 31 29 32 743 629 705
State Price per cwt Value of Production
2014 2015 2016 2014 2015 2016
Dollars Dollars Dollars 1,000 dollars 1,000 dollars 1,000 dollars California ................ 116.00 139.00 128.00 39,556 32,526 26,624 Michigan ................ 93.20 86.60 87.70 20,505 19,754 20,166 New Jersey 1 .......... (NA) (NA) 171.00 (NA) (NA) 9,576 Washington ............ 75.40 93.30 88.40 13,721 15,584 18,625
United States ......... 99.30 108.00 106.00 73,782 67,864 74,991
Note: Beginning in 2016, Acreage and Yield estimates for fresh market and processing utilizations were discontinued. Total Production and Utilized Production are estimated for each crop. Harvested Not Sold estimates were added to the esti-mating program. This is defined as the difference between Total Production and Total Utilized Production. For Table 4-8, 2016 includes utilized production.
(NA) Not available. 1 Estimates began in 2016. NASS, Crops Branch, (202) 720–2127.

IV–8 STATISTICS OF VEGETABLES AND MELONS
Table 4-9.—Asparagus for Fresh Market and Processing: Production, price and value by utilization - States and United States, 2014–2016
Utilization and State Production
2014 2015 2016
1,000 cwt 1,000 cwt 1,000 cwt Fresh market
California 1 ...................... 341 234 208 New Jersey 2 .................. (NA) (NA) 56 Other States 2 ................. 227 240 282
United States .................. 568 474 546
tons tons tons Processing
Other States 2 ................. 8,750 7,750 7,940 United States .................. 8,750 7,750 7,940
Canning .............................. 2,000 2,300 (NA)
Freezing ............................. 6,750 5,450 (NA)
Utilization and State Price per unit
2014 2015 2016
Dollars per cwt Dollars per cwt Dollars per cwt Fresh market
California 1 ...................... 116.00 139.00 128.00 New Jersey 2 .................. (NA) (NA) 171.00 Other States 3 ................. 92.00 94.00 90.40
United States .................. 106.00 116.00 113.00
1,000 dollars 1,000 dollars 1,000 dollars Processing
Other States 2 ................. 1,530.00 1,650.00 1,670.00 United States .................. 1,530.00 1,650.00 1,670.00
Canning .............................. 1,680.00 1,620.00 (NA)
Freezing ............................. 1,480.00 1,660.00 (NA)
Utilization and State Value of production
2014 2015 2016
1,000 dollars 1,000 dollars 1,000 dollars Fresh market
California 1 ...................... 39,556 32,526 26,624 New Jersey 2 .................. (NA) (NA) 9,576 Other States 3 ................. 20,876 22,560 25,494
United States .................. 60,432 55,086 61,694
1,000 dollars 1,000 dollars Processing
Other States 2 ................. 13,350 12,778 13,297 United States .................. 13,350 12,778 13,297
Canning .............................. 3,360 3,726 (NA)
Freezing ............................. 9,990 9,052 (NA)
Note: Beginning in 2016, Acreage and Yield estimates for fresh market and processing utilizations were discontinued. Total Production and Utilized Production are estimated for each crop. Harvested Not Sold estimates were added to the esti-mating program. This is defined as the difference between Total Production and Total Utilized Production. For Table 4.9, 2016 will not include canned or frozen production, price, and value.
(NA) Not available. 1 Includes a small amount of processing asparagus. 2 Estimates began in 2016. 3 Other States in-clude Michigan and Washington.
NASS, Crops Branch, (202) 720–2127.

IV–9 AGRICULTURAL STATISTICS 2017
Table 4-10.—Lima beans for processing, commercial crop: Area, yield, production, value per ton, and total value, United States, 2010-2016
Year Area harvested Yield per acre Production Value 1
Per ton Total
Acres Tons Tons Dollars 1,000 dollars
2010 ..................... 42,430 1.47 62,230 473.00 29,456 2011 ..................... 30,960 1.42 45,780 525.00 23,700 2012 ..................... 32,900 1.85 61,015 524.00 31,950 2013 ..................... 28,930 1.68 48,620 582.00 28,312 2014 ..................... 27,760 1.82 50,400 580.00 29,236 2015 ..................... 29,200 1.72 50,255 596.00 29,950 2016 ..................... 28,000 (NA) 45,223 516.00 23,340
Note: Beginning in 2016, Acreage and Yield estimates for fresh market and processing utilizations were discontinued. Total Production and Utilized Production are estimated for each crop. Harvested Not Sold estimates were added to the esti-mating program. This is defined as the difference between Total Production and Total Utilized Production. For Table 4-10, 2016 includes total harvested acres, processing production, processing price, and processing value.
(NA) Not available. 1 Price and value at processing plant door. NASS, Crops Branch, (202) 720–2127.
Table 4-11.—Snap beans for fresh market, commercial crop: Area, yield, production, value hundredweight, and total value, United States, 2010-2016
Year Area harvested Yield per acre Production Value 1
Per cwt Total
Acres Cwt 1,000 cwt Dollars 1,000 dollars
2010 ..................... 85,800 56 4,770 60.40 287,885 2011 ..................... 83,500 55 4,591 59.50 273,201 2012 ..................... 76,700 57 4,340 62.70 271,922 2013 ..................... 73,100 58 4,252 68.90 293,073 2014 ..................... 68,600 54 3,720 60.20 224,052 2015 ..................... 71,170 56 3,952 59.40 234,934 2016 ..................... (NA) (NA) 4,168 67.80 282,655
Note: Beginning in 2016, acreage and yield estimates for fresh market and processing utilizations were discontinued. Total production and utilized production are estimated for each crop. Harvested not sold estimates were added to the estimating program. This is defined as the difference between total production and total utilized production. 2016 data shows fresh mar-ket production, price, and value.
(NA) Not available. 1 Price and value at point of first sale. NASS, Crops Branch, (202) 720–2127.
Table 4-12.—Snap beans for fresh market: Area, production, and value per hundredweight, by State and United States, 2014–2016
State Area harvested Production Value per unit
2014 2015 2016 2014 2015 2016 2014 2015 2016
1,000 1,000 1,000 Dollars Dollars Dollars Acres Acres Acres cwt cwt cwt per cwt per cwt per cwt
California .................... 4,200 4,200 (NA) 462 528 (D) 78.10 67.00 (D) Florida ........................ 26,600 26,600 (NA) 1,330 1,238 1,346 58.20 61.60 78.50 Georgia ...................... 9,800 8,900 (NA) 392 515 585 39.10 38.50 44.70 Illinois ......................... (NA) (NA) (NA) (NA) (NA) 144 (NA) (NA) 96.60 Indiana ....................... (NA) (NA) (NA) (NA) (NA) (D) (NA) (NA) (D) Maryland .................... 1,000 1,000 (NA) 58 47 (D) 39.00 41.00 (D) Michigan .................... 2,600 2,600 (NA) 182 212 254 44.90 54.20 59.50 Minnesota .................. (NA) (NA) (NA) (NA) (NA) (D) (NA) (NA) (D) New Jersey ................ 2,600 2,600 (NA) 86 77 68 38.20 59.80 43.50 New York ................... 9,800 9,800 (NA) 617 696 435 84.50 84.00 84.20 North Carolina ........... 4,300 4,300 (NA) 172 115 (D) 38.00 31.00 (D) Oregon ....................... (NA) (NA) (NA) (NA) (NA) (D) (NA) (NA) (D) Pennsylvania ............. (NA) (NA) (NA) (NA) (NA) 139 (NA) (NA) 24.70 South Carolina ........... 600 600 (NA) 35 11 (NA) 48.70 75.00 (NA) Tennessee ................. 5,400 5,400 (NA) 308 448 (D) 58.00 41.00 (D) Texas ......................... (NA) (NA) (NA) (NA) (NA) (D) (NA) (NA) (D) Virginia ....................... 1,700 1,700 (NA) 78 65 (NA) 42.00 65.00 (NA) Washingtgon .............. (NA) (NA) (NA) (NA) (NA) (D) (NA) (NA) (D) Wisconsin .................. (NA) (NA) (NA) (NA) (NA) 8 (NA) (NA) 35.30 Other States .............. (NA) (NA) (NA) (NA) (NA) 1,189 (NA) (NA) 66.10
United States ............. 68,600 67,700 (NA) 3,720 3,952 4,168 60.20 59.40 67.80
Note: Beginning in 2016, acreage and yield estimates for fresh market and processing utilizations were discontinued. Total production and utilized production are estimated for each crop. Harvested not sold estimates were added to the estimating program. This is defined as the difference between total production and total utilized production. For Table 4-12, 2016 in-cludes fresh market production and price.
(D) Withheld to avoid disclosing data for individual operations. (NA) Not available. NASS, Crops Branch, (202) 720–2127.
IV–10 STATISTICS OF VEGETABLES AND MELONS
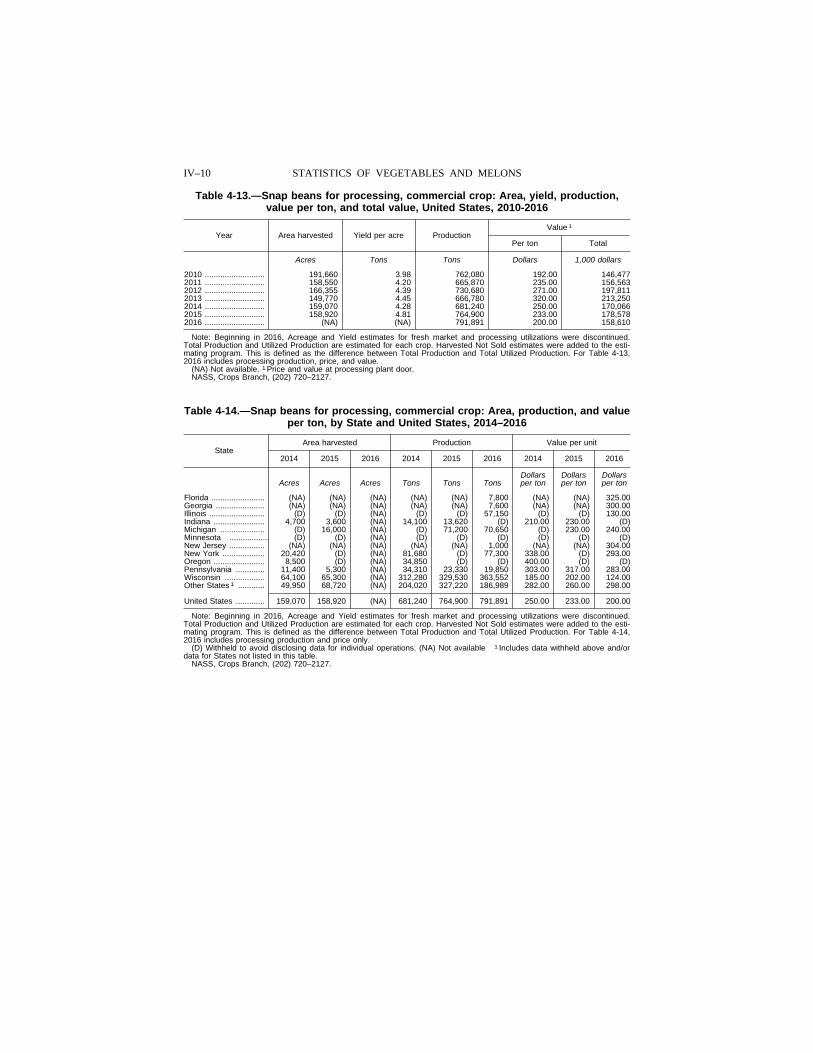
Table 4-13.—Snap beans for processing, commercial crop: Area, yield, production, value per ton, and total value, United States, 2010-2016
Year Area harvested Yield per acre Production Value 1
Per ton Total
Acres Tons Tons Dollars 1,000 dollars
2010 ........................... 191,660 3.98 762,080 192.00 146,477 2011 ........................... 158,550 4.20 665,870 235.00 156,563 2012 ........................... 166,355 4.39 730,680 271.00 197,811 2013 ........................... 149,770 4.45 666,780 320.00 213,250 2014 ........................... 159,070 4.28 681,240 250.00 170,066 2015 ........................... 158,920 4.81 764,900 233.00 178,578 2016 ........................... (NA) (NA) 791,891 200.00 158,610
Note: Beginning in 2016, Acreage and Yield estimates for fresh market and processing utilizations were discontinued. Total Production and Utilized Production are estimated for each crop. Harvested Not Sold estimates were added to the esti-mating program. This is defined as the difference between Total Production and Total Utilized Production. For Table 4-13, 2016 includes processing production, price, and value.
(NA) Not available. 1 Price and value at processing plant door. NASS, Crops Branch, (202) 720–2127.
Table 4-14.—Snap beans for processing, commercial crop: Area, production, and value per ton, by State and United States, 2014–2016
State Area harvested Production Value per unit
2014 2015 2016 2014 2015 2016 2014 2015 2016
Dollars Dollars Dollars Acres Acres Acres Tons Tons Tons per ton per ton per ton
Florida ........................ (NA) (NA) (NA) (NA) (NA) 7,800 (NA) (NA) 325.00 Georgia ...................... (NA) (NA) (NA) (NA) (NA) 7,600 (NA) (NA) 300.00 Illinois ......................... (D) (D) (NA) (D) (D) 57,150 (D) (D) 130.00 Indiana ....................... 4,700 3,600 (NA) 14,100 13,620 (D) 210.00 230.00 (D) Michigan .................... (D) 16,000 (NA) (D) 71,200 70,650 (D) 230.00 240.00 Minnesota .................. (D) (D) (NA) (D) (D) (D) (D) (D) (D) New Jersey ................ (NA) (NA) (NA) (NA) (NA) 1,000 (NA) (NA) 304.00 New York ................... 20,420 (D) (NA) 81,680 (D) 77,300 338.00 (D) 293.00 Oregon ....................... 8,500 (D) (NA) 34,850 (D) (D) 400.00 (D) (D) Pennsylvania ............. 11,400 5,300 (NA) 34,310 23,330 19,850 303.00 317.00 283.00 Wisconsin .................. 64,100 65,300 (NA) 312,280 329,530 363,552 185.00 202.00 124.00 Other States 1 ............ 49,950 68,720 (NA) 204,020 327,220 186,989 282.00 260.00 298.00
United States ............. 159,070 158,920 (NA) 681,240 764,900 791,891 250.00 233.00 200.00
Note: Beginning in 2016, Acreage and Yield estimates for fresh market and processing utilizations were discontinued. Total Production and Utilized Production are estimated for each crop. Harvested Not Sold estimates were added to the esti-mating program. This is defined as the difference between Total Production and Total Utilized Production. For Table 4-14, 2016 includes processing production and price only.
(D) Withheld to avoid disclosing data for individual operations. (NA) Not available 1 Includes data withheld above and/or data for States not listed in this table.
NASS, Crops Branch, (202) 720–2127.

IV–11 AGRICULTURAL STATISTICS 2017
Table 4-15.—Broccoli, commercial crop: Area, yield, production, value per hundredweight and per ton, and total value, United States, 2010-2016 1
Year
Total crop
Area for harvest Yield per acre Production Value 2
Per cwt Total
Acres Cwt 1,000 cwt Dollars 1,000 dollars 2010 ......... 130,200 148 19,289 37.70 727,463 2011 ......... 123,200 147 18,149 35.20 639,120 2012 ......... 126,400 162 20,472 33.60 687,727 2013 ......... 131,500 162 21,360 42.80 913,520 2014 ......... 126,400 163 20,600 40.00 824,961 2015 ......... 124,400 176 21,888 48.40 1,058,770 2016 ......... 131,300 171 22,465 37.90 851,391
Year
Fresh market Processing
Production Value 2
Production Value 3
Per cwt Total Per ton Total
1,000 1,000 1,000 cwt Dollars dollars Tons Dollars dollars
2010 ......... 18,879 37.60 709,833 20,500 860.00 17,630 2011 ......... 17,756 35.40 628,792 19,673 525.00 10,328 2012 ......... 20,076 33.80 678,619 19,800 460.00 9,108 2013 ......... 20,664 43.20 893,336 34,800 580.00 20,184 2014 ......... 19,910 40.70 809,608 34,500 445.00 15,353 2015 ......... 21,104 49.10 1,035,211 39,200 601.00 23,559 2016 ......... 21,938 38.20 838,455 26,400 490.00 1,294
Note: Beginning in 2016, acreage and yield estimates for fresh market and processing utilizations were discontinued. Total production and utilized production are estimated for each crop. Harvested not sold estimates were added to the estimating program. This is defined as the difference between Total production and total utilized production. For Table 4-15, 2016 in-cludes utilized production.
1 Sprouting broccoli only. Does not include broccoli rabe nor heading (cauliflower) broccoli. 2 Price and value at point of first sale. 3 Price and value at processing plant door.
NASS, Crops Branch, (202) 720–2127.
Table 4-16.—Broccoli, commercial crop: Area, production, and value per hundredweight, and per ton, by State and United States, 2014–2016 1
State Area harvested Production Value per unit
2014 2015 2016 2014 2015 2016 2014 2015 2016
1,000 1,000 1,000 Dollars Dollars Dollars Acres Acres Acres cwt cwt cwt per cwt per cwt per cwt
Arizona .... 6,400 8,400 9,300 800 1,008 1,116 37.40 52.10 64.70 California 120,000 116,000 122,000 19,800 20,880 21,350 40.20 48.20 36.50
United States ... 126,400 124,400 131,300 20,600 21,888 22,465 40.00 48.40 37.90
State
Fresh market Processing
Production Value per unit Production Value per unit
2014 2015 2016 2014 2015 2016 2014 2015 2016 2014 2015 2016
1,000 1,000 1,000 Dollars Dollars Dollars Dollars Dollars Dollars cwt cwt cwt per
cwt per cwt
per cwt
Tons Tons Tons per ton per ton per ton
Arizona .... 800 1,008 800 37.40 52.10 64.70 ........... ........... ........... ........... ........... ...........California 19,110 20,096 19,440 40.80 48.90 36.80 34,500 39,200 26,400 445.00 601.00 490.00
United States ... 19,910 21,104 20,240 40.70 49.10 38.20 34,500 39,200 26,400 445.00 601.00 490.00
1 Sprouting broccoli only. Does not include broccoli rabe nor heading (cauliflower) broccoli. NASS, Crops Branch, (202) 720–2127.

IV–12 STATISTICS OF VEGETABLES AND MELONS
Table 4-17.—Cabbage for fresh market, commercial crop: Area, yield, production, value and total value, United States, 2010-2016
Year Area harvested Yield per acre Production Value
Per cwt Total
Acres Cwt 1,000 cwt Dollars 1,000 dollars
2010 ..................... 66,260 350 23,210 17.40 397,314 2011 ..................... 58,760 343 20,134 17.60 347,381 2012 ..................... 56,800 348 19,752 18.50 359,094 2013 ..................... 59,480 366 21,750 20.10 429,419 2014 ..................... 59,650 354 21,141 19.70 416,303 2015 ..................... 55,920 361 20,178 19.30 389,340 2016 ..................... (NA) (NA) 18,449 21.80 402,119
Note: Beginning in 2016, acreage and yield estimates for fresh market and processing utilizations were discontinued. Total production and utilized production are estimated for each crop. Harvested not sold estimates were added to the estimating program. This is defined as the difference between total production and total utilized production. For Table 4-17, 2016 in-cludes fresh market production, price, and value.
(NA) Not available. NASS, Crops Branch, (202) 720–2127.
Table 4-18.—Cabbage for fresh market: Area, production, and value per hundredweight, by State and United States, 2014–2016
State Area harvested Production Value per unit
2014 2015 2016 2014 2015 1 2016 2014 2015 2016
1,000 1,000 1,000 Dollars Dollars Dollars Acres Acres Acres cwt cwt cwt per cwt per cwt per cwt
Arizona ................. 3,700 2,600 (NA) 1,906 884 1,615 21.70 23.00 31.70 California .............. 13,500 13,800 (NA) 5,670 5,865 5,760 24.50 27.10 27.60 Colorado .............. (D) 1,500 (NA) (D) 653 ............... (D) 16.90 ...............Florida .................. 8,800 8,200 (NA) 2,992 2,706 2,686 16.70 12.50 18.40 Georgia ................ 4,700 3,700 (NA) 1,598 1,258 (D) 12.00 10.50 (D) Michigan .............. 3,100 3,300 (NA) 837 957 (D) 16.00 17.00 (D) New Jersey .......... 1,500 1,600 (NA) 533 624 ............... 17.80 18.40 ...............New York ............. 8,300 8,100 (NA) 3,320 3,240 (D) 21.80 18.40 (D) North Carolina ..... 2,800 2,400 (NA) 644 528 696 15.00 13.00 18.00 Ohio ..................... 1,400 1,100 (NA) 490 407 ............... 13.00 10.00 ...............Pennsylvania ....... 960 830 (NA) 212 208 ............... 19.80 21.30 ...............Texas ................... 6,200 5,500 (NA) 1,550 1,815 1,938 21.50 17.00 18.00 Virginia ................. (D) (D) (NA) (D) (D) ............... (D) (D) ...............Wisconsin ............ 2,900 (D) (NA) 725 (D) (D) 14.20 (D) (D) Other States ........ 1,790 3,290 (NA) 664 1,033 5,754 11.70 17.80 16.50
United States ....... 59,650 55,920 (NA) 21,141 20,178 18,449 19.70 19.30 21.80
Note: Beginning in 2016, acreage and yield estimates for fresh market and processing utilizations were discontinued. Total production and utilized production are estimated for each crop. Harvested not sold estimates were added to the estimating program. This is defined as the difference between total production and total utilized production. For Table 4-18, 2016 in-cludes fresh market production and price only.
(D) Not published to avoid disclosure of individual operations. (NA) Not available. 1 Includes some quantities of fall storage in New York harvested but not sold because of shrinkage and loss.
NASS, Crops Branch, (202) 720–2127.

IV–13 AGRICULTURAL STATISTICS 2017
Table 4-19.—Cantaloupes for fresh market, commercial crop: Area, yield, production, value, and total value, United States, 2010-2016
Year Area harvested Yield per acre Production Value
Per cwt Total
Acres Cwt 1,000 cwt Dollars 1,000 dollars
2010 ..................... 73,330 256 18,808 16.20 304,896 2011 ..................... 70,400 266 18,692 18.40 344,832 2012 ..................... 63,430 263 16,706 19.10 319,348 2013 ..................... 68,600 265 18,173 17.60 320,029 2014 ..................... 58,200 234 13,612 22.10 300,634 2015 ..................... 52,100 260 13,552 19.50 264,131 2016 ..................... .............................. .............................. 13,764 15.10 207,498
Note: Beginning in 2016, Acreage and Yield estimates for fresh market and processing utilizations were discontinued. Only total acreage and total yield will be published beginning in 2016. Total Production and Utilized Production are esti-mated for each crop. Harvested Not Sold estimates were added to the estimating program. This is defined as the difference between Total Production and Total Utilized Production. For Table 4-19, 2016 will include fresh market production, price, and value only.
NASS, Crops Branch, (202) 720–2127.
Table 4-20.—Cantaloupes for fresh market: Area, production, and value per hundredweight, by State and United States, 2014–2016
State Area harvested Production Value per unit
2014 2015 2016 2014 2015 2016 2014 2015 2016
1,000 1,000 1,000 Dollars Dollars Dollars Acres Acres Acres cwt cwt cwt per cwt per cwt per cwt
Arizona ................ 16,000 14,500 (NA) 3,840 3,553 3,737 24.30 22.90 16.90 California ............. 31,000 28,000 (NA) 8,060 8,400 7,650 21.00 17.40 11.90 Colorado .............. 400 500 (NA) 82 123 (NA) 37.90 31.00 (NA) Florida .................. (NA) (NA) (NA) (NA) (NA) 621 (NA) (NA) 19.10 Georgia ................ 3,300 2,800 (NA) 396 504 578 15.00 17.30 19.10 Indiana ................. 1,800 1,700 (NA) 396 272 315 15.10 28.00 23.00 Maryland .............. 600 500 (NA) 77 60 (NA) 27.00 28.00 (NA) North Carolina ..... (NA) (NA) (NA) (NA) (NA) 207 (NA) (NA) 32.00 Pennsylvania ....... 1,200 1,200 (NA) 144 154 133 28.10 31.20 27.00 South Carolina ..... 1,600 1,100 (NA) 352 270 344 24.70 11.50 21.40 Texas ................... 2,300 1,800 (NA) 265 216 179 31.00 31.80 31.20 Other States ........ ............... ............... ............... ............... ............... - (NA) (NA) -
United States ....... 58,200 52,100 (NA) 13,612 13,552 13,764 22.10 19.50 15.10
Note: Beginning in 2016, Acreage and Yield estimates for fresh market and processing utilizations were discontinued. Only total acreage and total yield will be published beginning in 2016. Total Production and Utilized Production are esti-mated for each crop. Harvested Not Sold estimates were added to the estimating program. This is defined as the difference between Total Production and Total Utilized Production. For Table 4.20, 2016 will include fresh market production and price only.
- Represents zero. (NA) Not available. NASS, Crops Branch, (202) 720–2127.
Table 4-21.—Carrots for fresh market, commercial crop: Area, production, and value per hundredweight, by State and United States, 2014-2016
State Area harvested Production Value per unit
2014 2015 2016 2014 2015 2016 2014 2015 2016
1,000 1,000 1,000 Dollars Dollars Dollars Acres Acres Acres cwt cwt cwt per cwt per cwt per cwt
California ................ 65,500 66,000 (NA) 20,960 20,988 (D) 28.20 31.50 (D) Michigan ................. 1,600 1,500 (NA) 496 360 (D) 15.80 20.00 (D) Texas ..................... 1,400 (D) (NA) 378 (D) (D) 20.00 (D) (D) Wisconsin ............... (NA) (NA) (NA) (NA) (NA) 13 (NA) (NA) 110.00 Other States 1 ........ 5,700 7,050 (NA) 3,545 4,392 22,194 23.20 26.40 34.70
United States ......... 74,200 74,550 (NA) 25,379 25,740 22,207 27.10 30.50 34.70
Note: Beginning in 2016, Acreage and Yield estimates for fresh market and processing utilizations were discontinued. Only total acreage and total yield will be published beginning in 2016. Total Production and Utilized Production are esti-mated for each crop. Harvested Not Sold estimates were added to the estimating program. This is defined as the difference between Total Production and Total Utilized Production. For Table 4.21, 2016 will include fresh market production and price only.
(D) Withheld to avoid disclosing data for individual operations. (NA) Not available. 1 Other States include Colorado, Geor-gia, and Washington.
NASS, Crops Branch, (202) 720-2127.

IV–14 STATISTICS OF VEGETABLES AND MELONS
Table 4-22.—Carrots for processing, commercial crop: Area, production, and value per ton, by State and United States, 2014-2016
State Area harvested Production Value per unit
2014 2015 2016 2014 2015 2016 2014 2015 2016
Dollars Dollars Dollars Acres Acres Acres Tons Tons Tons per tons per tons per tons
Washington ............ (D) (D) (NA) (D) (D) (D) (D) (D) (D) Wisconsin ............... 3,700 3,800 (NA) 107,100 97,730 106,150 89.30 98.80 81.40 Other States 1 ........ 7,730 7,220 (NA) 214,720 196,270 298,800 130.00 135.00 128.00
United States ......... 11,430 11,020 (NA) 321,820 294,000 404,950 116.00 123.00 116.00
Note: Beginning in 2016, Acreage and Yield estimates for fresh market and processing utilizations were discontinued. Only total acreage and total yield will be published beginning in 2016. Total Production and Utilized Production are esti-mated for each crop. Harvested Not Sold estimates were added to the estimating program. This is defined as the difference between Total Production and Total Utilized Production. For Table 4-22, 2016 includes processing production and price only.
(D) Withheld to avoid disclosing data for individual operations. (NA) Not available. 1 Includes data withheld above and/or data for States not listed in this table.
NASS, Crops Branch, (202) 720–2127.
Table 4-23.—Cauliflower, commercial crop: Area, production, and value per hundredweight and per ton, by State and United States, 2014–2016 1
State Area harvested Production Value per unit
2014 2015 2016 2014 2015 2016 2014 2015 2016
1,000 1,000 1,000 Dollars Dollars Dollars Acres Acres Acres cwt cwt cwt per cwt per cwt per cwt
Arizona .......... 3,600 4,500 4,700 720 700 846 54.90 77.30 79.60 California ....... 31,300 32,300 32,300 5,580 5,814 5,814 49.20 59.40 55.40 New York ....... 470 410 (NA) 61 45 (NA) 43.00 50.10 (NA)
United States 35,070 37,210 37,000 6,361 6,559 6,660 49.80 61.30 58.50
State
Fresh market
Production Value per unit
2014 2015 2016 2014 2015 2016
1,000 cwt 1,000 cwt 1,000 cwt Dollars per cwt Dollars per cwt Dollars per cwt
Arizona .......... 720 700 846 54.90 77.30 79.60 California ....... 5,505 5,766 5,770 49.50 59.70 55.60 New York ....... 61 45 - 43.00 50.10 -
United States 6,286 6,511 6,616 50.10 61.50 58.70
State
Processing
Production Value per unit
2014 2015 2016 2014 2015 2016
Tons Tons Tons Dollars per ton Dollars per ton Dollars per ton
California ........ 3,750 2,400 2,200 610.00 480.00 610.00
United States 3,750 2,400 2,200 610.00 480.00 610.00
(NA) Not available. 1 Includes heading (cauliflower) broccoli. NASS, Crops Branch, (202) 720–2127.

IV–15 AGRICULTURAL STATISTICS 2017
Table 4-24.—Cauliflower, commercial crop: Area, yield, production, value per hundredweight and per ton, and total value, United States, 2007-2016 1
Year
Total crop Fresh market Processing
Area for harvest
Yield per acre
Produc-tion
Value 2 Produc-tion
Value 2 Produc-tion
Value 3
Per cwt. Total Per cwt. Total Per ton Total
1,000 1,000 1,000 1,000 1,000 Acres Cwt cwt Dollars dollars cwt Dollars dollars Tons Dollars dollars
2007 ... 37,820 181 6,828 34.20 233,413 6,616 34.40 227,689 10,600 540.00 5,724 2008 ... 36,700 181 6,648 40.40 268,531 6,485 40.70 263,912 8,160 566.00 4,619 2009 ... 38,600 186 7,167 44.00 315,551 7,000 44.30 310,290 8,350 630.00 5,261 2010 ... 38,460 184 7,087 41.70 295,186 6,972 41.80 291,647 5,755 615.00 3,539 2011 ... 36,430 183 6,649 46.00 305,539 6,399 46.80 299,164 12,500 510.00 6,375 2012 ... 36,070 185 6,690 35.80 239,203 6,542 35.90 235,059 7,400 560.00 4,144 2013 ... 36,830 181 6,662 44.30 295,450 6,572 44.50 292,615 4,500 630.00 2,835 2014 ... 35,070 181 6,361 49.80 316,937 6,286 50.10 314,649 3,750 610.00 2,288 2015 ... 37,210 176 6,559 61.30 401,747 6,511 61.50 400,595 2,400 480.00 1,152 2016 ... 37,000 180 6,660 49.80 389,496 6,616 58.70 388,154 2,200 610.00 1,342
Note: Beginning in 2016, acreage and yield estimates for fresh market and processing utilizations were discontinued. Only total acreage and total yield will be published beginning in 2016. Total production and utilized production are estimated for each crop. Harvested not sold estimates were added to the estimating program. This is defined as the difference between totalproduction and total utilized production.
1 Includes heading (cauliflower) broccoli. 2 Price and value at point of first sale. 3 Price and value at processing plant door.
NASS, Crops Branch, (202) 720–2127.
Table 4-25.—Celery, commercial crop: Area, production, and value per hundredweight, by State and United States, 2014–2016 1
State Area harvested Production Value per unit
2014 2015 2016 2014 2015 2016 2014 2015 2016
1,000 1,000 1,000 Dollars Doll ars Dollars Acres Acres Acres cwt cwt cwt per cwt per cwt per cwt
California ............ 27,200 26,100 27,100 17,408 16,180 16,000 17.00 25.10 21.30 Michigan ............. 1,700 1,600 1,800 985 930 1,062 19.10 20.30 17.50
United States ...... 28,900 27,700 28,900 18,393 17,110 17,062 17.10 24.80 21.00
1 Mostly for fresh market use, but includes some quantities used for processing. NASS, Crops Branch, (202) 720–2127.
Table 4-26.—Celery, commercial crop: Area, yield, production, value per hundredweight, and total value, United States, 2010–2016 1
Year Area for harvest Yield per acre Production Value 2
Per cwt Total
Acres Cwt 1,000 cwt Dollars 1,000 dollars
2010 ............... 28,000 712 19,923 18.60 371,153 2011 ............... 28,200 687 19,362 19.70 381,780 2012 ............... 29,000 681 19,752 18.20 358,988 2013 ............... 28,800 625 18,003 25.40 457,765 2014 ............... 28,900 636 18,393 17.10 314,134 2015 ............... 27,700 618 17,110 24.80 424,664 2016 ............... 28,900 590 17,062 21.00 358,632
Note: Beginning in 2016, acreage and yield estimates for fresh market and processing utilizations were discontinued. Only total acreage and total yield will be published beginning in 2016. Total production and utilized production are estimated for each crop. Harvested Not Sold estimates were added to the estimating program. This is defined as the difference between total production and total utilized production.
1 Mostly for fresh market use, but includes quantities used for processing. 2 Price and value at point of first sale. NASS, Crops Branch, (202) 720–2127.

IV–16 STATISTICS OF VEGETABLES AND MELONS
Table 4-27.—Corn, sweet, commercial crop: Area, production, and value per hundredweight and per ton, by State and United States, 2014–2016
Utilization and State
Area harvested Production Value per unit
2014 2015 2016 2014 2015 2016 2014 2015 2016
Fresh market: Acres 1,000 cwt Dollars per cwt
Alabama ............ 1,100 1,000 (NA) 81 55 (NA) 21.60 26.50 (NA) California ........... 27,800 29,900 (NA) 4,726 5,681 5,933 34.00 28.00 27.6 Colorado ........... 4,000 3,400 (NA) 680 612 (NA) 16.20 15.20 (NA) Connecticut ....... 4,000 3,600 (NA) 260 209 (NA) 37.00 50.00 (NA) Delaware ........... 3,500 3,600 (NA) 357 389 (D) 25.00 22.00 (D) Florida ............... 34,000 36,900 (NA) 4,590 5,166 5,003 28.20 30.00 32.00 Georgia ............. 22,400 25,700 (NA) 2,912 3,598 3,900 25.50 21.40 21.00 Illinois ................ 6,100 6,100 (NA) 769 580 686 22.20 16.80 34.50 Indiana .............. 5,300 5,100 (NA) 440 281 418 29.90 43.00 31.00 Maine ................ 1,600 1,400 (NA) 112 85 (NA) 45.00 45.00 (NA) Maryland ........... 3,900 3,600 (NA) 230 216 (D) 35.00 28.00 (D) Massachusetts .. 4,300 3,300 (NA) 284 251 (NA) 50.00 40.00 (NA) Michigan ........... (NA) (NA) (NA) (NA) (NA) 856 (NA) (NA) 25.50 Minnesota ......... 9,200 9,000 (NA) 828 927 321 24.70 26.00 34.00 New Hampshire 1,400 1,300 (NA) 91 88 (NA) 55.00 55.00 (NA) New Jersey ....... 6,000 5,800 (NA) 540 522 518 31.20 32.20 32.50 New York .......... 18,100 16,700 (NA) 1,774 1,403 1,456 23.90 22.40 30.60 North Carolina .. 4,600 4,600 (NA) 308 391 (NA) 27.00 31.00 (NA) Ohio .................. 15,100 14,500 (NA) 1,314 1,088 1,148 29.90 28.00 32.00 Oregon .............. 4,900 6,900 (NA) 720 1,242 (D) 24.00 23.00 (D) Pennsylvania .... 11,300 9,300 (NA) 791 623 510 36.30 38.50 37.90 Rhode Island .... 690 (D) (NA) 46 (D) (NA) 53.00 (D) (NA) Texas ................ 2,950 4,200 (NA) 280 332 (NA) 22.00 21.50 (NA) Vermont ............ 910 (D) (NA) 46 (D) (NA) 68.00 (D) (NA) Virginia .............. 2,900 2,900 (NA) 261 235 (NA) 23.00 31.00 (NA) Washington ....... 11,500 25,300 (NA) 1,817 3,441 524 27.00 35.00 24.40 Wisconsin ......... 3,500 3,700 (NA) 392 477 582 25.60 29.30 27.80 Other States ..... (X) 1,290 (NA) (X) 60 1,738 (X) 64.70 25.30
United States .... 211,050 229,090 (NA) 24,649 27,952 23,593 28.70 28.20 28.20
Processing: Acres Tons Dollars per ton
Illinois ................ (D) (D) (NA) (D) (D) (NA) (D) (D) 74.00 Minnesota ......... 109,400 103,200 (NA) 749,440 761,320 (NA) 113.00 96.20 79.00 New Jersey ....... (NA) (D) (NA) (NA) (D) (NA) (NA (D) 118.00 New York .......... (NA) (D) (NA) (NA) (D) (NA) (NA (D) 158.00 Oregon .............. 23,200 21,200 (NA) 220,480 198,610 (NA) 126.00 140.00 (D) Pennsylvania .... (NA) (D) (NA) (NA) (D) (NA) (NA) (D) 161.00 Washington ....... 69,400 78,800 (NA) 692,600 722,240 (NA) 108.00 106.00 100.00 Wisconsin ......... 65,800 60,700 (NA) 542,160 490,230 (NA) 96.20 87.90 68.20 Other States 1 ... 44,480 43,600 (NA) 363,140 315,710 (NA) 138.00 111.00 129.00
United States .... 312,280 307,500 (NA) 2,567,820 2,488,110 (NA) 113.00 103.00 91.80
Note: Beginning in 2016, Acreage and Yield estimates for fresh market and processing utilizations were discontinued. Only total acreage and total yield will be published beginning in 2016. Total production and utilized production are estimated for each crop. Harvested not sold estimates were added to the estimating program. This is defined as the difference be-tween total production and total utilized production. For Table 4-27, 2016 includes fresh market production and fresh market price and processing production and processing price.
(D) Withheld to avoid disclosing data for individual operations. (NA) Not available. (X) Not applicable. 1 Includes data withheld above and/or data for States not listed in this table.
NASS, Crops Branch, (202) 720–2127.
Table 4-28.—Corn, sweet, commercial crop: Area, yield, production, value per hundredweight and per ton, and total value, United States, 2010-2016
Year
Fresh market Processing
Area harvested
Yield per acre
Production Value 1 Area
harvested
Yield per acre
Production Value 2
Per cwt Total Per ton Total
1,000 1,000 1,000 Acres Cwt cwt Dollars dollars Acres Tons Tons Dollars dollars
2010 ... 235,800 118 27,875 25.90 721,980 335,200 8.04 2,694,210 85.30 229,786 2011 ... 224,050 118 26,336 26.70 702,217 331,650 8.04 2,664,820 116.00 309,622 2012 ... 217,350 128 27,910 26.30 735,104 360,480 8.21 2,959,350 127.00 376,694 2013 ... 228,380 125 28,561 28.20 806,488 314,950 8.10 2,551,830 140.00 357,804 2014 ... 211,050 117 24,649 28.70 708,332 312,280 8.22 2,567,820 113.00 289,573 2015 ... 229,090 122 27,952 28.20 787,581 307,500 8.09 2,488,110 103.00 255,480 2016 ... (NA) (NA) 23,593 28.20 665,521 (NA) (NA) 2,516,634 91.80 231,149
Note: Beginning in 2016, Acreage and Yield estimates for fresh market and processing utilizations were discontinued. Only total acreage and total yield will be published beginning in 2016. Total Production and Utilized Production are esti-mated for each crop. Harvested Not Sold estimates were added to the estimating program. This is defined as the difference between Total Production and Total Utilized Production. For Table 4-28, 2016 will include fresh market production, fresh market price, fresh market value, processing production, processing price, and processing value.
(NA) Not available. 1 Price and value at point of first sale. 2 Price and value at processing plant door. NASS, Crops Branch, (202) 720–2127.

IV–17 AGRICULTURAL STATISTICS 2017
Table 4-29.—Cucumbers for fresh market: Area, production, and value per hundredweight, by State and United States, 2014–2016
State Area harvested Production Value per unit
2014 2015 2016 2014 2015 2016 2014 2015 2016
1,000 1,000 1,000 Dollars Dollars Dollars Acres Acres Acres cwt cwt cwt per cwt per cwt per cwt
California ............. 3,800 3,500 (NA) 684 718 (NA) 24.20 29.60 (D) Florida .................. 9,400 10,600 (NA) 2,444 1,696 2,001 26.70 28.20 33.00 Georgia ................ 6,500 6,900 (NA) 1,008 1,725 1,805 23.20 23.90 21.80 Maryland .............. 340 460 (NA) 27 31 (NA) 28.00 23.00 (NA) Michigan .............. 3,400 3,700 (NA) 680 592 680 20.40 22.80 21.30 New Jersey .......... 3,100 3,200 (NA) 667 688 556 22.40 23.90 26.20 New York ............. 1,700 1,900 (NA) 272 304 (NA) 37.10 56.90 (NA) North Carolina ..... 4,800 4,800 (NA) 552 696 (NA) 19.00 18.00 (D) South Carolina ..... 1,800 1,100 (NA) 252 127 336 24.90 21.80 23.80 Texas ................... 2,400 1,500 (NA) 283 116 159 18.60 18.50 22.30 Virginia ................. 330 320 (NA) 26 32 (NA) 44.50 40.00 (NA) Wisconsin ............ (NA) (NA) (NA) (NA) (NA) 15 (NA) (NA) 51.00 Other States ........ (NA) (NA) (NA) (NA) (NA) 1,430 (NA) (NA) 24.90
United States ....... 37,570 37,980 (NA) 6,895 6,725 6,982 24.40 26.30 26.10
Note: Beginning in 2016, acreage and yield estimates for fresh market and processing utilizations were discontinued. Only total acreage and total yield will be published beginning in 2016. Total production and utilized production are estimated for each crop. Harvested not sold estimates were added to the estimating program. This is defined as the difference between total production and total utilized production. For Table 4-29, 2016 includes fresh market production and fresh market price.
(D) Withheld to avoid disclosing data for individual operations. (NA) Not available. NASS, Crops Branch, (202) 720–2127.
Table 4-30.—Cucumbers for fresh market, commercial crop: Area, yield, production, value, and total value, United States, 2010-2016
Year Area harvested Yield per acre Production Value
Per cwt Total
Acres Cwt 1,000 cwt Dollars 1,000 dollars
2010 ..................... 43,410 192 8,351 22.90 190,886 2011 ..................... 39,000 184 7,194 26.70 191,814 2012 ..................... 38,300 214 8,182 25.00 204,464 2013 ..................... 38,360 198 7,603 26.80 203,894 2014 ..................... 37,570 184 6,895 24.40 168,038 2015 ..................... 37,980 177 6,725 26.10 175,762 2016 ..................... (NA) (NA) 6,982 26.10 182,297
Note: Beginning in 2016, acreage and yield estimates for fresh market and processing utilizations were discontinued. Only total acreage and total yield will be published beginning in 2016. Total production and utilized production are estimated for each crop. Harvested not sold estimates were added to the estimating program. This is defined as the difference between total production and total utilized production. For Table 4-30, 2016 includes fresh market production, fresh market price, and fresh market value.
(NA) Not available. NASS, Crops Branch, (202) 720–2127.
Table 4-31.—Cucumbers (for pickles), commercial crop: Area, production, and value per ton, by State and United States, 2014–2016
State Area harvested Production Value per unit
2014 2015 2016 2014 2015 2016 2014 2015 2016
Dollars Dollars Dollars Acres Acres Acres Tons Tons Tons per ton per ton per ton
Florida .................. 19,200 18,010 (NA) 150,910 148,040 93,100 555.00 435.00 546.00 Georgia ................ (NA) (NA) (NA) (NA) (NA) 6,500 (NA) (NA) 423.00 Indiana ................. 2,300 (D) (NA) 11,500 (D) (NA) 320.00 (D) (NA) Michigan .............. 27,400 29,000 (NA) 167,140 171,100 236,700 210.00 220.00 200.00 New Jersey .......... (NA) (NA) (NA) (NA) (NA) 5,549 (NA) (NA) 400.00 North Carolina ..... (D) (D) (NA) (D) (D) (D) (D) (D) (D) Ohio ..................... 6,500 5,000 (NA) 40,950 27,000 (D) 300.00 260.00 (D) South Carolina ..... (D) (D) (NA) (D) (D) 2,950 (D) (D) 406.00 Texas ................... 4,200 3,950 (NA) 19,570 21,800 21,550 540.00 320.00 340.00 Wisconsin ............ 5,400 5,400 (NA) 33,800 32,890 33,172 297.00 290.00 220.00 Other States 1 ...... 19,430 23,750 (NA) 113,040 132,630 135,760 418.00 355.00 327.00
United States ....... 84,430 85,110 (NA) 536,910 533,460 535,281 378.00 324.00 305.00
Note: Beginning in 2016, acreage and yield estimates for fresh market and processing utilizations were discontinued. Only total acreage and total yield will be published beginning in 2016. Total production and utilized production are estimated for each crop. Harvested not sold estimates were added to the estimating program. This is defined as the difference between total production and total utilized production. For Table 4-31, 2016 includes processing production and processing price.
(D) Withheld to avoid disclosing data for individual operations. (NA) Not available. 1 Other States include Alabama, Cali-fornia Delaware, Georgia, and Maryland.
NASS, Crops Branch, (202) 720-2127.

IV–18 STATISTICS OF VEGETABLES AND MELONS
Table 4-32.—Cucumbers (for pickles), commercial crop: Area, yield, production, value per ton, total value, and pickle stocks, United States, 2010-2016
Year
Processing
Pickle stocks on hand Dec. 1 2 3 Area
harvested Yield per acre Production Value 1
Per ton Total
Acres Tons Tons Dollars 1,000 dollars Tons
2010 ... 87,900 6.27 551,370 337.00 185,928 183,465 2011 ... 82,630 5.83 482,030 360.00 173,425 259,515 2012 ... 84,560 5.68 480,060 342.00 164,151 275,003 2013 ... 82,100 5.76 473,140 313.00 148,101 212,820 2014 ... 84,430 6.36 536,910 378.00 202,705 87,815 2015 ... 85,110 6.27 533,460 324.00 172,715 56,230 2016 ... (NA) (NA) 535,281 305.00 163,373 (NA)
Note: Beginning in 2016, acreage and yield estimates for fresh market and processing utilizations were discontinued. Only total acreage and total yield will be published beginning in 2016. Total production and utilized production are estimated for each crop. Harvested not sold estimates were added to the estimating program. This is defined as the difference between Total Production and Total Utilized Production. For Table 4-32, 2016 includes processing production, processing price, and processing value. Pickle stocks were discontinued in 2016.
(NA) Not available. 1 Price and value at processing plant door. 2 Stocks in hands of original salters of both salt and dill pickles, sold and unsold, in tanks and barrels, on Dec. 1. 3 Includes stocks of fresh-pack pickles.
NASS, Crops Branch, (202) 720-2127.
Table 4-33.—Garlic for fresh market and processing, commercial crop: Area, yield, production, value, and total value, United States, 2010-2016
Year Area harvested Yield per acre Production Value
Per cwt Total
Acres Cwt 1,000 cwt Dollars 1,000 dollars
2010 ..................... 22,850 164 3,752 71.10 266,884 2011 ..................... 25,150 167 4,204 68.20 286,820 2012 ..................... 25,950 166 4,319 52.60 227,090 2013 ..................... 23,900 162 3,867 60.00 231,977 2014 ..................... 23,800 163 3,868 68.80 266,265 2015 ..................... 25,200 162 4,089 78.50 321,006 2016 ..................... 24,600 150 3,690 72.80 268,665
Note: Beginning in 2016, Acreage and Yield estimates for fresh market and processing utilizations were discontinued. Only total acreage and total yield will be published beginning in 2016. Total Production and Utilized Production are esti-mated for each crop. Harvested Not Sold estimates were added to the estimating program. This is defined as the difference between Total Production and Total Utilized Production. For Table 4-33, 2016 will include utilized production.
NASS, Crops Branch, (202) 720–2127.
Table 4-34.—Garlic for fresh market and processing: Area, production, and value per hundredweight, by State and United States, 2014–2016
State Area harvested Production Value per unit
2014 2015 2016 2014 2015 2016 2014 2015 2016
1,000 1,000 1,000 Dollars Dollars Dollars Acres Acres Acres cwt cwt cwt per cwt per cwt per cwt
California ............. 23,000 24,100 24,600 3,795 3,977 3,690 69.30 76.70 72.8 Nevada ................ 550 (D) (NA) 61 (D) (NA) 33.00 (D) (NA) Oregon ................. 250 (D) (NA) 12 (D) (NA) 90.00 (D) (NA) Other States ........ (X) 1,100 0 (X) 112 0 (X) 141 0
United States ....... 23,800 25,200 24,600 3,868 4,089 3,690 68.80 78.50 72.8
(D) Withheld to avoid disclosing data for individual operations. (NA) Not available. (X) Not applicable. NASS, Crops Branch, (202) 720–2127.

IV–19 AGRICULTURAL STATISTICS 2017
Table 4-35.—Honeydew melons, commercial crop: Area, yield, production, value per hundredweight, and total value, United States, 2010–2016
Year Area harvested Yield per acre Production Value 1
Per cwt Total
Acres Cwt 1,000 cwt Dollars 1,000 dollars
2010 ........... 16,850 220 3,704 15.50 57,418 2011 ........... 15,400 236 3,628 22.10 80,008 2012 ........... 13,600 242 3,286 20.70 67,973 2013 ........... 14,450 249 3,605 20.90 75,389 2014 ........... 14,450 259 3,739 23.70 88,649 2015 ........... 14,400 262 3,769 22.60 85,343 2016 ........... (NA) (NA) 3,520 19.20 67,584
Note: Beginning in 2016, acreage and yield estimates for fresh market and processing utilizations were discontinued. Only total acreage and total yield will be published beginning in 2016. Total production and utilized production are estimated for each crop. Harvested not sold estimates were added to the estimating program. This is defined as the difference between total production and total utilized production. For Table 4-35, 2016 includes fresh market production, fresh market price, and fresh market value.
(NA) Not available. 1 Price and value at point of first sale. NASS, Crops Branch, (202) 720–2127.
Table 4-36.—Honeydew melons, commercial crop: Area, production, and value per hundredweight, by State and United States, 2014–2016
State Area harvested Production Value per unit
2014 2015 2016 2014 2015 2016 2014 2015 2016
1,000 1,000 1,000 Dollars Dollars Dollars Acres Acres Acres cwt cwt cwt per cwt per cwt per cwt
Arizona .............. 3,500 2,300 (NA) 805 564 (NA) 32.60 24.10 (NA) California ........... 10,500 11,500 (NA) 2,835 3,105 3,520 21.00 22.20 19.2 Texas ................ 450 600 (NA) 99 100 (NA) 29.00 28.20 (NA)
United States .... 14,450 14,400 (NA) 3,739 3,769 3,520 23.70 22.60 19.2
Note: Beginning in 2016, acreage and yield estimates for fresh market and processing utilizations were discontinued. Only total acreage and total yield will be published beginning in 2016. Total production and utilized production are estimated for each crop. Harvested not sold estimates were added to the estimating program. This is defined as the difference between total production and total utilized production. For Table 4-36, 2016 includes fresh market production and fresh market price.
(NA) Not available. NASS, Crops Branch, (202) 720–2127.
Table 4-37.—Head lettuce, commercial crop: Area, production, and value per hundredweight, by State and United States, 2014–2016
State Area harvested Production Value per unit
2014 2015 2016 2014 2015 2016 2014 2015 2016
1,000 1,000 1,000 Dollars Dollars Dollars Acres Acres Acres cwt cwt cwt per cwt per cwt per cwt
Arizona .............. 34,500 32,500 36,800 12,248 10,238 12,696 12.80 24.80 38.50 California ........... 91,000 86,500 89,500 33,670 32,870 34,905 28.60 30.40 23.80
United States .... 125,500 119,000 126,300 45,918 43,108 47,601 24.40 29.10 27.70
NASS, Crops Branch, (202) 720–2127.
Table 4-38.—Head lettuce, commercial crop: Area, yield, production, value per hundredweight, and total value, United States, 2010–2016
Year Area harvested Yield per acre Production Value 1
Per cwt Total
Acres Cwt 1,000 cwt Dollars 1,000 dollars
2010 ........... 132,000 380 50,120 21.10 1,057,504 2011 ........... 130,500 381 49,665 23.00 1,142,267 2012 ........... 141,600 360 50,976 17.70 901,238 2013 ........... 129,000 350 45,150 26.70 1,203,930 2014 ........... 125,500 366 45,918 24.40 1,119,736 2015 ........... 119,000 362 43,108 29.10 1,253,150 2016 ........... 126,300 377 47,601 27.70 1,319,535
Note: Beginning in 2016, acreage and yield estimates for fresh market and processing utilizations were discontinued. Only total acreage and total yield will be published beginning in 2016. Total production and utilized production are estimated for each crop. Harvested not sold estimates were added to the estimating program. This is defined as the difference between total production and total utilized production.
1 Price and value at point of first sale. NASS, Crops Branch, (202) 720–2127.

IV–20 STATISTICS OF VEGETABLES AND MELONS
Table 4-39.—Leaf lettuce for fresh market, commercial crop: Area, yield, production, value per hundredweight, and total value, United States, 2010–2016
Year Area harvested Yield per acre Production Value 1
Per cwt Total
Acres Cwt 1,000 cwt Dollars 1,000 dollars
2010 ........... 51,200 254 13,004 38.40 499,538 2011 ........... 47,400 252 11,939 34.60 413,484 2012 ........... 52,500 244 12,825 35.30 452,858 2013 ........... 55,000 230 12,650 38.30 484,036 2014 ........... 54,100 240 12,984 37.90 491,602 2015 ........... 55,100 258 14,233 59.70 850,238 2016 ........... 59,200 224 13,264 49.70 658,962
Note: Beginning in 2016, Acreage and Yield estimates for fresh market and processing utilizations were discontinued. Only total acreage and total yield will be published beginning in 2016. Total Production and Utilized Production are esti-mated for each crop. Harvested Not Sold estimates were added to the estimating program. This is defined as the difference between Total Production and Total Utilized Production.
1 Price and value at point of first sale. NASS, Crops Branch, (202) 720–2127.
Table 4-40.—Leaf lettuce for fresh market: Area, production, and value per hundredweight, by State and United States, 2014–2016
State Area harvested Production Value per unit
2014 2015 2016 2014 2015 2016 2014 2015 2016
Fresh market: Acres 1,000 cwt Dollars per cwt
Arizona .............. 8,100 9,300 9,600 1,944 2,325 2,352 31.40 63.00 64.90 California ........... 46,000 45,800 49,600 11,040 11,908 10,912 39.00 59.10 46.40
United States .... 54,100 55,100 59,200 12,984 14,233 13,264 37.90 59.70 49.70
NASS, Crops Branch, (202) 720–2127.
Table 4-41.—Romaine lettuce for fresh market, commercial crop: Area, yield, production, value per hundredweight, and total value, United States, 2010–2016
Year Area harvested Yield per acre Production Value 1
Per cwt Total
Acres Cwt 1,000 cwt Dollars 1,000 dollars
2010 ........... 79,300 345 27,389 23.90 655,659 2011 ........... 81,900 344 28,142 31.50 886,342 2012 ........... 88,900 318 28,256 22.40 633,489 2013 ........... 91,100 292 26,620 33.10 880,373 2014 ........... 85,400 289 24,679 31.00 763,887 2015 ........... 87,000 303 26,335 39.70 1,046,571 2016 ........... 96,200 301 28,946 31.20 902,476
Note: Beginning in 2016, Acreage and Yield estimates for fresh market and processing utilizations were discontinued. Only total acreage and total yield will be published beginning in 2016. Total Production and Utilized Production are esti-mated for each crop. Harvested Not Sold estimates were added to the estimating program. This is defined as the difference between Total Production and Total Utilized Production.
1 Price and value at point of first sale. NASS, Crops Branch, (202) 720–2127.
Table 4-42.—Romaine lettuce for fresh market: Area, production, and value per hundredweight, by State and United States, 2014–2016
State Area harvested Production Value per unit
2014 2015 2016 2014 2015 2016 2014 2015 2016
Fresh market: Acres 1,000 cwt Dollars per cwt
Arizona .............. 21,900 23,500 26,200 6,899 7,285 8,646 23.10 45.60 32.30 California ........... 63,500 63,500 70,000 17,780 19,050 20,300 34.00 37.50 30.70
United States .... 85,400 87,000 96,200 24,679 26,335 28,946 31.00 39.70 31.20
NASS, Crops Branch, (202) 720–2127.

IV–21 AGRICULTURAL STATISTICS 2017
Table 4-43.—Onions, commercial crop: Area, yield, production, shrinkage and loss, value per hundredweight, and total value, United States, 2010–2016 1
Year Area harvested
Yield per acre Production 2 Shrinkage and
loss
Value 3
Per cwt Total
Acres Cwt 1,000 cwt 1,000 cwt Dollars 1,000 dollars
2010 .................. 149,270 493 73,599 6,112 15.60 1,049,704 2011 .................. 147,630 502 74,097 5,882 10.90 742,236 2012 .................. 146,870 487 71,495 4,923 14.20 942,340 2013 .................. 143,340 486 69,654 4,858 15.00 969,183 2014 .................. 139,850 499 69,815 4,147 13.60 892,325 2015 .................. 133,600 503 67,184 4,718 15.50 1,039,325 2016 .................. 132,600 542 71,866 5,158 13.90 925,833
1 Mostly for fresh market use, but includes some quantities used for processing. 2 Includes storage crop onions har-vested but not sold because of shrinkage and loss. 3 Price and value at point of first sale.
NASS, Crops Branch, (202) 720–2127.
Table 4-44.—Onions for fresh market: Area harvested, production, shrinkage and loss, and value per hundredweight, by State and United States, 2014–2015
Season and State Area harvested Production Shrinkage and loss Value per unit
2014 2015 2014 2015 2014 2015 2014 2015
Dollars Dollars Acres Acres 1,000 cwt 1,000 cwt 1,000 cwt 1,000 cwt per cwt per cwt
Spring 1: California ............................. 6,800 6,700 2,992 3,015 ................ ................ 12.30 17.70 Georgia ............................... 11,000 11,200 2,585 2,688 ................ ................ 41.90 45.30 Texas .................................. 9,000 4,000 2,340 800 ................ ................ 24.00 24.60
United States ...................... 26,800 21,900 7,917 6,503 ................ ................ 25.40 30.00
Summer non- storage 1: California ............................. 7,800 7,500 3,744 3,750 ................ ................ 7.00 7.00 Nevada ............................... (D) (D) (D) (D) ................ ................ (D) (D) New Mexico ........................ 5,100 5,100 3,060 3,808 ................ ................ 18.70 28.00 Texas .................................. (D) (D) (D) (D) ................ ................ (D) (D) Washington 2 ....................... 2,000 2,000 800 760 ................ ................ 34.60 45.80 Other States 3 ..................... 4,250 3,900 1,622 1,393 ................ ................ 34.10 33.40
United States ...................... 19,150 19,000 9,226 9,711 ................ ................ 18.00 22.10
Summer storage: California 4 .......................... 30,000 30,000 13,129 12,000 250 250 13.30 14.70 Colorado ............................. 3,600 3,400 1,800 1,632 198 114 19.00 20.30 Idaho ................................... 6,900 8,000 5,658 5,760 410 829 8.40 10.10 Michigan ............................. 2,500 2,400 925 792 65 79 12.90 14.10 New York ............................ 8,000 7,500 2,360 2,588 151 285 15.30 17.60 Oregon
Malheur ........................... 9,300 9,200 7,440 6,992 670 909 8.40 10.10 Other ............................... 10,300 9,300 6,798 6,045 1,240 1,209 8.90 13.20
Washington ......................... 20,000 19,900 13,000 13,731 1,040 947 8.90 13.90 Wisconsin ........................... 1,700 1,500 791 645 44 5 17.50 16.60 Other States 3 ..................... 1,600 1,500 771 785 79 95 11.70 13.10
United States ...................... 93,900 92,700 52,672 50,970 4,147 4,722 10.80 13.60
Total summer ......................... 113,050 111,700 61,898 60,681 ................ ................ 12.10 13.10
Total, spring and summer ...... 139,850 133,600 69,815 67,184 ................ ................ 13.60 15.50
(D) Withheld to avoid disclosing data for individual operations. 1 Primarily fresh market. 2 Includes Walla Walla and other non-storage onions. 3 Other States include Nevada and Texas for Summer Non-storage Onions and Ohio and Utah for Summer Storage Onions. 4 Primarily dehydrated processing.
NASS, Crops Branch, (202) 720–2127.

IV–22 STATISTICS OF VEGETABLES AND MELONS
Table 4-45.—Onions (fresh market): Foreign trade, United States, 2010–2016 1
Year beginning July Imports Domestic exports
1,000 cwt 1,000 cwt
2010 ................ 8,783 7,478 2011 ................ 8,337 6,479 2012 ................ 9,306 6,221 2013 ................ 10,652 7,223 2014 ................ 10,436 6,109 2015 ................ 11,539 6,391 2016 ................ 11,532 6,570
1 Includes bulb onions, onion sets, and pearl onions. ERS, Market and Trade Economics Division, (202) 694–5326. Based on data from U.S. Department of Commerce, U.S.
Census Bureau.
Table 4-46.—Peas, green (processing), commercial crop: Area, yield, production, value per ton, and total value, United States, 2010–2016
Year Area harvested Yield per acre Production Value 1
Per ton Total
Acres Tons Tons Dollars 1,000 dollars
2010 ..................... 172,600 2.00 345,640 287.00 99,216 2011 ..................... 159,100 1.90 314,120 416.00 130,738 2012 ..................... 194,500 2.09 407,250 434.00 176,818 2013 ..................... 178,300 2.00 356,050 427.00 151,928 2014 ..................... 187,600 1.93 362,860 367.00 133,261 2015 ..................... 166,200 2.47 411,320 320.00 131,568 2016 ..................... (NA) (NA) 340,480 258.00 87,866
Note: Beginning in 2016, acreage and yield estimates for fresh market and processing utilizations were discontinued. Only total acreage and total yield will be published beginning in 2016. Total production and utilized production are estimated for each crop. Harvested not sold estimates were added to the estimating program. This is defined as the difference between total production and total utilized production. For Table 4-46, 2016 includes only processing production, processing price, and processing value.
(NA) Not available. 1 Price and value at processing plant door. NASS, Crops Branch, (202) 720–2127.
Table 4-47.—Peas, green (processing), commercial crop: Area, production, and value per ton, by State and United States, 2014–2016 1
State Area harvested Production Value per unit
2014 2015 2016 2014 2015 2016 2014 2015 2016
Dollars Dollars Dollars Acres Acres Acres Tons Tons Tons per ton per ton per ton
Delaware ............. 5,000 (D) (NA) 11,300 (D) (D) 340.00 (D) (NA) Minnesota ............ 64,000 48,500 (NA) 78,150 112,450 95,250 567.00 402 249 New York ............. (NA) (D) (NA) (NA) (D) 9,950 (NA) (D) 231 Oregon ................. 19,600 (D) (NA) 41,430 (D) (D) 253.00 (D) (D) Washington .......... 40,500 42,600 (NA) 118,440 147,210 (D) 249.00 262 (D) Wisconsin ............ 36,600 34,300 (NA) 70,640 81,120 63,050 378.00 334 198 Other States 2 ...... 21,900 40,800 (NA) 42,900 70,540 172,230 433.00 294 287
United States ....... 187,600 166,200 (NA) 362,860 411,320 340,480 367.00 320 258
NOTE: Beginning in 2016, Acreage and Yield estimates for fresh market and processing utilizations were discontinued. Only total acreage and total yield will be published beginning in 2016. Total Production and Utilized Production are esti-mated for each crop. Harvested Not Sold estimates were added to the estimating program. This is defined as the difference between Total Production and Total Utilized Production. For Table 4.47, 2016 will include only processing production and processing price.
(D) Withheld to avoid disclosing data for individual operations. (NA) Not available. 1 Shelled basis; 21⁄2 pounds of peas in the shell produce approximately 1 pound of shelled peas. 2 Other States include Illinois, Maryland, New Jersey, New York, and Oregon.
NASS, Crops Branch, (202) 720–2127.

IV–23 AGRICULTURAL STATISTICS 2017
Table 4-48.—Chile peppers for fresh market and processing: Area, production, and value per hundredweight, by State and United States, 2014–2016 1 2
State Area harvested Production Value per unit
2014 2015 2016 2014 2015 2016 2014 2015 2016
1,000 1,000 1,000 Dollars Dollars Dollars Acres Acres Acres cwt cwt cwt per cwt per cwt per cwt
Arizona ................ 1,400 1,300 1,600 80 81 122 33.80 48.30 36.50 California ............. 6,900 6,400 6,700 3,186 2,424 3,049 51.80 31.50 32.50 New Mexico ......... 7,700 7,700 8,700 1,174 1,334 1,383 33.00 30.80 36.70 Texas ................... 3,100 2,700 3,000 185 195 150 52.40 73.50 60.00
United States ....... 19,100 18,100 20,000 4,625 4,034 4,704 46.70 33.60 34.70
1 Chile peppers are defined as all peppers excluding bell peppers. 2 Estimates include both fresh and dry product com-bined.
NASS, Crops Branch, (202) 720–2127.
Table 4-49.—Chile peppers for fresh market and processing, commercial crop: Area, yield, production, value, and total value, United States, 2007–2016 1
Year Area harvested Yield per acre Production Value
Per cwt Total
Acres Cwt 1,000 cwt Dollars 1,000 dollars
2007 ..................... 24,900 156 3,877 29.90 115,745 2008 ..................... 25,200 168 4,235 26.60 112,753 2009 ..................... 28,500 177 5,042 27.80 140,405 2010 ..................... 23,000 202 4,644 29.80 138,586 2011 ..................... 22,100 178 3,928 35.00 137,657 2012 ..................... 20,400 212 4,315 36.20 156,039 2013 ..................... 20,000 211 4,210 39.90 168,146 2014 ..................... 19,100 242 4,625 46.70 216,107 2015 ..................... 18,100 223 4,034 33.60 135,743 2016 ..................... 20,000 235 4,704 34.70 162,851
Note: Beginning in 2016, acreage and yield estimates for fresh market and processing utilizations were discontinued. Only total acreage and total yield will be published beginning in 2016. Total production and utilized production are estimated for each crop. Harvested Not Sold estimates were added to the estimating program. This is defined as the difference between total production and total utilized production. For Table 4-49, 2016 includes harvested not sold and utilized production.
1 Chile peppers are defined as all peppers excluding bell peppers. Estimates include both fresh and dry product com-bined.
NASS, Crops Branch, (202) 720–2127.
Table 4-50.—Bell peppers for fresh market and processing: Area, production, and value per hundredweight, by State and United States, 2014–2016
State Area harvested Production Value per unit
2014 2015 2016 2014 2015 2016 2014 2015 2016
1,000 1,000 1,000 Dollars Dollars Dollars Acres Acres Acres cwt cwt cwt per cwt per cwt per cwt
California ............. 19,400 16,500 19,800 9,432 7,508 8,217 36.10 49.00 48.40 Florida .................. 11,900 12,200 12,900 3,094 4,392 3,806 53.10 50.20 55.10 Georgia ................ 3,800 3,600 3,200 798 1,008 960 51.70 48.10 34.10 Michigan .............. 1,400 1,400 1,400 364 392 364 37.00 38.00 37.00 New Jersey .......... 2,800 2,500 2,300 952 763 633 31.00 45.00 31.60 New York ............. (NA) (NA) 900 (NA) (NA) 261 (NA) (NA) 29.50 North Carolina ..... 2,100 2,200 2,300 441 517 575 44.00 42.00 33.00 Ohio ..................... 2,600 2,500 2,600 455 575 650 38.00 43.00 44.00 Pennsylvania ....... (NA) (NA) 900 (NA) (NA) 149 (NA) (NA) 47.50
United States ....... 44,000 40,900 46,300 15,536 15,155 15,615 40.30 48.30 47.10
(NA) Not available. NASS, Crops Branch, (202) 720–2127.

IV–24 STATISTICS OF VEGETABLES AND MELONS
Table 4-51.—Bell peppers for fresh market and processing, commercial crop: Area, yield, production, value, hundredweight, and total value, United States, 2007-2016
Year Area harvested Yield per acre Production Value
Per cwt Total
Acres Cwt 1,000 cwt Dollars 1,000 dollars
2007 ........................... 54,000 298 16,100 33.10 532,799 2008 ........................... 50,800 312 15,867 40.10 635,662 2009 ........................... 49,400 331 16,354 34.10 557,749 2010 ........................... 49,000 309 15,161 39.10 592,266 2011 ........................... 46,400 351 16,275 37.80 615,740 2012 ........................... 45,500 345 15,687 32.80 514,000 2013 ........................... 44,800 322 14,433 41.60 599,932 2014 ........................... 44,000 353 15,536 40.30 626,089 2015 ........................... 40,900 371 15,155 48.30 732,699 2016 ........................... 46,300 337 15,615 47.10 735,776
Note: Beginning in 2016, acreage and yield estimates for fresh market and processing utilizations were discontinued. Only total acreage and total yield will be published beginning in 2016. Total production and utilized production are estimated for each crop. Harvested not sold estimates were added to the estimating program. This is defined as the difference between total production and total utilized production.
NASS, Crops Branch, (202) 720–2127.
Table 4-52.—Potatoes: Area, yield, production, season average price, and value, United States, 2007–2016
Year Area planted Area harvested
Yield per harvested acre Production
Season average price per cwt received by
farmers 1
Value of production
1,000 acres 1,000 acres Cwt 1,000 cwt Dollars 1,000 dollars
2007 ... 1,141.9 1,122.2 396 444,875 7.51 3,339,710 2008 ... 1,059.6 1,046.9 396 415,055 9.09 3,770,462 2009 ... 1,071.2 1,044.0 414 432,601 8.25 3,557,574 2010 ... 1,026.7 1,008.9 401 404,549 9.20 3,724,821 2011 ... 1,100.7 1,078.5 399 430,037 9.41 4,044,869 2012 ... 1,154.8 1,138.5 408 464,970 8.63 4,017,245 2013 ... 1,063.9 1,050.9 414 434,652 9.75 4,237,284 2014 ... 1,062.6 1,051.1 421 442,170 8.88 3,928,211 2015 ... 1,066.1 1,054.4 418 441,205 8.76 3,865,538 2016 ... 1,037.0 1,018.3 433 441,411 9.08 4,009,220
1 2002-2007 obtained by weighting State prices by quantity sold. 2008 obtained by weighting State prices by production. NASS, Crops Branch, (202) 720–2127.
Table 4-53.—Potatoes: Production, seed used, and disposition, United States, 2007–2016
Year Production Total used for seed
Used on farms where produced
Sold For seed, feed, and household use Shrinkage and loss
1,000 cwt 1,000 cwt 1,000 cwt 1,000 cwt 1,000 cwt
2007 ... 444,875 24,476 4,105 29,561 411,209 2008 ... 415,055 24,595 4,139 26,438 384,478 2009 ... 432,601 24,027 4,535 29,135 398,931 2010 ... 404,549 25,100 4,227 24,996 375,326 2011 ... 430,037 26,527 4,146 27,789 398,102 2012 ... 464,970 25,656 4,850 28,505 431,615 2013 ... 434,652 25,249 4,323 26,211 404,118 2014 ... 442,170 26,259 4,192 26,762 411,216 2015 ... 441,205 25,715 4,631 26,509 410,065 2016 ... 441,411 25,323 4,284 26,460 410,667
NASS, Crops Branch, (202) 720–2127.

IV–25 AGRICULTURAL STATISTICS 2017
Table 4-54.—Potatoes: Area, production, and marketing year price per hundredweight received by farmers, by State and United States, 2014–2016
Season and State Area harvested Yield Production
2014 2015 2016 2014 2015 2016 2014 2015 2016
1,000 1,000 1,000 1,000 1,000 1,000 acres acres acres Cwt Cwt Cwt cwt cwt cwt
Spring: Arizona ..................... 3.5 3.5 (NA) 310 290 (NA) 1,085 1,015 (NA) California .................. 24.8 26.7 25.1 470 385 390 11,656 10,280 9,789 Florida ...................... 29.3 29.6 22.9 240 230 235 7,032 6,808 5,382 North Carolina ......... 13.5 12.7 (NA) 210 210 (NA) 2,835 2,667 (NA)
United States ........... 71.1 72.5 48.0 318 286 316 22,608 20,770 15,171
Summer: Delaware .................. 1.2 (D) (NA) 290 (D) (NA) 348 (D) (NA) Illinois ....................... 6.4 6.9 6.9 415 380 380 2,656 2,622 2,622 Kansas ..................... 4.1 3.6 4.2 340 335 300 1,394 1,206 1,260 Maryland .................. 2.3 2.4 (D) 380 330 (D) 874 792 (D) Missouri ................... 7.9 8.1 7.9 270 305 305 2,133 2,471 2,410 New Jersey .............. 1.9 (D) (D) 225 (D) (D) 428 (D) (D) North Carolina ......... (NA) (NA) 13.6 (NA) (NA) 220 (NA) (NA) 2,992 Texas ....................... 20.6 18.2 19.6 335 375 395 6,901 6,825 7,742 Virginia ..................... 4.5 4.7 4.1 250 220 290 1,125 1,034 1,189 Other States ............ - 3.2 4.4 - 245 315 - 784 1,387
United States ........... 48.9 47.1 60.7 324 334 323 15,859 15,734 19,602
Fall: California .................. 8.3 8.4 7.9 470 420 445 3,901 3,528 3,516 Colorado .................. 59.8 57.4 57.1 388 393 389 23,196 22,575 22,236
San Luis Valley ... 53.9 51.8 51.5 380 385 385 20,482 19,943 19,828 All other areas .... 5.9 5.6 5.6 460 470 430 2,714 2,632 2,408
Idaho ........................ 320.0 322.0 324.0 415 405 430 132,880 130,400 139,320 10 S.W. counties 16.0 16.0 (NA) 515 500 (NA) 8,240 8,000 (NA) All other counties 304.0 306.0 (NA) 410 400 (NA) 124,640 122,400 (NA)
Maine ....................... 50.5 50.5 46.5 290 320 325 14,645 16,160 15,113 Massachusetts ......... 3.6 3.6 (NA) 285 305 (NA) 1,026 1,098 (NA) Michigan .................. 42.5 45.0 46.0 370 390 370 15,725 17,550 17,020 Minnesota ................ 41.0 40.5 42.0 400 400 400 16,400 16,200 16,800 Montana ................... 11.3 10.9 11.0 320 325 335 3,616 3,543 3,685 Nebraska ................. 16.9 15.3 16.4 470 450 450 7,943 6,885 7,380 Nevada .................... (D) (D) (NA) (D) (D) (NA) (D) (D) (NA) New Mexico ............. (D) (D) (NA) (D) (D) (NA) (D) (D) (NA) New York ................. 15.8 14.8 14.8 275 280 240 4,345 4,144 3,552 North Dakota ........... 77.0 80.0 72.0 310 345 300 23,870 27,600 21,600 Ohio ......................... 1.5 1.2 (NA) 280 230 (NA) 420 276 (NA) Oregon ..................... 38.9 38.9 38.9 580 560 590 22,562 21,784 22,951 Pennsylvania ........... 5.2 5.3 (NA) 275 280 (NA) 1,430 1,484 (NA) Rhode Island ........... 0.5 0.6 (NA) 245 135 (NA) 123 81 (NA) Washington .............. 165.0 170.0 169.0 615 590 625 101,475 100,300 105,625 Wisconsin ................ 64.0 62.5 64.0 410 445 435 26,240 27,813 27,840 Other States 1 .......... 9.3 7.9 - 420 415 - 3,906 3,280 -
United States ........... 931.1 934.8 909.6 434 433 447 403,703 404,701 406,638
All Potatoes: United States ........... 1,051.1 1,054.4 1,018.3 421 418 433 442,170 441,205 441,411
(D) Withheld to avoid disclosing data for individual operations. (NA) Not available. 1 Includes data withheld above. NASS, Crops Branch, (202) 720–2127.

IV–26 STATISTICS OF VEGETABLES AND MELONS
Table 4-55.—Fall potatoes: Total stocks held by growers, local dealers, and processors - 13 Fall States: 2015 and 2016 1
State Crop of 2015
Dec. 1 Feb. 1 Apr. 1 June 1
1,000 cwt 1,000 cwt 1,000 cwt 1,000 cwt California ........................................ 2,400 1,600 1,200 290 Colorado ........................................ 16,500 12,300 8,300 3,600 Idaho .............................................. 90,000 71,000 46,000 21,500 Maine ............................................. 12,500 8,900 5,800 2,300 Michigan ......................................... 10,900 6,700 3,500 (D) Minnesota ...................................... 10,400 7,800 4,700 1,400 Montana ......................................... 3,400 3,300 1,900 (D) Nebraska ........................................ 4,400 3,100 2,200 (D) New York ....................................... 2,200 1,500 600 (D) North Dakota .................................. 19,500 14,500 9,200 3,600 Oregon ........................................... 17,000 12,000 7,500 3,000 Washington .................................... 56,000 42,000 27,000 11,500 Wisconsin ....................................... 17,500 13,400 7,800 2,500 Other States 2 ................................ - - - 1,590
United States ................................. 262,700 198,100 125,700 51,280
Klamath Basin 3 ............................. 5,100 3,000 1,650 (D)
State Crop of 2016
Dec. 1 Feb. 1 Apr. 1 June 1
1,000 cwt 1,000 cwt 1,000 cwt 1,000 cwt California ........................................ (D) 1,900 (D) (D) Colorado ........................................ 16,200 11,900 7,600 3,200 Idaho .............................................. 100,000 76,000 52,000 21,000 Maine ............................................. 11,100 8,000 4,900 1,900 Michigan ......................................... 9,900 6,000 2,600 (D) Minnesota ...................................... 10,300 7,800 5,500 3,200 Montana ......................................... 3,500 3,400 2,700 (D) Nebraska ........................................ 4,300 3,300 1,400 (D) New York ....................................... (D) 1,200 (D) (D) North Dakota .................................. 16,600 11,800 7,500 2,700 Oregon ........................................... 18,700 12,600 7,500 3,700 Washington .................................... 59,000 45,000 29,000 13,000 Wisconsin ....................................... 18,800 14,200 8,800 3,900 Other States 2 ................................ 4,500 - 1,900 1,470
United States ................................. 272,900 203,100 131,400 54,070
Klamath Basin 3 ............................. (D) 3,100 1,800 (D)
- Represents zero. (D) Withheld to avoid disclosing data for individual operations. (NA) Not available. 1 Stocks are defined as the quantity (whether sold or not) remaining in storage for all purposes and uses, including seed potatoes that are not yet moved, and shrinkage, waste, and other losses that occur after the date of each estimate. 2 Includes data with-held above. 3 Includes potato stocks in California and Klamath County, Oregon.
NASS, Crops Branch, (202) 720–2127.
Table 4-56.—Fall potatoes: Production and total stocks held by growers and local dealers, 13 Major States, 2007–2016
Crop year Production
Total stocks
Dec. 1 Following year
Feb. 1 Apr. 1 June 1
1,000 cwt 1,000 cwt 1,000 cwt 1,000 cwt 1,000 cwt 2007 ............ 397,753 265,500 199,300 125,500 50,420 2008 ............ 369,866 243,700 183,900 115,800 45,300 2009 ............ 383,962 265,800 203,500 128,700 55,120 2010 ............ 357,467 240,200 180,300 111,000 41,320 2011 ............ 382,318 253,000 187,500 115,650 43,340 2012 ............ 410,367 271,500 204,600 (NA) (NA) 2013 ............ 386,824 (NA) (NA) 119,050 46,885 2014 ............ 396,798 265,700 200,800 128,700 56,335 2015 ............ 398,482 262,700 198,100 125,700 51,280 2016 ............ 406,638 272,900 203,100 131,400 54,070
(NA) Not available. NASS, Crops Branch, (202) 720–2127.

IV–27 AGRICULTURAL STATISTICS 2017
Table 4-57.—Potatoes: Utilization and processing, United States, 2015 and 2016
Utilization - 30 Program States 2015 2016
1,000 cwt 1,000 cwt
Sales Table stock ............................................................................................. 110,960 113,634
Processing ............................................................................................. 272,538 269,640
Other sales Livestock feed .................................................................................... 919 1,083 Seed ................................................................................................... 25,648 26,310 Other Sales Total ............................................................................... 26,567 27,393
Total sales .......................................................................................... 410,065 410,667
Non-sales Seed used on farms where grown ..................................................... 3,765 3,605 Household use and used for feed on farms where grown ................ 866 679 Shrinkage and loss ............................................................................. 26,509 26,460
Total non-sales ................................................................................... 31,140 30,744
Total production .................................................................................. 441,205 441,411
Processing - United States 2015 2016
1,000 cwt 1,000 cwt
Processing Chips and shoestring ......................................................................... 56,807 60,266 All Dehydrated (including starch and flour) ........................................ 48,016 48,015 Frozen french fries ............................................................................. 152,329 156,985 Other frozen products ........................................................................ 13,573 12,695 Canned potatoes ................................................................................ 985 1,234 Other canned products (hash, stews, soups) .................................... 730 698 Other (including fresh pack, potato salad, vodka, etc) ...................... 6,420 6,000
Total .................................................................................................... 278,860 285,893
NASS, Crops Branch, (202) 720–2127.

IV–28 STATISTICS OF VEGETABLES AND MELONS
Table 4-58.—Potatoes: Production, seed used, and farm disposition, by seasonal groups, crop of 2015
Season and State Production Total used for seed
Used on farms where produced
Sold For seed, feed, and household
use
Shrinkage and loss
1,000 cwt 1,000 cwt 1,000 cwt 1,000 cwt 1,000 cwt
Spring Arizona ....................... 1,015 (D) (D) (D) (D) California .................... 10,280 754 8 935 9,337 Florida ........................ 6,808 658 1 - 6,807 North Carolina ............ 2,667 (D) (D) (D) (D) Other States 1 ............. - 422 5 33 3,644
United States ............. 20,770 1,834 14 968 19,788
Summer Delaware .................... (D) (D) (D) (D) (D) Illinois ......................... 2,622 158 - 12 2,610 Kansas ....................... 1,206 105 - 46 1,160 Maryland .................... 792 36 1 1 790 Missouri ...................... 2,471 194 - 10 2,461 New Jersey ................ (D) (D) (D) (D) (D) Texas ......................... 6,825 584 - - 6,825 Virginia ....................... 1,034 70 2 3 1,029 Other States ............... 784 55 - 2 782
United States ............. 15,734 1,202 3 74 15,657
Fall California .................... 3,528 154 2 141 3,385 Colorado ..................... 22,575 1,415 930 2,030 19,615 Idaho .......................... 130,400 8,060 1,089 8,420 120,891 Maine ......................... 16,160 1,029 322 1,615 14,223 Massachusetts ........... 1,098 88 16 9 1,073 Michigan ..................... 17,550 1,152 335 540 16,675 Minnesota ................... 16,200 840 104 826 15,270 Montana ..................... 3,543 294 208 140 3,195 Nebraska .................... 6,885 479 251 529 6,105 Nevada ....................... (D) (D) (D) (D) (D) New Mexico ............... (D) (D) (D) (D) (D) New York ................... 4,144 288 46 290 3,808 North Dakota .............. 27,600 1,782 456 2,234 24,910 Ohio ............................ 276 29 5 5 266 Oregon ....................... 21,784 1,053 207 1,305 20,272 Pennsylvania .............. 1,484 122 28 22 1,434 Rhode Island .............. 81 12 2 1 78 Washington ................ 100,300 4,323 268 6,220 93,812 Wisconsin ................... 27,813 1,361 222 1,004 26,587 Other States 1 ............. 3,280 198 123 136 3,021
United States ............. 404,701 22,679 4,614 25,467 374,620
All potatoes United States ............. 441,205 25,715 4,631 26,509 410,065
- Represents zero. (D) Withheld to avoid disclosing data for individual operations. 1 Includes data withheld above. NASS, Crops Branch, (202) 720–2127.

IV–29 AGRICULTURAL STATISTICS 2017
Table 4-59.—Potatoes: Production, seed used, and farm disposition, by seasonal groups, crop of 2016
Season and State Production Total used for seed
Used on farms where produced
Sold For seed, feed, and household
use
Shrinkage and loss
1,000 cwt 1,000 cwt 1,000 cwt 1,000 cwt 1,000 cwt
Spring California .................... 9,789 810 89 489 9,211 Florida 5,382 660 16 237 5,129
United States ............. 15,171 1,470 105 726 14,340
Summer Illinois ......................... 2,622 135 - 1 2,621 Kansas ....................... 1,260 142 - 13 1,247 Maryland .................... (D) (D) (D) (D) (D) Missouri ...................... 2,410 211 89 1 2,320 New Jersey ................ (D) (D) (D) (D) (D) North Carolina ............ 2,992 312 1 36 2,955 Texas ......................... 7,742 642 - - 7,742 Virginia ....................... 1,189 76 - 2 1,187 Other States 1 ............. 1,387 74 1 1 1,385
United States ............. 19,602 1,592 91 54 19,457
Fall California .................... 3,516 172 46 172 3,298 Colorado ..................... 22,236 1,430 871 1,660 19,705 Idaho .......................... 139,320 7,626 903 8,700 129,717 Maine ......................... 15,113 1,056 205 1,068 13,840 Michigan ..................... 17,020 1,397 280 748 15,992 Minnesota ................... 16,800 923 73 850 15,877 Montana ..................... 3,685 276 180 130 3,375 Nebraska .................... 7,380 600 248 642 6,490 New York ................... 3,552 400 72 280 3,200 North Dakota .............. 21,600 1,716 280 2,000 19,320 Oregon ....................... 22,951 1,026 332 1,410 21,209 Washington ................ 105,625 4,199 256 6,800 98,569 Wisconsin ................... 27,840 1,440 342 1,220 26,278
United States ............. 406,638 22,261 4,088 25,680 376,870
All potatoes United States ............. 441,411 25,323 4,284 26,460 410,667
- Represents zero. (D) Withheld to avoid disclosing data for individual operations. 1 Includes data withheld above. NASS, Crops Branch, (202) 720–2127.

IV–30 STATISTICS OF VEGETABLES AND MELONS
Table 4-60.—Potatoes, fresh & seed: United States exports by country of destination and imports by country of origin, 2011–2013
Country 2011 2012 2013
Metric tons Metric tons Metric tons
Imports Canada .................................... 491,495 352,959 390,719 Belgium-Luxembourg(*) .......... 0 0 23 Ecuador ................................... 0 0 3 Peru ......................................... 25 9 1 Dominican Republic ................ 5 0 0 Germany(*) .............................. 45 0 0 India ......................................... 0 1 0 Mexico ..................................... 19 0 0 Leeward-Windward Islands(*) 0 1 0
World Total .............................. 491,588 352,970 390,746
Exports Canada .................................... 284,785 240,858 270,969 Mexico ..................................... 73,570 79,948 82,954 Taiwan ..................................... 9,300 18,704 18,158 Japan ....................................... 9,138 14,665 17,312 Korea, South ........................... 16,654 18,661 16,291 Malaysia .................................. 12,596 17,181 16,105 Philippines ............................... 4,431 5,289 10,136 Indonesia ................................. 74 3,024 8,323 Singapore ................................ 6,136 5,875 6,086 Thailand ................................... 8,767 11,533 4,877 Dominican Republic ................ 2,107 5,105 4,676 Hong Kong .............................. 3,798 4,030 3,922 Nicaragua ................................ 1,139 1,541 2,856 Bahamas, The ......................... 1,207 1,883 2,467 Panama ................................... 820 984 1,621 Russia ..................................... 2,284 4,987 1,579 Guatemala ............................... 1,809 2,678 1,472 Vietnam ................................... 344 2,397 1,284 Brazil ....................................... 176 0 1,106 Costa Rica ............................... 2,695 830 1,069 Leeward-Windward Islands(*) 769 707 999 Trinidad and Tobago ............... 267 731 860 United Arab Emirates .............. 82 164 722 El Salvador .............................. 778 565 504 Cayman Islands ...................... 125 241 347 Poland ..................................... 0 0 270 Sri Lanka ................................. 197 150 256 Jamaica ................................... 105 46 174 Congo (Kinshasa) ................... 0 100 160 Belize ....................................... 168 153 135 Rest of World .......................... 4,726 4,437 1,122
World Total .............................. 449,047 447,468 478,809
(*) Denotes a country that is a summarization of its component countries. FAS, Office of Global Analysis, (202) 720-6301.
Table 4-61.—Potatoes (fresh market): Foreign trade, United States, 2007–2016 1
Year beginning July Imports for consumption Domestic exports
1,000 cwt. 1,000 cwt.
2007/2008 .......................................................................... 10,852 6,731 2008/2009 .......................................................................... 10,550 6,588 2009/2010 .......................................................................... 9,050 8,183 2010/2011 .......................................................................... 10,384 9,294 2011/2012 .......................................................................... 9,041 9,348 2012/2013 .......................................................................... 7,375 10,467 2013/2014 .......................................................................... 10,833 10,001 2014/2015 .......................................................................... 8,514 9,369 2015/2016 .......................................................................... 10,104 10,136 2016/2017 .......................................................................... 11,265 11,283
1 Includes seed. ERS, (202) 694–5253. Based on data from U.S. Department of Commerce, U.S. Census Bureau.

IV–31 AGRICULTURAL STATISTICS 2017
Table 4-62.—Pumpkins for fresh market and processing: Area, production, and value per hundredweight, by State and United States, 2014–2016
State Area harvested Production Value per unit
2014 2015 2016 2014 2015 2016 2014 2015 2016
1,000 1,000 1,000 Dollars Dollars Dollars Acres Acres Acres cwt cwt cwt per cwt per cwt per cwt
California ............. 5,800 6,100 5,000 1,798 1,464 1,350 16.10 17.80 11.30 Illinois ................... 19,800 14,700 17,400 7,458 3,179 6,767 6.32 3.79 7.74 Indiana ................. (NA) (NA) 4,900 (NA) (NA) 662 (NA) (NA) 14.40 Michigan .............. 6,100 5,000 5,100 970 770 791 11.80 15.70 12.40 Minnesota ............ (NA) (NA) 1,500 (NA) (NA) 167 (NA) (NA) 19.10 New Jersey .......... (NA) (NA) 2,000 (NA) (NA) 202 (NA) (NA) 27.00 New York ............. 5,200 4,400 2,800 690 489 322 29.70 22.60 19.40 North Carolina ..... (NA) (NA) 3,600 (NA) (NA) 936 (NA) (NA) 24.80 Ohio ..................... 6,300 5,500 6,200 1,053 842 930 17.80 17.10 17.90 Oregon ................. (NA) (NA) 2,100 (NA) (NA) 483 (NA) (NA) 10.70 Pennsylvania ....... 5,900 5,200 4,300 1,050 794 735 15.70 18.40 20.30 Tennessee ........... (NA) (NA) 1,800 (NA) (NA) 274 (NA) (NA) 22.00 Texas ................... (NA) (NA) 3,700 (NA) (NA) 1,480 (NA) (NA) 10.40 Virginia ................. (NA) (NA) 2,200 (NA) (NA) 372 (NA) (NA) 30.00 Washington .......... (NA) (NA) 2,200 (NA) (NA) 398 (NA) (NA) 25.80 Wisconsin ............ (NA) (NA) 1,800 (NA) (NA) 201 (NA) (NA) 18.90
United States ....... 49,100 40,900 66,600 13,019 7,538 16,070 11.00 12.00 13.00
(NA) Not available. NASS, Crops Branch, (202) 720–2127.
Table 4-63.—Pumpkins for fresh market and processing, commercial crop: Area, yield, production, value, hundredweight, and total value, United States, 2007–2016
Year Area harvested Yield per acre Production Value
Per cwt Total
Acres Cwt 1,000 cwt Dollars 1,000 dollars
2007 ..................... 45,900 250 11,458 10.80 123,519 2008 ..................... 43,400 246 10,663 12.90 137,072 2009 ..................... 44,100 211 9,313 11.00 102,730 2010 ..................... 48,500 222 10,748 11.00 117,791 2011 ..................... 46,900 228 10,705 10.60 113,085 2012 ..................... 50,500 238 12,036 12.10 146,033 2013 ..................... 50,300 223 11,221 13.20 148,517 2014 ..................... 49,100 265 13,019 11.00 143,158 2015 ..................... 40,900 184 7,538 12.00 90,214 2016 ..................... 66,600 241 16,070 13.00 207,659
Note: Beginning in 2016, Acreage and Yield estimates for fresh market and processing utilizations were discontinued. Only total acreage and total yield will be published beginning in 2016. Total Production and Utilized Production are esti-mated for each crop. Harvested Not Sold estimates were added to the estimating program. This is defined as the difference between Total Production and Total Utilized Production.
NASS, Crops Branch, (202) 720–2127.

IV–32 STATISTICS OF VEGETABLES AND MELONS
Table 4-64.—Spinach for fresh market: Area, production, and value per hundredweight, by State and United States, 2014–2016
State Area harvested Production Value per unit
2014 2015 2016 2014 2015 2016 2014 2015 2016
1,000 1,000 1,000 Dollars Dollars Dollars Acres Acres Acres cwt cwt cwt per cwt per cwt per cwt
Arizona ................ 8,000 10,300 (NA) 1,240 1,288 2,016 39.90 42.90 46.20 California ............. 26,000 26,700 (NA) 4,160 4,272 (D) 45.50 63.40 (D) New Jersey .......... 1,300 1,400 (NA) 221 210 197 37.70 49.30 47.90 Texas ................... 1,500 2,100 (NA) 225 263 275 44.00 21.00 26.50 Other States 1 ...... 740 690 (NA) 73 43 3,078 37.20 37.20 55.90
United States ....... 37,540 41,190 (NA) 5,919 6,076 5,566 43.90 56.50 50.60
Note: Beginning in 2016, Acreage and Yield estimates for fresh market and processing utilizations were discontinued. Only total acreage and total yield will be published beginning in 2016. Total Production and Utilized Production are esti-mated for each crop. Harvested Not Sold estimates were added to the estimating program. This is defined as the difference between Total Production and Total Utilized Production. For Table 4-64, 2016 includes only fresh market production and fresh market price.
(D) Withheld to avoid disclosing data for individual operations. (NA) Not available. 1 Other States include Colorado and Maryland.
NASS, Crops Branch, (202) 720–2127.
Table 4-65.—Spinach for fresh market, commercial crop: Area, yield, production, value per hundredweight, and total value, United States, 2010-2016
Year Area harvested Yield per acre Production Value 1
Per cwt Total
Acres Cwt 1,000 cwt Dollars 1,000 dollars
2010 ..................... 30,735 184 5,648 42.70 241,050 2011 ..................... 31,435 191 6,010 40.40 242,823 2012 ..................... 34,440 156 5,360 42.20 226,232 2013 ..................... 34,940 161 5,619 43.20 242,846 2014 ..................... 37,540 158 5,919 43.90 259,700 2015 ..................... 41,190 148 6,076 56.50 343,575 2016 ..................... (NA) (NA) 5,566 50.60 281,793
Note: Beginning in 2016, acreage and yield estimates for fresh market and processing utilizations were discontinued. Only total acreage and total yield will be published beginning in 2016. Total production and utilized production are estimated for each crop. Harvested not sold estimates were added to the estimating program. This is defined as the difference between total production and total utilized production. For Table 4-65, 2016 includes only fresh market production, fresh market price, and fresh market value.
(NA) Not available. 1 Price and value at point of first sale. NASS, Crops Branch, (202) 720–2127.
Table 4-66.—Spinach for processing, commercial crop: Area, yield, production, value per ton, and total value, United States, 2010-2016
Year Area harvested Yield per acre Production Value 1
Per ton Total
Acres Tons Tons Dollars 1,000 dollars
2010 ..................... 10,200 8.34 85,050 143.00 12,153 2011 ..................... 7,500 10.69 80,180 131.00 10,465 2012 ..................... 7,400 10.18 75,320 137.00 10,320 2013 ..................... 8,800 10.08 88,710 129.00 11,451 2014 ..................... 9,100 9.92 90,310 125.00 11,312 2015 ..................... 7,200 10.44 75,200 138.00 10,394 2016 ..................... (NA) (NA) 78,450 138.00 10,790
Note: Beginning in 2016, acreage and yield estimates for fresh market and processing utilizations were discontinued. Only total acreage and total yield will be published beginning in 2016. Total production and utilized production are estimated for each crop. Harvested not sold estimates were added to the estimating program. This is defined as the difference between total production and total utilized production. For Table 4-66, 2016 includes only processing production, processing price, and processing value.
(NA) Not available. 1 Price and value at processing plant door. NASS, Crops Branch, (202) 720–2127.

IV–33 AGRICULTURAL STATISTICS 2017
Table 4-67.—Sweet Potatoes: Area, yield, production, season average price per hundredweight received by farmers, and value, United States, 2007–2016
Year Area harvested Yield per acre Production Market year
average price 1 Value of
production
1,000 acres Cwt 1,000 cwt Dollars 1,000 dollars
2007 ..................... 97.4 186 18,070 18.30 330,060 2008 ..................... 97.3 190 18,443 21.20 390,572 2009 ..................... 96.9 201 19,469 21.80 423,677 2010 ..................... 116.9 204 23,845 19.80 472,218 2011 ..................... 129.7 208 26,964 18.80 505,938 2012 ..................... 126.6 209 26,482 17.40 461,861 2013 ..................... 113.2 219 24,785 24.10 597,217 2014 ..................... 135.2 219 29,584 23.90 706,916 2015 ..................... 153.1 203 31,016 21.80 675,583 2016 ..................... 163.3 193 31,546 20.70 705,690
1 Obtained by weighting State prices by production. NASS, Crops Branch, (202) 720–2127.
Table 4-68 .—Sweet Potatoes: Area, production, and season average price per hundredweight received by farmers, by State and United States, 2014–2016
State
Area harvested Production Market year average price per cwt
2014 2015 2016 2014 2015 2016 2014 2015 2016
1,000 1,000 1,000 1,000 1,000 1,000 acres acres acres cwt cwt cwt Dollars Dollars Dollars
Alabama ............... 2.0 2.5 (NA) 440 550 (NA) 24.10 21.40 (NA) Arkansas .............. 3.9 3.8 (D) 780 741 (D) (D) 27.20 (D) California .............. 19.0 18.5 20.0 5,225 6,290 6,200 30.10 23.70 23.10 Florida .................. 5.9 5.4 (D) 1,180 1,107 (D) (D) (D) (D) Louisiana ............. 8.8 9.0 9.5 2,024 1,980 1,520 17.40 21.60 21.30 Mississippi ........... 21.5 26.0 29.0 3,763 3,770 4,930 19.30 20.90 22.80 New Jersey .......... 1.2 1.2 (NA) 192 168 (NA) 36.90 31.50 (NA) North Carolina ..... 72.0 86.0 95.0 15,840 16,340 17,100 22.00 19.40 18.10 Texas ................... 0.9 0.7 (NA) 140 70 (NA) 27.60 (D) (NA) Other States ........ - - 9.8 - - 1,796 36.60 43.10 30.10
United States ....... 135.2 153.1 163.3 29,584 31,016 31,546 23.90 21.80 20.70
- Represents zero. (D) Withheld to avoid disclosing data for individual operations. (NA) Not available. NASS, Crops Branch, (202) 720–2127.

IV–34 STATISTICS OF VEGETABLES AND MELONS
Table 4-69.—Squash for fresh market and processing: Area, production, and value per hundredweight, by State and United States, 2014–2016
State Area harvested Production Value per unit
2014 2015 2016 2014 2015 2016 2014 2015 2016
1,000 1,000 1,000 Dollars Dollars Dollars Acres Acres Acres cwt cwt cwt per cwt per cwt per cwt
California ............. 5,400 5,400 6,400 918 864 1,280 32.90 34.50 28.10 Florida .................. 6,800 5,900 5,800 800 600 667 50.80 45.80 45.10 Georgia ................ 3,200 3,000 3,600 480 420 576 31.80 40.30 38.00 Michigan .............. 6,000 5,600 6,100 1,200 1,114 1,464 15.00 17.50 16.30 New Jersey .......... 2,700 2,800 3,400 354 252 388 32.80 37.80 32.70 New York ............. 4,300 4,200 3,100 691 594 527 45.40 42.00 35.00 North Carolina ..... 3,000 2,400 3,100 162 235 217 51.90 28.30 30.00 Ohio ..................... 1,600 1,800 (NA) 304 324 (NA) 34.00 40.00 (NA) Oregon ................. 3,000 3,500 2,900 780 1,230 841 9.80 8.00 8.60 South Carolina ..... 1,000 1,500 (NA) 150 165 (NA) 37.50 25.90 (NA) Tennessee ........... 830 590 (NA) 43 38 (NA) 30.30 53.00 (NA) Texas ................... 1,500 2,000 1,900 135 180 171 55.00 57.00 41.20
United States ....... 39,330 38,690 36,300 6,017 6,016 6,131 31.20 29.00 26.70
(NA) Not available. NASS, Crops Branch, (202) 720–2127.
Table 4-70.—Squash for fresh market and processing, commercial crop: Area, yield, production, value and total value, United States, 2010-2016
Year Area harvested Yield per acre Production Value
Per cwt Total
Acres Cwt 1,000 cwt Dollars 1,000 dollars
2010 ..................... 42,600 153 6,514 30.40 198,025 2011 ..................... 42,900 164 7,043 34.30 241,877 2012 ..................... 41,800 176 7,369 31.80 234,101 2013 ..................... 39,900 154 6,149 37.20 228,985 2014 ..................... 39,330 153 6,017 31.20 187,820 2015 ..................... 38,690 155 6,016 29.00 174,259 2016 ..................... 36,300 169 6,131 26.70 163,717
Note: Beginning in 2016, acreage and yield estimates for fresh market and processing utilizations were discontinued. Only total acreage and total yield will be published beginning in 2016. Total production and utilized production are estimated for each crop. Harvested not sold estimates were added to the estimating program. This is defined as the difference between total production and total utilized production.
NASS, Crops Branch, (202) 720–2127.
Table 4-71.—Taro: Area, production, price, and value, Hawaii, 2010–2016
Year Area harvested Production Price per pound Value of production
Acres 1,000 pounds Dollars 1,000 dollars
2010 ..................... 475 3,900 0.645 2,516 2011 ..................... 485 4,100 0.670 2,747 2012 ..................... 400 3,500 0.670 2,345 2013 ..................... 400 3,120 0.620 1,934 2014 ..................... 360 3,240 0.600 1,944 2015 ..................... 340 3,502 0.680 2,381 2016 ..................... (NA) (NA) (NA) (NA)
(NA) Not available. NASS, Crops Branch, (202) 720–2127.

IV–35 AGRICULTURAL STATISTICS 2017
Table 4-72.—Tomatoes: Foreign trade, United States, 2007–2016
Year beginning
July
Imports Domestic exports 2
Fresh Canned,
whole and piece 1
Catsup and sauces Paste Fresh
Canned, whole and
piece
Catsup and sauces Paste
1,000 cwt 1,000 cwt 1,000 cwt 1,000 cwt 1,000 cwt 1,000 cwt 1,000 cwt 1,000 cwt
2007/2008 23,905 239 4,097 288 3,641 1,256 4,493 4,721 2008/2009 25,014 336 3,924 179 3,720 1,421 4,971 6,338 2009/2010 32,093 405 3,684 124 3,133 1,128 5,423 5,011 2010/2011 30,904 270 3,839 113 2,794 1,303 5,845 6,426 2011/2012 33,744 265 3,533 111 2,531 1,531 6,064 6,764 2012/2013 33,717 358 3,451 87 2,533 1,312 6,302 9,032 2013/2014 34,880 385 3,526 103 2,345 1,673 7,247 11,035 2014/2015 33,488 306 3,425 129 2,459 1,296 8,748 9,937 2015/2016 37,910 360 3,852 216 1,939 1,219 9,120 8,193 2016/2017 38,018 322 3,953 206 1,959 1,446 9,161 8,152
1 Includes all canned tomato and tomato product imports except paste and juice, on a product-weight-basis. 2 Includes exports for military-civilian feeding abroad.
ERS, Market and Trade Economics Division, (202) 694–5326. Based on data from U.S. Department of Commerce, U.S. Census Bureau.
Table 4-73.—Tomatoes, commercial crop: Area, yield, production, value per hundredweight and per ton, and total value, United States, 2007–2016
Year
For fresh market
Area harvested Yield per acre Production Value 1
Per cwt Total
Acres Cwt 1,000 cwt Dollars 1,000 dollars
2007 ......... 108,100 311 33,627 34.80 1,168,693 2008 ......... 103,650 297 30,751 45.30 1,394,067 2009 ......... 107,600 305 32,781 40.40 1,324,830 2010 ......... 103,300 272 28,127 48.20 1,354,676 2011 ......... 100,010 301 30,105 36.10 1,087,373 2012 ......... 101,000 284 28,660 30.50 874,195 2013 ......... 99,600 265 26,391 44.60 1,177,592 2014 ......... 97,600 280 27,280 41.50 1,133,070 2015 ......... 92,200 286 26,375 46.30 1,221,270 2016 ......... (NA) (NA) 23,668 40.70 963,028
Year
For processing
Area harvested Yield per acre Production Value 2
Per ton Total
Acres Cwt 1,000 cwt Dollars 1,000 dollars
2007 ......... 313,600 40.37 12,659,890 71.20 901,761 2008 ......... 296,500 41.50 12,305,820 79.80 982,373 2009 ......... 327,800 42.62 13,970,560 87.20 1,218,912 2010 ......... 288,900 44.22 12,776,280 72.50 926,692 2011 ......... 267,800 46.29 12,396,150 75.60 936,861 2012 ......... 276,300 47.70 13,178,750 76.70 1,010,545 2013 ......... 277,000 45.60 12,631,500 90.10 1,138,462 2014 ......... 306,100 47.82 14,637,300 99.30 1,452,823 2015 ......... 310,600 47.50 14,754,350 93.70 1,381,956 2016 ......... (NA) (NA) 13,189,801 82.80 1,092,749
Note: Beginning in 2016, acreage and yield estimates for fresh market and processing utilizations were discontinued. Only total acreage and total yield will be published beginning in 2016. Total production and utilized production are estimated for each crop. Harvested not sold estimates were added to the estimating program. This is defined as the difference between total production and total utilized production. For Table 4-73, 2016 includes only fresh market production, fresh market price, fresh market value, processing production, processing price, and processing value.
(NA) Not available. 1 Price and value at point of first sale. 2 Price and value at processing plant door. NASS, Crops Branch, (202) 720–2127.

IV–36 STATISTICS OF VEGETABLES AND MELONS
Table 4-74.—Tomatoes, commercial crop: Area, production, and value per hundredweight and per ton, by State and United States, 2014–2016 1
Utilization and State
Area harvested Production Value per unit
2014 2015 2016 2014 2015 2016 2014 2015 2016
1,000 1,000 1,000 Dollars Dollars Dollars Fresh market: Acres Acres Acres cwt cwt cwt per cwt per cwt per cwt
Alabama ........... 1,200 1,100 (NA) 420 385 (NA) 28.30 51.50 (NA) Arkansas .......... 900 800 (NA) 153 152 (NA) 62.00 59.00 (NA) California .......... 32,300 28,300 (NA) 10,175 8,773 10,626 34.80 35.00 28.00 Florida .............. 33,000 32,200 (NA) 9,240 9,499 7,280 47.30 47.70 52.50 Georgia ............ 2,300 2,700 (NA) 575 918 (NA) 30.40 39.40 (NA) Indiana ............. 820 700 (NA) 152 50 85 48.80 55.00 55.50 Michigan ........... 1,900 2,600 (NA) 466 780 744 35.70 53.60 47.00 New Jersey ...... 2,900 2,900 (NA) 624 653 (D) 61.00 81.10 (D) New York ......... 2,600 2,300 (NA) 312 299 (NA) 76.80 105.00 (NA) North Carolina .. 3,400 3,300 (NA) 850 1,023 961 42.00 46.00 54.00 Ohio .................. 3,600 3,500 (NA) 954 886 867 36.60 54.40 55.00 Pennsylvania .... 2,500 2,200 (NA) 415 389 (NA) 65.40 85.40 (NA) South Carolina 3,200 3,200 (NA) 896 864 840 32.40 50.50 35.00 Tennessee ....... 3,900 3,400 (NA) 1,326 1,003 (D) 43.00 56.00 (D) Texas . ............. 780 900 (NA) 78 81 (NA) 57.30 60.00 (NA) Virginia ............. 2,300 2,100 (NA) 644 620 504 44.60 55.00 46.00 Other States ..... (X) (NA) (NA) (X) (NA) 1,761 (X) (NA) 51.09
United States ... 97,600 92,200 (NA) 27,280 26,375 23,668 41.50 46.30 40.70
Dollars Dollars Dollars Processing: Acres Acres Acres Tons Tons Tons per ton per ton per ton
California .......... 289,000 296,000 (NA) 14,010,000 14,361,000 12,647,000 98.60 93.00 81.60 Indiana ............. 9,300 6,700 (NA) 344,100 191,620 241,200 114.00 120.00 113.00 Michigan ........... 3,400 3,200 (NA) 129,200 95,040 120,100 117.00 117.00 112.00 New Jersey ...... 289,000 296,000 (NA) 14,010,000 (NA) (D) (NA) (D) (D) Ohio .................. 4,400 4,700 (NA) 154,000 106,690 170,600 111.00 115.00 107.00 Tennessee ....... 289,000 296,000 (NA) 14,010,000 (NA) (D) (NA) (NA) (D) Other States ..... 289,000 296,000 (NA) 14,010,000 (NA) 10,901 (NA) (NA) 165.00
United States ... 306,100 310,600 (NA) 14,637,300 14,754,350 13,189,801 99.30 93.70 82.80
Note: Beginning in 2016, acreage and yield estimates for fresh market and processing utilizations were discontinued. Only total acreage and total yield will be published beginning in 2016. Total production and utilized production are estimated for each crop. Harvested not sold estimates were added to the estimating program. This is defined as the difference between total production and total utilized production. For Table 4-74, 2016 includes only fresh market production, fresh market price, processing production, and processing price.
(D) Withheld to avoid disclosing data for individual operations. (NA) Not available. (X) Not applicable. 1 Cherry, grape, tomatillo, and greenhouse tomatoes are excluded.
NASS, Crops Branch, (202) 720–2127.

IV–37 AGRICULTURAL STATISTICS 2017
Table 4-75.—Watermelon for fresh market: Area, production, and value per hundredweight, by State and United States, 2014–2016
State Area harvested Production Value per unit
2014 2015 2016 2014 2015 2016 2014 2015 2016
1,000 1,000 1,000 Dollars Dollars Dollars Acres Acres Acres cwt cwt cwt per cwt per cwt per cwt
Alabama .............. 2,700 2,800 (NA) 456 420 (NA) 14.20 14.50 (NA) Arizona ................ 2,900 3,600 (NA) 1,334 1,584 2,448 19.40 16.80 14.40 Arkansas .............. 1,600 1,500 (NA) 320 338 (NA) 13.00 14.80 (NA) California ............. 11,200 11,100 (NA) 6,384 5,512 6,750 14.60 14.50 18.20 Delaware ............. 2,500 2,300 (NA) 833 761 838 13.00 13.00 14.00 Florida .................. 19,700 21,000 (NA) 4,827 5,880 7,659 16.60 15.00 16.10 Georgia ................ 19,000 19,000 (NA) 5,130 5,510 6,076 15.60 14.80 15.10 Indiana ................. 7,600 6,900 (NA) 2,964 2,415 3,010 9.00 13.00 11.00 Maryland .............. 3,300 3,200 (NA) 1,089 1,040 1,070 12.00 13.00 13.00 Mississippi ........... 2,100 1,800 (NA) 378 315 (NA) 11.70 12.00 (NA) Missouri ............... 2,700 2,600 (NA) 837 572 (D) 9.40 8.70 (D) North Carolina ..... 5,500 5,800 (NA) 1,155 1,798 (D) 12.00 18.00 (D) Oklahoma ............ 2,600 4,000 (NA) 364 540 (NA) 11.80 13.50 (NA) South Carolina ..... 7,300 7,200 (NA) 1,862 2,736 2,592 14.80 13.50 15.80 Texas ................... 20,000 23,000 (NA) 5,200 5,520 7,250 9.60 9.40 10.00 Virginia ................. 650 650 (NA) 130 163 (NA) 15.00 22.00 (NA) Other States ........ (NA) (NA) (NA) (NA) (NA) 2,432 (NA) (NA) 13.70
United States ....... 111,350 116,450 (NA) 33,263 35,475 40,125 13.50 13.80 14.40
Note: Beginning in 2016, acreage and yield estimates for fresh market and processing utilizations were discontinued. Only total acreage and total yield will be published beginning in 2016. Total production and utilized production are estimated for each crop. Harvested not sold estimates were added to the estimating program. This is defined as the difference between total production and total utilized production. For Table 4-75, 2016 will include only fresh market production and fresh market price.
(D) Withheld to avoid disclosing data for individual operations. (NA) Not available. NASS, Crops Branch, (202) 720–2127.
Table 4-76.—Watermelon for fresh market, commercial crop: Area, yield, production, value per hundredweight, and total value, United States, 2010-2016
Year Area harvested Yield per acre Production Value 1
Per cwt Total
Acres Cwt 1,000 cwt Dollars 1,000 dollars
2010 ..................... 134,090 311 41,701 12.00 499,341 2011 ..................... 117,570 307 36,127 13.90 502,560 2012 ..................... 115,800 312 36,153 13.20 476,768 2013 ..................... 113,630 318 36,102 14.20 513,987 2014 ..................... 111,350 293 33,263 13.50 450,324 2015 ..................... 116,450 294 35,475 13.80 488,383 2016 ..................... (NA) (NA) 40,125 14.40 578,800
Note: Beginning in 2016, Acreage and Yield estimates for fresh market and processing utilizations were discontinued. Only total acreage and total yield will be published beginning in 2016. Total Production and Utilized Production are esti-mated for each crop. Harvested Not Sold estimates were added to the estimating program. This is defined as the difference between Total Production and Total Utilized Production. For Table 4.76, 2016 will include only fresh market production, fresh market price, and fresh market value.
(NA) Not available. 1 Price and value at point of first sale. NASS, Crops Branch, (202) 720–2127.

IV–38 STATISTICS OF VEGETABLES AND MELONS
Table 4-77.—Vegetables and melons, fresh: Total reported domestic rail, truck, and air shipments, 2016
Commodity Jan. Feb. Mar. Apr. May June July Aug. Sep. Oct. Nov. Dec. Total
Vegetables 1,000 cwt
Artichokes ..................... 30 51 76 89 43 61 62 60 67 50 53 51 693 Asparagus .................... ............ 3 60 159 160 84 ............ ............ ............ ............ ............ ............ 466 Beans ........................... 202 140 273 410 243 133 51 55 43 119 244 253 2,166 Beans-organic .............. ............ 1 ............ 2 3 ............ ............ ............ ............ 1 2 ............ 9 Beets ............................ ............ ............ ............ 4 6 3 5 4 5 6 4 ............ 37 Beets-organic ............... ............ ............ ............ ............ 2 1 2 3 4 4 3 ............ 19 Broccoli ......................... 472 503 680 660 469 549 429 474 457 447 544 574 6,258 Broccoli-organic ............ ............ ............ ............ 18 53 39 41 42 47 44 52 22 358 Brussels sprouts ........... 28 28 8 1 2 32 61 78 99 138 167 117 759 Cabbage ....................... 914 975 1,161 597 539 287 206 436 479 502 623 1,037 7,756 Cabbage-organic .......... ............ ............ ............ ............ 1 1 1 6 7 7 4 ............ 27 Carrots .......................... 614 580 620 631 599 582 532 599 549 567 581 645 7,099 Carrots-organic ............. ............ ............ 63 76 62 39 46 50 48 49 54 60 547 Cauliflower .................... 441 407 513 420 294 392 313 372 368 370 425 366 4,681 Cauliflower-organic ....... ............ ............ ............ 20 28 24 32 27 37 41 41 15 265 Celery ........................... 1,247 1,386 1,490 1,320 1,309 1,153 1,010 1,037 1,075 1,149 1,611 1,451 15,238 Celery-organic .............. ............ ............ ............ 1 14 71 78 97 102 110 90 19 582 Corn, sweet .................. 224 189 575 1,497 2,960 3,214 850 464 183 395 277 278 11,106 Cucumbers ................... 24 ............ 82 396 578 608 481 527 346 572 401 246 4,261 Cucumbers-organic ...... ............ ............ ............ 2 1 ............ ............ ............ 1 2 2 1 9 Eggplant ....................... 32 31 23 65 129 183 43 27 45 151 114 63 906 Eggplant-organic .......... ............ ............ ............ ............ 3 ............ ............ ............ ............ 1 2 1 7 Endive ........................... 20 19 24 13 6 4 2 2 3 3 9 8 113 Escarole ........................ 28 23 29 20 7 4 3 3 4 4 13 13 151 Greens .......................... 338 209 310 249 228 249 114 91 102 179 338 352 2,759 Greens-organic ............. 7 12 10 3 13 31 16 11 11 13 13 19 159 Lettuce, iceberg ............ 2,027 2,020 2,727 2,246 2,027 2,289 2,108 2,310 2,246 2,144 2,081 2,226 26,451 Lettuce, iceberg-organic ............ ............ ............ 4 16 16 16 20 23 23 18 ............ 136 Lettuce, other ............... 376 369 407 272 206 197 199 202 207 214 282 410 3,341 Lettuce, other-organic .. ............ ............ ............ 2 10 8 7 4 6 7 6 7 57 Lettuce, romaine ........... 1,889 1,924 2,341 1,814 1,517 1,523 1,365 1,650 1,578 1,543 1,881 2,294 21,319 Lettuce, romaine
-organic ..................... 5 9 13 37 84 80 71 105 112 90 87 100 793 Lettuce processed ........ 901 693 1,020 1,091 1,011 900 964 976 974 1,115 1,523 780 11,948 Lettuce processed-or-
ganic ......................... ............ ............ ............ ............ ............ ............ ............ ............ ............ ............ 5 ............ 5 Onions, dry ................... 3,996 3,175 3,062 3,712 3,928 3,595 3,683 3,814 3,676 3,964 3,826 4,130 44,561 Onions, dry-organic ...... 2 1 ............ 1 14 4 2 2 1 1 1 1 30 Onions processed ........ 627 585 550 692 426 579 497 273 454 600 541 629 6,453 Onions, green ............... 9 13 10 10 18 26 25 22 21 29 23 18 224 Onions, green-organic .. ............ ............ ............ ............ ............ ............ ............ ............ 1 1 2 2 6 Parsley .......................... 21 20 31 41 40 30 27 28 28 28 32 26 352 Parsley-organic ............. ............ ............ ............ ............ 4 5 2 2 1 1 1 2 18 Peas, green .................. ............ ............ ............ ............ 1 1 2 3 3 3 1 ............ 14 Peppers, bell ................ 355 281 394 741 1,032 995 731 636 652 871 924 533 8,145 Peppers, bell-organic ... 1 ............ ............ 1 2 6 1 2 2 3 9 3 30 Peppers, other .............. 11 8 11 10 37 39 37 12 3 44 53 30 295 Potatoes, table ............. 8,027 7,201 7,911 7,310 8,023 7,721 7,616 7,885 8,214 7,843 8,770 8,397 94,918 Potatoes, table-organic 115 107 112 71 59 28 8 57 107 131 161 163 1,119 Potatoes, chipper ......... 5,124 3,870 4,051 5,090 4,292 4,548 5,350 4,445 4,665 5,386 3,911 5,265 55,997 Potatoes, seed ............. 562 780 3,675 6,786 2,841 75 1 ............ 1 85 92 196 15,094 Radishes ....................... 38 25 47 53 31 18 16 18 17 19 33 30 345 Spinach ......................... 268 269 302 91 67 59 59 64 61 60 159 227 1,686 Spinach-organic ............ 3 8 5 1 ............ 5 2 2 2 12 25 41 106 Squash ......................... 46 75 100 214 292 203 166 129 83 174 136 140 1,758 Squash-organic ............ ............ ............ ............ 4 2 ............ ............ ............ ............ 2 5 9 22 Sweet potatoes ............. 843 806 1,021 880 795 810 633 643 597 773 1,284 806 9,891 Sweet potatoes-organic 6 9 7 10 3 2 1 1 3 9 8 6 65 Tomatoes ...................... 787 606 743 1,032 1,700 1,520 1,102 1,061 962 1,141 1,230 1,553 13,437 Tomatoes, greenhouse 101 86 99 167 169 168 190 130 108 132 105 123 1,578 Toms, Grape Type ....... 106 101 156 194 189 95 53 57 52 87 148 129 1,367 Toms, Grape Type-
greenhouse ............... 10 8 9 13 13 22 20 12 10 13 13 16 159 Toms, Grape Type-
organic 6 3 3 6 16 5 1 ............ 1 2 10 12 65 Toms, Cherry ................ 38 37 55 56 49 20 12 13 11 16 52 53 412 Toms, Cherry-
greenhouse ............... 6 4 4 4 6 3 4 3 3 3 3 2 45 Toms, Plum Type ......... 192 132 153 218 244 163 219 280 262 190 255 243 2,551 Toms, Plum Type-
greenhouse ............... 3 3 3 5 4 8 9 7 6 6 7 6 67
Total .............................. 31,122 27,785 35,019 39,532 36,921 33,510 29,577 29,333 29,235 31,689 33,370 34,199 391,292
See footnote(s) at end of table.

IV–39 AGRICULTURAL STATISTICS 2017
Table 4-77.—Vegetables and melons, fresh: Total reported domestic rail, truck, and air shipments, 2016–Continued
Commodity Jan. Feb. Mar. Apr. May June July Aug. Sep. Oct. Nov. Dec. Total
Melons: 1,000 cwt
Cantaloupe ................... ............ ............ ............ 4 1,998 3,233 2,984 2,970 2,125 1,072 247 ............ 14,633 Cantaloupe-organic ...... ............ ............ ............ ............ 76 64 26 68 54 12 ............ ............ 300 Honeydews ................... ............ ............ ............ 1 128 381 714 808 790 319 81 ............ 3,222 Honeydews-organic ...... ............ ............ ............ ............ 6 13 10 17 7 ............ ............ ............ 53 Mixed & misc. melons .. ............ ............ ............ ............ 125 188 125 84 14 45 16 ............ 597 Mixed & misc. melons-
organic ...................... ............ ............ ............ ............ 1 8 8 5 2 ............ ............ ............ 24 Watermelons, seedless ............ ............ ............ 540 5,518 9,525 8,772 8,330 2,476 175 ............ ............ 35,336 Watermelons, seedless-
organic ...................... ............ ............ ............ ............ ............ 13 25 6 4 ............ ............ ............ 48 Watermelons, seeded .. ............ ............ ............ 64 657 843 712 482 90 1 ............ ............ 2,849 Watermelons, seeded-
organic ...................... ............ ............ ............ ............ ............ 1 3 ............ ............ ............ ............ ............ 4
Total .............................. ............ ............ ............ 609 8,509 14,269 13,379 12,770 5,562 1,624 344 ............ 57,066
AMS, Fresh Fruit and Vegetable Specialty Crops, Market News Division, (202) 205–9690.
Table 4-78.—Vegetables, fresh: Per capita civilian utilization (farm-weight basis), United States, 2007–2016 1
Year Cabbage Cucumbers Tomatoes 2 Asparagus Broccoli Carrots
Pounds Pounds Pounds Pounds Pounds Pounds
2007 ............ 8.0 6.4 19.2 1.2 5.6 8.0 2008 ............ 8.1 6.4 18.5 1.2 6.0 8.1 2009 ............ 7.3 6.8 19.6 1.3 6.2 7.4 2010 ............ 7.5 6.7 20.6 1.4 5.6 7.8 2011 ............ 6.6 6.4 21.0 1.4 5.9 7.5 2012 ............ 6.3 7.1 20.8 1.4 6.3 7.9 2013 ............ 6.9 7.3 20.2 1.4 6.9 8.0 2014 ............ 6.7 7.4 20.5 1.6 6.6 8.5 2015 ............ 6.3 7.5 20.5 1.5 7.4 8.8 2016 ............ 5.8 8.0 21.3 1.5 7.6 7.8
Year Head lettuce
Leaf/ romaine Snap beans Garlic Cauliflower Celery
Pounds Pounds Pounds Pounds Pounds Pounds
2007 ............ 18.4 11.5 2.2 2.7 1.7 6.3 2008 ............ 16.8 10.4 2.0 2.8 1.6 6.2 2009 ............ 16.1 10.0 1.7 2.4 1.7 6.2 2010 ............ 15.9 12.0 1.9 2.3 1.3 6.1 2011 ............ 15.8 11.7 1.7 2.3 1.2 6.0 2012 ............ 15.9 11.9 1.6 2.3 1.2 6.0 2013 ............ 14.1 11.4 1.6 2.3 1.3 5.5 2014 ............ 14.5 10.8 1.5 2.2 1.3 5.5 2015 ............ 13.5 11.0 1.6 2.4 1.7 5.4 2016 ............ 14.9 12.3 1.7 2.6 1.5 5.0
Year Sweet Corn Onions Spinach Bell peppers Others 3 Total
vegetables 4
Pounds Pounds Pounds Pounds Pounds Pounds
2007 ............ 9.2 21.6 1.6 9.4 15.01 148.1 2008 ............ 9.1 20.2 1.7 9.5 14.51 143.1 2009 ............ 9.2 19.6 2.0 9.8 13.98 141.3 2010 ............ 9.2 19.6 1.7 10.3 14.40 144.3 2011 ............ 8.2 19.1 1.8 10.6 14.78 141.9 2012 ............ 8.7 19.5 1.6 10.7 15.50 144.7 2013 ............ 8.9 18.5 1.6 10.0 15.00 140.9 2014 ............ 7.6 18.3 1.7 10.7 16.66 142.1 2015 ............ 8.6 18.9 1.7 11.1 13.79 141.8 2016 ............ 7.3 18.7 1.5 11.4 16.21 145.1
1 Fresh vegetable consumption computed for total commercial production for fresh market. Does not include production for home use. Consumption obtained by dividing the total apparent consumption by total July 1 population as reported by the Bureau of the Census. All data for calendar year. 2 After 1996, includes an ERS estimate of domestically produced hothouse tomatoes. Hothouse imports included in all years. 3 Includes artichokes, eggplant, radishes, brussels sprouts, squash, green limas, and escarole/endive. Beginning in 2000, also includes collards, mustard greens, turnip greens, kale, okra, and pumpkins. 4 Excludes melons, mushrooms, potatoes, and sweet potatoes.
ERS, Market and Trade Economics Division, (202) 694–5326.

IV–40 STATISTICS OF VEGETABLES AND MELONS
Table 4-79.—Vegetables, canning: Per capita utilization (farm weight), United States, 2007–2016
Year Cabbage for kraut Asparagus Snap beans Carrots Green peas
Pounds Pounds Pounds Pounds Pounds
2007 ............... 1.0 0.1 3.5 0.9 1.2 2008 ............... 0.9 0.2 3.3 1.0 1.1 2009 ............... 0.9 0.2 3.6 0.9 1.3 2010 ............... 1.0 0.1 3.7 0.7 1.1 2011 ............... 1.0 0.1 3.2 0.8 0.8 2012 ............... 1.2 0.1 2.9 0.8 0.8 2013 ............... 1.1 0.1 2.9 0.8 0.9 2014 ............... 1.1 0.1 2.8 0.7 0.7 2015 ............... 1.2 0.1 2.9 0.7 0.8 2016 ............... 1.3 0.1 3.2 0.9 0.8
Year Tomatoes Sweet corn Pickles Other 1 Total 2
Pounds Pounds Pounds Pounds Pounds
2007 ............... 68.7 6.8 3.7 8.4 94.5 2008 ............... 67.1 6.7 3.5 8.8 92.8 2009 ............... 70.3 7.6 5.1 8.9 98.7 2010 ............... 70.8 6.9 3.7 9.1 97.1 2011 ............... 65.7 5.8 2.8 9.2 89.4 2012 ............... 66.5 5.9 3.0 9.9 91.0 2013 ............... 65.9 5.8 3.2 9.6 90.2 2014 ............... 67.2 5.8 3.9 9.7 92.0 2015 ............... 56.3 5.3 3.4 10.0 80.8 2016 ............... 61.2 5.1 3.2 10.7 86.6
1 Includes beets, chile peppers (all uses), green lima beans and spinach. 2 Total excludes mushrooms and potatoes. May not add due to rounding.
ERS, Market and Trade Economics Division, (202) 694–5326.

IV–41 AGRICULTURAL STATISTICS 2017
Table 4-80.—Vegetables, freezing: Per capita utilization (farm weight basis), United States, 2007–2016
Year Asparagus Snap beans Carrots Peas Broccoli
Pounds Pounds Pounds Pounds Pounds
2007 ............ 0 .1 2 .1 1 .5 1 .8 2 .7 2008 ............ 0 .1 2 .1 1 .5 1 .8 2 .7 2009 ............ 0 .1 1 .9 1 .5 1 .7 2 .5 2010 ............ 0 .1 2 .0 1 .5 1 .5 2 .5 2011 ............ 0 .1 1 .5 1 .6 1 .6 2 .7 2012 ............ 0 .1 1 .9 1 .2 1 .9 2 .6 2013 ............ 0 .1 2 .1 1 .7 1 .5 2 .5 2014 ............ 0 .1 1 .8 1 .2 1 .6 2 .6 2015 ............ 0 .1 1 .9 1 .4 1 .5 2 .6 2016 ............ 0 .2 2 .0 1 .6 1 .1 2 .5
Year Cauliflower Sweet Corn Other 1 Total vegetables excluding potatoes
Pounds Pounds Pounds Pounds
2007 ............ 0.4 10.0 4.1 22.6 2008 ............ 0.4 9.2 4.0 21.9 2009 ............ 0.4 9.1 4.3 21.4 2010 ............ 0.4 8.5 4.5 20.9 2011 ............ 0.4 9.8 4.3 21.9 2012 ............ 0.3 9.8 4.5 22.3 2013 ............ 0.3 7.0 4.3 19.5 2014 ............ 0.4 7.7 4.6 19.8 2015 ............ 0.3 8.0 4.7 20.4 2016 ............ 0.4 7.6 4.7 20.0
1 Includes green lima beans, spinach, and miscellaneous freezing vegetables. 2 Totals may not add due to rounding. ERS, Market and Trade Economics Division, (202) 694–5326.
Table 4-81.—Commercially produced vegetables: Per capita utilization, United States, 2007–2016
Year
Farm weight equivalent
Total fresh and
processed Fresh 2
Processed
Total Canning Freezing Potatoes Others 1
Pounds Pounds Pounds Pounds Pounds Pounds Pounds
2007 ......... 399.5 148.1 251.5 94.5 22.6 124.3 10.1 2008 ......... 386.5 143.1 243.4 92.7 21.9 118.3 10.5 2009 ......... 385.5 141.3 244.2 98.7 21.4 113.3 10.8 2010 ......... 387.4 144.3 243.1 97.1 20.9 113.8 11.2 2011 ......... 375.8 141.9 233.9 89.4 21.9 110.3 12.2 2012 ......... 384.8 144.7 240.1 91.0 22.3 114.7 12.2 2013 ......... 374.7 140.6 234.1 90.2 19.5 113.3 11.0 2014 ......... 379.3 141.7 237.5 92.0 19.8 112.8 12.9 2015 ......... 369.3 139.7 229.6 80.8 20.4 115.4 13.0 2016 ......... 371.1 140.7 230.4 86.6 20.0 111.2 12.7
Year
Percentage of annual total
Fresh 2 Processed
Total Canning Freezing Potatoes Others 1
Percent Percent Percent Percent Percent Percent
2007 ......... 37.1 62.9 23.6 5.7 31.1 2.5 2008 ......... 37.0 63.0 24.0 5.7 30.6 2.7 2009 ......... 36.7 63.3 25.6 5.5 29.4 2.8 2010 ......... 37.3 62.7 25.1 5.4 29.4 2.9 2011 ......... 37.8 62.2 23.8 5.8 29.3 3.3 2012 ......... 37.6 62.4 23.6 5.8 29.8 3.2 2013 ......... 37.5 62.5 24.1 5.2 30.2 2.9 2014 ......... 37.4 62.6 24.3 5.2 29.7 3.4 2015 ......... 37.8 62.2 21.9 5.5 31.2 3.5 2016 ......... 37.9 62.1 23.3 5.4 30.0 3.4
1 Others include mushrooms, sweet potatoes, and onions for dehydrating market. 2 See table 4-78 for items included under Fresh category. Excludes melons.
ERS, Market and Trade Economics Division, (202) 694–5326.

IV–42 STATISTICS OF VEGETABLES AND MELONS
Table 4-82.—Frozen Vegetables and potato products: Cold storage holdings, end of month, United States, 2015 and 2016
Month Asparagus Lima beans Green beans,
regular cut Green beans, french style
2015 2016 2015 2016 2015 2016 2015 2016
1,000 1,000 1,000 1,000 1,000 1,000 1,000 1,000 pounds pounds pounds pounds pounds pounds pounds pounds
January .......... 12,620 12,144 58,804 53,533 161,510 180,082 13,214 14,378 February ........ 11,115 11,225 53,249 50,432 153,916 158,534 10,323 14,121 March ............. 10,608 10,877 51,849 47,576 135,211 142,228 10,177 13,331 April ................ 10,084 10,290 47,874 46,603 123,221 136,727 8,250 12,092 May ................ 13,037 12,246 42,782 42,577 119,151 131,014 7,246 10,477 June ............... 14,457 14,490 41,133 40,193 113,449 122,127 8,025 9,912 July ................ 14,209 13,429 37,376 37,743 155,410 169,238 12,653 13,009 August ............ 14,270 12,697 44,819 45,577 226,850 242,529 12,695 18,951 September ..... 13,283 12,328 62,195 61,184 255,661 265,200 19,787 20,521 October .......... 12,579 12,089 66,999 66,795 243,986 263,320 19,142 18,876 November ...... 12,883 12,133 59,313 59,516 225,001 233,980 16,305 16,312 December ...... 11,926 11,395 57,841 55,895 199,994 209,496 15,279 14,482
Month
Broccoli, spears
Broccoli, chopped & cut Brussels sprouts Carrots, diced
2015 2016 2015 2016 2015 2016 2015 2016
1,000 1,000 1,000 1,000 1,000 1,000 1,000 1,000 pounds pounds pounds pounds pounds pounds pounds pounds
January .......... 25,796 24,480 34,751 38,275 15,090 18,028 155,485 159,472 February ........ 27,826 26,498 38,107 35,525 14,120 16,367 144,853 148,175 March ............. 29,124 26,783 37,416 34,633 13,448 14,363 134,587 142,072 April ................ 29,731 33,170 39,532 35,389 13,170 13,801 121,669 129,994 May ................ 29,475 29,783 39,932 34,273 13,658 13,785 115,221 116,769 June ............... 27,821 27,727 42,211 37,574 14,691 13,061 99,334 99,573 July ................ 26,272 28,986 41,556 40,191 13,401 13,569 87,345 95,109 August ............ 27,564 27,355 50,159 44,837 12,241 12,265 84,143 83,701 September ..... 28,387 25,951 50,323 41,996 12,352 11,564 83,391 85,034 October .......... 26,873 25,119 44,935 41,969 14,338 15,110 148,160 125,903 November ...... 27,317 24,068 41,373 41,462 16,636 18,241 172,525 173,404 December ...... 25,023 21,870 39,398 42,915 19,843 22,021 161,755 161,641
Month Carrots, other Cauliflower Corn, cut Corn, cob
2015 2016 2015 2016 2015 2016 2015 2016
1,000 1,000 1,000 1,000 1,000 1,000 1,000 1,000 pounds pounds pounds pounds pounds pounds pounds pounds
January .......... 155,156 163,079 20,172 25,971 464,026 488,940 206,000 216,834 February ........ 138,003 154,349 18,289 24,669 431,593 479,571 175,910 198,513 March ............. 120,999 144,494 17,903 23,833 395,330 412,766 156,425 164,351 April ................ 117,545 141,373 17,761 23,236 348,564 381,312 132,387 135,956 May ................ 102,967 132,722 17,424 23,443 313,388 339,900 110,912 112,977 June ............... 88,645 119,896 18,203 22,634 262,028 289,897 88,817 91,597 July ................ 83,838 109,006 16,963 21,690 287,729 301,633 112,873 97,354 August ............ 79,673 113,894 15,146 18,853 446,215 464,716 165,657 177,551 September ..... 106,742 117,326 14,226 19,651 621,237 587,865 239,922 223,337 October .......... 157,115 163,522 24,622 26,266 640,668 600,062 244,687 250,261 November ...... 173,385 197,013 24,833 26,986 582,672 552,697 229,113 227,305 December ...... 166,317 191,102 26,448 27,325 520,804 522,396 220,295 207,064
Month Mixed vegetables Okra Onion rings Onions, other
2015 2016 2015 2016 2015 2016 2015 2016
1,000 1,000 1,000 1,000 1,000 1,000 1,000 1,000 pounds pounds pounds pounds pounds pounds pounds pounds
January .......... 55,851 56,725 34,631 46,590 9,276 11,945 34,589 34,588 February ........ 56,039 55,364 29,153 38,266 8,980 13,311 39,075 34,825 March ............. 57,851 57,650 23,998 27,614 9,862 14,630 39,098 36,320 April ................ 59,040 59,996 19,361 18,995 11,918 17,022 40,784 41,071 May ................ 58,132 61,403 16,410 15,574 11,810 16,323 44,569 41,226 June ............... 58,099 60,593 16,337 27,167 13,135 16,005 43,538 41,801 July ................ 56,960 66,007 31,938 40,280 11,734 14,024 41,733 40,564 August ............ 60,109 65,596 48,184 46,536 11,923 14,144 41,505 47,847 September ..... 62,186 65,498 66,862 51,893 11,242 13,977 36,864 44,597 October .......... 58,359 62,944 70,851 45,379 12,145 15,179 36,790 43,979 November ...... 55,274 61,384 63,695 38,372 11,784 13,542 35,137 46,329 December ...... 55,067 62,424 56,080 33,964 12,004 13,769 33,020 48,337
See footnote(s) at end of table.
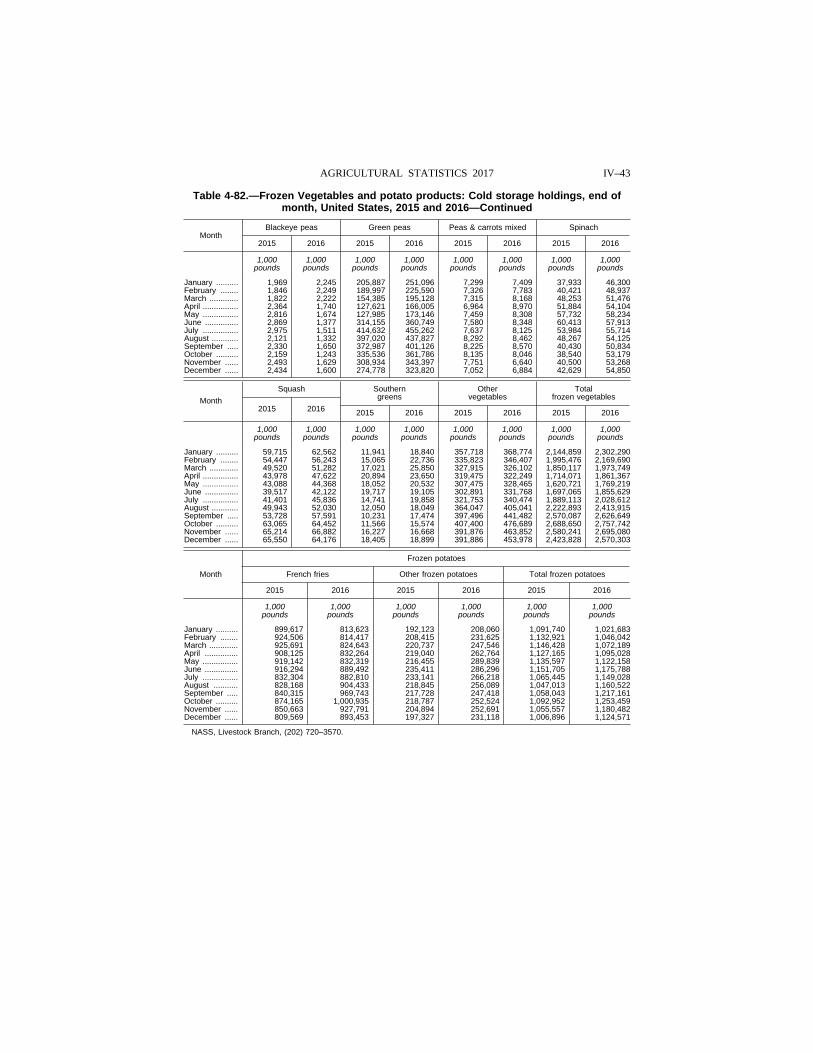
IV–43 AGRICULTURAL STATISTICS 2017
Table 4-82.—Frozen Vegetables and potato products: Cold storage holdings, end of month, United States, 2015 and 2016—Continued
Month Blackeye peas Green peas Peas & carrots mixed Spinach
2015 2016 2015 2016 2015 2016 2015 2016
1,000 1,000 1,000 1,000 1,000 1,000 1,000 1,000 pounds pounds pounds pounds pounds pounds pounds pounds
January .......... 1,969 2,245 205,887 251,096 7,299 7,409 37,933 46,300 February ........ 1,846 2,249 189,997 225,590 7,326 7,783 40,421 48,937 March ............. 1,822 2,222 154,385 195,128 7,315 8,168 48,253 51,476 April ................ 2,364 1,740 127,621 166,005 6,964 8,970 51,884 54,104 May ................ 2,816 1,674 127,985 173,146 7,459 8,308 57,732 58,234 June ............... 2,869 1,377 314,155 360,749 7,580 8,348 60,413 57,913 July ................ 2,975 1,511 414,632 455,262 7,637 8,125 53,984 55,714 August ............ 2,121 1,332 397,020 437,827 8,292 8,462 48,267 54,125 September ..... 2,330 1,650 372,987 401,126 8,225 8,570 40,430 50,834 October .......... 2,159 1,243 335,536 361,786 8,135 8,046 38,540 53,179 November ...... 2,493 1,629 308,934 343,397 7,751 6,640 40,500 53,268 December ...... 2,434 1,600 274,778 323,820 7,052 6,884 42,629 54,850
Month
Squash Southern greens
Other vegetables
Total frozen vegetables
2015 2016 2015 2016 2015 2016 2015 2016
1,000 1,000 1,000 1,000 1,000 1,000 1,000 1,000 pounds pounds pounds pounds pounds pounds pounds pounds
January .......... 59,715 62,562 11,941 18,840 357,718 368,774 2,144,859 2,302,290 February ........ 54,447 56,243 15,065 22,736 335,823 346,407 1,995,476 2,169,690 March ............. 49,520 51,282 17,021 25,850 327,915 326,102 1,850,117 1,973,749 April ................ 43,978 47,622 20,894 23,650 319,475 322,249 1,714,071 1,861,367 May ................ 43,088 44,368 18,052 20,532 307,475 328,465 1,620,721 1,769,219 June ............... 39,517 42,122 19,717 19,105 302,891 331,768 1,697,065 1,855,629 July ................ 41,401 45,836 14,741 19,858 321,753 340,474 1,889,113 2,028,612 August ............ 49,943 52,030 12,050 18,049 364,047 405,041 2,222,893 2,413,915 September ..... 53,728 57,591 10,231 17,474 397,496 441,482 2,570,087 2,626,649 October .......... 63,065 64,452 11,566 15,574 407,400 476,689 2,688,650 2,757,742 November ...... 65,214 66,882 16,227 16,668 391,876 463,852 2,580,241 2,695,080 December ...... 65,550 64,176 18,405 18,899 391,886 453,978 2,423,828 2,570,303
Month
Frozen potatoes
French fries Other frozen potatoes Total frozen potatoes
2015 2016 2015 2016 2015 2016
1,000 1,000 1,000 1,000 1,000 1,000 pounds pounds pounds pounds pounds pounds
January .......... 899,617 813,623 192,123 208,060 1,091,740 1,021,683 February ........ 924,506 814,417 208,415 231,625 1,132,921 1,046,042 March ............. 925,691 824,643 220,737 247,546 1,146,428 1,072,189 April ............... 908,125 832,264 219,040 262,764 1,127,165 1,095,028 May ................ 919,142 832,319 216,455 289,839 1,135,597 1,122,158 June ............... 916,294 889,492 235,411 286,296 1,151,705 1,175,788 July ................ 832,304 882,810 233,141 266,218 1,065,445 1,149,028 August ........... 828,168 904,433 218,845 256,089 1,047,013 1,160,522 September ..... 840,315 969,743 217,728 247,418 1,058,043 1,217,161 October .......... 874,165 1,000,935 218,787 252,524 1,092,952 1,253,459 November ...... 850,663 927,791 204,894 252,691 1,055,557 1,180,482 December ...... 809,569 893,453 197,327 231,118 1,006,896 1,124,571
NASS, Livestock Branch, (202) 720–3570.


![[XLS] · Web viewSIC2007 Code Agriculture, Forestry, Fishing, Veterinary Growing crops Cereals, leguminous crops, oilseeds Rice Vegetables, melons, roots, tubers Sugar cane Tobacco](https://static.fdocuments.net/doc/165x107/5b054bf27f8b9a0a548eaad2/xls-viewsic2007-code-agriculture-forestry-fishing-veterinary-growing-crops.jpg)


