Statistics - Mathematicssmcmaths.webs.com/Form-4/Statistics Notes Form 4 Part 1.pdf · Mr. Jonathan...
19
Mr. Glen Farrugia Stella Maris College Mr. Jonathan Camenzuli Form 4 Mathematics Page | 1 Statistics Data is continuously being collected everyday, by means of surveys, questionnaires and through online technologies. Our main aim in Statistics is to make sense of this raw data which is collected. One way to do so is to find the average of the data. By doing so we are able to compare one set of data to another set by comparing just two values – their averages. There are several ways of expressing an average, but the most commonly used averages are the mean, mode, median and range. The mean of a set of data is given when all the values in the set are added, and then divided by the number of values in that set. That is: Example 1 The ages of 11 players of Juventus F.C. are: 37, 26, 32, 21, 31, 28, 24, 34, 28, 21, 31, 34 Find the mean age of the team. Sum of all ages = 37 + 26 + 32 + 21 + 31 + 28 + 24 + 34 + 28 + 21 + 31 + 34 = 347 Total number in team = 11 Mean age = (up to 1 decimal place) Mean
Transcript of Statistics - Mathematicssmcmaths.webs.com/Form-4/Statistics Notes Form 4 Part 1.pdf · Mr. Jonathan...
Mr. Glen Farrugia Stella Maris College Mr. Jonathan Camenzuli Form 4 Mathematics
Page | 1
Statistics Data is continuously being collected everyday, by means of surveys,
questionnaires and through online technologies. Our main aim in Statistics is to
make sense of this raw data which is collected.
One way to do so is to find the average of the data. By doing so we are able to
compare one set of data to another set by comparing just two values – their
averages.
There are several ways of expressing an average, but the most commonly used
averages are the mean, mode, median and range.
The mean of a set of data is given when all the values in
the set are added, and then divided by the number of
values in that set. That is:
Example 1
The ages of 11 players of Juventus F.C. are:
37, 26, 32, 21, 31, 28, 24, 34, 28, 21, 31, 34
Find the mean age of the team.
Sum of all ages = 37 + 26 + 32 + 21 + 31 + 28 + 24 + 34 + 28 + 21 + 31 + 34 = 347
Total number in team = 11
Mean age =
(up to 1 decimal place)
Mean

Mr. Glen Farrugia Stella Maris College Mr. Jonathan Camenzuli Form 4 Mathematics
Page | 2
Example 2
14 students were asked how many hours they spend on Facebook everyday. Their responses were the following:
2.5, 5, 3, 3, 3, 1, 1.5, 1.5, 2.5, 1, 0.5, 1, 3, 1
Find the mean time (in hours) spent on social media by these students.
Example 3
The total (added) score of all students in a Maths test was 975. The average mark of the class was 75. How many students are there in this class?
Example 4
The mean weight of a group of 6 boys is 54kg. Two boys leave the group and the mean
weight of the remaining 4 boys is 58kg. What is the mean weight of the two boys that left
the group?

Mr. Glen Farrugia Stella Maris College Mr. Jonathan Camenzuli Form 4 Mathematics
Page | 3
The mode of a set of data is the value that occurs the
most. That is, it is the value with the highest frequency.
The mode is very easy to find, and it can also be applied
to non-numerical data. For example, you can find the
modal birthday month of the class.
Example 1
13 families were asked how many cars they own as a family. The following were their
responses:
5, 2, 2, 1, 3, 3, 1, 2, 4, 2 , 2, 1, 3
What is the modal number of cars owned by these families?
Example 2
A group of pensioners were asked how many times they visited Gozo last year. Their
esponses were as follows:
4, 2, 2, 5, 4, 4, 3, 2, 1, 1, 4, 5, 5, 2
What is the mode of this set of data?
Example 3
The following data represents the weather of the first 12 days of March 2015:
rain, sun, cloud, sun, rain, fog, thunder, rain, fog, sun, thunder, sun
What is the modal weather in these 12 days?
Mode

Mr. Glen Farrugia Stella Maris College Mr. Jonathan Camenzuli Form 4 Mathematics
Page | 4
The median is the middle number of an ordered set of
numbers.
To find the median follow these steps:
We can also use the following formula, to find the position of the median:
Example 1
Find the median of the following set of numbers:
1, 5, 9, 15, 21
Therefore, the median is 9
OR
position of median =
rd position
9 is in the 3rd position. Therefore 9 is the median.
Median
where n is the number of values in
the set of data.
1. Arrange the numbers in order from smallest to largest.
2. Find the middle number

Mr. Glen Farrugia Stella Maris College Mr. Jonathan Camenzuli Form 4 Mathematics
Page | 5
Special Case
Find the median of the following set of numbers:
22, 25, 29, 31, 36, 40
Therefore, in this example,
Median =
Note that in this case,
position of median =
th position
In other words the median lies between the 3rd and the 4th positions.
Example 2
A group of students were asked how many cousins they have. The following were their
responses:
4, 5, 4, 8, 1, 0, 1, 5, 9, 4, 11, 13, 2, 3, 2
Find the median number of cousins of this group of students.
If there are two median numbers, we simply
find the mean of these two numbers.
Mr. Glen Farrugia Stella Maris College Mr. Jonathan Camenzuli Form 4 Mathematics
Page | 6
Example 3
A group of teenagers were asked how many books they read last year. Their responses were
as follows:
11, 5, 4, 8, 2, 2, 3, 1, 5, 6, 20, 16, 9, 1
Find the median number of books read by these teenagers.
The range is not an average. It shows the spread of the
data. It can be used to compare two or more sets of
similar data.
It can also be used to comment on the consistency of the
data.
The range for a set of data is given as the highest value minus the lowest value
in the set:
Example 1
The price of petrol in the last six months was as following:
€1.38, €1.40, €1.40, €1.44, €1.38, €1.35
Find the range in petrol prices.
Range = Highest value – Lowest values = 1.44 – 1.35 = 0.09
Range
Range = Highest value – Lowest value

Mr. Glen Farrugia Stella Maris College Mr. Jonathan Camenzuli Form 4 Mathematics
Page | 7
Example 2
The number of teenagers attending a youth group on 10 consecutive Fridays was as follows:
20, 18, 13, 22, 26, 20, 15, 13, 22, 12
Find the range of the attendance during these 10 weeks.
Example 3
The manager of Liverpool F.C. has to choose between Moreno and Clyne on who plays first
in the next match. In the previous 11 league matches, there performance scores were as
follows:
Moreno: 14, -19, 12, -1, 36, 13, 12, 30, 14, 2, 20
Clyne: 27, 30, -12, -9, 27, 23, -10, 15, 19, 5, 11
a. Calculate the mean performance score for each player separately.
b. Find the range of each player separately.
c. If you were the manager, whom would you choose to play first in the next match?
Explain why.

Mr. Glen Farrugia Stella Maris College Mr. Jonathan Camenzuli Form 4 Mathematics
Page | 8
Example 4
I have 5 numbers.
Their mean is 4.
Their median is 3.
Their mode is 3.
Find 3 different sets of five positive whole numbers that satisfy these conditions.
Support Exercise Pg. 265 Exercise 17A Nos. 1-10

Mr. Glen Farrugia Stella Maris College Mr. Jonathan Camenzuli Form 4 Mathematics
Page | 9
When a lot of information has been gathered, it is often
convenient to put it together in a frequency table.
From this table we can then find the values of the three
averages and the range.
Example 1
The table below shows the total number of goals scored in the Champion’s
League so far.
Number of goals by team 5 6 7 8 9 10 11 12 13
Frequency 7 3 4 2 1 2 1 0 1
For the number of goals scored, calculate:
a) the mode b) the median c) the mean
a) The modal number of goals scored is the number with the largest
frequency, which is 7.
Therefore, the modal number of goals scored is 5.
b) Remember that the median is found by working out where the middle of
the set of numbers is located.
In order to find the median we need to first add a new row in the table,
where in each cell, we add the frequencies of the preceding cells. We
call this new row the cumulative frequency.
Number of goals by team 5 6 7 8 9 10 11 12 13
Frequency 7 3 4 2 1 2 1 0 1
Cumulative Frequency 7 7+3 =10
10+4 =14
14+2 =16
16+1 =17
17+2 =19
19+1 =20
20+0 =20
20+1 =21
Frequency
Tables

Mr. Glen Farrugia Stella Maris College Mr. Jonathan Camenzuli Form 4 Mathematics
Page | 10
Next, we calculate the middle position:
From the cumulative frequency row, we can now find which group
contains the 11th item. Note that up to the 10th item are in the second
group (i.e. those teams which scored a total of 6 goals), therefore, the
11th item must be in the third group. Hence, the median number of goals
scored is 7.
c) To calculate the mean number of goals scored, we add an extra row in
which we multiply the number of goals scored by the frequency. We
then add the whole row to find the total number of goals and divide by
the total frequency (the number of teams included).
Number of goals by team 5 6 7 8 9 10 11 12 13
Frequency 7 3 4 2 1 2 1 0 1
Total number of goals scored
5 x 7 = 35
6 x 3 = 18
7 x 4 = 28
8 x 2 = 16
9 x 1 = 9
10 x 2 = 20
11 x 1 = 11
12 x 0 = 0
13 x 1 =13
Hence, the mean number of goals scored is

Mr. Glen Farrugia Stella Maris College Mr. Jonathan Camenzuli Form 4 Mathematics
Page | 11
Example 2
A survey of the shoe size of all boys in one year of a school gave these results:
Shoe size 4 5 6 7 8 9 10
Number of students (Frequency)
12 30 34 35 23 80 3
From this frequency table, find the a) mode b) median c) mean.

Mr. Glen Farrugia Stella Maris College Mr. Jonathan Camenzuli Form 4 Mathematics
Page | 12
Example 3
Roll the dice for 20 times. Record the resulting number each time:
Draw the corresponding Frequency Table:
From this frequency table, find the a) mode b) median c) mean.
Raw Data

Mr. Glen Farrugia Stella Maris College Mr. Jonathan Camenzuli Form 4 Mathematics
Page | 13
Example 4
A school did a survey on how many times in a week students arrived late at school. These
are the findings:
Number of times late 0 1 2 3 4 5
Number of students (Frequency)
481 34 23 15 3 4
From this frequency table, find the a) mode b) median c) mean.
Support Exercise Pg. 267 Exercise 17B Nos. 1-6

Mr. Glen Farrugia Stella Maris College Mr. Jonathan Camenzuli Form 4 Mathematics
Page | 14
Sometimes the infrmation we are given is
grouped in some way. Normally grouped
data is continuous data, which is data
that can have any value within a range of
values (eg. height, mass and time). In
these situations, the averages can only be
estimated, as we do not have all the
information.
Discrete data is data that consists of separate numbers, for example, goals
scored, marks in a test, number of people and shoe sizes.
In both cases, when using a grouped table to estimate the mean, we first find
the midpoint of each interval by adding the two end-values and then dividing
by two, as shown in the following example.
Example 1
Students were asked how much pocket money they received weekly. The data
was then grouped in the following way:
Pocket money, p (€) 0 < p ≤ 1 1 < p ≤ 2 2 < p ≤ 3 3 < p ≤ 4 4 < p ≤ 5
Number of students (Frequency)
2 5 5 9 15
a) Write down the modal class.
b) Find the range in which the median value lies.
c) Calculate an estimate of the mean weekly poket money.
a) The modal class is that with the largest frequency, that is, the range
4 < p ≤ 5.
Frequency Tables
With Grouped Data

Mr. Glen Farrugia Stella Maris College Mr. Jonathan Camenzuli Form 4 Mathematics
Page | 15
b) Like for the grouped data, we need to add an extra row for the
cumulative frequency.
Pocket money, p (€) 0 < p ≤ 1 1 < p ≤ 2 2 < p ≤ 3 3 < p ≤ 4 4 < p ≤ 5
Number of students (Frequency)
2 5 5 9 15
Cumulative Frequency 2 2+5 = 7
7+5 = 12
12+9 = 21
21+15 = 36
Next, we calculate the middle position:
This means that the median lies between the 18th and 19th positions.
From the cumulative frequency, we can now find which group contains
the 18th and 19th item. The third group contains up to the 12th item,
while the fourth group contains up to the 21st item. Therefore the 18th
and 19th positions lie in the fourth group. Hence the median lies in the
range 3 < p ≤ 4.
c) To estimate the mean, we assume that each student in each class
receives the ‘midpoint’ amount. Thus, we must add an extra row in the
table for the midpoint.
Pocket money, p (€) 0 < p ≤ 1 1 < p ≤ 2 2 < p ≤ 3 3 < p ≤ 4 4 < p ≤ 5 Total
Frequency, f 2 5 5 9 15 36
Midpoint, m
f x m 2 x 0.5
= 1 5 x 1.5 = 7.5
5 x 2.5 = 12.5
9 x 3.5 = 31.5
15 x 4.5 = 67.5
120

Mr. Glen Farrugia Stella Maris College Mr. Jonathan Camenzuli Form 4 Mathematics
Page | 16
We then procedd as usual, that is the estimated mean is given by:
(rounded to the nearest cent)
Example 2
The number in millions of Facebook users in the world in 2011 was as follows:
Age, a Frequency (millions)
13 ≤ a ≤ 15 56
16 ≤ a ≤ 17 66
18 ≤ a ≤ 24 248
25 ≤ a ≤ 34 210
35 ≤ a ≤ 44 109
45 ≤ a ≤ 54 61
55 ≤ a ≤ 64 29
65 ≤ a ≤ 80 19
a) How many people were using FB in 2011?
b) What is the modal age class of FB users in 2011?
c) What is the age class in which the median age of FB users falls?
d) What is the estimated mean age of FB users in 2011?
You cannot find the median or range from a grouped
table since you do not know the actual values.

Mr. Glen Farrugia Stella Maris College Mr. Jonathan Camenzuli Form 4 Mathematics
Page | 17

Mr. Glen Farrugia Stella Maris College Mr. Jonathan Camenzuli Form 4 Mathematics
Page | 18
Example 3
In a health survey, people were asked how many litres of water they drink everyday. Their
responses were grouped as follows:
Litres of water (lt.) 0 - 0.5 0.5 - 1 1 – 1.5 1.5 - 2 2 – 2.5
Frequency 21 57 65 52 12
a) How many people participated in the survey?
b) What is the modal class of litres of water consumed?
c) In which range of litres does the median value lie?
d) What is the estimated mean of litres of water consumed?
Mr. Glen Farrugia Stella Maris College Mr. Jonathan Camenzuli Form 4 Mathematics
Page | 19
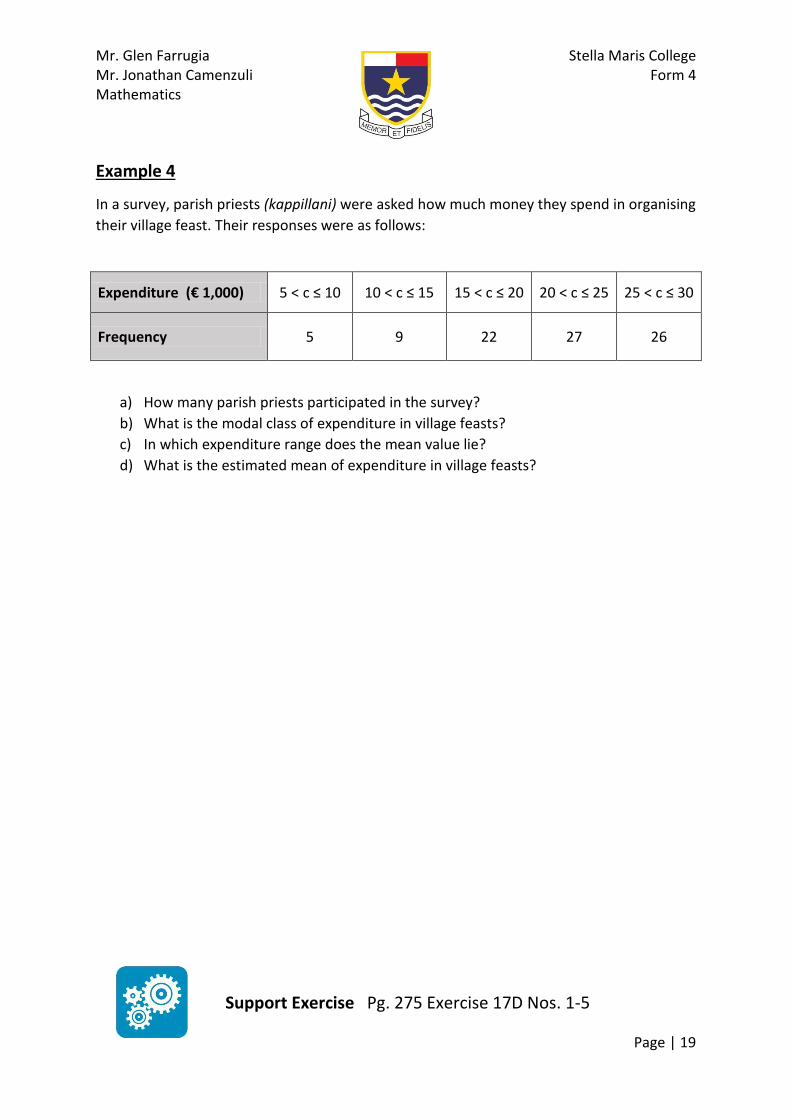
Example 4
In a survey, parish priests (kappillani) were asked how much money they spend in organising
their village feast. Their responses were as follows:
Expenditure (€ 1,000) 5 < c ≤ 10 10 < c ≤ 15 15 < c ≤ 20 20 < c ≤ 25 25 < c ≤ 30
Frequency 5 9 22 27 26
a) How many parish priests participated in the survey?
b) What is the modal class of expenditure in village feasts?
c) In which expenditure range does the mean value lie?
d) What is the estimated mean of expenditure in village feasts?
Support Exercise Pg. 275 Exercise 17D Nos. 1-5