Statistics Canada Statistique Canada ETHNIC IDENTIFICATION IN CANADA: Data from the Ethnic Diversity...
17
Statistics Canada Statistique Canada ETHNIC IDENTIFICATION IN CANADA: Data from the Ethnic Diversity Survey Jennifer Chard & Jane Badets 2004 Congress of the Humanities and Social Sciences Canadian Population Society Annual Meetings June 4, 2004, Winnipeg, Manitoba
-
Upload
erik-parks -
Category
Documents
-
view
215 -
download
0
Transcript of Statistics Canada Statistique Canada ETHNIC IDENTIFICATION IN CANADA: Data from the Ethnic Diversity...

Statistics Canada
Statistique Canada
ETHNIC IDENTIFICATION IN CANADA:
Data from the Ethnic Diversity Survey
Jennifer Chard & Jane Badets2004 Congress of the Humanities and Social Sciences
Canadian Population Society Annual MeetingsJune 4, 2004, Winnipeg, Manitoba

What is the Ethnic Diversity Survey?
Post-censal survey which targeted non-Aboriginal individuals aged 15 and older living in private dwellings in Canada’s ten provinces
Two-phase stratified sampling design based on responses to the 2001 Census ethnic origin, birthplace & birthplace of parents questions
Computer Assisted Telephone Interviews were conducted across Canada: April to August 2002
42,500 respondents: response rate = 75.6%

Outline of presentation
Review of measures of ethnicity included in the EDS;
Overview of the generational and ethnic composition of Canada in 2002;
Brief summary of findings for various measures of ethnic identification by generational status.

Measures of ethnic ancestryand ethnic identification
Ethnic ancestry
Importance of ethnic ancestry
Ethnic identity
Importance of ethnic identity
Importance of ethnic customs & traditions
Sense of belonging to ethnic group

Nearly six-in-10 people aged 15 and older were three or more generations in Canada
Second generation
17%
Third generation or
more58%
First generation
23%
Note: Refers to Canada’s non-Aboriginal population aged 15 and older. Source: Statistics Canada, Ethnic Diversity Survey, 2002.

1st generation ethnically diverse; 2nd generation reflects waves of European immigration; 3rd+ generation mainly
British, French &/or Canadian ancestries
49
13
33
70
21
32
37
1114
4710
133
1517
3 4 5 2
0.4
0%
20%
40%
60%
80%
100%
Totalpopulation
1st generation 2nd generation 3rd generationor more
Other mixedancestries
European and British,French and/orCanadian only
Non-European only
European only
British, French and/orCanadian only
Note: Refers to Canada’s non-Aboriginal population aged 15 and older. Source: Statistics Canada, Ethnic Diversity Survey, 2002.
Generational status by selected ethnic ancestry categories

Top 10 ethnic ancestries (total responses) by generation
Total population
1. English
2. Scottish
3. Irish
4. French
5. German
6. Canadian
7. Québécois
8. Italian
9. French-Can.
10. Chinese
1st generation
1. Chinese
2. East Indian
3. Italian
4. English
5. German
6. Scottish
7. Filipino
8. Portuguese
9. Polish
10. Irish
2nd generation
1. English
2. Scottish
3. Irish
4. German
5. Italian
6. Canadian
7. Dutch
8. Ukrainian
9. French
10. British, n.i.e.
3+ generation
1. English
2. Irish
3. Scottish
4. French
5. Canadian
6. German
7. Québécois
8. French-Can.
9. Ukrainian
10. British, n.i.e.
Note: Refers to Canada’s non-Aboriginal population aged 15 and older. Source: Statistics Canada, Ethnic Diversity Survey, 2002.
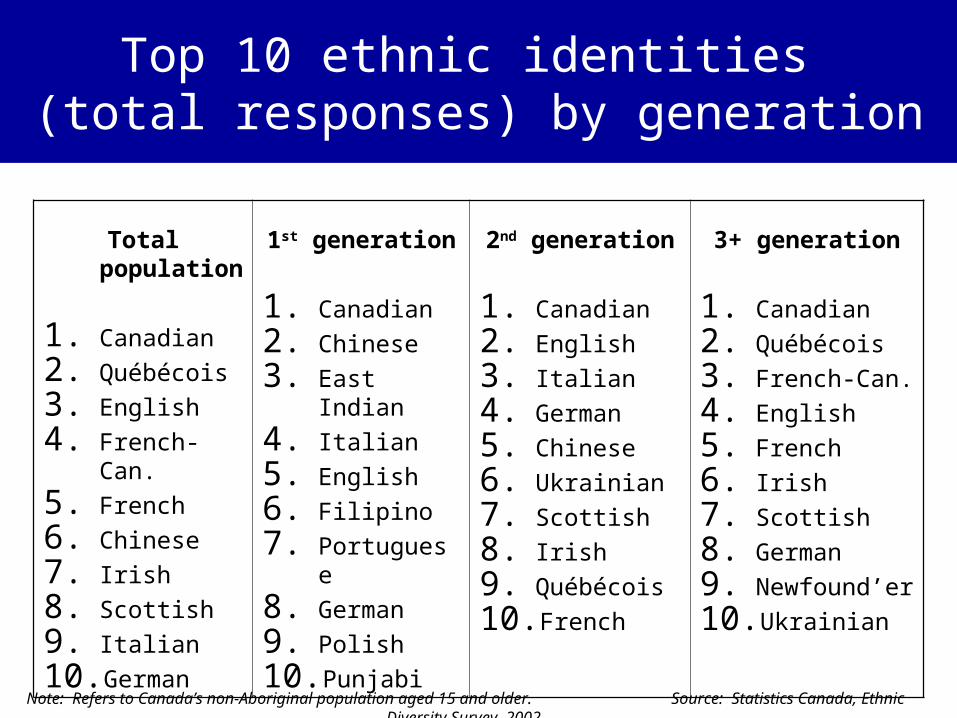
Top 10 ethnic identities (total responses) by generation
Total population
1. Canadian
2. Québécois
3. English
4. French-Can.
5. French
6. Chinese
7. Irish
8. Scottish
9. Italian
10. German
1st generation
1. Canadian
2. Chinese
3. East Indian
4. Italian
5. English
6. Filipino
7. Portuguese
8. German
9. Polish
10. Punjabi
2nd generation
1. Canadian
2. English
3. Italian
4. German
5. Chinese
6. Ukrainian
7. Scottish
8. Irish
9. Québécois
10. French
3+ generation
1. Canadian
2. Québécois
3. French-Can.
4. English
5. French
6. Irish
7. Scottish
8. German
9. Newfound’er
10. Ukrainian
Note: Refers to Canada’s non-Aboriginal population aged 15 and older. Source: Statistics Canada, Ethnic Diversity Survey, 2002.

Canadian, Québécois, Acadian & provincial identities reported by 7-in-10 respondents
20
1
12
31
70
40
8078
0
10
20
30
40
50
60
70
80
90
Total population 1st generation 2nd generation 3rd + generation
Ethnic ancestry response
Ethnic identity response
%
Note: Refers to Canada’s non-Aboriginal population aged 15 and older. Source: Statistics Canada, Ethnic Diversity Survey, 2002.
* Provincial group responses include “Newfoundlander”, “Albertan” etc.
% reporting Canadian, Québécois, Acadian and provincial group responses by generational status

Who is reporting Canadian identity and who is not reporting Canadian identity?
Note: Refers to Canada’s non-Aboriginal population aged 15 and older. Source: Statistics Canada, Ethnic Diversity Survey, 2002.
Selected ancestries (total responses)
With Canadian identity
Canadian identity only
Canadian and other identity
Canadian 91% 81% 9%
French-Canadian 88% 82% 6%
Norwegian 81% 77% 4%E
Dutch 78% 69% 9%
Scottish 74% 68% 6%
English 69% 63% 6%
Chinese 40% 16% 24%
East Indian, n.i.e. 33% 18% 14%
Filipino 28% 13% 15%
Quebecois(e) 21% 14% 8%E: Use with caution “n.i.e.” means “not included elsewhere”.

Ethnic distribution of the population is different for identity compared with ancestry
46
1913 12
37
71
7 94 3
8
0
10
20
30
40
50
60
70
80
90
100
British, French&/or Canadian
only
European only Non-Europeanonly
European,British, French&/or Canadian
Other mixed Uncodeable ornon-response
Ethnic ancestry response
Ethnic identity response
%
Note: Refers to Canada’s non-Aboriginal population aged 15 and older. Source: Statistics Canada, Ethnic Diversity Survey, 2002.
% reporting selected ethnic category responses by generational status

Identity rated high in importance more often than ancestry, less variation by generation
52
7165
57
44
8075
8185
78
0
20
40
60
80
100
Total population 1st generation -arrived 1991 -
2001
1st generation -arrived before
1991
2nd generation 3rd generation ormore
Importance of ethnic ancestry Importance of ethnic identity
% % who gave a 4 or 5 in response to the importance question(on a scale of 1 to 5 with 1 being not important at all and 5 being very important)
Note: Refers to Canada’s non-Aboriginal population aged 15 and older. Source: Statistics Canada, Ethnic Diversity Survey, 2002.

Immigrants of the 1990’s more likely to say ethnic customs & traditions are important
63
7367
59 60
0
10
20
30
40
50
60
70
80
Total population 1st generation -arrived 1991 -
2001
1st generation -arrived before
1991
2nd generation 3rd generationor more
%
% of those who rated at least one ethnic ancestry other than Canadian a 4 or 5 in importance in the importance of ancestry question and who gave a 4 or 5 in response to the importance of ethnic customs and traditions question
(on a scale of 1 to 5 with 1 being not important at all and 5 being very important)
Note: Refers to Canada’s non-Aboriginal population aged 15 and older. Source: Statistics Canada, Ethnic Diversity Survey, 2002.

Immigrants of the 1990s have a strong sense of belonging to their ethnic group
50
62
55
47 48
0
20
40
60
80
Total population 1st generationarrived 1991-2001
1st generation -arrived before
1991
2nd generation 3rd generation ormore
% % who gave a 4 or 5 in response to the sense of belonging to ethnic group question(on a scale of 1 to 5 with 1 being not strong at all and 5 being very strong)
Note: Refers to Canada’s non-Aboriginal population aged 15 and older. Source: Statistics Canada, Ethnic Diversity Survey, 2002.

Italian ancestry• 62% of 1st generation
• 54% of 2nd generation or more
Chinese ancestry• 60% of 1st generation who arrived 1991-2001
• 58% of 1st generation who arrived before 1991
• 52% of 2nd generation or more
German ancestry• 39% of 1st generation
• 33% of 2nd generation or more
Sense of belonging varies both by ethnic group and generations in Canada
% who gave a 4 or 5 in response to the sense of belonging to ethnic group question(on a scale of 1 to 5 with 1 being not strong at all and 5 being very strong)
Note: Refers to Canada’s non-Aboriginal population aged 15 and older. Source: Statistics Canada, Ethnic Diversity Survey, 2002.

What the Ethnic Diversity Survey tells us about ethnicity in Canada
There is clearly a difference in reporting patterns between ethnic ancestry and ethnic identity;
For both measurements of ethnicity, there were reporting differences according to the number of generations in Canada;
Generational differences were also evident in in terms of sense of belonging to the ethnic group and importance of carrying on the customs and traditions of the ethnic group.

Questions?
Ethnic Diversity Survey
Contact:
Jennifer ChardSenior AnalystEthnicity & Immigration Statistics, Statistics Canada
604-666-8880 (Vancouver)

![Organic Swiss chard-corrected - icia.es · 3 46 analysis showed that organic chard retained turgidity, color and brightness longer than 47 conventional chard [3,9]. Moreover, the](https://static.fdocuments.net/doc/165x107/5bf5581709d3f2941d8b86ca/organic-swiss-chard-corrected-iciaes-3-46-analysis-showed-that-organic-chard.jpg)