STATISTICS BRIEF - UITP BRIEF City/Operator Annual passenger trips City/Operator Annual passenger...
4
1 OCTOBER 2014 INTRODUCTION Metros are the backbone of public transportation systems in cities of different sizes around the world. 148 cities have a me- tro system and there are close to 540 lines in total. Together, they carry over 150 million passengers per day. Two-thirds of the world’s metro systems are located in Asia and Europe (50 and 45 respectively). There are 16 systems in Eu- rasia, 16 in Latin America, 15 in North America and 6 in the Middle East and North Africa (MENA) region. PASSENGER NUMBERS With close to 3.3 billion passenger trips per year, Tokyo has the busiest metro system in Asia and also in the world (see figure 1). Moscow’s metro carries over 2.4 billion per year, making it the busiest outside Asia (and the world’s 3 rd ). New York City has the highest ridership in North America (1.7 bn, world’s 7 th ) and Mexico City is the busiest network in Latin America (1.6 bn, world’s 8 th ). The networks of Paris (opened in 1900) and London (opened in 1863) are ranked 9 th and 11 th respectively. Metro systems in Asia carry, together, over 70 million passengers per day, which represents nearly half the world total (see figure 3). WORLD METRO FIGURES STATISTICS BRIEF City/Operator Annual passenger trips City/Operator Annual passenger trips Tokyo* 3,294 Guangzhou 1,841 Seoul* 2,467 New York City 1,661 Moscow 2,464 Mexico City 1,609 Beijing 2,460 Paris 1,541 Shanghai 2,269 Hong Kong 1,482 Fig. 1: 10 busiest metro networks (2012) in millions of passengers. *Tokyo and Seoul have multiple-operator networks. The ridership figure refers to the entire network; the operator logos show the UITP member companies in the respective cities. MORE NEW SYSTEMS TODAY THAN EVER The number of cities with metros continues to grow. In 2013, new systems opened in Brescia (Italy), Yongin (South Korea), Harbin and Zhengzhou (China). The increase has actually accelerated. From the 1970s to the year 2000, there were approximately 25 new systems every decade. Since the start of the new millennium, more than 45 cities have been added to the list. Asia also leads the absolute ranking on this occasion, with 23 opening metro networks. In relative terms, MENA saw the greatest increase with respect to the situation in 2000, with the opening of 4 out of its current 6 metro systems. It is significant to note that Latin America also presents a high comparative growth rate, with an increase from 10 to 16 systems. 0 20 40 60 80 100 120 140 160 1820 1840 1860 1880 1900 1920 1940 1960 1980 2000 2020 2040 London, 1863 Chicago, 1892 Paris, 1900 New York, 1904 Buenos Aires, 1913 Tokyo, 1927 Moscow, 1935 Beijing, 1969 Hong Kong, 1979 Cairo, 1987 Zhengzhou, 2013 Fig. 2: Number of metro cities and some key opening dates
Transcript of STATISTICS BRIEF - UITP BRIEF City/Operator Annual passenger trips City/Operator Annual passenger...
1
OCTOBER 2014
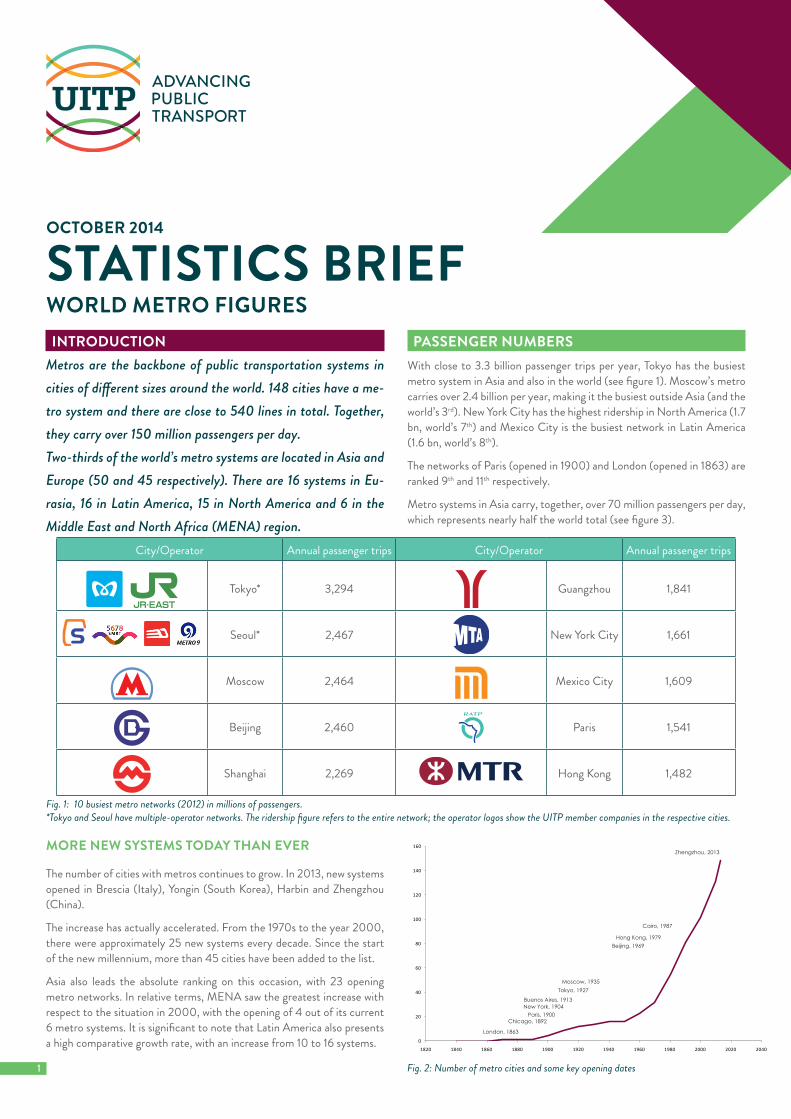
INTRODUCTIONMetros are the backbone of public transportation systems in cities of different sizes around the world. 148 cities have a me-tro system and there are close to 540 lines in total. Together, they carry over 150 million passengers per day.Two-thirds of the world’s metro systems are located in Asia and Europe (50 and 45 respectively). There are 16 systems in Eu-rasia, 16 in Latin America, 15 in North America and 6 in the Middle East and North Africa (MENA) region.
PASSENGER NUMBERSWith close to 3.3 billion passenger trips per year, Tokyo has the busiest metro system in Asia and also in the world (see figure 1). Moscow’s metro carries over 2.4 billion per year, making it the busiest outside Asia (and the world’s 3rd). New York City has the highest ridership in North America (1.7 bn, world’s 7th) and Mexico City is the busiest network in Latin America (1.6 bn, world’s 8th).
The networks of Paris (opened in 1900) and London (opened in 1863) are ranked 9th and 11th respectively.
Metro systems in Asia carry, together, over 70 million passengers per day, which represents nearly half the world total (see figure 3).
WORLD METRO FIGURESSTATISTICS BRIEF
City/Operator Annual passenger trips City/Operator Annual passenger trips
Tokyo* 3,294 Guangzhou 1,841
Seoul* 2,467 New York City 1,661
Moscow 2,464 Mexico City 1,609
Beijing 2,460 Paris 1,541
Shanghai 2,269 Hong Kong 1,482
Fig. 1: 10 busiest metro networks (2012) in millions of passengers. *Tokyo and Seoul have multiple-operator networks. The ridership figure refers to the entire network; the operator logos show the UITP member companies in the respective cities.
MORE NEW SYSTEMS TODAY THAN EVER
The number of cities with metros continues to grow. In 2013, new systems opened in Brescia (Italy), Yongin (South Korea), Harbin and Zhengzhou (China).
The increase has actually accelerated. From the 1970s to the year 2000, there were approximately 25 new systems every decade. Since the start of the new millennium, more than 45 cities have been added to the list.
Asia also leads the absolute ranking on this occasion, with 23 opening metro networks. In relative terms, MENA saw the greatest increase with respect to the situation in 2000, with the opening of 4 out of its current 6 metro systems. It is significant to note that Latin America also presents a high comparative growth rate, with an increase from 10 to 16 systems. 0
20
40
60
80
100
120
140
160
1820 1840 1860 1880 1900 1920 1940 1960 1980 2000 2020 2040
London, 1863
Chicago, 1892Paris, 1900
New York, 1904Buenos Aires, 1913
Tokyo, 1927Moscow, 1935
Beijing, 1969Hong Kong, 1979
Cairo, 1987
Zhengzhou, 2013
Fig. 2: Number of metro cities and some key opening dates

2 Fig.
3: M
ap of
coun
tries
whic
h hav
e met
ro ne
twor
ks, a
ccor
ding t
o wor
ld re
gion,
with
aver
age d
aily r
idersh
ip. Th
e num
ber o
f citi
es in
each
regio
n with
met
ros a
nd to
tal le
ngth
of m
etro
infra
struc
ture
are a
lso sh
own.
The s
ize of
the b
ubble
s refl
ects
rider
ship
figur
es.

3
INFRASTRUCTURE
In parallel to the increase in the number of metro networks, many cities have expanded their network. Today there are 9,000 metro stations in the world and 11,000 kilometers of line infrastructure. Average line length is approximately 20 kilometers.
With more than 500 km of infrastructure, Shanghai has the world’s lon-gest network. It is followed by Beijing, another fast-growing network in
China. In fact, Asian cities take up 5 of the 10 top positions. London is the longest non-Asian network in the ranking, with New York, Moscow, Madrid and Paris completing the table (figure 4).
Average distance between stations on the world’s metros is approxima-tely 1,200 meters. Europe has the highest network density with an ave-rage inter-station distance of approximately 1 kilometer. Eurasia has the lowest network density, with a 1.5 km average, followed by Asia-Pacific and MENA (figure 5).
0
100
200
300
400
500
600
ShanghaiBeiji
ngLondon
Seoul
New
York
City
Tokyo
Moscow
Madrid
Guangzhou
Paris
Fig. 4: Top 10 cities in network length (in km)
0.0
0.2
0.4
0.6
0.8
1.0
1.2
1.4
1.6
Eurasia Asia-Pacific MENA North America
Latin America
Europe World average
Fig. 5: Average inter-station distance (in km) by region
rue Sainte-Marie 6, B-1080 Brussels | Belgium | Tel +32 (0)2 673 61 00 | Fax +32 (0)2 660 10 72 | [email protected] | www.uitp.org
This is a publication of the International Association of Public Transport. UITP has over 1,300 member companies in 92 countries throughout the world and represents the interests of key players in this sector. Its membership includes transport authorities, operators, both private and public, in all modes of collective passenger transport, and the industry. UITP addresses the economic, technical, organisation and management aspects of passenger transport, as well as the development of policy for mobility and public transport world-wide.
For further information please contact Mr Mircea Steriu, Statistics Manager. [email protected]
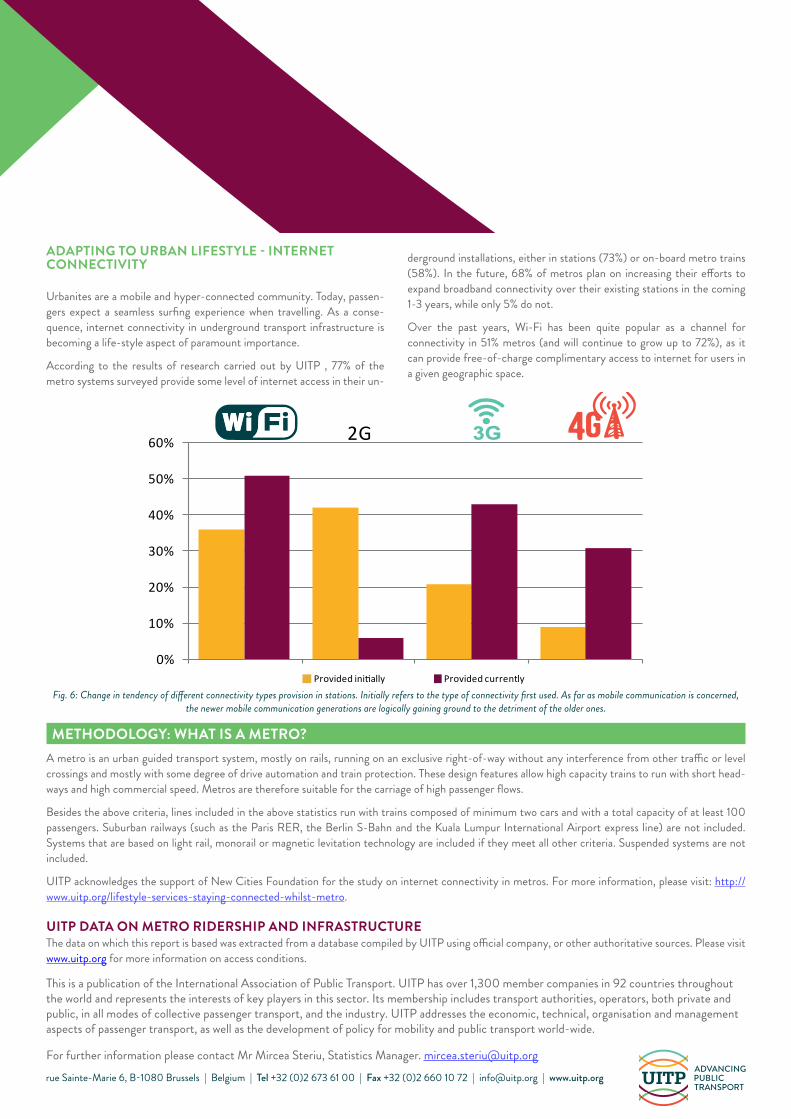
ADAPTING TO URBAN LIFESTYLE - INTERNET CONNECTIVITY
Urbanites are a mobile and hyper-connected community. Today, passen-gers expect a seamless surfing experience when travelling. As a conse-quence, internet connectivity in underground transport infrastructure is becoming a life-style aspect of paramount importance.
According to the results of research carried out by UITP , 77% of the metro systems surveyed provide some level of internet access in their un-
derground installations, either in stations (73%) or on-board metro trains (58%). In the future, 68% of metros plan on increasing their efforts to expand broadband connectivity over their existing stations in the coming 1-3 years, while only 5% do not.
Over the past years, Wi-Fi has been quite popular as a channel for connectivity in 51% metros (and will continue to grow up to 72%), as it can provide free-of-charge complimentary access to internet for users in a given geographic space.
METHODOLOGY: WHAT IS A METRO?A metro is an urban guided transport system, mostly on rails, running on an exclusive right-of-way without any interference from other traffic or level crossings and mostly with some degree of drive automation and train protection. These design features allow high capacity trains to run with short head-ways and high commercial speed. Metros are therefore suitable for the carriage of high passenger flows.
Besides the above criteria, lines included in the above statistics run with trains composed of minimum two cars and with a total capacity of at least 100 passengers. Suburban railways (such as the Paris RER, the Berlin S-Bahn and the Kuala Lumpur International Airport express line) are not included. Systems that are based on light rail, monorail or magnetic levitation technology are included if they meet all other criteria. Suspended systems are not included.
UITP acknowledges the support of New Cities Foundation for the study on internet connectivity in metros. For more information, please visit: http://www.uitp.org/lifestyle-services-staying-connected-whilst-metro.
UITP DATA ON METRO RIDERSHIP AND INFRASTRUCTUREThe data on which this report is based was extracted from a database compiled by UITP using official company, or other authoritative sources. Please visit www.uitp.org for more information on access conditions.
0%
10%
20%
30%
40%
50%
60%
Provided initially Provided currently
2G
Fig. 6: Change in tendency of different connectivity types provision in stations. Initially refers to the type of connectivity first used. As far as mobile communication is concerned, the newer mobile communication generations are logically gaining ground to the detriment of the older ones.