Statistics and clinical oncology
4
ClinicalOncology (1996) 8:71-74 © 1996The RoyalCollegeof Radiologists Editorial Clinical Oncology -1 0Z y Statistics and Clinical Oncology J. Brown 1 and D. Machin 2 1Yorkshire Clinical Trials and Research Unit, Leeds and 2MRC Cancer Trials Office, Cambridge, UK INTRODUCTION Although it is not possible to pinpoint the exact date at which statistical methods were introduced into medical research, it was around the first quarter of this century. For more than 40 years, statisticians have assessed and criticized the misuse of statistical methods in the medical literature. In an effort to improve the quality of statistical reporting, several sets of guidelines have been introduced for various journals. Moreover, several journals have begun to incorporate statistical refereeing into their manu- script review process. Clinical Oncology began a policy of statistical review of all submitted manu- scripts in September 1993. This editorial summarizes the key issues authors should take into account in the reporting of statistical results and is based upon the experience of the Clinical Oncology statistical review process to date. The scope of this Editorial is deliberately limited to the main statistical issues found in the articles sub- mitted to Clinical Oncology, and should not be considered as a complete set of guidelines for manuscripts submitted to other journals. Authors submitting manuscripts that include more complex analyses should seek the advice of a statistician before submission. Moreover, since mistakes in design cannot be rectified at analysis it is always advisable to seek the advice of a statistician at the design stage of a research project. For a general introduction to medical statistics, authors may find the books by Altman [1] or Campbell and Machin [2] to be helpful. METHODS The purpose of the research should be clearly stated and hence the choice of the study design to answer the research question should be justified. In general, one of the most frequent omissions from this section is the justification for the number of subjects studied. Sample size calculations should be made pre-study. Correspondence and offprint requeststo: Dr J. Brown,Yorkshire Clinical Trials and Research Unit, CookridgeHospital, Leeds, L516 6QB, UK. In the absence of pre-study calculations post-hoc power calculations are of little value and should not be made. Goodman and Berlin [3] explain the logical inconsistency in post-hoc calculations, building on the analogy of 'trying to convince someone that buying a lottery ticket was foolish (the before- experiment perspective) after they have hit the jack- pot (the after-experiment perspective)'. The use of confidence.intervals in the results section will show more informatively the impact of the sample size upon the precision of an estimate of the effect size. The size of the study should be discussed, regardless of the type of design used, whether the research is a pilot study, survey, observational study, Phase II trial, Phase III trial or retrospective evaluation of prognostic factors. Fayers and Machin [4] provide an overview of the importance of sample size. The procedure for the selection of subjects should always be given, including inclusion and exclusion criteria, even in retrospective studies. Authors should also specify in detail the variables being measured, includ- ing the timing of these measurements, by whom they are being measured (blinded or unblinded), and how they are being measured. If a clinical trial is reported, then the method for allocation of subjects should be stated: for example, whether the randomization was stratified and/or blocked, how the randomization was generated, and who administered the randomization (research nurse or trials office). The use of sealed envelopes for randomization is generally not an efficient method and its use should be fully justified (a manuscript will not be rejected for this reason alone). If randomization has not been employed, the reasons for this should be given. All statistical methods used should be unambiguously identified. Techniques such as t-tests, simple chi-squared tests, and Wilcoxon and Mann-Whitney tests do not need to be described in detail. However, more complex analyses such as Cox proportional hazards modelling or Mantel Haenzel chi-squared test require expla- nation and a precise reference. In the case of analysis of survival data, survival analysis is based on the time from a relevant origin to an event of interest. There- fore, both the origin and the event should be clearly specified: for example, the period of time of interest is the time from randomization to date of first recurrence. If the event cannot be observed due, say, to loss of follow-up, then the patient's survival is said to be censored; any event that is to be treated as
Transcript of Statistics and clinical oncology

Clinical Oncology (1996) 8:71-74 © 1996 The Royal College of Radiologists
Editorial
Clinical Oncology
- 1
0Z y
Statistics and Clinical Onco logy
J. Brown 1 and D. Machin 2 1Yorkshire Clinical Trials and Research Unit, Leeds and 2MRC Cancer Trials Office, Cambridge, UK
INTRODUCTION
Although it is not possible to pinpoint the exact date at which statistical methods were introduced into medical research, it was around the first quarter of this century. For more than 40 years, statisticians have assessed and criticized the misuse of statistical methods in the medical literature. In an effort to improve the quality of statistical reporting, several sets of guidelines have been introduced for various journals. Moreover, several journals have begun to incorporate statistical refereeing into their manu- script review process. Clinical Oncology began a policy of statistical review of all submitted manu- scripts in September 1993. This editorial summarizes the key issues authors should take into account in the reporting of statistical results and is based upon the experience of the Clinical Oncology statistical review process to date.
The scope of this Editorial is deliberately limited to the main statistical issues found in the articles sub- mitted to Clinical Oncology, and should not be considered as a complete set of guidelines for manuscripts submitted to other journals. Authors submitting manuscripts that include more complex analyses should seek the advice of a statistician before submission. Moreover, since mistakes in design cannot be rectified at analysis it is always advisable to seek the advice of a statistician at the design stage of a research project. For a general introduction to medical statistics, authors may find the books by Altman [1] or Campbell and Machin [2] to be helpful.
METHODS
The purpose of the research should be clearly stated and hence the choice of the study design to answer the research question should be justified. In general, one of the most frequent omissions from this section is the justification for the number of subjects studied. Sample size calculations should be made pre-study.
Correspondence and offprint requests to: Dr J. Brown, Yorkshire Clinical Trials and Research Unit, Cookridge Hospital, Leeds, L516 6QB, UK.
In the absence of pre-study calculations post-hoc power calculations are of little value and should not be made. Goodman and Berlin [3] explain the logical inconsistency in post-hoc calculations, building on the analogy of 'trying to convince someone that buying a lottery ticket was foolish (the before- experiment perspective) after they have hit the jack- pot (the after-experiment perspective)'. The use of confidence.intervals in the results section will show more informatively the impact of the sample size upon the precision of an estimate of the effect size. The size of the study should be discussed, regardless of the type of design used, whether the research is a pilot study, survey, observational study, Phase II trial, Phase III trial or retrospective evaluation of prognostic factors. Fayers and Machin [4] provide an overview of the importance of sample size. The procedure for the selection of subjects should always be given, including inclusion and exclusion criteria, even in retrospective studies. Authors should also specify in detail the variables being measured, includ- ing the timing of these measurements, by whom they are being measured (blinded or unblinded), and how they are being measured. If a clinical trial is reported, then the method for allocation of subjects should be stated: for example, whether the randomization was stratified and/or blocked, how the randomization was generated, and who administered the randomization (research nurse or trials office). The use of sealed envelopes for randomization is generally not an efficient method and its use should be fully justified (a manuscript will not be rejected for this reason alone). If randomization has not been employed, the reasons for this should be given. All statistical methods used should be unambiguously identified. Techniques such as t-tests, simple chi-squared tests, and Wilcoxon and Mann-Whitney tests do not need to be described in detail. However, more complex analyses such as Cox proportional hazards modelling or Mantel Haenzel chi-squared test require expla- nation and a precise reference. In the case of analysis of survival data, survival analysis is based on the time from a relevant origin to an event of interest. There- fore, both the origin and the event should be clearly specified: for example, the period of time of interest is the time from randomization to date of first recurrence. If the event cannot be observed due, say, to loss of follow-up, then the patient's survival is said to be censored; any event that is to be treated as

72 J. Brown and D. Machin
censored should be given. Clear definitions of the endpoint should be provided: for example, in the analysis of deaths, whether deaths from any cause or cancer-related death are being considered, or, in the analysis of relapse-free survival, whether deaths without apparent relapse are treated as events or censored.
Most statistical techniques have assumptions underlying their use. Authors should indicate that these assumptions have been checked: for example, the normality of distributions of variables analysed with a t-test. One example of a thorough methods section is provided by Wheeler et al. [5].
For statistical analysis, it is sometimes useful to divide values of a continuous variable into categories. There are no generally accepted methods for categor- izing continuous variables. It is important to note that categorizing variables discards information. Categorization may also lose sensitivity, since it implies that there is a jump when there may be a continuous gradual change in the effect of a variable. It is usually preferable, therefore, to categorize variables into three or more groups rather than two groups, since this retains more information and allows some investigation into how an effect may change through the range of a variable. Authors could use groups, say, of equal size, aim to have a similar number of endpoints in each group, or aim to define clinically meaningful groups. The key point is that the splits are specified without examination of the data. Where variables are categorized, authors should include a justification for the particular categorization chosen.
RESULTS
Variables important for the validity and inter- pretation of the statistical results should be described via graphical methods or summary statistics. In any graphical display, axes and scales should be clearly labelled. A bar chart displays frequences in categor- ies and the bars should have spaces between them. Three-dimensional bar charts tend to confuse rather than display the data in an easily understandable format and should be avoided. A histogram shows the distribution of a continuous variable; frequencies are displayed for each integer or for equal sized and non-overlapping groups. A histogram, since it dis- plays continuous data, should not have gaps between bars as is standard with some software packages. For continuous data with a symmetrical distribution, means and standard deviations should be given unambiguously. For example, mean 10.6 mm, standard deviation 3.4 mm; the use of the + symbol attached to a mean should be avoided because it is unclear whether a standard deviation or a standard error is being given. For continuous data with an asymmetrical distribution, medians and the inter- quartile range are more appropriate. Proportions in each category should generally be reported for ordered categorical data. For categorical data such as quality of life scores, medians can be used to sum-
marize the data. For samples of less than 100, percentages should be given as integers; for samples greater than 100, they should be given to one decimal place. Means should be given to one significant figure more than the original data, and standard deviations to two more.
Presentation of the results should include the value of the test statistic, degrees of freedom where appro- priate, and the P-value to two significant figures. Two-sided tests should usually be used; if a one-sided test is used then this should be justified. All analyses undertaken should be noted. The analysis should be appropriate for the study design. For example, paired data such as that collected from a cross-over trial should be analysed using a paired statistical test. Statistical tests should evaluate a limited number of a priori hypotheses, as excessive or unstructured use casts doubt upon the credibility of the results. If multiple comparisons are unavoidable, then an appropriate adjustment to lower the significance level used should be made, such as the Bonferroni correction where the P-value should only be declared significant if it is less than the overall significance level chosen divided by the number of tests per- formed. For example, if ten statistical tests have been carried out and we have chosen a 5% significance level for our results overall, then each of the ten tests should be declared statistically significant at the 5% level if the P-value is less than 0.05/10=0.005. As a rule there should not be more variables than patients or more comparisons than patients.
Authors should give confidence intervals for the main summary measures (where appropriate). A wide confidence interval is a warning against over- interpretation of the results, whether the P-value indicates the result is statistically significant or not. A 95% confidence interval indicates that one is 95% confident that the true value of the effect lies within the interval (i.e. there is a 95% chance that the interval includes the true effect). In a comparative study, the confidence interval for the difference should be reported, not the individual intervals for each group separately. Authors should see Gardner and Altman [6] for details on calculating confidence intervals.
Generally, terms that have particular statistical meaning should be used only in their correct techni- cal context (e.g. 'correlation' should not be used as a general term to describe a relationship between two variables; 'parameter' should not be used instead of 'variable'). 'Significant' should never be used as a term on its own; it should always be clear whether statistical or clinical significance is being considered.
The type of data most frequently reported in Clinical Oncology is survival data. Comparison of survival data at arbitrary, fixed time points is gener- ally not as efficient as analysis using a life table approach, such as the Log-rank analysis. It is useful to summarize the median and range of the follow-up of subjects. The calculation of mean survival time is inadvisable in the presence of censoring and because survival data is usually asymmetrically distributed. Authors should include graphical presentation of the survival data to aid interpretation. Kaplan-Meier curves are a step function with both vertical and horizontal steps. The tail of a survival curve is
Statistics and Clinical Oncology 73
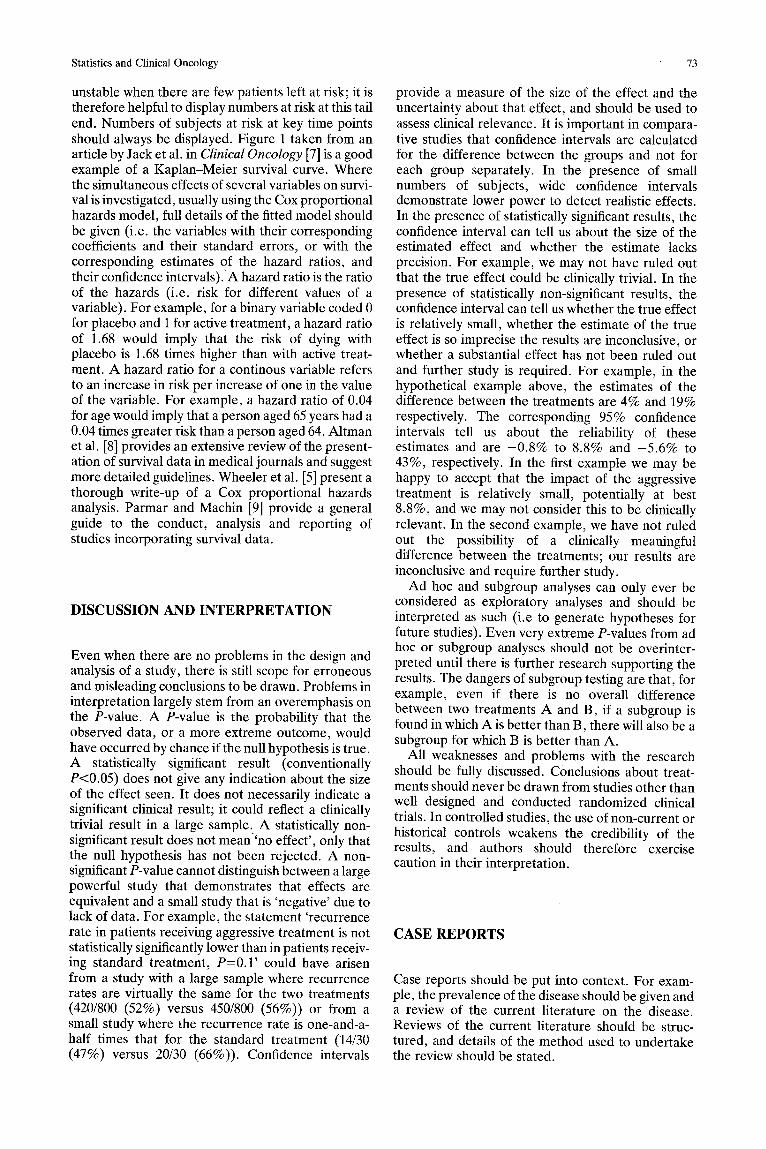
unstable when there are few patients left at risk; it is therefore helpful to display numbers at risk at this tail end. Numbers of subjects at risk at key time points should always be displayed. Figure 1 taken from an article by Jack et al. in Clinical Oncology [7] is a good example of a Kaplan-Meier survival curve. Where the simultaneous effects of several variables on survi- val is investigated, usually using the Cox proportional hazards model, full details of the fitted model should be given (i.e. the variables with their corresponding coefficients and their standard errors, or with the corresponding estimates of the hazard ratios, and their confidence intervals).A hazard ratio is the ratio of the hazards (i.e. risk for different values of a variable). For example, for a binary variable coded 0 for placebo and i for active treatment, a hazard ratio of 1.68 would imply that the risk of dying with placebo is 1.68 times higher than with active treat- ment. A hazard ratio for a continous variable refers to an increase in risk per increase of one in the value of the variable. For example, a hazard ratio of 0.04 for age would imply that a person aged 65 years had a 0.04 times greater risk than a person aged 64. Altman et al. [8] provides an extensive review of the present- ation of survival data in medical journals and suggest more detailed guidelines. Wheeler et al. [5] present a thorough write-up of a Cox proportional hazards analysis. Parmar and Machin [9] provide a general guide to the conduct, analysis and reporting of studies incorporating survival data.
DISCUSSION AND INTERPRETATION
Even when there are no problems in the design and analysis of a study, there is still scope for erroneous and misleading conclusions to be drawn. Problems in interpretation largely stem from an overemphasis on the P-value. A P-value is the probability that the observed data, or a more extreme outcome, would have occurred by chance if the null hypothesis is true. A statistically significant result (conventionally P<0.05) does not give any indication about the size of the effect seen. It does not necessarily indicate a significant clinical result; it could reflect a clinically trivial result in a large sample._ A statistically non- significant result does not mean 'no effect', only that the null hypothesis has not been rejected. A non- significant P-value cannot distinguish between a large powerful study that demonstrates that effects are equivalent and a small study that is 'negative' due to lack of data. For example, the statement 'recurrence rate in patients receiving aggressive treatment is not statistically significantly lower than in patients receiv- ing standard treatment, P=0.1' could have arisen from a study with a large sample where recurrence rates are virtually the same for the two treatments (420/800 (52%) versus 450/800 (56%)) or from a small study where the recurrence rate is one-and-a- half times that for the standard treatment (14/30 (47%) versus 20/30 (66%)). Confidence intervals
provide a measure of the size of the effect and the uncertainty about that effect, and should be used to assess clinical relevance. It is important in compara- tive studies that confidence intervals are calculated for the difference between the groups and not for each group separately. In the presence of small numbers of subjects, wide confidence intervals demonstrate lower power to detect realistic effects. In the presence of statistically significant results, the confidence interval can tell us about the size of the estimated effect and whether the estimate lacks precision. For example, we may not have ruled out that the true effect could be clinically trivial. In the presence of statistically non-significant results, the confidence interval can tell us whether the true effect is relatively small, whether the estimate of the true effect is so imprecise the results are inconclusive, or whether a substantial effect has not been ruled out and further study is required. For example, in the hypothetical example above, the estimates of the difference between the treatments are 4% and 19% respectively. The corresponding 95% confidence intervals tell us about the reliability of these estimates and are -0.8% to 8.8% and -5 .6% to 43%, respectively. In the first example we may be happy to accept that the impact of the aggressive treatment is relatively small, potentially at best 8.8%, and we may not consider this to be clinically relevant. In the second example, we have not ruled out the possibility of a clinically meaningful difference between the treatments; our results are inconclusive and require further study.
Ad hoc and subgroup analyses can only ever be considered as exploratory analyses and should be interpreted as such (i.e to generate hypotheses for future studies). Even very extreme P-values from ad hoc or subgroup analyses should not be overinter- preted until there is further research supporting the results. The dangers of subgroup testing are that, for example, even if there is no overall difference between two treatments A and B, if a subgroup is found in which A is better than B, there will also be a subgroup for which B is better than A.
All weaknesses and problems with the research should be fully discussed. Conclusions about treat- ments should never be drawn from studies other than well designed and conducted randomized clinical trials. In controlled studies, the use of non-current or historical controls weakens the credibility of the results, and authors should therefore exercise caution in their interpretation.
CASE REPORTS
Case reports should be put into context. For exam- ple, the prevalence of the disease should be given and a review of the current literature on the disease. Reviews of the current literature should be struc- tured, and details of the method used to undertake the review should be stated.

74 J. Brown and D. Machin
PHASE II/PILOT STUDIES References
Generally, the reporting of Phase II or pilot studies is poor. The same scientific rigour should be applied to the reporting of these studies as, say, to a Phase III randomized trial. In particular, details of the justifi- cation for the sample size, selection of patients, and statistical methods employed are still required. Priestman et al. [10] present a comprehensive report of a Phase II evaluation, and set a standard for the reporting of such, which should be followed.
CONCLUSION
Altman [11] suggests that the misuse of statistics is unethical. The ethical implications of substandard research are the misuse of patients, the misuse of resources and the consequences of publishing mis- leading results, which include the carrying out of further unnecessary work, or worse, unjustified changes in clinical practice. It is our hope that this Editorial will help to improve the reporting of statis- tical methods in Clinical Oncology, so that the findings of research projects can be communicated in a straightforward and informative manner.
1. Altman DG. Practical statistics for medical research. London: Chapman and Hall, 1991.
2. Campbell MJ, Machin D. Medical statistics: A commonsense approach. Chichester: Wiley, 1993.
3. Goodman SN, Berlin VA. The use of predicted confidence intervals when planning experiments and the misuse of power when interpreting results. Ann Intern Med 1994;121:200-6.
4. Fayers PM, Machin D. Sample size: How many patients are necessary? Br J Cancer 1995;72:1-9.
5. Wheeler JG, Machin D, Campbell MJ, et al. Does clinical experience with a treatment regimen affect survival of lung cancer patients? An analysis based on consecutive rando- mized trials of the Medical Research Council in small cell and non-small cell tumours. Clin Oncol 1994;6:81-90.
6. Gardner MJ, Altman DG. Estimating with confidence. In: Gardner MJ, Altman DG, editors. Statistics with confidence. London: British Medical Journal, 1989.
7. Jack WJL, Everington D, Rodger A, et al. Adjuvant therapy with 5-fluorouracil for breast cancer of likely poor prognosis: 15-year results of a randomized trial. Clin Oncol 1995;7:7-11.
8. Altman DG, De Stavola BL, Love SB, et al. Review of survival analyses published in cancer journals. Br J Cancer 1995;72:511-8.
9. Parmar MKB, Machin D. Survival analysis: A practical approach. Chichester: Wiley, 1995.
10. Priestman TJ, Bleehen NM, Rampling R, et al. A Phase II evaluation of human lymphoblastoid interferon (Welferon) in relapsed high grade malignant glioma. Clin Onco11993;5:165- 8.
11. Altman DG. Misuse of statistics is unethical. In: Gore S, Altman DG, editors. Statistics in practice. London: British Medical Association, 1982:21-4.