Statistical Vp-Vs relationships from well logs in Blackfoot€¦ · Statistical Vp-Vs relationships...
13
Contents Statistical relationship of Vp-Vs CREWES Research Report — Volume 10 (1998) 46-1 Statistical Vp-Vs relationships from well logs in Blackfoot Yong Xu and John C. Bancroft ABSTRACT The statistical relationships between compressional wave velocity (V P ) and shear wave velocity (V S ) are evaluated from dipole logs of four wells in the Blackfoot area. The derived relationships from linear regression analysis are compared with Castagna’s mud-rock line. INTRODUCTION A method was developed to look for the anomalies that deviate from the statistical relationship (Smith and Gidlow, 1987). In this method, the fluid factor is defined as S S P S P P V V V V V V F ∆ - ∆ = ∆ 16 . 1 (1) Derivation of equation (1) uses Castagna’s mud-rock line that is a statistical relationship between V P and V S (Castagna, et. al., 1985) and defined as 1360 16 . 1 + = S P V V , (2) where V P and V S are in m/sec. Equation (2) is widely referred by many authors, however, it should be tested when it is applied to a local area. If a locally generated relationship between V P and V S with a similar form to equation (2) or with other forms exists in the survey, then the fluid factor or fluid stack will take advantage of this relationship. In this paper, we analyze the dipole sonic logs that were collected in the Blackfoot area and attempt to evaluate the relationships between V P and V S . STATISTICAL RELATIONSHIP BETWEEN V P AND V S There are four wells with dipole sonic logs in the survey: 04-16, 08-08, 09-17, and 12-16. Figure 1 shows the location of wells including the four wells listed above. The map also shows the 3C-2D seismic line 950278 and the incised valley isopach. The wells investigated have different depth intervals for the dipole sonics. The 04-16 well has a dipole sonic from the top to the bottom, while the other three have dipoles in the zone of interest. The following table lists the top and bottom depths of the dipole logs of each well.
-
Upload
nguyenthuan -
Category
Documents
-
view
219 -
download
4
Transcript of Statistical Vp-Vs relationships from well logs in Blackfoot€¦ · Statistical Vp-Vs relationships...
Contents
Statistical relationship of Vp-Vs
CREWES Research Report — Volume 10 (1998) 46-1
Statistical Vp-Vs relationships from well logs in Blackfoot
Yong Xu and John C. Bancroft
ABSTRACT
The statistical relationships between compressional wave velocity (VP) and shearwave velocity (VS) are evaluated from dipole logs of four wells in the Blackfoot area.The derived relationships from linear regression analysis are compared withCastagna’s mud-rock line.
INTRODUCTION
A method was developed to look for the anomalies that deviate from the statisticalrelationship (Smith and Gidlow, 1987). In this method, the fluid factor is defined as
S
S
P
S
P
P
V
V
V
V
V
VF
∆−
∆=∆ 16.1 (1)
Derivation of equation (1) uses Castagna’s mud-rock line that is a statisticalrelationship between VP and VS (Castagna, et. al., 1985) and defined as
136016.1 += SP VV , (2)
where VP and VS are in m/sec.
Equation (2) is widely referred by many authors, however, it should be tested whenit is applied to a local area. If a locally generated relationship between VP and VS witha similar form to equation (2) or with other forms exists in the survey, then the fluidfactor or fluid stack will take advantage of this relationship.
In this paper, we analyze the dipole sonic logs that were collected in the Blackfootarea and attempt to evaluate the relationships between VP and VS.
STATISTICAL RELATIONSHIP BETWEEN VP AND VS
There are four wells with dipole sonic logs in the survey: 04-16, 08-08, 09-17, and12-16. Figure 1 shows the location of wells including the four wells listed above. Themap also shows the 3C-2D seismic line 950278 and the incised valley isopach. Thewells investigated have different depth intervals for the dipole sonics. The 04-16 wellhas a dipole sonic from the top to the bottom, while the other three have dipoles in thezone of interest. The following table lists the top and bottom depths of the dipole logsof each well.

Contents
Xu, and Bancroft
46-2 CREWES Research Report — Volume 10 (1998)
Table 1 . The top depth and bottom depth of the dipole logs of the four wells, 04-16, 08-08, 09-17, and 12-16
Well name Top (meters) Bottom (meters)
04-16 135 1647
08-08 1362 1674
09-17 1440 1651
12-16 1229 1629
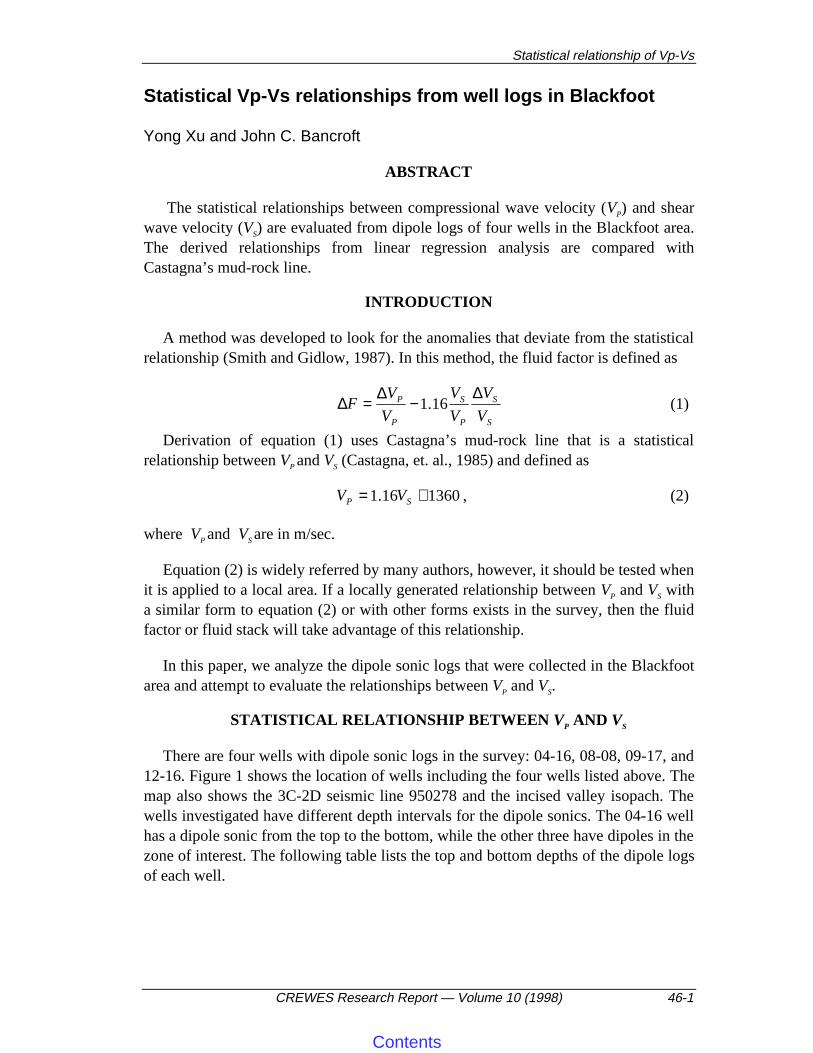
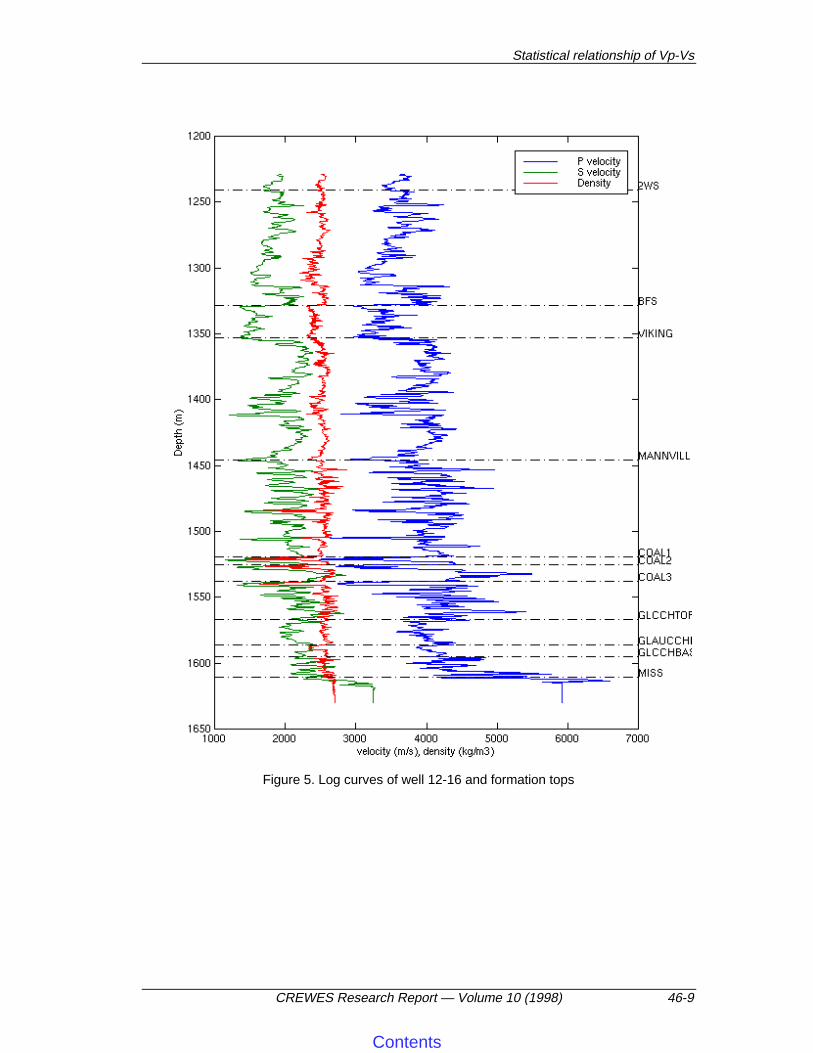
The compressional wave velocity, shear wave velocity, and bulk density areplotted respectively on Figures 2-5 for four wells. The formation tops are plotted onthe well log curves. In this analysis, the samples to be used for each well are selectedcarefully. Each well has touched Mississippian carbonate, but the data below theMississippian formation are not used in this analysis. Samples with extremely high orlow velocity values are not used. For example, on Figure 3, at depth of 1600 meters,the VP is extremely high, but the Vs is normal. This small portion is not reasonable tobe used in the analysis. Consequently, the VP value is limited to 1570 - 5000 m/secand shear wave velocity is limited to 500 - 3500 m/sec.
Castagna’s mud-rock line equation (2) fits a great variety of rocks very well. Thisis can be seen on Figure 6 which is adapted from the paper of Castagna et. al. (1985).In our analysis, only one trend line is attempted to be derived for the selected samplesand no further analysis is done by differentiating lithology of the selected samples.
The cross-plots of VP and VS for the 04-16 well are shown on Figure 7 and 8. OnFigure 7, all selected samples above the Mississippian formation are plotted, and thelinear regression relationship is as the following equation:
120530.116041604
+=−− AA SP VV (3)
On Figure 8, the analysis is limited to the deep portion. The selected data aboveMississippian and below 1000 meters is plotted and the linear relationship is found tobe:
115034.116041604
+=−− BB SP VV (4)
The cross plots on Figure 7 and 8 for the 04-16 well show good linear relationshipsbetween VP and VS on both full logs and deep portion logs. However, the slope of thelinear relationship for the deep portion is slightly larger than the slope obtained fromfull logs. The former is 1.34, and the latter is 1.30. The intercepts of both equationsalso are slightly different. The intercept of equation (3) is 1205, and that of equation(4) is 1150.

Contents
Statistical relationship of Vp-Vs
CREWES Research Report — Volume 10 (1998) 46-3
The Castagna's mud-rock line equation is plotted both on Figure 7 and 8. It can beseen that the selected samples with smaller value for VP (2500m/s - 4000m/s) andsmaller value for VS (1000m/s - 2000m/s) fit mud-rock line fairly well and thesamples with higher VP and higher VS are deviated from mud-rock line. Equation (3)fits mud-rock line better than equation (4). Because equation (4) is derived from thedeep portion, we can say that the samples from the shallow portion (above 1000m) ofthe 04-16 well fit mud-rock line better than samples from the deeper portion.
Figure 9 cross-plots VP versus Vs for the 08-08 well. The samples above theMississipian formation, except the samples with very high P-velocity and the sampleswithin coal layers, are plotted on the figure. On the 08-08 well, there is hydrocarbonindication on the Glauconitic channel zone from 1552.5m to 1595m. The VP/VS ratio islow over this portion. On Figure 8, the samples with low VP/VS on the Glauconiticchannel zone are circled. The circled samples are separated from other samples on theVP-VS cross-plot. The trend-line for all selected samples is plotted on this figure, andits equation is
191595.008080808
+=−− SP VV . (5)
This equation has smaller slope and higher intercept than Castagna's mud-rock linethat is drawn on Figure 9. Due to the samples on the channel zone, equation (5) doesnot reflect the trend of the samples that fall outside of the Glauconitic channel zone.The mud-rock line does not reflect the VP-VS relationship for the samples that falloutside of the Glauconitic channel zone.
Figure 10 shows the VP-VS cross plot and the fitted trend line for the 09-17 well.The samples show a linear trend on the figure. The equation for the trend is
27274.117091709
+=−− SP VV . (6)
Equation (6) has a bigger slope than Castagna's mud-rock line equation, and has amuch smaller intercept. It can be seen that the mud-rock line is not as good asequation (6) to show the trend of the selected samples on Figure 10.
Figure 11 shows the VP-VS relationship for the 12-16 well. The statisticalrelationship is
191597.016121612
+=−− SP VV . (7)
On Figure 11, the samples show a linear trend between VP and VS. The slope ofequation (7) is smaller than the slope of mud-rock line. And the intercept of equation(7) is bigger than that of mud-rock line equation. The mud-rock line equation is alsodrawn on this figure. It can be seen that most of the selected samples fall above themud-rock line.
All VP-VS samples from the four wells are cross-plotted on Figure 12. The linearrelationship is

Contents
Xu, and Bancroft
46-4 CREWES Research Report — Volume 10 (1998)
128226.1 +=allall SP VV . (8)
Compared with equations (4)-(7), the slope and the intercept of equation (8) are closerto the slope and the intercept of mud-rock line equation. This suggests that thepopulation for statistical analysis in the 08-08, 09-17, and 12-16 wells is too small,and a larger population is needed to compare to the mud-rock equation. However, onFigure 12, many samples with higher VP (VP > 3300m/s) and higher VS (VS > 1700m/s)deviate from the mud-rock line.
CONCLUSIONS
The statistical relationships between VP and VS were obtained by linear regressionanalysis of four wells with dipole sonic logs in the Blackfoot field. The relationshipsare compared with Castagna's mud-rock equation. The 04-16 well shows good linearrelationships between VP and VS. Samples on the reservoir channel zone on the 08-08well show a large deviation from the statistical trend. Three wells, 08-08, 09-17, and12-16, were edited to eliminate abnormal portions and they show different fittedtrends from each other and from the 04-16 well. These differences may reflect thesubsurface lithology changes and poorly sampled populations. The available logportion lengths and the data quality may also affect the fitted trends and cause thestatistical trend differences. To obtain a reliable relationship between VP and VS, morecareful interpretation of the well logs and more wells where longer dipole sonics existare required. All derived trend lines for each well have differences from Castagna'smud-rock line equation. It is observed from the large population analysis of the 04-16well that the samples with lower velocity fit Castagna's mud-rock line better and thesamples with higher velocity deviate from mud-rock line.
ACKNOWLEDGMENTS
We would like to thank the sponsors of CREWES Project. We would also like tothank Colin Potter for his suggestions and corrections for the paper.
REFERENCES
Castagna, J. P., Batzle, M. L. and Eastwood, R. L., 1985, Relationship between compressional waveand shear wave velocities in clastic silicate rocks: Geophysics, V. 50, 571 - 581.
Miller, S. L. M., Aydemir, E. O., and Margrave, G. F., 1995, Preliminary interpretation of P-P and P-Sseismic data from the Blackfoot broad-band survey: CREWES Research Report 1995,Chapter 42.
Smith, G. C., and Gidlow, P. M., 1987, Weighted stacking from rock property estimation and detectionof gas: Geophys. Prosp. 35, 993-1014.

Contents
Statistical relationship of Vp-Vs
CREWES Research Report — Volume 10 (1998) 46-5
04-16
08-08
12-16
09-17
Figure 1. Location map of 3C-2D seismic line 950278, well control and the incised valleyisopach (Miller et. al., 1995)
Contents
Xu, and Bancroft
46-6 CREWES Research Report — Volume 10 (1998)
Figure 2. Log curves of well 04-16 and formation tops

Contents
Statistical relationship of Vp-Vs
CREWES Research Report — Volume 10 (1998) 46-7
Figure 3. Log curves of well 08-08 and the formation tops
Contents
Xu, and Bancroft
46-8 CREWES Research Report — Volume 10 (1998)
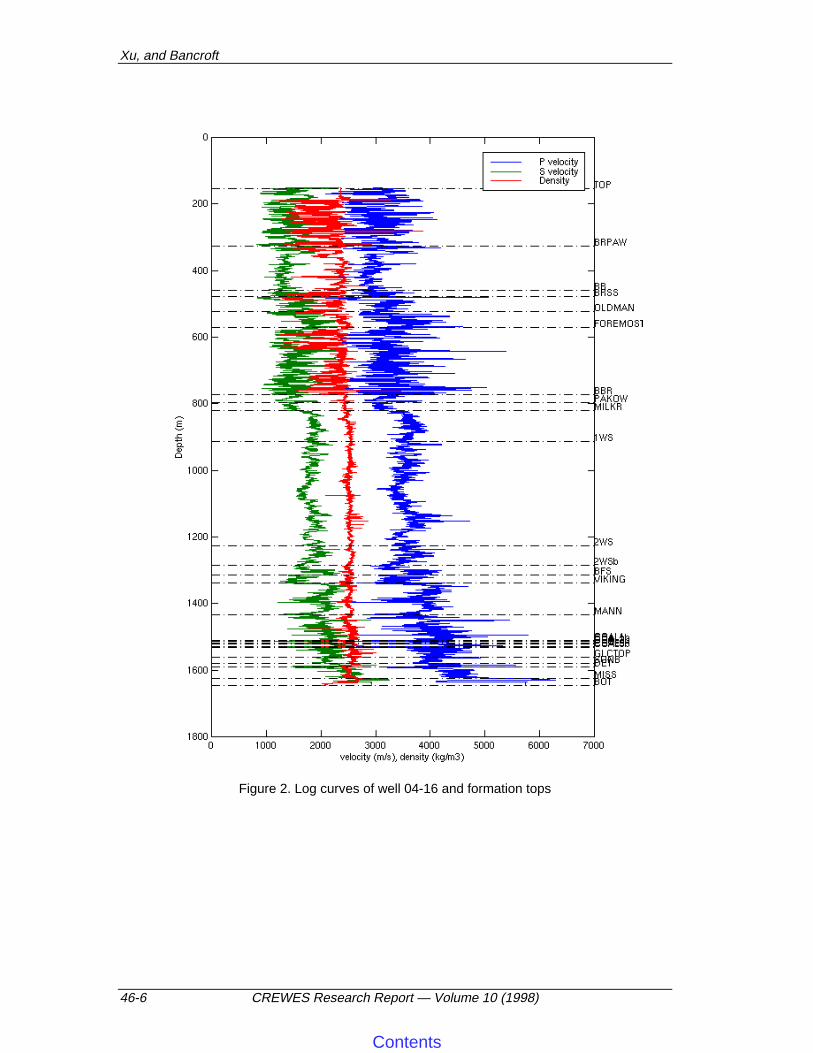
Figure 4. Log curves of well 09-17 and formation tops
Contents
Statistical relationship of Vp-Vs
CREWES Research Report — Volume 10 (1998) 46-9
Figure 5. Log curves of well 12-16 and formation tops

Contents
Xu, and Bancroft
46-10 CREWES Research Report — Volume 10 (1998)
Figure 6. Compressional and shear wave velocities for mud-rocks from in-situ sonic and fieldseismic measurements (Castagna et. al., 1985)

Contents
Statistical relationship of Vp-Vs
CREWES Research Report — Volume 10 (1998) 46-11
Figure 7. Cross-plot of Vp and Vs of well 04-16 (all data above Mississippian formation)
Figure 8. Cross-plot of Vp and Vs of well 04-16 (portion below 1000 meters and aboveMississippian formation)
Vp=1.30Vs+1205
Vp=1.34Vs+1150
Castagna's mud-rock lineVp=1.16Vs+1360
Castagna's mud-rock lineVp=1.16Vs+1360

Contents
Xu, and Bancroft
46-12 CREWES Research Report — Volume 10 (1998)
Figure 9. Cross-plot of Vp and Vs of well 08-08 (portion below 1000 meters and aboveMississippian formation)
Figure 10. Cross-plot of Vp and Vs of well 09-17 (above Mississippian formation)

Contents
Statistical relationship of Vp-Vs
CREWES Research Report — Volume 10 (1998) 46-13
Figure 11. Cross-plot of Vp and Vs of well 12-16 (portion above Mississippian formation)
Figure 12. Cross-plot of Vp and Vs of four wells (portion above Mississippian formation)
Vp=1.26Vs+1282
Castagna's mud-rock lineVp=1.16Vs+1360