Statistical tools in research
16
Statistical Tools used in Research Submitted to: Dr. Bhagwan Singh Submitted By: Subhrat Sharma CUHP13MBA85 Central University of Himachal Pradesh
-
Upload
shubhrat-sharma -
Category
Data & Analytics
-
view
382 -
download
0
Transcript of Statistical tools in research

Statistical Tools used in Research
Submitted to:
Dr. Bhagwan Singh
Submitted By:
Subhrat Sharma
CUHP13MBA85
Central University of Himachal Pradesh
Statistics Defined Correlation Hypothesis
•Hypothesis : Alpha
•Hypothesis : Beta
Chi-Square Test of Independence
Regression analysis
Factor Analysis References

Statistics is the science and practice of developing human knowledge through the use ofempirical data expressed in quantitative form. It is based on statistical theory which is a branchof applied mathematics. Within statistical theory, randomness and uncertainty are modelled byprobability theory. (Wikipedia Encyclopaedia)
What is statistics?
The collecting, summarizing, and analysing of data.
The term also refers to raw numbers, or “stats”, and to the summarization of data.
Example: Frequencies

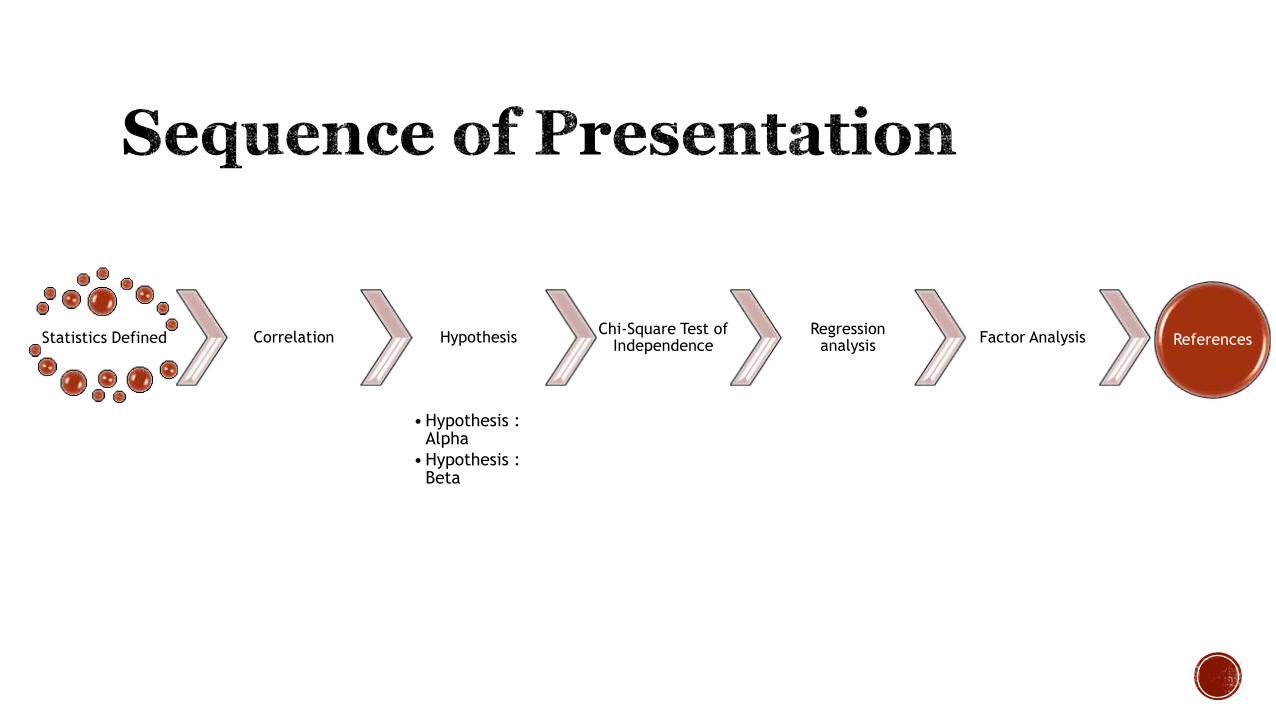
Allows an examination of the relationship between variables; is there a relationship between these variables? Are they positively or negatively related?
A correlation coefficient of 0 means that there is no relationship between the variables, -1 negative relationship, 1 positive relationship.
Important: Correlation is not causation.
• "Correlation Is Not Causation" ... which says that a correlation does not mean that one thing causes the other (there could be other reasons the data has a good correlation).
Ex. What is the relationship between exercise and depression?
•Does depression increase when exercise increases?
•Does depression decrease when exercise increases?
• Is there no significant correlation between exercise and depression?
Correlation is Positive when the values increase together, and
Correlation is Negative when one value decreases as the other increases

Null hypothesis: A hypothesis put forward to argue that a relationship or pattern does not exist.
•Cholesterol study example: In a Randomized Control Trial, the control group and the treatment group have equal levels of cholesterol at the end of a study.
•Null hypothesis: Groups A and B are equal.
•Denoted by Ho:
Alternative Hypothesis: Statement of what study is set to establish.
•Alternative Hypothesis: Groups A and B have different levels of cholesterol.
•Denoted by H1:
The null hypothesis will be true if the findings are insignificant.
The null hypothesis will be false if the findings are significant.
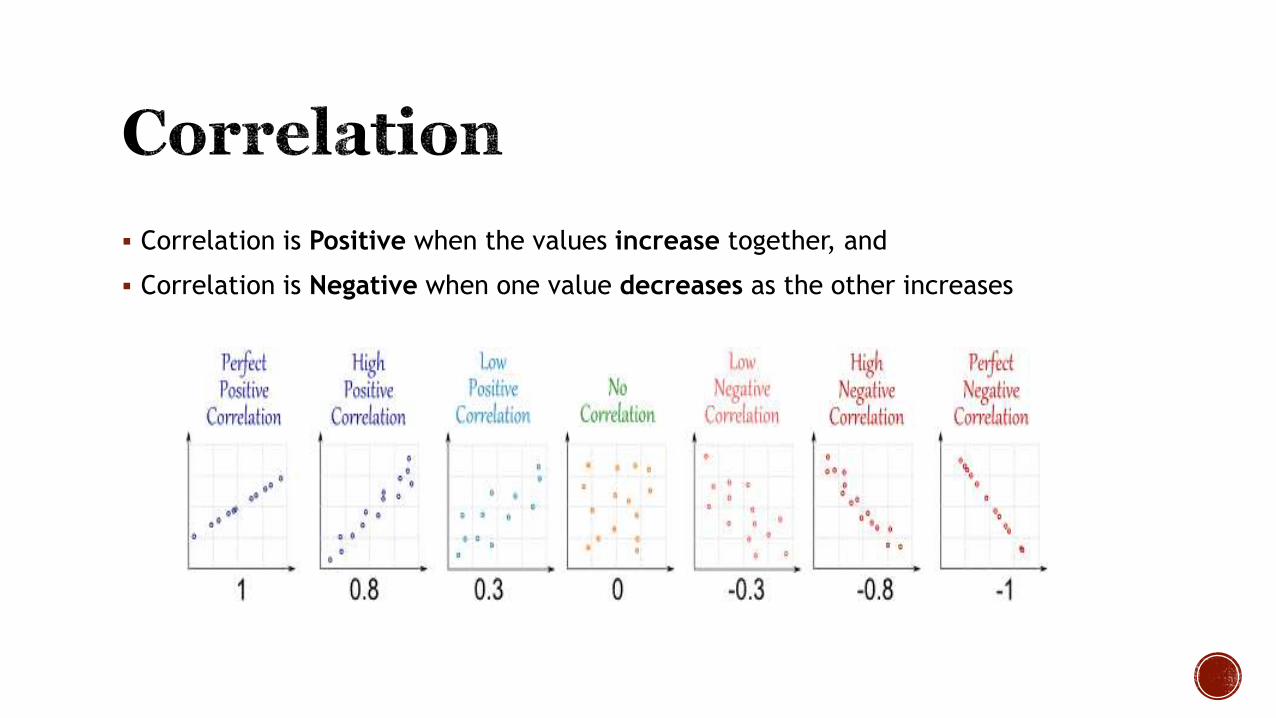
Alpha level, or significance level, is the value that is determined by the researcher in order to reject or retain thenull hypothesis. It is a pre-determined value, not calculated.
• In other words, if we select a value of .05, findings would be deemed statistically significant if they werefound to be .05 or less.
What does this mean?
• Alpha indicates the probability that the null hypothesis will be rejected when it is true (in otherwords, the null hypothesis is wrongly rejected).
This is called Type 1 error or alpha error
E.g. in a trial of new Drug X, the null hypothesis might be that the new Drug X is no betterthan the current Drug Y.
• H0: there is no difference between Drug X and Drug Y.
• A Type 1 error would occur if we concluded that the two drugs
• produced different effects when there was no difference between them.

Beta is the probability of
making a Type 2 error when testing a
hypothesis.
Type 2 error is failing to detect an association
when one exists, or failing
to reject the null hypothesis
when it is actually false.
You kept the null hypothesis
when you should not
have.
If Drug X and Drug Y
produced different
effects, and it was concluded
that they produce the
same effects.
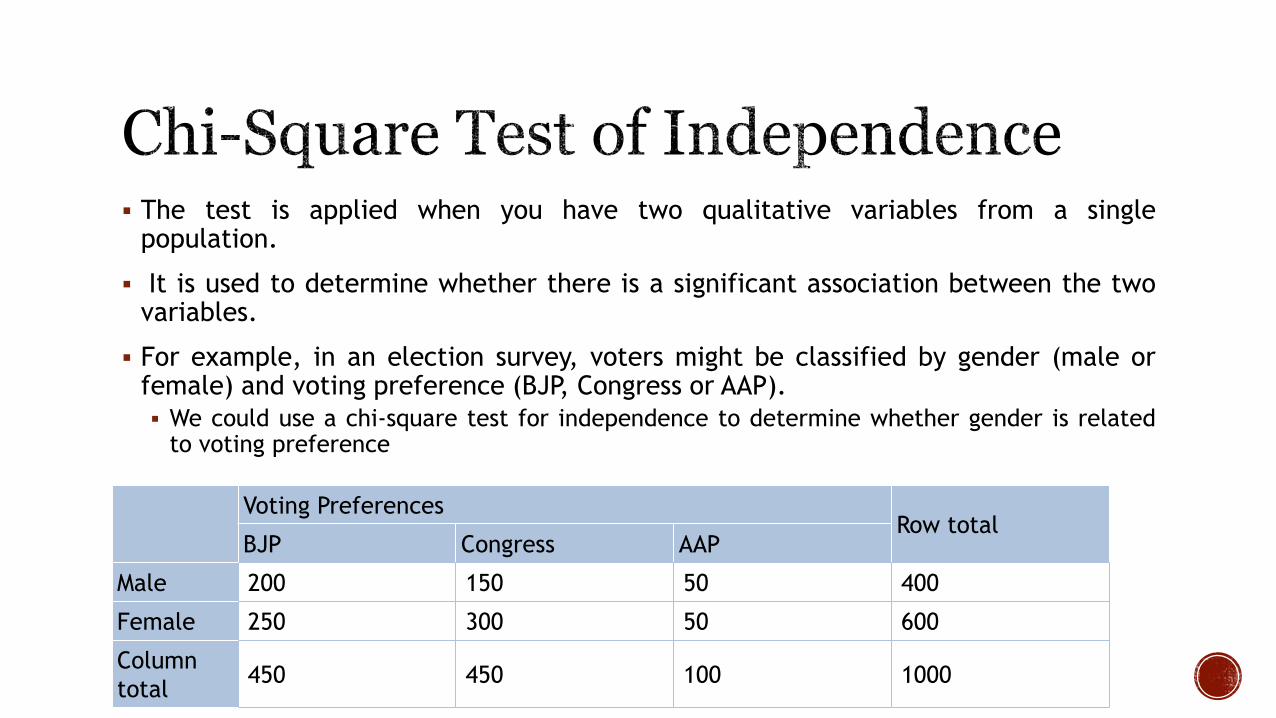
The test is applied when you have two qualitative variables from a singlepopulation.
It is used to determine whether there is a significant association between the twovariables.
For example, in an election survey, voters might be classified by gender (male orfemale) and voting preference (BJP, Congress or AAP).
We could use a chi-square test for independence to determine whether gender is relatedto voting preference
Voting PreferencesRow total
BJP Congress AAP
Male 200 150 50 400
Female 250 300 50 600
Column
total450 450 100 1000

When to Use Chi-Square Test for Independence
• The test procedure described in this lesson is appropriate when the following conditions are met:
• The sampling method is simple random sampling.
• Each population is at least 10 times as large as its respective sample.
• The variables under study are each categorical.
• If sample data are displayed in a contingency table, the expected frequency count for each cell of the table is at least 5.

Regression analysis is used when you want to predict a continuous dependent variable from a number of independent variables.
Regression analysis is widely used for prediction and forecasting.
Classical assumptions for regression analysis include:
•The sample is representative of the population for the inference prediction.
•The error is a random variable with a mean of zero conditional on the explanatory variables.
•The independent variables are measured with no error.
•The predictors are linearly independent, i.e. it is not possible to express any predictor as a linear combination of the others.
•The errors are uncorrelated, that is, the variance–covariance matrix of the errors is diagonal and each non-zero element is thevariance of the error.
•The variance of the error is constant across observations (homoscedasticity). If not, weighted least squares or other methodsmight instead be used.
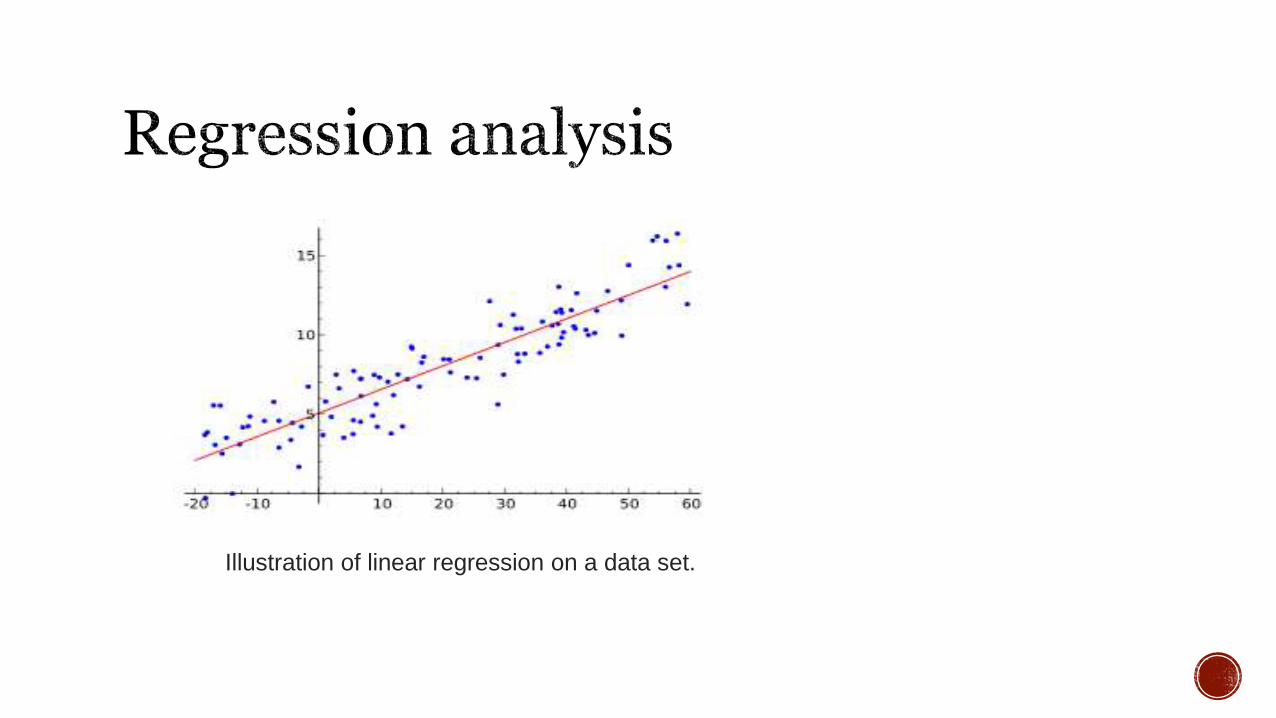
Illustration of linear regression on a data set.
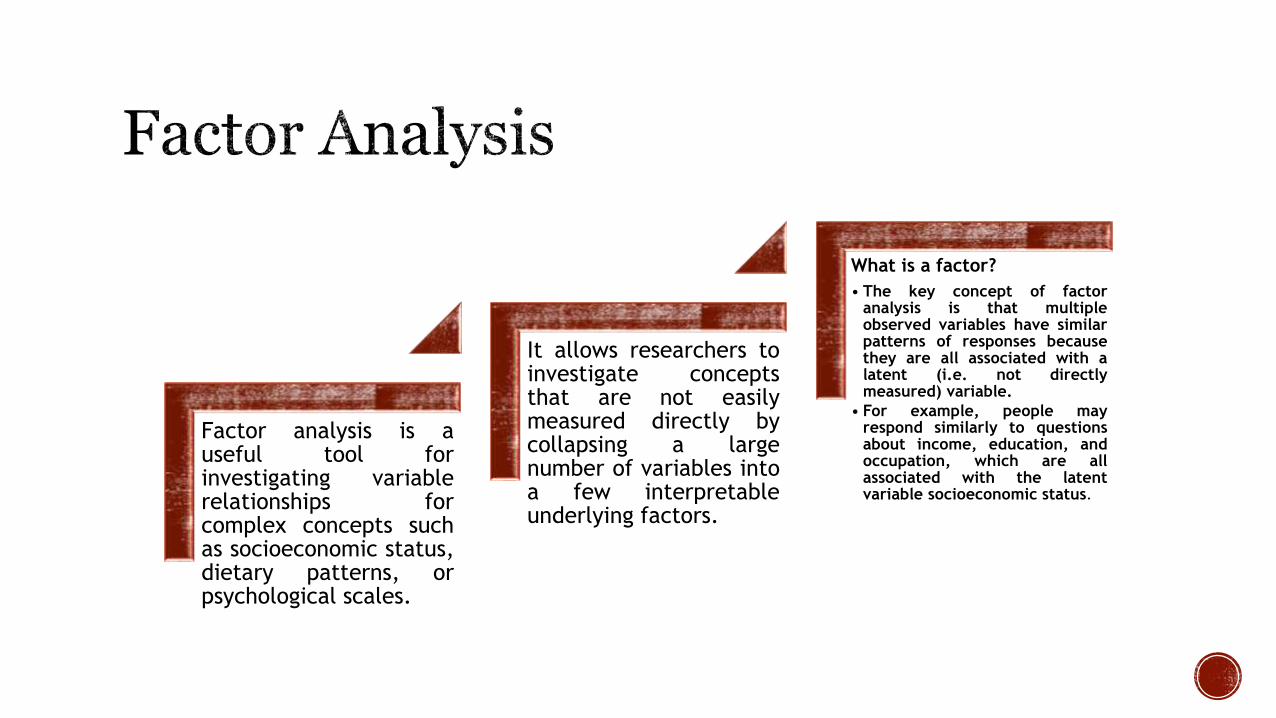
Factor analysis is auseful tool forinvestigating variablerelationships forcomplex concepts suchas socioeconomic status,dietary patterns, orpsychological scales.
It allows researchers toinvestigate conceptsthat are not easilymeasured directly bycollapsing a largenumber of variables intoa few interpretableunderlying factors.
What is a factor?
• The key concept of factoranalysis is that multipleobserved variables have similarpatterns of responses becausethey are all associated with alatent (i.e. not directlymeasured) variable.
• For example, people mayrespond similarly to questionsabout income, education, andoccupation, which are allassociated with the latentvariable socioeconomic status.

Variables Factor 1 Factor 2Income 0.65 0.11Education 0.59 0.25Occupation 0.48 0.19House value 0.38 0.60Number of public parks in
neighborhood0.13 0.57
Number of violent crimes per year in
neighbourhood0.23 0.55
Indicators of wealth, with six variables and two resulting factors.

• The variable with the strongest association to the underlying latent variable. Factor1, is income, with a factor loading of 0.65.
• Since factor loadings can be interpreted like standardized regression coefficients,one could also say that the variable income has a correlation of 0.65 with Factor 1.This would be considered a strong association for a factor analysis in most researchfields.
• Two other variables, education and occupation, are also associated with Factor 1.Based on the variables loading highly onto Factor 1, we could call it “Individualsocioeconomic status.”
• Notice that the variable house value also is marginally important in Factor 1(loading = 0.38). This makes sense, since the value of a person’s house should beassociated with his or her income.

http://dss.princeton.edu/online_help/analysis/regression_intro.htm
http://stattrek.com/chi-square-test/independence.aspx
http://www.statsoft.com/Textbook/Principal-Components-Factor-Analysis
http://www.theanalysisfactor.com/factor-analysis-1-introduction/
http://mathworld.wolfram.com/HypothesisTesting.html
https://www.mathsisfun.com/data/correlation.html