Statistical Quality Control, 7,5 hp
19
Statistical Quality Control, 7,5 hp MVE145/MSG600 Ulla Blomqvist Senior Lecturer at the department of Mathematical Sciences
Transcript of Statistical Quality Control, 7,5 hp

Statistical Quality Control, 7,5 hp
MVE145/MSG600
Ulla Blomqvist
Senior Lecturer at
the department of
Mathematical Sciences

Introduction
What is quality? - The quality of a product or a service is its ability to satisfy customer needs and expectations. - The quality given by the specification of the product. - The degree of conformance between the product and its specifications.
History
- The Babylonian king Hammurabi (about 1750 BC) stated 282 paragraphs of law called Codex Hammurabi. These are written in Cuneiform script
“ If a building falls into pieces and the owner because of this
gets killed the builder also shall be killed. If one of the owner’s children is killed, one of the builder’s children shall be killed….

Egyptian inspector supervising the making of building blocks intended for a pyramid 4000 years ago. The Romans built a bridge in south of France known as
Pont du Gard. It is older than 2000 years. The bridge - which is 275 m long and 50 m high – is probably the largest bridge that the Romans ever built. It can stand a wind speed of 215 km/h. The strongest winds in this area have a speed of at most 100 km/h. The Romans had about 200 years of experience building semicircular arch when they built the bridge. One can only imagine all improvements they had to do during these years.

Walter Shewhart Trained in engineering and physics Long career at Bells Labs Developed the first control chart about 1924
William Edwards Deming Long career in government statistics, Bureau of Census Sent to Japan to work on the census
http://www.youtube.com/watch?v=mKFGj8sK5R8&feature=related
Kaoru Ishikawa Kawasaki Steel Works Ishikawa diagram 1943
Taiichi Ohno Toyota Just-in-Time

Shewhart cycle or Deming cycle
Used in Six Sigma

Quality costs Sörqvist: “Those costs which would disappear if the
company´s products and processes were perfect”
10-30% of a typical company turnover
Statistical Methods
1 Statistical process control (SPC) - Control charts, plus other problem-solving tools - Useful in monitoring processes, reducing variability through elimination of assignable causes - On-line technique
2 Designed experiments (DOX) - Discover the key factors that influence process performance - Process optimization - Off-line technique
3 Acceptance sampling

Variables and data
- Number of……
- Weight (kg)
- Function (yes/no)
Different methods for different types of data
Variable
Quantitative
Discrete
Continuous
Qualitative

Data reduction – a model
Why use measurements
Data reduction
variation
location
x
Many individuals - Difficult to see the entire situation - Exact knowledge
A few individuals - Easy to understand the entire situation - Exact knowledge is lost - Possible to make comparisons


Histogram Random samples
Random samples

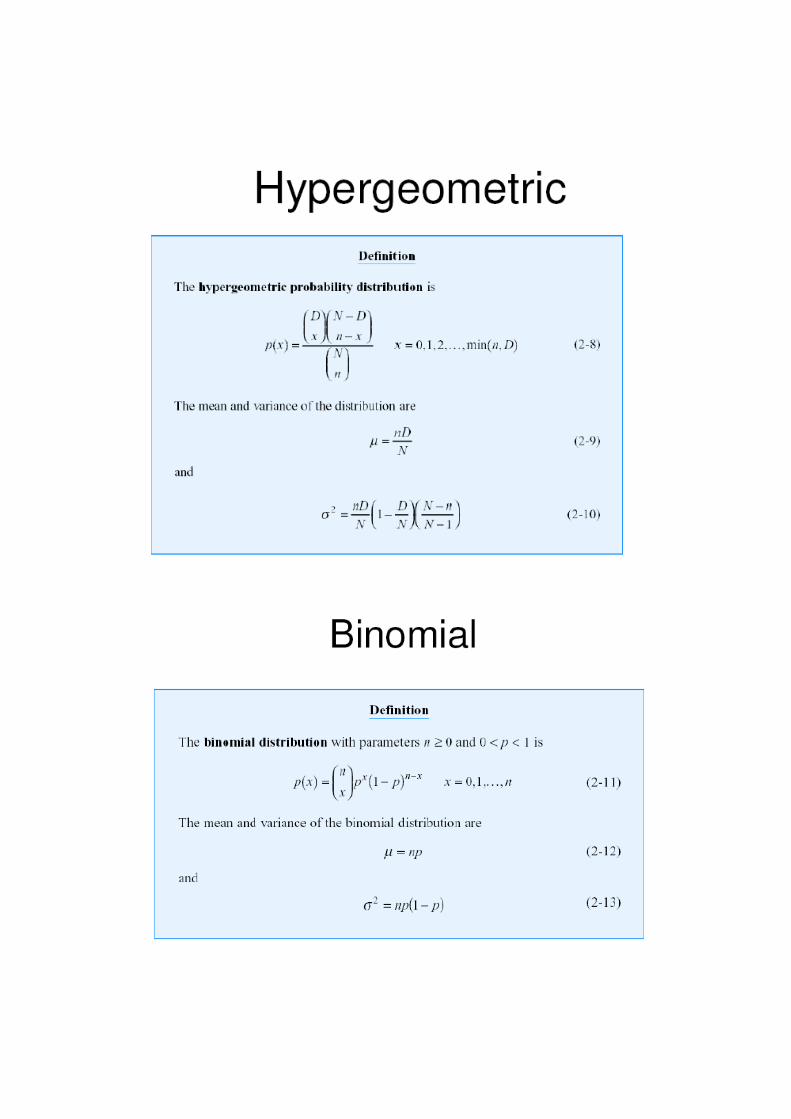


Models of data
“All models are wrong but some are useful” (George Box 1977)
Use the right model:
� Answer interesting questions � Valid under the conditions it was
developed!