STATISTICAL INFORMATION ON NEPALESE...
222
STATISTICAL INFORMATION ON NEPALESE AGRICULTURE 2013/2014 (2070/071) Government of Nepal Ministry of AgriculturalDevelopment Agri Business Promotion and Statistics Division Agri statistics Section Singha Durbar, Kathmandu Nepal
Transcript of STATISTICAL INFORMATION ON NEPALESE...
STATISTICAL INFORMATION
ON
NEPALESE AGRICULTURE 2013/2014(2070/071)
Government of Nepal
Ministry of AgriculturalDevelopment
Agri Business Promotion and Statistics Division
Agri statistics SectionSingha Durbar, Kathmandu
Nepal
Publisher:
Government of Nepal
Ministry of Agricultural Development
Agribusiness Promotion and Statistics Division
Agri Statistics section
Singha Durbar, Kathmandu
Nepal
Phone: 4211687
Fax : 977 1 4211839
E mail: [email protected]
December, 2014
Printed, 500 copies
Printed
Triveni chhapakhanaBagdol, Lalitpur
Mob.9851087966
FOREWORD
Ministry of Agricultural Development (MOAD), Agri Business Promotion and Statistics
Division (ABPSD), Agri Statistics Section as part of its regular function, has been publishing
"Statistical Information on Nepalese Agriculture" on yearly basis with the aim of providing
better and useful agricultural information of the country. It is hoped that this document,
which is presented in comprehensive way encompassing updated data and information
relating to Nepal's agricultural sector and other sectors related to it, will be of value in order
to fulfill some of the basic requirements for agricultural planning, monitoring and policy
making issues as well as food security related aspects of the country.
The report is prepared on the basis of the information received from the various units under
the Ministry of Agriculture Development from field to the centre as Department of
Agriculture, Department of Livestock Services, Department of Cooperatives, Department of
Food Technology & Quality Control, Nepal Agricultural Research Council and other related
governmental as well as non governmental agencies.
The Ministry is thankful to all stakeholders for their valuable contributions in preparing the
2012/2013 report.
I would like to extend my sincere appreciation to Joint Secretary Dr. Dinesh Prasad Parajuli
for his overall guidance in preparing this report. Senior Statistical Officer Hem Raj Regmi,
Agri Economist Badri Khanal and other staff members of the division are also thankful for
their technical contribution in bringing out this issue in time.
I welcome suggestions and comments from the users for further improvement of this
publication.
Jaya M Khanal
Secretary
December, 2014 Ministry of Agricultural Development

PREFACE
With a view to provide comprehensive statistical information on agriculture as well as other
related variables, the "Statistical Information on Nepalese Agriculture, 2013/14" is being
prepared and published by the Agri Statistics section, Agri Business Promotion and Statistics
Division, Ministry of Agricultural Development (MOAD).
The contents in this edition are Pre estimation of micro (district) level statistics on cereal
crops, cash crops, pulses, livestock, poultry, fishery and horticulture. Efforts are also made to
incorporate available statistics on population, irrigation, inputs, credit, prices, edible cereal
grain production and requirement (food security aspects), released crop varieties, export
and import of some agriculture commodities, meteorological information etc, in order to
provide maximum possible information of Nepalese agriculture. It is anticipated that this
report as usual will be useful especially to those who are involved in planning, research and
overall economic development of the country.
I would like to express my sincere appreciation to Senior Statistical Officer, Mr. Hem Raj
Regmi for his over all guidance in preparing the report. Agriculture Economist Mr. Badri
Khanal who has provided valuable contribution in bringing out this issue in this format and in
anticipated time. I deeply acknowledge his efforts and sincerity.
I would also like to acknowledge the staffs of district offices, Department of Livestock
Services, Department of Agriculture, Department of Co operatives, Department of Food
Technology & Quality Control, Nepal Agricultural Research Council, Agri Input Unit of MOAD
and other governmental & non governmental agencies for their support in providing the
necessary information.
I would also like to thank Agriculture Economists Mr. Rudra Prasad Khanal, Mr. Kamal
Prasad Acharya, and Mr. Amrit B. Bhattarai for their consistent efforts on collection,
compilation and editing of the data.
Valuable comments and suggestions from the users are most welcome for further
improvement of this publication.
Dinesh Prasad Parajuli (PhD)
December, 2014 Joint Secretay
Agri Business Promotion and Statistics Division

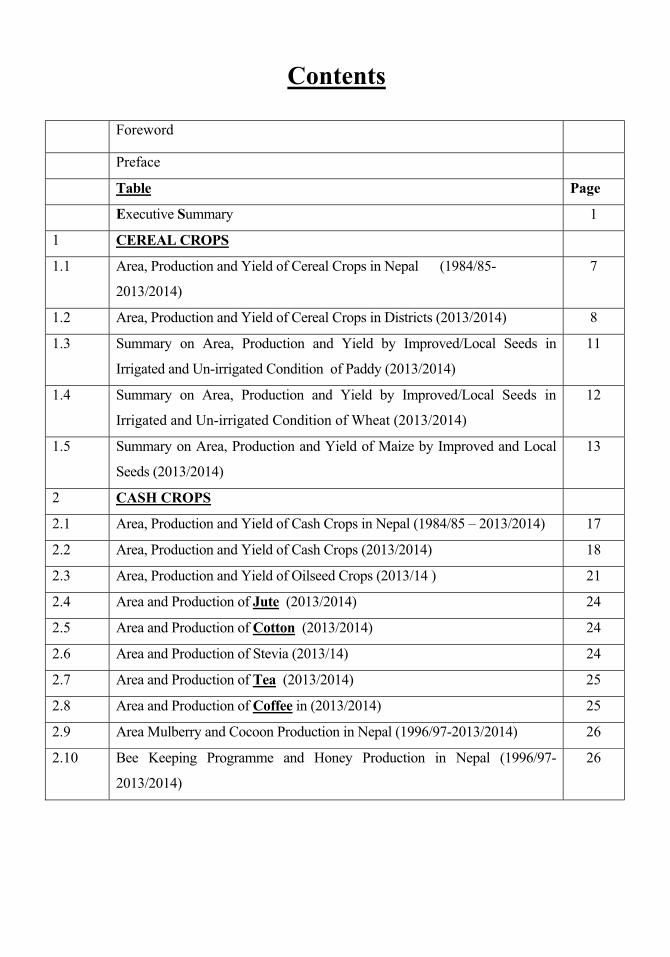
Contents
Foreword
Preface
Table Page
Executive Summary 1
1 CEREAL CROPS
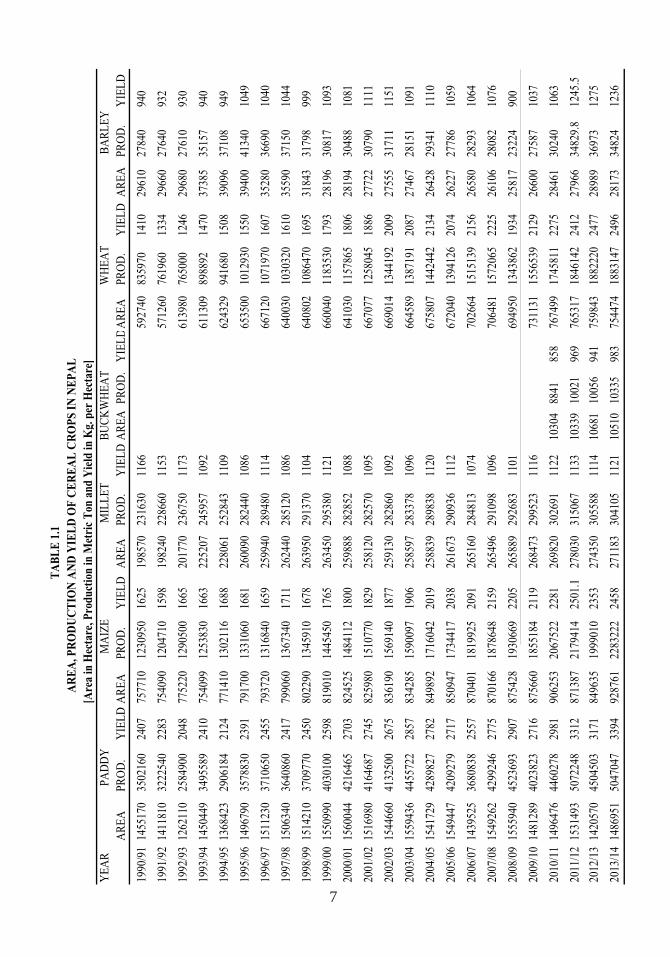
1.1 Area, Production and Yield of Cereal Crops in Nepal (1984/85-
2013/2014)
7
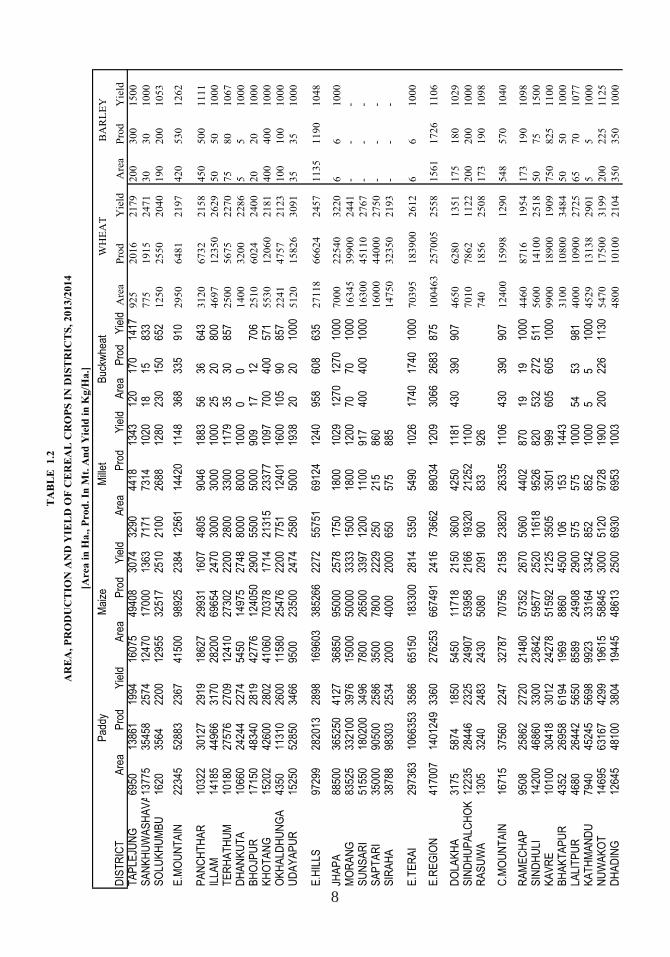
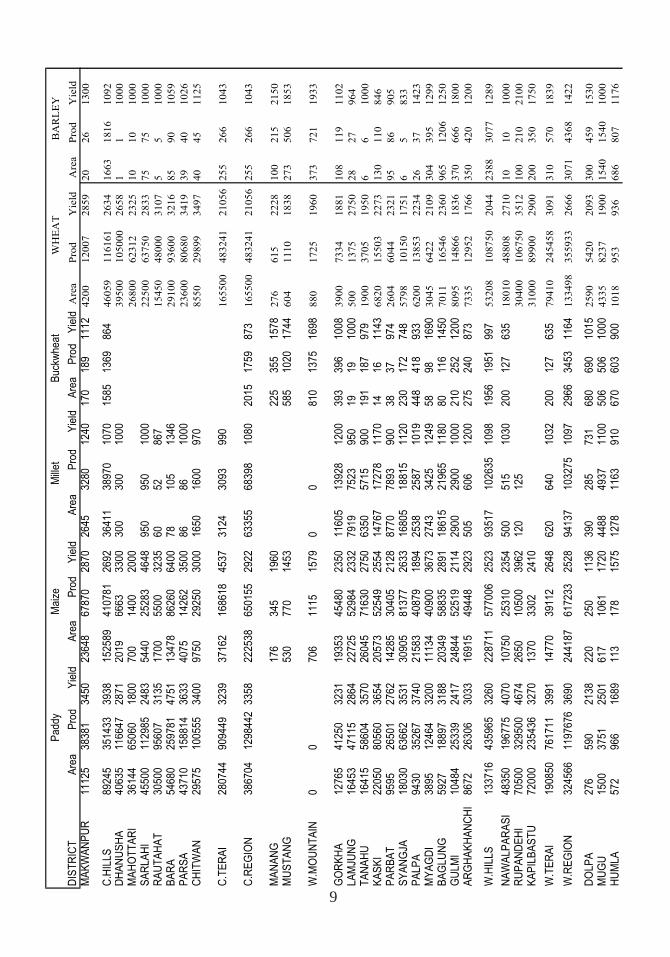
1.2 Area, Production and Yield of Cereal Crops in Districts (2013/2014) 8
1.3 Summary on Area, Production and Yield by Improved/Local Seeds in
Irrigated and Un-irrigated Condition of Paddy (2013/2014)
11
1.4 Summary on Area, Production and Yield by Improved/Local Seeds in
Irrigated and Un-irrigated Condition of Wheat (2013/2014)
12
1.5 Summary on Area, Production and Yield of Maize by Improved and Local
Seeds (2013/2014)
13
2 CASH CROPS
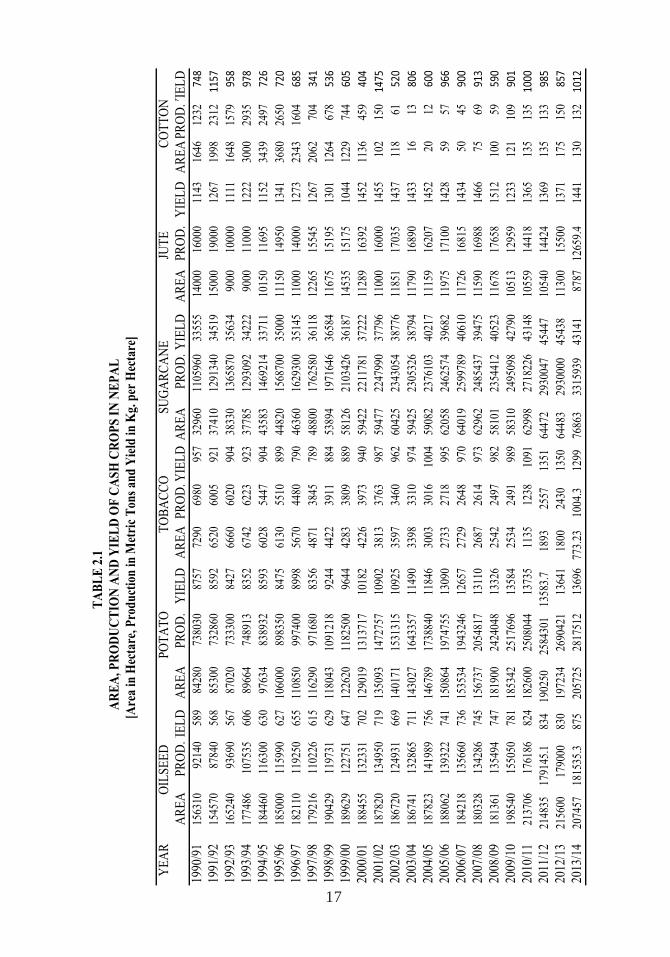
2.1 Area, Production and Yield of Cash Crops in Nepal (1984/85 – 2013/2014) 17
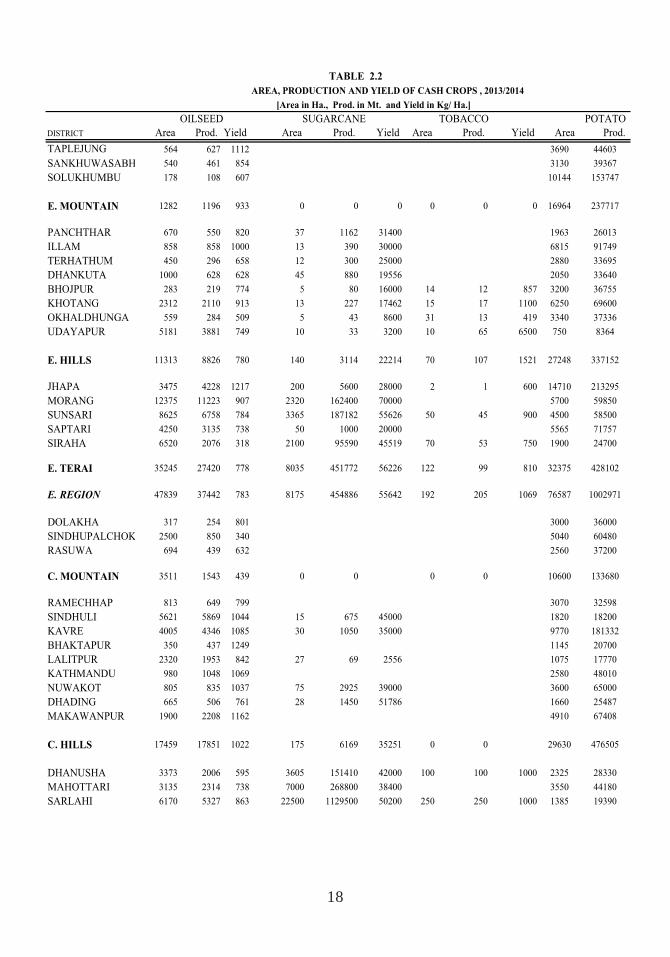
2.2 Area, Production and Yield of Cash Crops (2013/2014) 18
2.3 Area, Production and Yield of Oilseed Crops (2013/14 ) 21
2.4 Area and Production of Jute (2013/2014) 24
2.5 Area and Production of Cotton (2013/2014) 24
2.6 Area and Production of Stevia (2013/14) 24
2.7 Area and Production of Tea (2013/2014) 25
2.8 Area and Production of Coffee in (2013/2014) 25
2.9 Area Mulberry and Cocoon Production in Nepal (1996/97-2013/2014) 26
2.10 Bee Keeping Programme and Honey Production in Nepal (1996/97-
2013/2014)
26
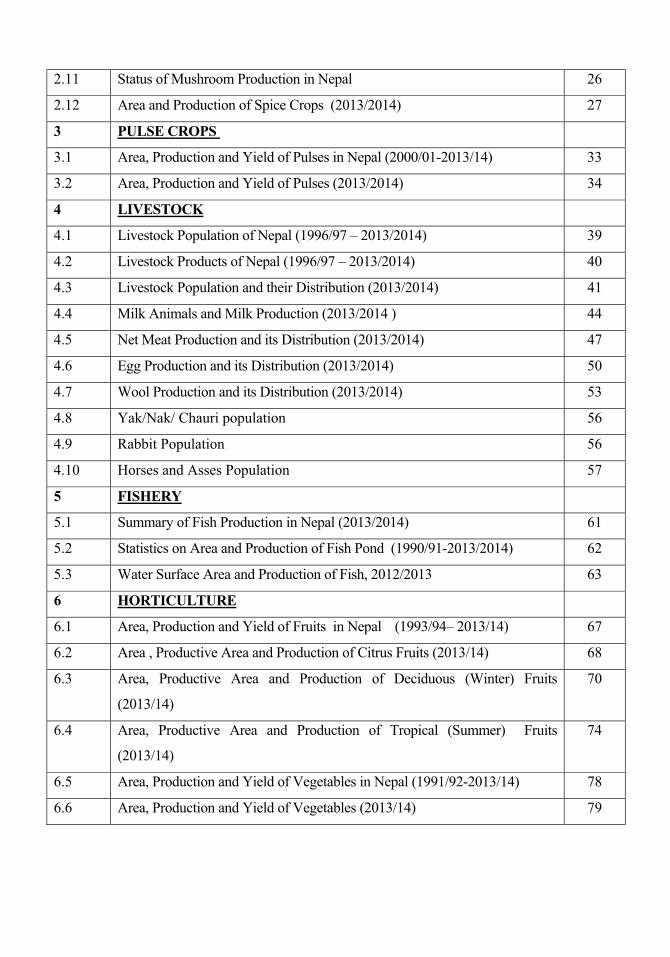
2.11 Status of Mushroom Production in Nepal 26
2.12 Area and Production of Spice Crops (2013/2014) 27
3 PULSE CROPS
3.1 Area, Production and Yield of Pulses in Nepal (2000/01-2013/14) 33
3.2 Area, Production and Yield of Pulses (2013/2014) 34
4 LIVESTOCK
4.1 Livestock Population of Nepal (1996/97 – 2013/2014) 39
4.2 Livestock Products of Nepal (1996/97 – 2013/2014) 40
4.3 Livestock Population and their Distribution (2013/2014) 41
4.4 Milk Animals and Milk Production (2013/2014 ) 44
4.5 Net Meat Production and its Distribution (2013/2014) 47
4.6 Egg Production and its Distribution (2013/2014) 50
4.7 Wool Production and its Distribution (2013/2014) 53
4.8 Yak/Nak/ Chauri population 56
4.9 Rabbit Population 56
4.10 Horses and Asses Population 57
5 FISHERY
5.1 Summary of Fish Production in Nepal (2013/2014) 61
5.2 Statistics on Area and Production of Fish Pond (1990/91-2013/2014) 62
5.3 Water Surface Area and Production of Fish, 2012/2013 63
6 HORTICULTURE
6.1 Area, Production and Yield of Fruits in Nepal (1993/94– 2013/14) 67
6.2 Area , Productive Area and Production of Citrus Fruits (2013/14) 68
6.3 Area, Productive Area and Production of Deciduous (Winter) Fruits
(2013/14)
70
6.4 Area, Productive Area and Production of Tropical (Summer) Fruits
(2013/14)
74
6.5 Area, Production and Yield of Vegetables in Nepal (1991/92-2013/14) 78
6.6 Area, Production and Yield of Vegetables (2013/14) 79
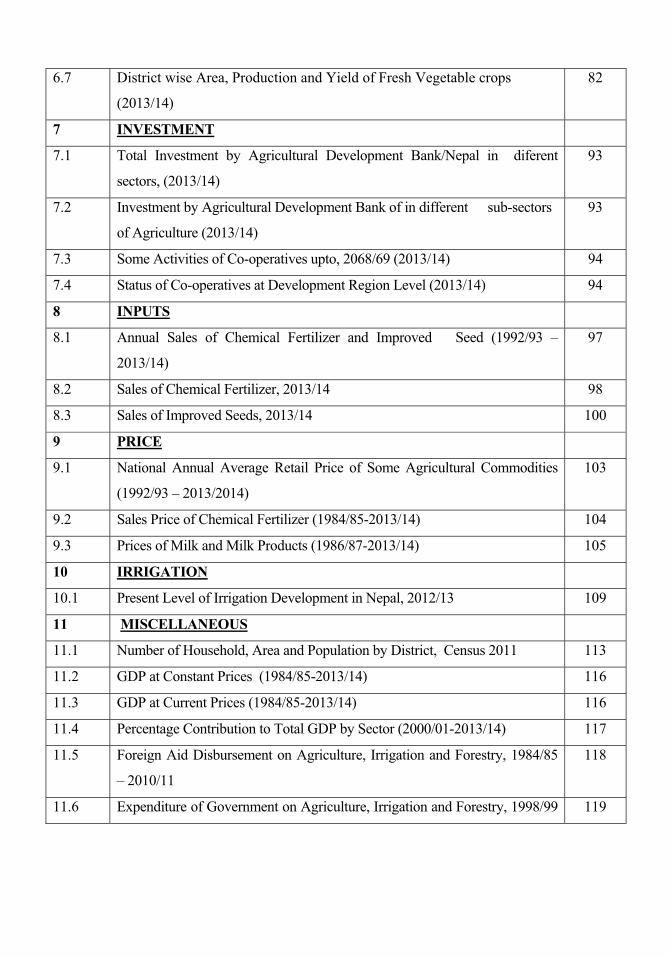
6.7 District wise Area, Production and Yield of Fresh Vegetable crops
(2013/14)
82
7 INVESTMENT
7.1 Total Investment by Agricultural Development Bank/Nepal in diferent
sectors, (2013/14)
93
7.2 Investment by Agricultural Development Bank of in different sub-sectors
of Agriculture (2013/14)
93
7.3 Some Activities of Co-operatives upto, 2068/69 (2013/14) 94
7.4 Status of Co-operatives at Development Region Level (2013/14) 94
8 INPUTS
8.1 Annual Sales of Chemical Fertilizer and Improved Seed (1992/93 –
2013/14)
97
8.2 Sales of Chemical Fertilizer, 2013/14 98
8.3 Sales of Improved Seeds, 2013/14 100
9 PRICE
9.1 National Annual Average Retail Price of Some Agricultural Commodities
(1992/93 – 2013/2014)
103
9.2 Sales Price of Chemical Fertilizer (1984/85-2013/14) 104
9.3 Prices of Milk and Milk Products (1986/87-2013/14) 105
10 IRRIGATION
10.1 Present Level of Irrigation Development in Nepal, 2012/13 109
11 MISCELLANEOUS
11.1 Number of Household, Area and Population by District, Census 2011 113
11.2 GDP at Constant Prices (1984/85-2013/14) 116
11.3 GDP at Current Prices (1984/85-2013/14) 116
11.4 Percentage Contribution to Total GDP by Sector (2000/01-2013/14) 117
11.5 Foreign Aid Disbursement on Agriculture, Irrigation and Forestry, 1984/85
– 2010/11
118
11.6 Expenditure of Government on Agriculture, Irrigation and Forestry, 1998/99 119
– 2010/11
11.7 Edible Cereal Grain Production and Requirement of Nepal, (1989/90 –
2013/14)
120
11.8 District wise Food Availability and Requirement of Cereal, 2013/14 121
11.9 Exports and Imports of Selected Commodities & Products, 2013/14
(A) Exports to different countries
(B) Import from different countries
124
11.10 Average Cost, Return and Net Profit of Some Major Agricultural
commodities, 2012/13
187
11.11 Average Cost, Return and Net Profit of Major Vegetables and Spices,
2012/13
188
11.12 Preliminary Monthly Rainfall Data, 2012 189
11.13 Preliminary Monthly Temperature Data, 2012 190
11.14 Ten Most Specific and Non-specific Disease 2011/12 (Livestock, Poultry) 191
11.15 Group wise situation of quality standard of food samples 194
11.16 Estimated Floriculture Production and Demand Scenario in Nepal 195
11.17 Released and Registered Crops Varieties in Nepal, 1960-2013 196
11.18 Conversion Table (a) Weight (b) Area (c) Volume 212
1
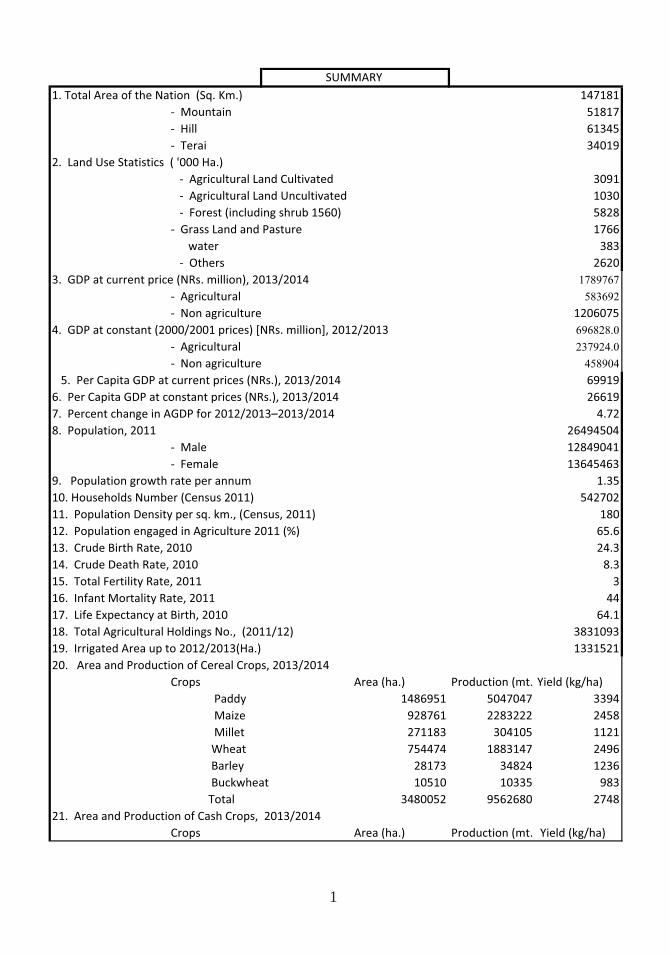
1. Total Area of the Nation (Sq. Km.) 147181
Mountain 51817
Hill 61345
Terai 34019
2. Land Use Statistics ( '000 Ha.)
Agricultural Land Cultivated 3091
Agricultural Land Uncultivated 1030
Forest (including shrub 1560) 5828
1766
water 383
Others 2620
3. GDP at current price (NRs. million), 2013/2014 1789767
Agricultural 583692
Non agriculture 1206075
4. GDP at constant (2000/2001 prices) [NRs. million], 2012/2013 696828.0
Agricultural 237924.0
Non agriculture 458904
69919
6. Per Capita GDP at constant prices (NRs.), 2013/2014 26619
4.72
26494504
Male 12849041
Female 13645463
9. Population growth rate per annum 1.35
10. Households Number (Census 2011) 542702
11. Population Density per sq. km., (Census, 2011) 180
12. Population engaged in Agriculture 2011 (%) 65.6
13. Crude Birth Rate, 2010 24.3
14. Crude Death Rate, 2010 8.3
15. Total Fertility Rate, 2011 3
16. Infant Mortality Rate, 2011 44
17. Life Expectancy at Birth, 2010 64.1
18. Total Agricultural Holdings No., (2011/12) 3831093
19. Irrigated Area up to 2012/2013(Ha.) 1331521
20. Area and Production of Cereal Crops, 2013/2014
Crops Area (ha.) Production (mt.)Yield (kg/ha)
Paddy 1486951 5047047 3394
Maize 928761 2283222 2458
Millet 271183 304105 1121
Wheat 754474 1883147 2496
Barley 28173 34824 1236
Buckwheat 10510 10335 983
Total 3480052 9562680 2748
21. Area and Production of Cash Crops, 2013/2014
Crops Area (ha.) Production (mt.) Yield (kg/ha)
7. Percent change in AGDP for 2012/2013–2013/2014
8. Population, 2011
Grass Land and Pasture
SUMMARY
5. Per Capita GDP at current prices (NRs.), 2013/2014
2
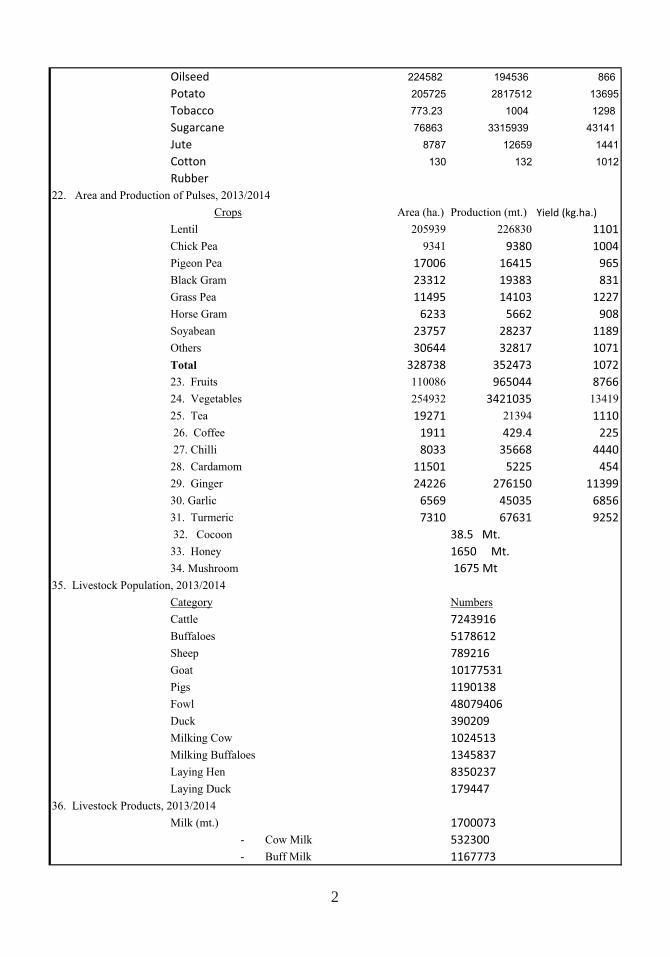
Oilseed 224582 194536 866
Potato 205725 2817512 13695
Tobacco 773.23 1004 1298
Sugarcane 76863 3315939 43141
Jute 8787 12659 1441
Cotton 130 132 1012
Rubber
22. Area and Production of Pulses, 2013/2014
Crops Area (ha.) Production (mt.) Yield (kg.ha.)
Lentil 205939 226830 1101
Chick Pea 9341 9380 1004
Pigeon Pea 17006 16415 965
Black Gram 23312 19383 831
Grass Pea 11495 14103 1227
Horse Gram 6233 5662 908
Soyabean 23757 28237 1189
Others 30644 32817 1071
Total 328738 352473 1072
23. Fruits 110086 965044 8766
24. Vegetables 254932 3421035 13419
25. Tea 19271 21394 1110
26. Coffee 1911 429.4 225
27. Chilli 8033 35668 4440
28. Cardamom 11501 5225 454
29. Ginger 24226 276150 11399
30. Garlic 6569 45035 6856
31. Turmeric 7310 67631 9252
32. Cocoon 38.5 Mt.
33. Honey 1650 Mt.
34. Mushroom 1675 Mt
35. Livestock Population, 2013/2014
Category Numbers
Cattle 7243916
Buffaloes 5178612
Sheep 789216
Goat 10177531
Pigs 1190138
Fowl 48079406
Duck 390209
Milking Cow 1024513
Milking Buffaloes 1345837
Laying Hen 8350237
Laying Duck 179447
36. Livestock Products, 2013/2014
Milk (mt.) 1700073
- Cow Milk 532300
- Buff Milk 1167773
3
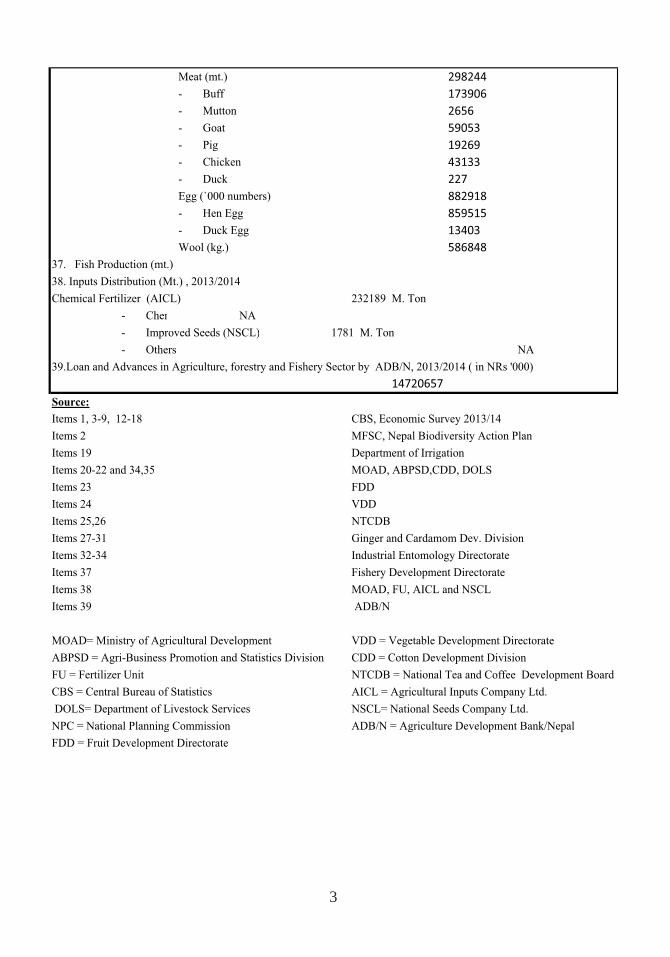
Meat (mt.) 298244
- Buff 173906
- Mutton 2656
- Goat 59053
- Pig 19269
- Chicken 43133
- Duck 227
Egg (`000 numbers) 882918
- Hen Egg 859515
- Duck Egg 13403
Wool (kg.) 586848
37. Fish Production (mt.)
38. Inputs Distribution (Mt.) , 2013/2014
Chemical Fertilizer (AICL) 232189 M. Ton
- Chem NA
- Improved Seeds (NSCL) 1781 M. Ton
- Others NA
39.Loan and Advances in Agriculture, forestry and Fishery Sector by ADB/N, 2013/2014 ( in NRs '000)
14720657
Source:
Items 1, 3-9, 12-18 CBS, Economic Survey 2013/14
Items 2 MFSC, Nepal Biodiversity Action Plan
Items 19 Department of Irrigation
Items 20-22 and 34,35 MOAD, ABPSD,CDD, DOLS
Items 23 FDD
Items 24 VDD
Items 25,26 NTCDB
Items 27-31 Ginger and Cardamom Dev. Division
Items 32-34 Industrial Entomology Directorate
Items 37 Fishery Development Directorate
Items 38 MOAD, FU, AICL and NSCL
Items 39 ADB/N
MOAD= Ministry of Agricultural Development VDD = Vegetable Development Directorate
ABPSD = Agri-Business Promotion and Statistics Division CDD = Cotton Development Division
FU = Fertilizer Unit NTCDB = National Tea and Coffee Development Board
CBS = Central Bureau of Statistics AICL = Agricultural Inputs Company Ltd.
DOLS= Department of Livestock Services NSCL= National Seeds Company Ltd.
NPC = National Planning Commission ADB/N = Agriculture Development Bank/Nepal
FDD = Fruit Development Directorate

4
5
1.CEREAL CROPS

6
7
T
AB
LE
1.1
AR
EA
, PR
OD
UC
TIO
N A
ND
YIE
LD
OF
CE
RE
AL
CR
OP
S I
N N
EP
AL
[Are
a in
Hec
tare
, Pro
du
ctio
n i
n M
etri
c T
on a
nd
Yie
ld i
n K
g. p
er H
ecta
re]
YE
AR
PA
DD
Y M
AIZ
EM
ILL
ET
BU
CK
WH
EA
TW
HE
AT
BA
RL
EY
AR
EA
PR
OD
.Y
IEL
DA
RE
AP
RO
D.
YIE
LD
AR
EA
PR
OD
.Y
IEL
DA
RE
AP
RO
D.
YIE
LD
AR
EA
PR
OD
.Y
IEL
DA
RE
AP
RO
D.
YIE
LD
1990
/91
1455
170
3502
160
2407
7577
1012
3095
016
2519
8570
2316
3011
6659
2740
8359
7014
1029
610
2784
094
0
1991
/92
1411
810
3222
540
2283
7540
9012
0471
015
9819
8240
2286
6011
5357
1260
7619
6013
3429
660
2764
093
2
1992
/93
1262
110
2584
900
2048
7752
2012
9050
016
6520
1770
2367
5011
7361
3980
7650
0012
4629
680
2761
093
0
1993
/94
1450
449
3495
589
2410
7540
9912
5383
016
6322
5207
2459
5710
9261
1309
8988
9214
7037
385
3515
794
0
1994
/95
1368
423
2906
184
2124
7714
1013
0211
616
8822
8061
2528
4311
0962
4329
9416
8015
0839
096
3710
894
9
1995
/96
1496
790
3578
830
2391
7917
0013
3106
016
8126
0090
2824
4010
8665
3500
1012
930
1550
3940
041
340
1049
1996
/97
1511
230
3710
650
2455
7937
2013
1684
016
5925
9940
2894
8011
1466
7120
1071
970
1607
3528
036
690
1040
1997
/98
1506
340
3640
860
2417
7990
6013
6734
017
1126
2440
2851
2010
8664
0030
1030
320
1610
3559
037
150
1044
1998
/99
1514
210
3709
770
2450
8022
9013
4591
016
7826
3950
2913
7011
0464
0802
1086
470
1695
3184
331
798
999
1999
/00
1550
990
4030
100
2598
8190
1014
4545
017
6526
3450
2953
8011
2166
0040
1183
530
1793
2819
630
817
1093
2000
/01
1560
044
4216
465
2703
8245
2514
8411
218
0025
9888
2828
5210
8864
1030
1157
865
1806
2819
430
488
1081
2001
/02
1516
980
4164
687
2745
8259
8015
1077
018
2925
8120
2825
7010
9566
7077
1258
045
1886
2772
230
790
1111
2002
/03
1544
660
4132
500
2675
8361
9015
6914
018
7725
9130
2828
6010
9266
9014
1344
192
2009
2755
531
711
1151
2003
/04
1559
436
4455
722
2857
8342
8515
9009
719
0625
8597
2833
7810
9666
4589
1387
191
2087
2746
728
151
1091
2004
/05
1541
729
4289
827
2782
8498
9217
1604
220
1925
8839
2898
3811
2067
5807
1442
442
2134
2642
829
341
1110
2005
/06
1549
447
4209
279
2717
8509
4717
3441
720
3826
1673
2909
3611
1267
2040
1394
126
2074
2622
727
786
1059
2006
/07
1439
525
3680
838
2557
8704
0118
1992
520
9126
5160
2848
1310
7470
2664
1515
139
2156
2658
028
293
1064
2007
/08
1549
262
4299
246
2775
8701
6618
7864
821
5926
5496
2910
9810
9670
6481
1572
065
2225
2610
628
082
1076
2008
/09
1555
940
4523
693
2907
8754
2819
3066
922
0526
5889
2926
8311
0169
4950
1343
862
1934
2581
723
224
900
2009
/10
1481
289
4023
823
2716
8756
6018
5518
421
1926
8473
2995
2311
1673
1131
1556
539
2129
2660
027
587
1037
2010
/11
1496
476
4460
278
2981
9062
5320
6752
222
8126
9820
3026
9111
2210
304
8841
858
7674
9917
4581
122
7528
461
3024
010
63
2011
/12
1531
493
5072
248
3312
8713
8721
7941
425
01.1
2780
3031
5067
1133
1033
910
021
969
7653
1718
4614
224
1227
966
3482
9.8
1245
.5
2012
/13
1420
570
4504
503
3171
8496
3519
9901
023
5327
4350
3055
8811
1410
681
1005
694
175
9843
1882
220
2477
2898
936
973
1275
2013
/14
1486
951
5047
047
3394
9287
6122
8322
224
5827
1183
3041
0511
2110
510
1033
598
375
4474
1883
147
2496
2817
334
824
1236
8
W
HE
AT
BA
RL
EY
DIS
TR
ICT
Are
aP
rod
Yie
ld A
rea
Pro
dY
ield
Are
aP
rod
Yie
ld A
rea
Pro
dY
ield
Are
a
Pro
d
Yie
ld
Are
a
Pro
d
Yie
ld
TA
PLE
JUN
G69
5013
861
1994
1607
549
408
3074
3290
4418
1343
120
170
1417
925
2016
2179
200
300
1500
SA
NK
HU
WA
SH
AV
A13
775
3545
825
7412
470
1700
013
6371
7173
1410
2018
1583
3775
1915
2471
30
30
1000
SO
LUK
HU
MB
U16
2035
6422
0012
955
3251
725
1021
0026
8812
8023
015
065
21250
2550
2040
190
200
1053
E.M
OU
NT
AIN
2234
552
883
2367
4150
098
925
2384
1256
114
420
1148
368
335
910
2950
6481
2197
420
530
1262
PA
NC
HT
HA
R10
322
3012
729
1918
627
2993
116
0748
0590
4618
8356
3664
33120
6732
2158
450
500
1111
ILLA
M14
185
4496
631
7028
200
6965
424
7030
0030
0010
0025
2080
04697
12350
2629
50
50
1000
TE
RH
AT
HU
M10
180
2757
627
0912
410
2730
222
0028
0033
0011
7935
3085
72500
5675
2270
75
80
1067
DH
AN
KU
TA
1066
024
244
2274
5450
1497
527
4880
0080
0010
000
01400
3200
2286
55
1000
BH
OJP
UR
1715
048
340
2819
4277
612
4050
2900
5500
5000
909
1712
706
2510
6024
2400
20
20
1000
KH
OT
AN
G15
202
4260
028
0241
060
7037
817
1421
315
2337
710
9770
040
057
15530
12060
2181
400
400
1000
OK
HA
LDH
UN
GA
4350
1131
026
0011
580
2547
622
0077
5112
401
1600
105
9085
72241
4757
2123
100
100
1000
UD
AY
AP
UR
1525
052
850
3466
9500
2350
024
7425
8050
0019
3820
2010
005120
15826
3091
35
35
1000
E.H
ILLS
9729
928
2013
2898
1696
0338
5266
2272
5575
169
124
1240
958
608
635
27118
66624
2457
1135
1190
1048
JHA
PA
8850
036
5250
4127
3685
095
000
2578
1750
1800
1029
1270
1270
1000
7000
22540
3220
66
1000
MO
RA
NG
8352
533
2100
3976
1500
050
000
3333
1500
1800
1200
7070
1000
16345
39900
2441
--
-
SU
NS
AR
I51
550
1802
0034
9678
0026
500
3397
1200
1100
917
400
400
1000
16300
45110
2767
--
-
SA
PT
AR
I35
000
9050
025
8635
0078
0022
2925
021
586
016000
44000
2750
--
-
SIR
AH
A38
788
9830
325
3420
0040
0020
0065
057
588
514750
32350
2193
--
-
E.T
ER
AI
2973
6310
6635
335
8665
150
1833
0028
1453
5054
9010
2617
4017
4010
0070395
183900
2612
66
1000
E.R
EG
ION
4170
0714
0124
933
6027
6253
6674
9124
1673
662
8903
412
0930
6626
8387
5100463
257005
2558
1561
1726
1106
DO
LAK
HA
3175
5874
1850
5450
1171
821
5036
0042
5011
8143
039
090
74650
6280
1351
175
180
1029
SIN
DH
UP
ALC
HO
K12
235
2844
623
2524
907
5395
821
6619
320
2125
211
007010
7862
1122
200
200
1000
RA
SU
WA
1305
3240
2483
2430
5080
2091
900
833
926
740
1856
2508
173
190
1098
C.M
OU
NT
AIN
1671
537
560
2247
3278
770
756
2158
2382
026
335
1106
430
390
907
12400
15998
1290
548
570
1040
RA
ME
CH
AP
9508
2586
227
2021
480
5735
226
7050
6044
0287
019
1910
004460
8716
1954
173
190
1098
SIN
DH
ULI
1420
046
860
3300
2364
259
577
2520
1161
895
2682
053
227
251
15600
14100
2518
50
75
1500
KA
VR
E10
100
3041
830
1224
278
5159
221
2535
0535
0199
960
560
510
009900
18900
1909
750
825
1100
BH
AK
TA
PU
R43
5226
958
6194
1969
8860
4500
106
153
1443
3100
10800
3484
50
50
1000
LALI
TP
UR
4680
2644
256
5085
8924
908
2900
575
575
1000
5453
981
4000
10900
2725
65
70
1077
KA
TH
MA
ND
U79
4045
245
5698
9923
3316
433
4285
285
210
005
510
004529
13138
2901
55
1000
NU
WA
KO
T14
695
6316
742
9919
615
5884
530
0051
2097
2819
0020
022
611
305470
17500
3199
200
225
1125
DH
AD
ING
1264
548
100
3804
1944
548
613
2500
6930
6953
1003
4800
10100
2104
350
350
1000
[Area i
n H
a., P
rod
. In
Mt.
An
d Y
ield
in
Kg/H
a.]
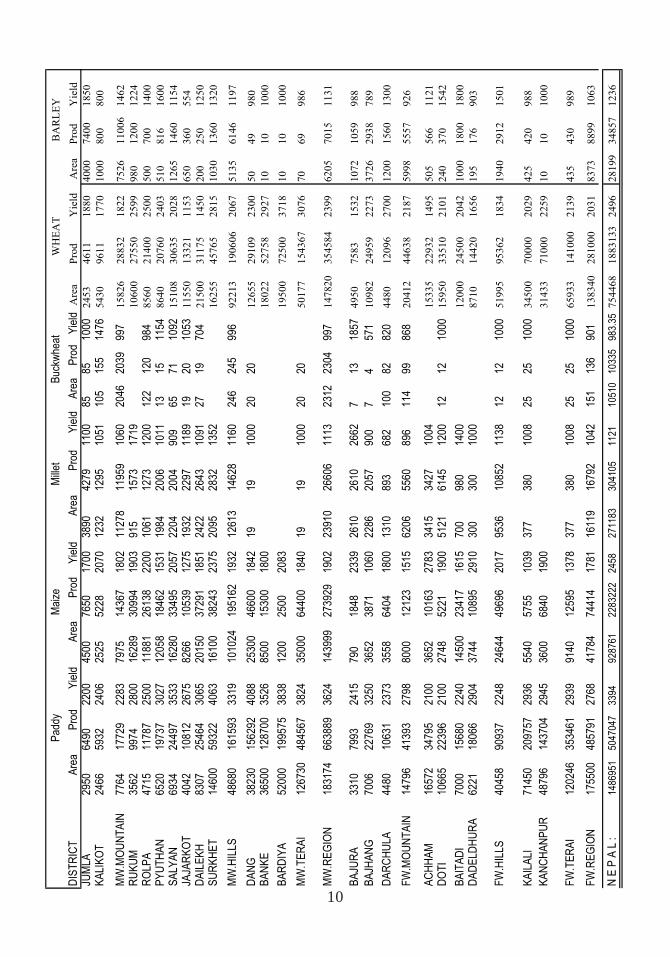
AR
EA
, P
RO
DU
CT
ION
AN
D Y
IEL
D O
F C
ER
EA
L C
RO
PS
IN
DIS
TR
ICT
S, 2013/2
014
TA
BL
E 1.2
Pad
dyM
aize
Mill
etB
uckw
heat
9
W
HE
AT
BA
RL
EY
DIS
TR
ICT
A
rea
Pro
dY
ield
A
rea
Pro
dY
ield
A
rea
Pro
dY
ield
A
rea
Pro
dY
ield
Are
a
Pro
d
Yie
ld
Are
a
Pro
d
Yie
ld
P
addy
Maiz
eM
illet
Buck
wheat
MA
KW
AN
PU
R11125
38381
3450
23648
67870
2870
2645
3280
1240
170
189
1112
4200
12007
2859
20
26
1300
C.H
ILLS
89245
351433
3938
152589
410781
2692
36411
38970
1070
1585
1369
864
46059
116161
2634
1663
1816
1092
DH
AN
US
HA
40635
116647
2871
2019
6663
3300
300
300
1000
39500
105000
2658
11
1000
MA
HO
TT
AR
I36144
65060
1800
700
1400
2000
26800
62312
2325
10
10
1000
SA
RLA
HI
45500
112985
2483
5440
25283
4648
950
950
1000
22500
63750
2833
75
75
1000
RA
UT
AH
AT
30500
95607
3135
1700
5500
3235
60
52
867
15450
48000
3107
55
1000
BA
RA
54680
259781
4751
13478
86260
6400
78
105
1346
29100
93600
3216
85
90
1059
PA
RS
A43710
158814
3633
4075
14262
3500
86
86
1000
23600
80680
3419
39
40
1026
CH
ITW
AN
29575
100555
3400
9750
29250
3000
1650
1600
970
8550
29899
3497
40
45
1125
C.T
ER
AI
280744
909449
3239
37162
168618
4537
3124
3093
990
165500
483241
21056
255
266
1043
C.R
EG
ION
386704
1298442
3358
222538
650155
2922
63355
68398
1080
2015
1759
873
165500
483241
21056
255
266
1043
MA
NA
NG
176
345
1960
225
355
1578
276
615
2228
100
215
2150
MU
ST
AN
G530
770
1453
585
1020
1744
604
1110
1838
273
506
1853
W.M
OU
NT
AIN
00
706
1115
1579
00
810
1375
1698
880
1725
1960
373
721
1933
GO
RK
HA
12765
41250
3231
19353
45480
2350
11605
13928
1200
393
396
1008
3900
7334
1881
108
119
1102
LA
MJU
NG
16453
47115
2864
22725
52984
2332
7919
7523
950
19
19
1000
500
1375
2750
28
27
964
TA
NA
HU
16415
58604
3570
26045
71630
2750
6350
5715
900
191
187
979
1900
3705
1950
66
1000
KA
SK
I22050
80560
3654
20573
52549
2554
14767
17278
1170
14
16
1143
6820
15503
2273
130
110
846
PA
RB
AT
9595
26501
2762
14285
30405
2128
8770
7893
900
38
37
974
2604
6044
2321
95
86
905
SY
AN
GJA
18030
63662
3531
30905
81377
2633
16805
18815
1120
230
172
748
5798
10150
1751
65
833
PA
LP
A9430
35267
3740
21583
40879
1894
2538
2587
1019
448
418
933
6200
13853
2234
26
37
1423
MY
AG
DI
3895
12464
3200
11134
40900
3673
2743
3425
1249
58
98
1690
3045
6422
2109
304
395
1299
BA
GLU
NG
5927
18897
3188
20349
58835
2891
18615
21965
1180
80
116
1450
7011
16546
2360
965
1206
1250
GU
LM
I10484
25339
2417
24844
52519
2114
2900
2900
1000
210
252
1200
8095
14866
1836
370
666
1800
AR
GH
AK
HA
NC
HI
8672
26306
3033
16915
49448
2923
505
606
1200
275
240
873
7335
12952
1766
350
420
1200
W.H
ILLS
133716
435965
3260
228711
577006
2523
93517
102635
1098
1956
1951
997
53208
108750
2044
2388
3077
1289
NA
WA
LP
AR
AS
I48350
196775
4070
10750
25310
2354
500
515
1030
200
127
635
18010
48808
2710
10
10
1000
RU
PA
ND
EH
I70500
329500
4674
2650
10500
3962
120
125
30400
106750
3512
100
210
2100
KA
PIL
BA
ST
U72000
235436
3270
1370
3302
2410
31000
89900
2900
200
350
1750
W.T
ER
AI
190850
761711
3991
14770
39112
2648
620
640
1032
200
127
635
79410
245458
3091
310
570
1839
W.R
EG
ION
324566
1197676
3690
244187
617233
2528
94137
103275
1097
2966
3453
1164
133498
355933
2666
3071
4368
1422
DO
LP
A276
590
2138
220
250
1136
390
285
731
680
690
1015
2590
5420
2093
300
459
1530
MU
GU
1500
3751
2501
617
1061
1720
4488
4937
1100
506
506
1000
4335
8237
1900
1540
1540
1000
HU
MLA
572
966
1689
113
178
1575
1278
1163
910
670
603
900
1018
953
936
686
807
1176
10
W
HE
AT
BA
RL
EY
DIS
TR
ICT
Are
aP
rod
Yie
ld A
rea
Pro
dY
ield
Are
aP
rod
Yie
ld A
rea
Pro
dY
ield
Are
a
Pro
d
Yie
ld
Are
a
Pro
d
Yie
ld
Pad
dyM
aize
Mill
etB
uckw
heat
JUM
LA29
5064
9022
0045
0076
5017
0038
9042
7911
0085
8510
002453
4611
1880
4000
7400
1850
KA
LIK
OT
2466
5932
2406
2525
5228
2070
1232
1295
1051
105
155
1476
5430
9611
1770
1000
800
800
MW
.MO
UN
TA
IN77
6417
729
2283
7975
1436
718
0211
278
1195
910
6020
4620
3999
715826
28832
1822
7526
11006
1462
RU
KU
M35
6299
7428
0016
289
3099
419
0391
515
7317
1910600
27550
2599
980
1200
1224
RO
LPA
4715
1178
725
0011
881
2613
822
0010
6112
7312
0012
212
098
48560
21400
2500
500
700
1400
PY
UT
HA
N65
2019
737
3027
1205
818
462
1531
1984
2006
1011
1315
1154
8640
20760
2403
510
816
1600
SA
LYA
N69
3424
497
3533
1628
033
495
2057
2204
2004
909
6571
1092
15108
30635
2028
1265
1460
1154
JAJA
RK
OT
4042
1081
226
7582
6610
539
1275
1932
2297
1189
1920
1053
11550
13321
1153
650
360
554
DA
ILE
KH
8307
2546
430
6520
150
3729
118
5124
2226
4310
9127
1970
421500
31175
1450
200
250
1250
SU
RK
HE
T14
600
5932
240
6316
100
3824
323
7520
9528
3213
5216255
45765
2815
1030
1360
1320
MW
.HIL
LS48
680
1615
9333
1910
1024
1951
6219
3212
613
1462
811
6024
624
599
692213
190606
2067
5135
6146
1197
DA
NG
3823
015
6292
4088
2530
046
600
1842
1919
1000
2020
12655
29109
2300
50
49
980
BA
NK
E36
500
1287
0035
2685
0015
300
1800
18022
52758
2927
10
10
1000
BA
RD
IYA
5200
019
9575
3838
1200
2500
2083
19500
72500
3718
10
10
1000
MW
.TE
RA
I12
6730
4845
6738
2435
000
6440
018
4019
1910
0020
2050177
154367
3076
70
69
986
MW
.RE
GIO
N18
3174
6638
8936
2414
3999
2739
2919
0223
910
2660
611
1323
1223
0499
7147820
354584
2399
6205
7015
1131
BA
JUR
A33
1079
9324
1579
018
4823
3926
1026
1026
627
1318
574950
7583
1532
1072
1059
988
BA
JHA
NG
7006
2276
932
5036
5238
7110
6022
8620
5790
07
457
110982
24959
2273
3726
2938
789
DA
RC
HU
LA44
8010
631
2373
3558
6404
1800
1310
893
682
100
8282
04480
12096
2700
1200
1560
1300
FW
.MO
UN
TA
IN14
796
4139
327
9880
0012
123
1515
6206
5560
896
114
9986
820412
44638
2187
5998
5557
926
AC
HH
AM
1657
234
795
2100
3652
1016
327
8334
1534
2710
0415335
22932
1495
505
566
1121
DO
TI
1066
522
396
2100
2748
5221
1900
5121
6145
1200
1212
1000
15950
33510
2101
240
370
1542
BA
ITA
DI
7000
1568
022
4014
500
2341
716
1570
098
014
0012000
24500
2042
1000
1800
1800
DA
DE
LDH
UR
A62
2118
066
2904
3744
1089
529
1030
030
010
008710
14420
1656
195
176
903
FW
.HIL
LS40
458
9093
722
4824
644
4969
620
1795
3610
852
1138
1212
1000
51995
95362
1834
1940
2912
1501
KA
ILA
LI71
450
2097
5729
3655
4057
5510
3937
738
010
0825
2510
0034500
70000
2029
425
420
988
KA
NC
HA
NP
UR
4879
614
3704
2945
3600
6840
1900
31433
71000
2259
10
10
1000
FW
.TE
RA
I12
0246
3534
6129
3991
4012
595
1378
377
380
1008
2525
1000
65933
141000
2139
435
430
989
FW
.RE
GIO
N17
5500
4857
9127
6841
784
7441
417
8116
119
1679
210
4215
113
690
1138340
281000
2031
8373
8899
1063
N E
P A
L :
1486
951
5047
047
3394
9287
6122
8322
224
5827
1183
3041
0511
2110
510
1033
598
3.35
754468
1883133
2496
28199
34857
1236
11
I
R R
I G
A T
E D
U N
I R
R I
G A
T E
DT
O T
A L
GR
AN
D
BE
LT
/NE
PA
LIm
pro
ved
%
Lo
cal
%Im
pro
ved
%L
oca
l%
Imp
rov
ed%
Lo
cal
%T
OT
AL
%
MO
UN
TA
IN
Are
a 26850
43
.57
150
0.2
429995
48
.68
4625
7.5
15
68
45
92
.25
47
75
7.7
56
16
20
4.1
4
Pro
d.
87500
350
54730
6985
14
22
30
73
35
14
95
65
Yie
ld3259
2333
1825
1510
2502
1536
2427
HIL
LS
Are
a 185300
45
.26
8258
2.0
2168340
41
.12
47500
11
.60
35
36
40
86
.38
55
75
81
3.6
24
09
39
827.5
3
Pro
d.
730540
28200
461876
101325
11
92
41
61
29
52
51
32
19
41
Yie
ld3942
3415
2744
2133
3372
2323
3229
TE
RA
I
Are
a 704350
69
.33
25300
2.4
9260324
25
.62
25959
2.5
69
64
67
49
4.9
55
12
59
5.0
51
01
59
33
68.3
2
Pro
d.
2894520
60197
580268
40556
34
74
78
81
00
75
33
57
55
41
Yie
ld4109
2379
2229
1562
3602
1966
3519
NE
PA
L
Are
a 9
16
50
06
1.6
43
37
08
2.2
74
58
65
93
0.8
57
80
84
5.2
51
37
51
59
92
.48
11
17
92
7.5
21
48
69
51
10
0.0
0
Pro
d.
37
12
56
08
87
47
10
96
87
41
48
86
64
80
94
34
23
76
13
50
47
04
7
Yie
ld4051
2633
2391
1906
3497
2125
3394
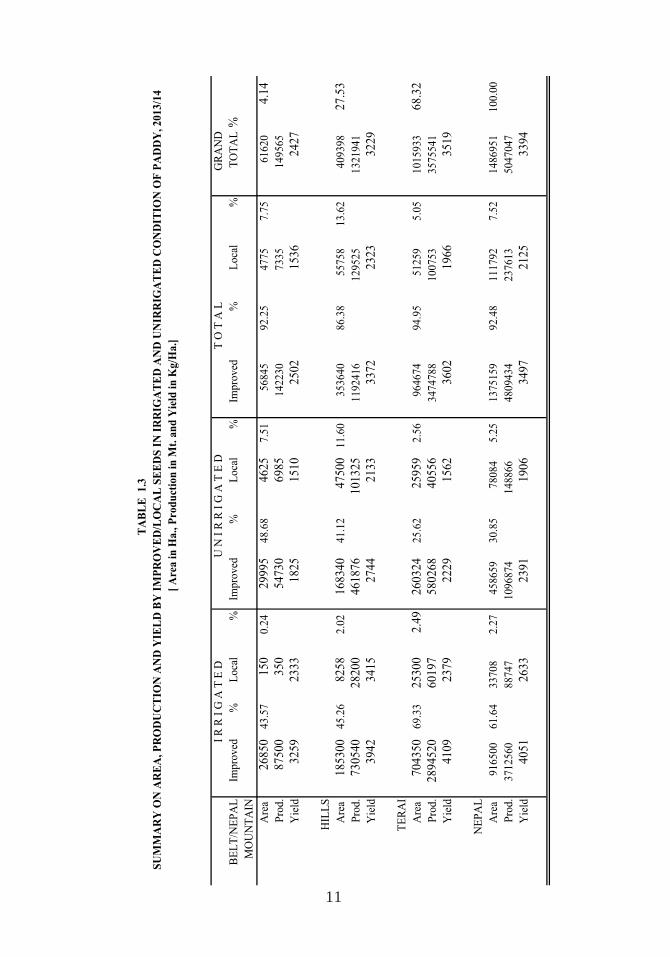
TA
BL
E
1.3
SU
MM
AR
Y O
N A
RE
A,
PR
OD
UC
TIO
N A
ND
YIE
LD
BY
IM
PR
OV
ED
/LO
CA
L S
EE
DS
IN
IR
RIG
AT
ED
AN
D U
NIR
RIG
AT
ED
CO
ND
ITIO
N O
F P
AD
DY
, 2
01
3/1
4
[
Are
a i
n H
a.,
Pro
du
ctio
n i
n M
t. a
nd
Yie
ld i
n K
g/H
a.]
12
I R
R I
G A
T E
D
U N
I R
R I
G A
T E
D
T O
T A
LG
RA
ND
BE
LT
/NE
PA
LIm
prov
ed%
L
ocal
%Im
prov
ed%
Loc
al%
Impr
oved
%L
ocal
%T
OT
AL
%
MO
UN
TA
IN
Are
a 23
819
45.4
021
30.
4125
500
48.6
029
365.
6049
319
94.0
031
496.
0052
468
6.95
Pro
d.65
299
295
2925
728
2394
556
3118
9767
4
Yie
ld27
41
1385
1147
962
1917
99
018
62
HIL
LS
Are
a 11
8450
43.7
711
900.
4413
9183
51.4
411
770
4.35
2576
3395
.21
1296
04.
7927
0593
35.8
7
Pro
d.30
5450
1625
2551
8015
248
5606
3016
873
5775
03
Yie
ld25
79
1366
1833
1295
2176
13
0221
34
TE
RA
I
Are
a 34
0600
78.9
50
090
265
20.9
255
00.
1343
0865
99.8
755
00.
1343
1415
57.1
8
Pro
d.10
1866
90
1885
4775
012
0721
675
012
0796
6
Yie
ld29
91
020
8913
6428
02
1364
2800
NE
PA
L
Are
a 48
2869
64.0
014
030.
1925
4948
33.7
915
256
2.02
7378
1797
.79
1665
92.
2175
4476
100.
00
Pro
d.13
8941
819
2047
2984
1882
118
6240
220
741
1883
143
Yie
ld28
77
1368
1855
1234
2524
12
4524
96
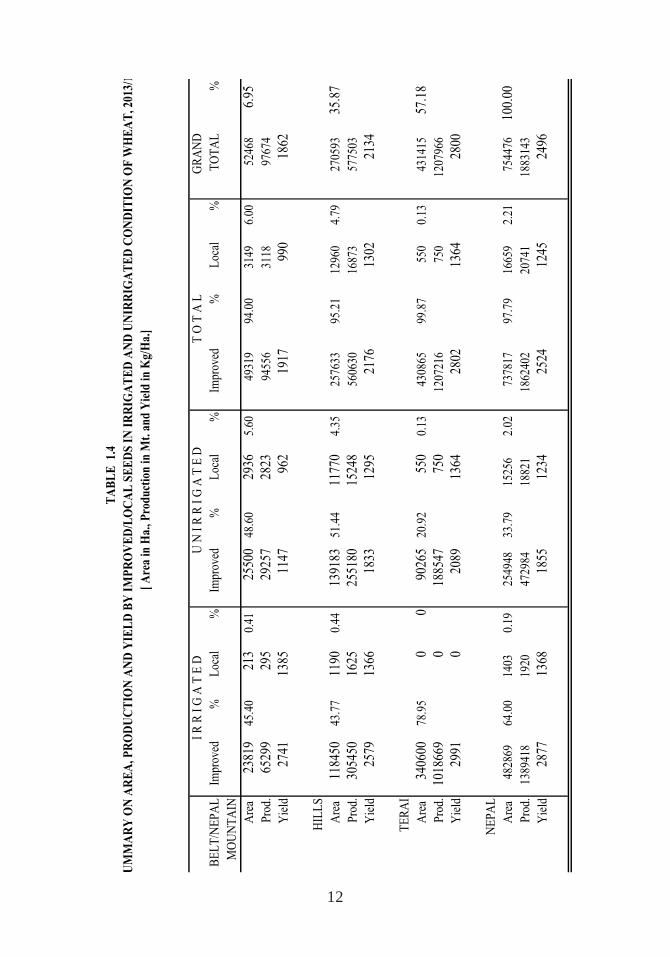
UM
MA
RY
ON
AR
EA
, PR
OD
UC
TIO
N A
ND
YIE
LD
BY
IM
PR
OV
ED
/LO
CA
L S
EE
DS
IN
IR
RIG
AT
ED
AN
D U
NIR
RIG
AT
ED
CO
ND
ITIO
N O
F W
HE
AT
, 201
3/1
[
Are
a in
Ha.
, Pro
du
ctio
n i
n M
t. a
nd
Yie
ld i
n K
g/H
a.]
TA
BL
E 1
.4
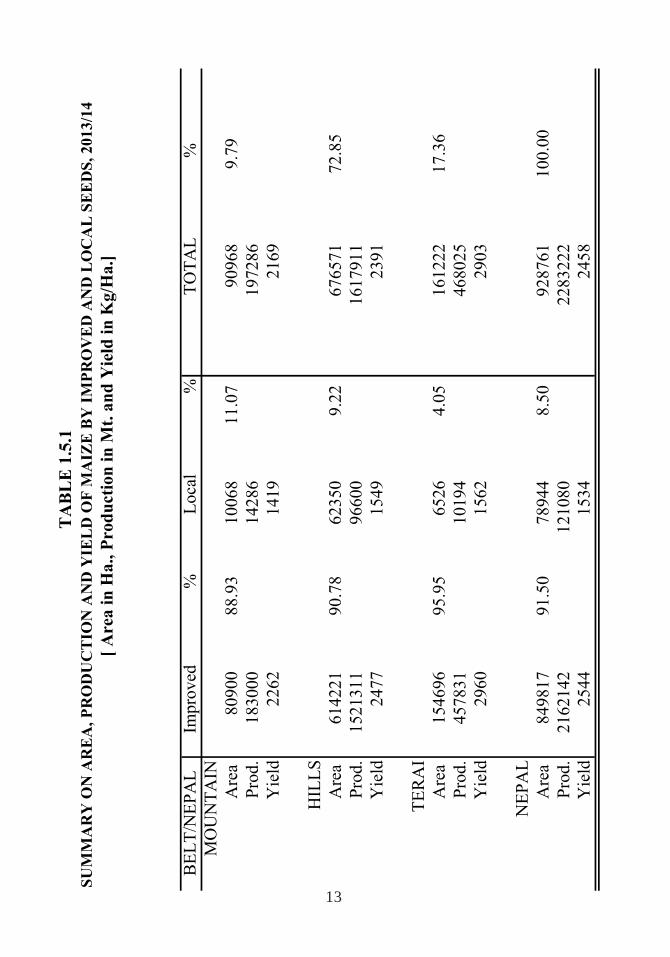
13
SU
MM
AR
Y O
N A
RE
A,
PR
OD
UC
TIO
N A
ND
YIE
LD
OF
MA
IZE
BY
IM
PR
OV
ED
AN
D L
OC
AL
SE
ED
S,
20
13
/14
BE
LT
/NE
PA
LIm
pro
ved
%
Lo
cal
%T
OT
AL
%
MO
UN
TA
IN
Are
a 8
09
00
88
.93
10
06
81
1.0
79
09
68
9.7
9
Pro
d.
18
30
00
14
28
61
97
28
6
Yie
ld2
26
2
14
19
21
69
HIL
LS
Are
a 6
14
22
19
0.7
86
23
50
9.2
26
76
57
17
2.8
5
Pro
d.
15
21
31
19
66
00
16
17
91
1
Yie
ld2
47
7
15
49
23
91
TE
RA
I
Are
a 1
54
69
69
5.9
56
52
64
.05
16
12
22
17
.36
Pro
d.
45
78
31
10
19
44
68
02
5
Yie
ld2
96
0
15
62
29
03
NE
PA
L
Are
a 8
49
81
79
1.5
07
89
44
8.5
09
28
76
11
00
.00
Pro
d.
21
62
14
21
21
08
02
28
32
22
Yie
ld2
54
4
15
34
24
58
TA
BL
E 1
.5.1
[
Are
a i
n H
a.,
Pro
du
ctio
n i
n M
t. a
nd
Yie
ld i
n K
g/H
a.]

14
15
2.CASH CROPS

16
17
TA
BL
E 2
.1
A
RE
A, P
RO
DU
CT
ION
AN
D Y
IEL
D O
F C
AS
H C
RO
PS
IN
NE
PA
L
[Are
a in
Hec
tare
, Pro
du
ctio
n i
n M
etri
c T
ons
and
Yie
ld i
n K
g. p
er H
ecta
re]
YE
AR
A
RE
AP
RO
D.Y
IEL
DA
RE
AP
RO
D.
YIE
LD
AR
EA
PR
OD
.YIE
LD
AR
EA
PR
OD
.Y
IEL
DA
RE
AP
RO
D.
YIE
LD
AR
EA
PR
OD
.YIE
LD
1990
/91
1563
1092
140
589
8428
073
8030
8757
7290
6980
957
3296
011
0596
033
555
1400
016
000
1143
1646
1232
748
1991
/92
1545
7087
840
568
8530
073
2860
8592
6520
6005
921
3741
012
9134
034
519
1500
019
000
1267
1998
2312
1157
1992
/93
1652
4093
690
567
8702
073
3300
8427
6660
6020
904
3833
013
6587
035
634
9000
1000
011
1116
4815
79958
1993
/94
1774
8610
7535
606
8966
474
8913
8352
6742
6223
923
3778
512
9309
234
222
9000
1100
012
2230
0029
35978
1994
/95
1844
6011
6300
630
9763
483
8932
8593
6028
5447
904
4358
314
6921
433
711
1015
011
695
1152
3439
2497
726
1995
/96
1850
0011
5990
627
1060
0089
8350
8475
6130
5510
899
4482
015
6870
035
000
1115
014
950
1341
3680
2650
720
1996
/97
1821
1011
9250
655
1108
5099
7400
8998
5670
4480
790
4636
016
2930
035
145
1100
014
000
1273
2343
1604
685
1997
/98
1792
1611
0226
615
1162
9097
1680
8356
4871
3845
789
4880
017
6258
036
118
1226
515
545
1267
2062
704
341
1998
/99
1904
2911
9731
629
1180
4310
9121
892
4444
2239
1188
453
894
1971
646
3658
411
675
1519
513
0112
6467
8536
1999
/00
1896
2912
2751
647
1226
2011
8250
096
4442
8338
0988
958
126
2103
426
3618
714
535
1517
510
4412
2974
4605
2000
/01
1884
5513
2331
702
1290
1913
1371
710
182
4226
3973
940
5942
222
1178
137
222
1128
916
392
1452
1136
459
404
2001
/02
1878
2013
4950
719
1350
9314
7275
710
902
3813
3763
987
5947
722
4799
037
796
1100
016
000
1455
102
150
1475
2002
/03
1867
2012
4931
669
1401
7115
3131
510
925
3597
3460
962
6042
523
4305
438
776
1185
117
035
1437
118
61520
2003
/04
1867
4113
2865
711
1430
2716
4335
711
490
3398
3310
974
5942
523
0532
638
794
1179
016
890
1433
1613
806
2004
/05
1878
2314
1989
756
1467
8917
3884
011
846
3003
3016
1004
5908
223
7610
340
217
1115
916
207
1452
2012
600
2005
/06
1880
6213
9322
741
1508
6419
7475
513
090
2733
2718
995
6205
824
6257
439
682
1197
517
100
1428
5957
966
2006
/07
1842
1813
5660
736
1535
3419
4324
612
657
2729
2648
970
6401
925
9978
940
610
1172
616
815
1434
5045
900
2007
/08
1803
2813
4286
745
1567
3720
5481
713
110
2687
2614
973
6296
224
8543
739
475
1159
016
988
1466
7569
913
2008
/09
1813
6113
5494
747
1819
0024
2404
813
326
2542
2497
982
5810
123
5441
240
523
1167
817
658
1512
100
59590
2009
/10
1985
4015
5050
781
1853
4225
1769
613
584
2534
2491
989
5831
024
9509
842
790
1051
312
959
1233
121
109
901
2010
/11
2137
0617
6186
824
1826
0025
0804
413
735
1135
1238
1091
6299
827
1822
643
148
1055
914
418
1365
135
135
1000
2011
/12
2148
3517
9145
.183
419
0250
2584
301
1358
3.7
1893
2557
1351
6447
229
3004
745
447
1054
014
424
1369
135
133
985
2012
/13
2156
0017
9000
830
1972
3426
9042
113
641
1800
2430
1350
6448
329
3000
045
438
1130
015
500
1371
175
150
857
2013
/14
2074
5718
1535
.387
520
5725
2817
512
1369
677
3.23
1004
.312
9976
863
3315
939
4314
187
8712
659.
414
4113
013
21012
CO
TT
ON
TO
BA
CC
OS
UG
AR
CA
NE
JUT
E O
ILS
EE
D P
OT
AT
O
18
TABLE 2.2
OILSEED SUGARCANE TOBACCO POTATO
DISTRICT Area Prod. Yield Area Prod. Yield Area Prod. Yield Area Prod.
TAPLEJUNG 564 627 1112 3690 44603
SANKHUWASABH 540 461 854 3130 39367
SOLUKHUMBU 178 108 607 10144 153747
E. MOUNTAIN 1282 1196 933 0 0 0 0 0 0 16964 237717
PANCHTHAR 670 550 820 37 1162 31400 1963 26013
ILLAM 858 858 1000 13 390 30000 6815 91749
TERHATHUM 450 296 658 12 300 25000 2880 33695
DHANKUTA 1000 628 628 45 880 19556 2050 33640
BHOJPUR 283 219 774 5 80 16000 14 12 857 3200 36755
KHOTANG 2312 2110 913 13 227 17462 15 17 1100 6250 69600
OKHALDHUNGA 559 284 509 5 43 8600 31 13 419 3340 37336
UDAYAPUR 5181 3881 749 10 33 3200 10 65 6500 750 8364
E. HILLS 11313 8826 780 140 3114 22214 70 107 1521 27248 337152
JHAPA 3475 4228 1217 200 5600 28000 2 1 600 14710 213295
MORANG 12375 11223 907 2320 162400 70000 5700 59850
SUNSARI 8625 6758 784 3365 187182 55626 50 45 900 4500 58500
SAPTARI 4250 3135 738 50 1000 20000 5565 71757
SIRAHA 6520 2076 318 2100 95590 45519 70 53 750 1900 24700
E. TERAI 35245 27420 778 8035 451772 56226 122 99 810 32375 428102
E. REGION 47839 37442 783 8175 454886 55642 192 205 1069 76587 1002971
DOLAKHA 317 254 801 3000 36000
SINDHUPALCHOK 2500 850 340 5040 60480
RASUWA 694 439 632 2560 37200
C. MOUNTAIN 3511 1543 439 0 0 0 0 10600 133680
RAMECHHAP 813 649 799 3070 32598
SINDHULI 5621 5869 1044 15 675 45000 1820 18200
KAVRE 4005 4346 1085 30 1050 35000 9770 181332
BHAKTAPUR 350 437 1249 1145 20700
LALITPUR 2320 1953 842 27 69 2556 1075 17770
KATHMANDU 980 1048 1069 2580 48010
NUWAKOT 805 835 1037 75 2925 39000 3600 65000
DHADING 665 506 761 28 1450 51786 1660 25487
MAKAWANPUR 1900 2208 1162 4910 67408
C. HILLS 17459 17851 1022 175 6169 35251 0 0 29630 476505
DHANUSHA 3373 2006 595 3605 151410 42000 100 100 1000 2325 28330
MAHOTTARI 3135 2314 738 7000 268800 38400 3550 44180
SARLAHI 6170 5327 863 22500 1129500 50200 250 250 1000 1385 19390
[Area in Ha., Prod. in Mt. and Yield in Kg/ Ha.]
AREA, PRODUCTION AND YIELD OF CASH CROPS , 2013/2014
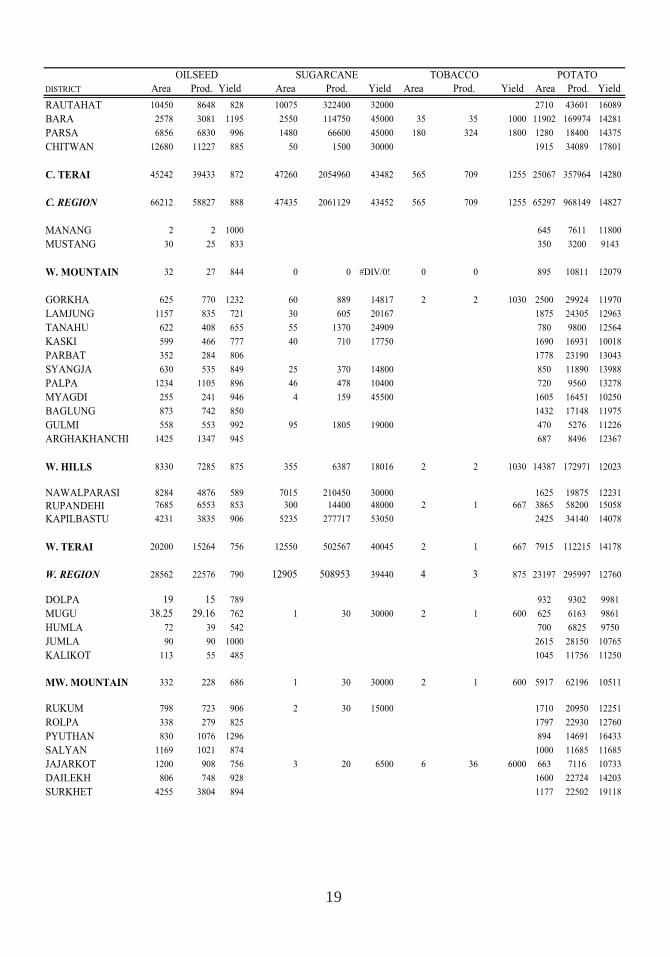
19
OILSEED SUGARCANE TOBACCO POTATO
DISTRICT Area Prod. Yield Area Prod. Yield Area Prod. Yield Area Prod. Yield
RAUTAHAT 10450 8648 828 10075 322400 32000 2710 43601 16089
BARA 2578 3081 1195 2550 114750 45000 35 35 1000 11902 169974 14281
PARSA 6856 6830 996 1480 66600 45000 180 324 1800 1280 18400 14375
CHITWAN 12680 11227 885 50 1500 30000 1915 34089 17801
C. TERAI 45242 39433 872 47260 2054960 43482 565 709 1255 25067 357964 14280
C. REGION 66212 58827 888 47435 2061129 43452 565 709 1255 65297 968149 14827
MANANG 2 2 1000 645 7611 11800
MUSTANG 30 25 833 350 3200 9143
W. MOUNTAIN 32 27 844 0 0 #DIV/0! 0 0 895 10811 12079
GORKHA 625 770 1232 60 889 14817 2 2 1030 2500 29924 11970
LAMJUNG 1157 835 721 30 605 20167 1875 24305 12963
TANAHU 622 408 655 55 1370 24909 780 9800 12564
KASKI 599 466 777 40 710 17750 1690 16931 10018
PARBAT 352 284 806 1778 23190 13043
SYANGJA 630 535 849 25 370 14800 850 11890 13988
PALPA 1234 1105 896 46 478 10400 720 9560 13278
MYAGDI 255 241 946 4 159 45500 1605 16451 10250
BAGLUNG 873 742 850 1432 17148 11975
GULMI 558 553 992 95 1805 19000 470 5276 11226
ARGHAKHANCHI 1425 1347 945 687 8496 12367
W. HILLS 8330 7285 875 355 6387 18016 2 2 1030 14387 172971 12023
NAWALPARASI 8284 4876 589 7015 210450 30000 1625 19875 12231
RUPANDEHI 7685 6553 853 300 14400 48000 2 1 667 3865 58200 15058
KAPILBASTU 4231 3835 906 5235 277717 53050 2425 34140 14078
W. TERAI 20200 15264 756 12550 502567 40045 2 1 667 7915 112215 14178
W. REGION 28562 22576 790 12905 508953 39440 4 3 875 23197 295997 12760
DOLPA 19 15 789 932 9302 9981
MUGU 38.25 29.16 762 1 30 30000 2 1 600 625 6163 9861
HUMLA 72 39 542 700 6825 9750
JUMLA 90 90 1000 2615 28150 10765
KALIKOT 113 55 485 1045 11756 11250
MW. MOUNTAIN 332 228 686 1 30 30000 2 1 600 5917 62196 10511
RUKUM 798 723 906 2 30 15000 1710 20950 12251
ROLPA 338 279 825 1797 22930 12760
PYUTHAN 830 1076 1296 894 14691 16433
SALYAN 1169 1021 874 1000 11685 11685
JAJARKOT 1200 908 756 3 20 6500 6 36 6000 663 7116 10733
DAILEKH 806 748 928 1600 22724 14203
SURKHET 4255 3804 894 1177 22502 19118
20
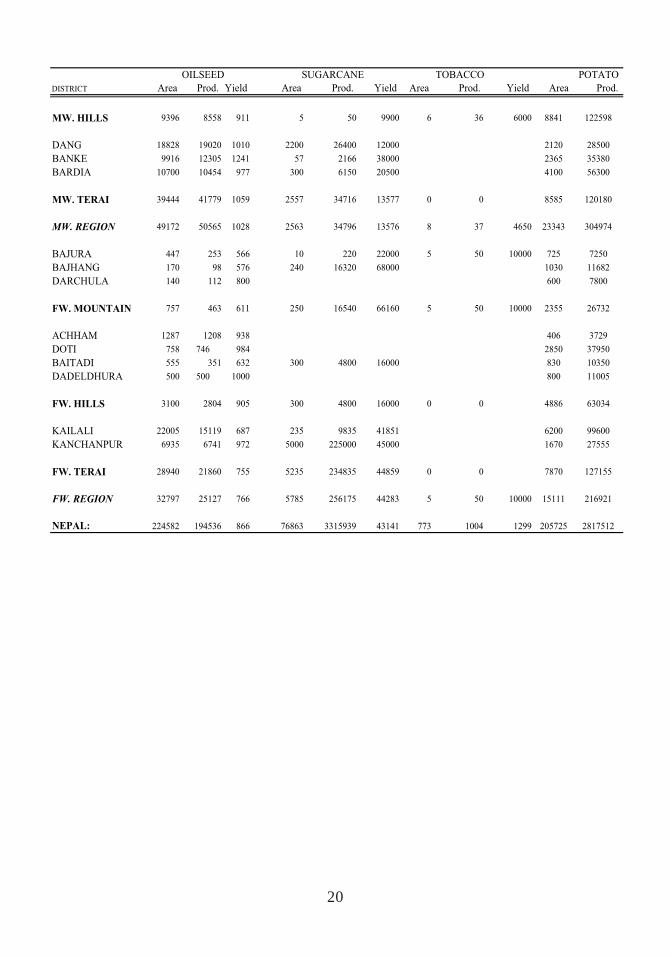
OILSEED SUGARCANE TOBACCO POTATO
DISTRICT Area Prod. Yield Area Prod. Yield Area Prod. Yield Area Prod.
MW. HILLS 9396 8558 911 5 50 9900 6 36 6000 8841 122598
DANG 18828 19020 1010 2200 26400 12000 2120 28500
BANKE 9916 12305 1241 57 2166 38000 2365 35380
BARDIA 10700 10454 977 300 6150 20500 4100 56300
MW. TERAI 39444 41779 1059 2557 34716 13577 0 0 8585 120180
MW. REGION 49172 50565 1028 2563 34796 13576 8 37 4650 23343 304974
BAJURA 447 253 566 10 220 22000 5 50 10000 725 7250
BAJHANG 170 98 576 240 16320 68000 1030 11682
DARCHULA 140 112 800 600 7800
FW. MOUNTAIN 757 463 611 250 16540 66160 5 50 10000 2355 26732
ACHHAM 1287 1208 938 406 3729
DOTI 758 746 984 2850 37950
BAITADI 555 351 632 300 4800 16000 830 10350
DADELDHURA 500 500 1000 800 11005
FW. HILLS 3100 2804 905 300 4800 16000 0 0 4886 63034
KAILALI 22005 15119 687 235 9835 41851 6200 99600
KANCHANPUR 6935 6741 972 5000 225000 45000 1670 27555
FW. TERAI 28940 21860 755 5235 234835 44859 0 0 7870 127155
FW. REGION 32797 25127 766 5785 256175 44283 5 50 10000 15111 216921
NEPAL: 224582 194536 866 76863 3315939 43141 773 1004 1299 205725 2817512
21
DIS
TR
ICT
Are
a P
rod.
Yie
ld
Are
a P
rod.
Yie
ld
Are
a P
rod.
Yie
ld
Are
a P
rod.
Yie
ld
Are
a P
rod.
Yie
ld
Are
a P
rod.
Yie
ld
Are
a P
rod.
Yie
ld
Are
a P
rod.
Yie
ld
TA
PL
EJU
NG
332
365
1099
170
187
1100
62
75
1210
SA
NK
HU
WA
SH
AV
325
276
850
100
85
850
100
90
900
54
700
10
7650
SO
LU
KH
UM
BU
165
99
600
10
7650
32
900
E.M
OU
NT
AIN
822
740
901
280
279
995
100
90
900
00
00
05
4700
00
075
84
1124
PA
NC
HT
HA
R535
402
752
75
56
747
60
92
1525
ILL
AM
858
858
1000
TE
RH
AT
HU
M310
192
619
18
10
556
40
45
1125
12
7583
70
42
600
DH
AN
KU
TA
875
560
640
15
9600
55
1000
53
500
100
51
510
BH
OJP
UR
204
154
755
45
38
844
714
2000
53
600
22
10
455
KH
OT
AN
G860
565
657
150
125
833
1200
1320
1100
10
71
32
67
2100
10
8800
50
18
360
OK
HA
LD
HU
NG
A460
235
510
40
24
140
20
500
19
6300
UD
AY
AP
UR
3950
2763
699
32
29
920
33
29
880
141
127
900
1025
933
910
E.H
ILL
S8052
5729
711
335
267
798
1233
1349
1094
50
31
620
184
243
1319
173
147
852
1025
933
910
261
127
485
JHA
PA
1700
2080
1224
600
790
1317
200
192
960
250
361
1200
185
925
400
470
1175
125
150
1200
MO
RA
NG
9690
8721
900
95
68
716
120
90
750
160
256
2240
204
850
1320
1254
950
750
630
840
SU
NS
AR
I2970
2240
754
849
690
814
906
680
751
2970
2455
185
60
707
170
134
790
422
290
687
255
208
817
SA
PT
AR
I1750
1400
800
750
605
807
1000
800
800
150
135
1100
70
700
500
125
250
SIR
AH
A1380
690
500
95
48
500
55
1490
196
400
4550
1138
250
E.T
ER
AI
17490
15131
865
2389
2201
921
2226
1762
792
3535
3212
909
85
60
707
1200
789
658
7192
3276
456
1130
988
875
E.R
EG
ION
26364
21600
819
3004
2747
915
3559
3201
900
3585
3243
905
269
303
1126
1378
940
682
8217
4209
512
1465
1199
818
DO
LA
KH
A310
248
800
44
1000
32
600
SIN
DH
UP
AL
CH
OK
620
570
919
30
27
890
170
94
550
1550
45
140
36
890
30
27
890
20
18
890
40
36
890
RA
SU
WA
34
24
700
20
10
500
300
147
490
145
160
1103
195
98
503
C.M
OU
NT
AIN
964
842
873
50
37
734
170
94
550
1550
45
44
40
900
330
174
526
165
178
1078
238
135
569
RA
ME
CH
AP
500
370
740
274
233
850
22
21
990
22
12
41608
11
1192
12
18
1500
SIN
DH
UL
I5000
5250
1050
355
373
1050
231
210
909
23
1500
18
18
1000
15
15
1000
KA
VR
E3437
3781
1100
275
330
1200
170
94
550
15
27
250
60
1200
55
52
951
32
800
BH
AK
TA
PU
R350
437
1249
LA
LIT
PU
R2245
1845
822
42
520
25
21
820
515
325
60
2400
32
667
10
6600
33
833
KA
TH
MA
ND
U980
1048
1069
NU
WA
KO
T350
350
1000
30
30
1000
15
9600
10
9195
244
1250
125
125
1000
80
68
850
DH
AD
ING
425
300
706
70
36
514
50
30
600
120
140
1167
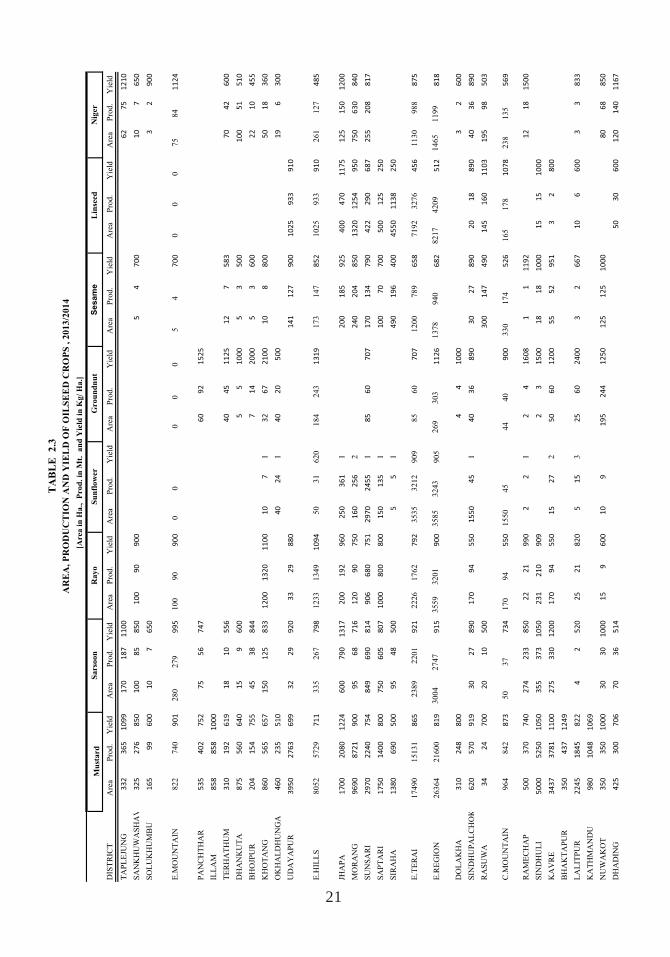
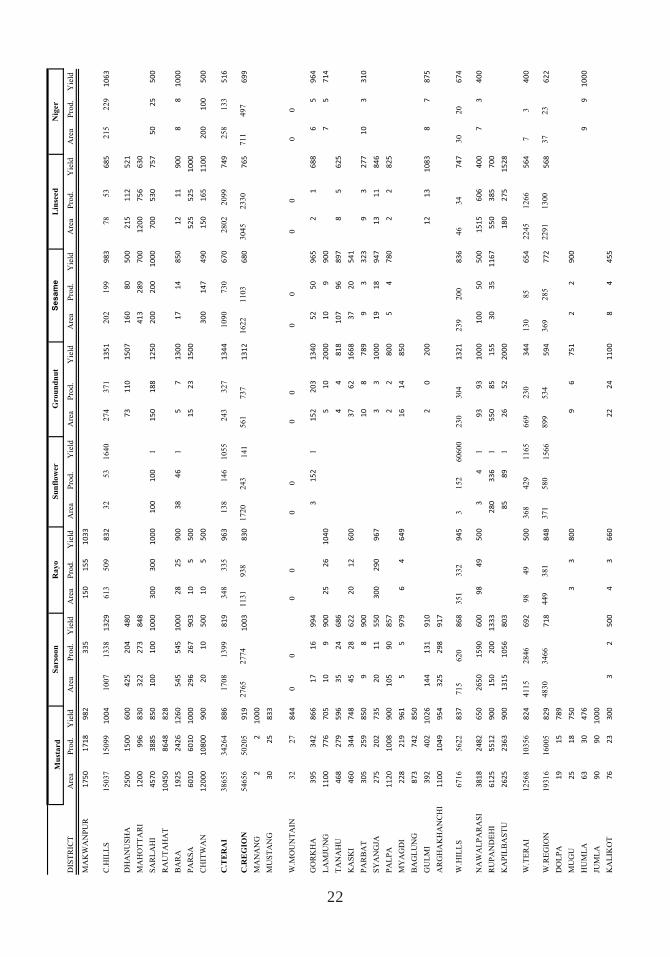
TA
BL
E
2.3
[A
rea i
n H
a., P
rod
. in
Mt.
an
d Y
ield
in
Kg/
Ha.]
Ses
ame
A
RE
A, P
RO
DU
CT
ION
AN
D Y
IEL
D O
F O
ILS
EE
D C
RO
PS
, 2
013/2
014
Lin
seed
Nig
er
Rayo
Sarso
on
Mu
stard
Grou
nd
nu
tS
un
flow
er
22
DIS
TR
ICT
Are
a P
rod.
Yie
ld
Are
a P
rod.
Yie
ld
Are
a P
rod.
Yie
ld
Are
a P
rod.
Yie
ld
Are
a P
rod.
Yie
ld
Are
a P
rod.
Yie
ld
Are
a P
rod.
Yie
ld
Are
a P
rod.
Yie
ld
Ses
ame
Lin
seed
Nig
er
Rayo
Sarso
on
Mu
stard
Grou
nd
nu
tS
un
flow
er
MA
KW
AN
PU
R1750
1718
982
335
150
155
1033
C.H
ILL
S15037
15099
1004
1007
1338
1329
613
509
832
32
53
1640
274
371
1351
202
199
983
78
53
685
215
229
1063
DH
AN
US
HA
2500
1500
600
425
204
480
73
110
1507
160
80
500
215
112
521
MA
HO
TT
AR
I1200
996
830
322
273
848
413
289
700
1200
756
630
SA
RL
AH
I4570
3885
850
100
100
1000
300
300
1000
100
100
1150
188
1250
200
200
1000
700
530
757
50
25
500
RA
UT
AH
AT
10450
8648
828
BA
RA
1925
2426
1260
545
545
1000
28
25
900
38
46
15
71300
17
14
850
12
11
900
88
1000
PA
RS
A6010
6010
1000
296
267
903
10
5500
15
23
1500
525
525
1000
CH
ITW
AN
12000
10800
900
20
10
500
10
5500
300
147
490
150
165
1100
200
100
500
C.T
ER
AI
38655
34264
886
1708
1399
819
348
335
963
138
146
1055
243
327
1344
1090
730
670
2802
2099
749
258
133
516
C.R
EG
ION
54656
50205
919
2765
2774
1003
1131
938
830
1720
243
141
561
737
1312
1622
1103
680
3045
2330
765
711
497
699
MA
NA
NG
22
1000
MU
ST
AN
G30
25
833
W.M
OU
NT
AIN
32
27
844
00
00
00
00
00
00
00
GO
RK
HA
395
342
866
17
16
994
3152
1152
203
1340
52
50
965
21
688
65
964
LA
MJU
NG
1100
776
705
10
9900
25
26
1040
510
2000
10
9900
75
714
TA
NA
HU
468
279
596
35
24
686
44
818
107
96
897
85
625
KA
SK
I460
344
748
45
28
622
20
12
600
37
62
1668
37
20
541
PA
RB
AT
305
259
850
98
900
10
8789
93
323
93
277
10
3310
SY
AN
GJA
275
202
735
20
11
550
300
290
967
33
1000
19
18
947
13
11
846
PA
LP
A1120
1008
900
105
90
857
22
800
54
780
22
825
MY
AG
DI
228
219
961
55
979
64
649
16
14
850
BA
GL
UN
G873
742
850
GU
LM
I392
402
1026
144
131
910
20
200
12
13
1083
87
875
AR
GH
AK
HA
NC
HI
1100
1049
954
325
298
917
W.H
ILL
S6716
5622
837
715
620
868
351
332
945
3152
60600
230
304
1321
239
200
836
46
34
747
30
20
674
NA
WA
LP
AR
AS
I3818
2482
650
2650
1590
600
98
49
500
34
193
93
1000
100
50
500
1515
606
400
73
400
RU
PA
ND
EH
I6125
5512
900
150
200
1333
280
336
1550
85
155
30
35
1167
550
385
700
KA
PIL
BA
ST
U2625
2363
900
1315
1056
803
85
89
126
52
2000
180
275
1528
W.T
ER
AI
12568
10356
824
4115
2846
692
98
49
500
368
429
1165
669
230
344
130
85
654
2245
1266
564
73
400
W.R
EG
ION
19316
16005
829
4830
3466
718
449
381
848
371
580
1566
899
534
594
369
285
772
2291
1300
568
37
23
622
DO
LP
A19
15
789
MU
GU
25
18
750
33
800
96
751
22
900
HU
ML
A63
30
476
99
1000
JUM
LA
90
90
1000
KA
LIK
OT
76
23
300
32
500
43
660
22
24
1100
84
455
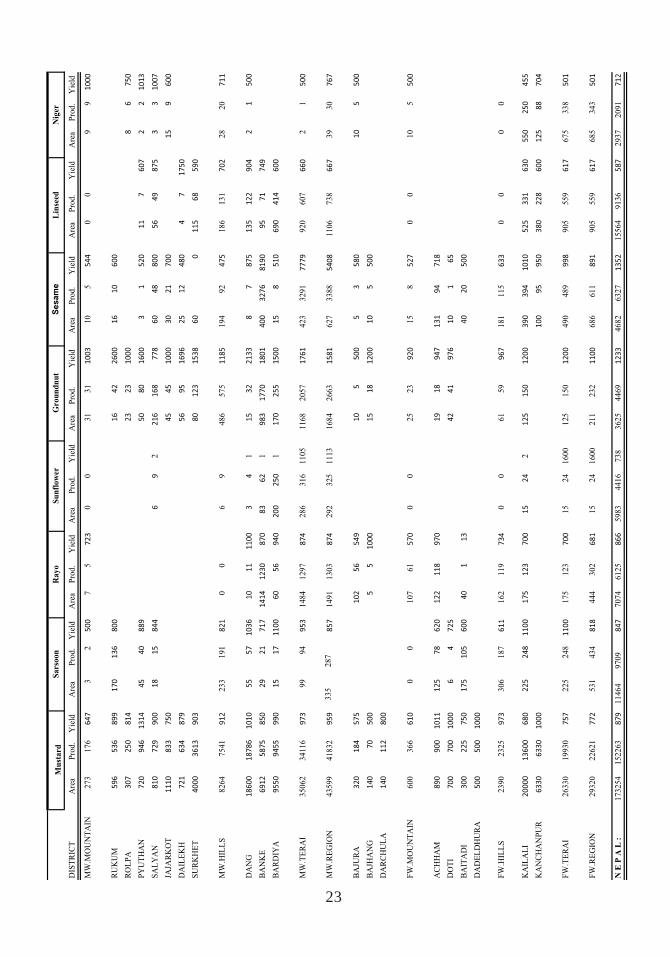
23
DIS
TR
ICT
Are
a P
rod.
Yie
ld
Are
a P
rod.
Yie
ld
Are
a P
rod.
Yie
ld
Are
a P
rod.
Yie
ld
Are
a P
rod.
Yie
ld
Are
a P
rod.
Yie
ld
Are
a P
rod.
Yie
ld
Are
a P
rod.
Yie
ld
Ses
ame
Lin
seed
Nig
erR
ayo
Sars
oon
Mu
stard
Gro
un
dn
ut
Su
nfl
ow
er
MW
.MO
UN
TA
IN273
176
647
32
500
75
723
00
31
31
1003
10
5544
00
99
1000
RU
KU
M596
536
899
170
136
800
16
42
2600
16
10
600
RO
LP
A307
250
814
23
23
1000
86
750
PY
UT
HA
N720
946
1314
45
40
889
50
80
1600
31
520
11
7607
22
1013
SA
LY
AN
810
729
900
18
15
844
69
2216
168
778
60
48
800
56
49
875
33
1007
JAJA
RK
OT
1110
833
750
45
45
1000
30
21
700
15
9600
DA
ILE
KH
721
634
879
56
95
1696
25
12
480
47
1750
SU
RK
HE
T4000
3613
903
80
123
1538
60
0115
68
590
MW
.HIL
LS
8264
7541
912
233
191
821
00
69
486
575
1185
194
92
475
186
131
702
28
20
711
DA
NG
18600
18786
1010
55
57
1036
10
11
1100
34
115
32
2133
87
875
135
122
904
21
500
BA
NK
E6912
5875
850
29
21
717
1414
1230
870
83
62
1983
1770
1801
400
3276
8190
95
71
749
BA
RD
IYA
9550
9455
990
15
17
1100
60
56
940
200
250
1170
255
1500
15
8510
690
414
600
MW
.TE
RA
I35062
34116
973
99
94
953
1484
1297
874
286
316
1105
1168
2057
1761
423
3291
7779
920
607
660
21
500
MW
.RE
GIO
N43599
41832
959
335
287
857
1491
1303
874
292
325
1113
1684
2663
1581
627
3388
5408
1106
738
667
39
30
767
BA
JUR
A320
184
575
102
56
549
10
5500
53
580
10
5500
BA
JHA
NG
140
70
500
55
1000
15
18
1200
10
5500
DA
RC
HU
LA
140
112
800
FW
.MO
UN
TA
IN600
366
610
00
107
61
570
00
25
23
920
15
8527
00
10
5500
AC
HH
AM
890
900
1011
125
78
620
122
118
970
19
18
947
131
94
718
DO
TI
700
700
1000
64
725
42
41
976
10
165
BA
ITA
DI
300
225
750
175
105
600
40
113
40
20
500
DA
DE
LD
HU
RA
500
500
1000
FW
.HIL
LS
2390
2325
973
306
187
611
162
119
734
00
61
59
967
181
115
633
00
00
KA
ILA
LI
20000
13600
680
225
248
1100
175
123
700
15
24
2125
150
1200
390
394
1010
525
331
630
550
250
455
KA
NC
HA
NP
UR
6330
6330
1000
100
95
950
380
228
600
125
88
704
FW
.TE
RA
I26330
19930
757
225
248
1100
175
123
700
15
24
1600
125
150
1200
490
489
998
905
559
617
675
338
501
FW
.RE
GIO
N29320
22621
772
531
434
818
444
302
681
15
24
1600
211
232
1100
686
611
891
905
559
617
685
343
501
N E
P A
L :
173254
152263
879
11464
9709
847
7074
6125
866
5983
4416
738
3625
4469
1233
4682
6327
1352
15564
9136
587
2937
2091
712
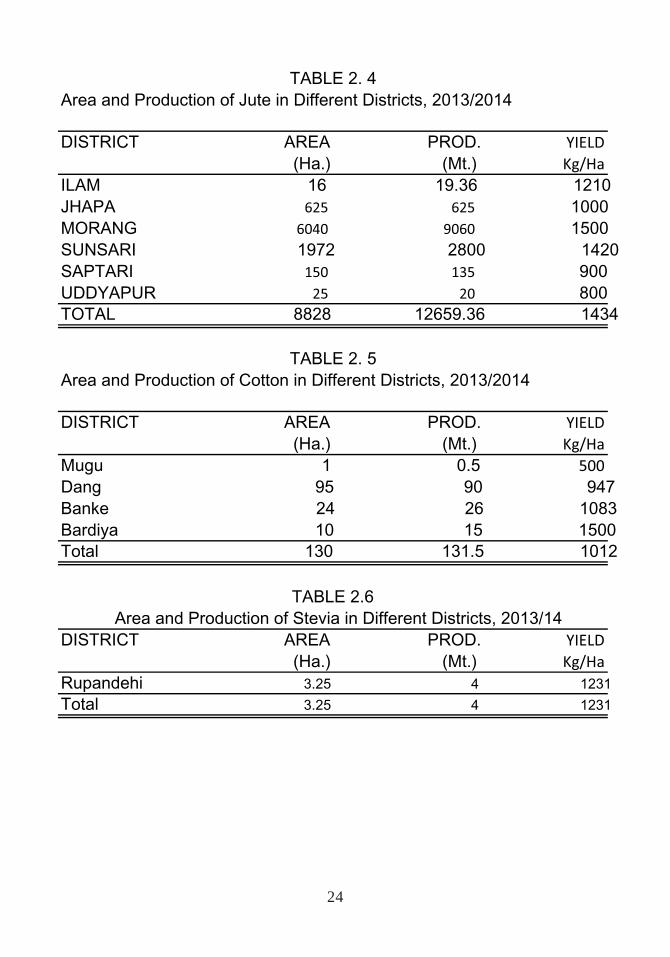
24
Area and Production of Jute in Different Districts, 2013/2014
DISTRICT AREA PROD. YIELD
(Ha.) (Mt.) Kg/Ha
ILAM 16 19.36 1210JHAPA 625 625 1000MORANG 6040 9060 1500SUNSARI 1972 2800 1420SAPTARI 150 135 900UDDYAPUR 25 20 800TOTAL 8828 12659.36 1434
Area and Production of Cotton in Different Districts, 2013/2014
DISTRICT AREA PROD. YIELD
(Ha.) (Mt.) Kg/Ha
Mugu 1 0.5 500
Dang 95 90 947Banke 24 26 1083Bardiya 10 15 1500Total 130 131.5 1012
DISTRICT AREA PROD. YIELD
(Ha.) (Mt.) Kg/Ha
Rupandehi 3.25 4 1231
Total 3.25 4 1231
TABLE 2. 5
TABLE 2. 4
Area and Production of Stevia in Different Districts, 2013/14TABLE 2.6
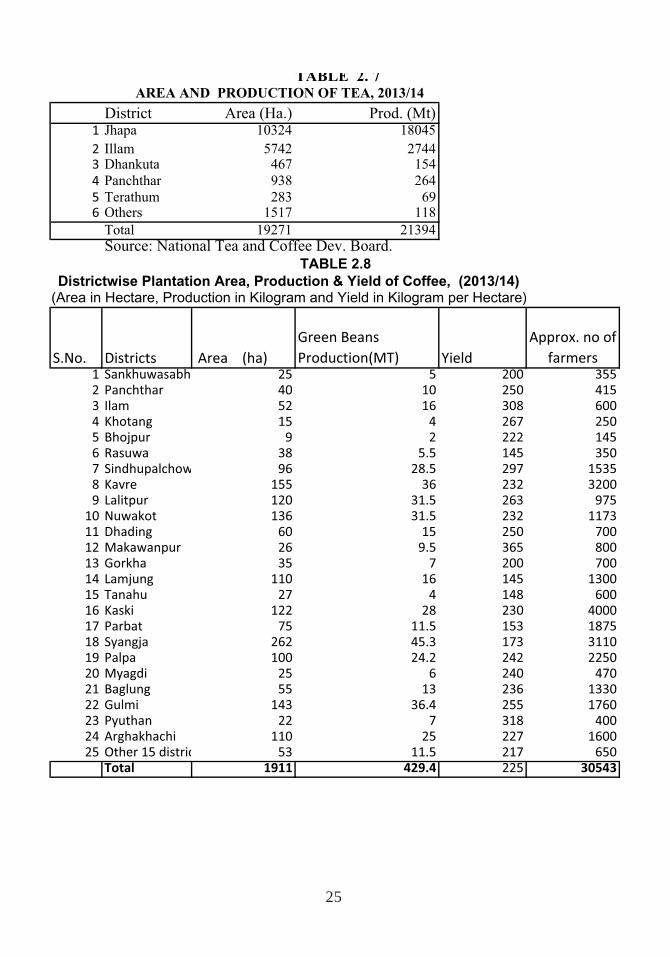
25
District Area (Ha.) Prod. (Mt)1 Jhapa 10324 18045
2 Illam 5742 27443 Dhankuta 467 154
4 Panchthar 938 264
5 Terathum 283 696 Others 1517 118
Total 19271 21394
Source: National Tea and Coffee Dev. Board.
S.No. Districts Area (ha)
Green Beans
Production(MT) Yield
Approx. no of
farmers1 Sankhuwasabh 25 5 200 3552 Panchthar 40 10 250 4153 Ilam 52 16 308 6004 Khotang 15 4 267 2505 Bhojpur 9 2 222 1456 Rasuwa 38 5.5 145 3507 Sindhupalchow 96 28.5 297 15358 Kavre 155 36 232 32009 Lalitpur 120 31.5 263 97510 Nuwakot 136 31.5 232 117311 Dhading 60 15 250 70012 Makawanpur 26 9.5 365 80013 Gorkha 35 7 200 70014 Lamjung 110 16 145 130015 Tanahu 27 4 148 60016 Kaski 122 28 230 400017 Parbat 75 11.5 153 187518 Syangja 262 45.3 173 311019 Palpa 100 24.2 242 225020 Myagdi 25 6 240 47021 Baglung 55 13 236 133022 Gulmi 143 36.4 255 176023 Pyuthan 22 7 318 40024 Arghakhachi 110 25 227 160025 Other 15 distric 53 11.5 217 650
Total 1911 429.4 225 30543
TABLE 2.8Districtwise Plantation Area, Production & Yield of Coffee, (2013/14)
AREA AND PRODUCTION OF TEA, 2013/14
TABLE 2. 7
(Area in Hectare, Production in Kilogram and Yield in Kilogram per Hectare)
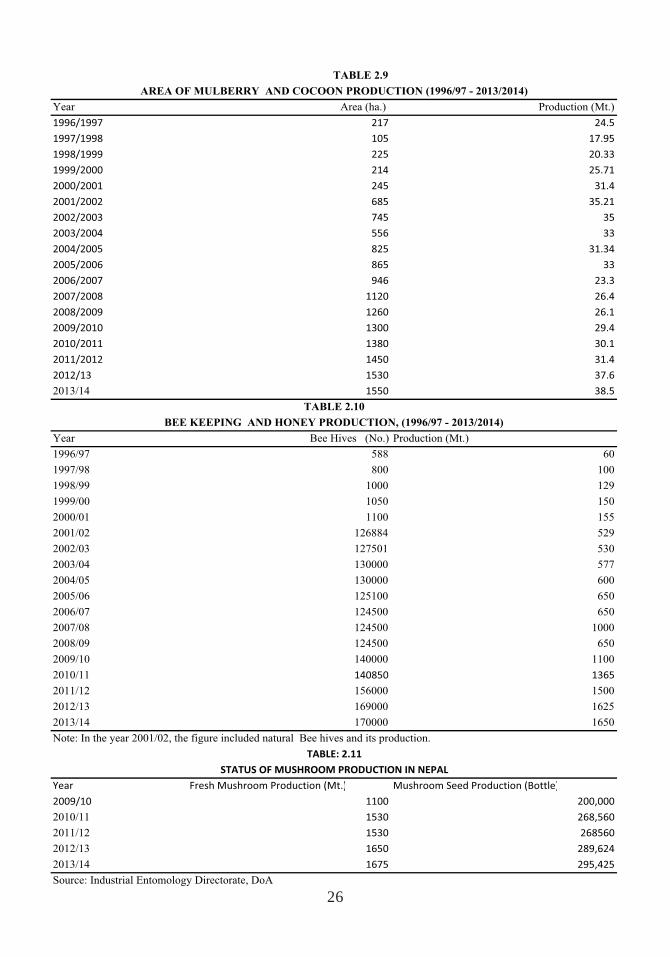
26
TABLE 2.9
Year Area (ha.) Production (Mt.)
1996/1997 217 24.5
1997/1998 105 17.95
1998/1999 225 20.33
1999/2000 214 25.71
2000/2001 245 31.4
2001/2002 685 35.21
2002/2003 745 35
2003/2004 556 33
2004/2005 825 31.34
2005/2006 865 33
2006/2007 946 23.3
2007/2008 1120 26.4
2008/2009 1260 26.1
2009/2010 1300 29.4
2010/2011 1380 30.1
2011/2012 1450 31.4
2012/13 1530 37.6
2013/14 1550 38.5
Year Bee Hives (No.) Production (Mt.)
1996/97 588 60
1997/98 800 100
1998/99 1000 129
1999/00 1050 150
2000/01 1100 155
2001/02 126884 529
2002/03 127501 530
2003/04 130000 577
2004/05 130000 600
2005/06 125100 650
2006/07 124500 650
2007/08 124500 1000
2008/09 124500 650
2009/10 140000 1100
2010/11 140850 1365
2011/12 156000 1500
2012/13 169000 1625
2013/14 170000 1650
Note: In the year 2001/02, the figure included natural Bee hives and its production.
Year Fresh Mushroom Production (Mt.) Mushroom Seed Production (Bottle)
2009/10 1100 200,000
2010/11 1530 268,560
2011/12 1530 268560
2012/13 1650 289,624
2013/14 1675 295,425
Source: Industrial Entomology Directorate, DoA
STATUS OF MUSHROOM PRODUCTION IN NEPAL
TABLE: 2.11
AREA OF MULBERRY AND COCOON PRODUCTION (1996/97 - 2013/2014)
BEE KEEPING AND HONEY PRODUCTION, (1996/97 - 2013/2014)
TABLE 2.10
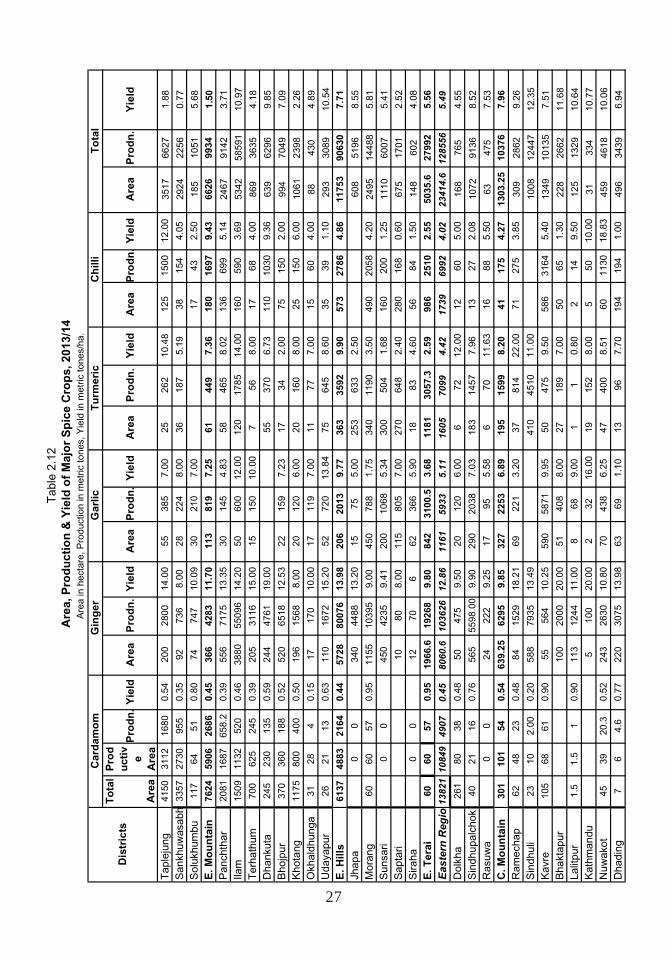
27
To
tal
Are
a
Pro
du
ctiv
e A
rea
Pro
dn
.Y
ield
Are
aP
rod
n.
Yie
ldA
rea
Pro
dn
.Y
ield
Are
aP
rod
n.
Yie
ldA
rea
Pro
dn
.Y
ield
Are
aP
rod
n.
Yie
ld
Tap
leju
ng41
5031
1216
800.
5420
028
0014
.00
5538
57.
0025
262
10.4
812
515
0012
.00
3517
6627
1.88
San
khuw
asab
h33
5727
3095
50.
3592
736
8.00
2822
48.
0036
187
5.19
3815
44.
0529
2422
560.
77
Sol
ukhu
mbu
117
6451
0.80
7474
710
.09
3021
07.
0017
432.
5018
510
515.
68
E. M
ou
nta
in76
2459
0626
860.
4536
642
8311
.70
113
819
7.25
6144
97.
3618
016
979.
4366
2699
341.
50
Pan
chth
ar20
8116
8765
8.2
0.39
556
7175
13.3
530
145
4.83
5846
58.
0213
669
95.
1424
6791
423.
71
Ilam
1509
1132
520
0.46
3880
5509
614
.20
5060
012
.00
120
1785
14.0
016
059
03.
6953
4258
591
10.9
7
Ter
hath
um70
062
524
50.
3920
531
1615
.00
1515
010
.00
756
8.00
1768
4.00
869
3635
4.18
Dha
nkut
a24
523
013
50.
5924
447
6119
.00
5537
06.
7311
010
309.
3663
962
969.
85
Bho
jpur
370
360
188
0.52
520
6518
12.5
322
159
7.23
1734
2.00
7515
02.
0099
470
497.
09
Kho
tang
1175
800
400
0.50
196
1568
8.00
2012
06.
0020
160
8.00
2515
06.
0010
6123
982.
26
Okh
aldh
unga
3128
40.
1517
170
10.0
017
119
7.00
1177
7.00
1560
4.00
8843
04.
89
Uda
yapu
r26
2113
0.63
110
1672
15.2
052
720
13.8
475
645
8.60
3539
1.10
293
3089
10.5
4
E. H
ills
6137
4883
2164
0.44
5728
8007
613
.98
206
2013
9.77
363
3592
9.90
573
2786
4.86
1175
390
630
7.71
Jhap
a0
034
044
8813
.20
1575
5.00
253
633
2.50
608
5196
8.55
Mor
ang
6060
570.
9511
5510
395
9.00
450
788
1.75
340
1190
3.50
490
2058
4.20
2495
1448
85.
81
Sun
sari
00
450
4235
9.41
200
1068
5.34
300
504
1.68
160
200
1.25
1110
6007
5.41
Sap
tari
1080
8.00
115
805
7.00
270
648
2.40
280
168
0.60
675
1701
2.52
Sira
ha0
012
706
6236
65.
9018
834.
6056
841.
5014
860
24.
08
E. T
erai
6060
570.
9519
66.6
1926
89.
8084
231
00.5
3.68
1181
3057
.32.
5998
625
102.
5550
35.6
2799
25.
56
Eas
tern
Reg
io13
821
1084
949
070.
4580
60.6
1036
2612
.86
1161
5933
5.11
1605
7099
4.42
1739
6992
4.02
2341
4.6
1285
565.
49
Dol
kha
261
8038
0.48
5047
59.
5020
120
6.00
672
12.0
012
605.
0016
876
54.
55
Sin
dhup
alch
ok40
2116
0.76
565
5598
.00
9.90
290
2038
7.03
183
1457
7.96
1327
2.08
1072
9136
8.52
Ras
uwa
00
2422
29.
2517
955.
586
7011
.63
1688
5.50
6347
57.
53
C. M
ou
nta
in30
110
154
0.54
639.
2562
959.
8532
722
536.
8919
515
998.
2041
175
4.27
1303
.25
1037
67.
96
Ram
echa
p62
4823
0.48
8415
2918
.21
6922
13.
2037
814
22.0
071
275
3.85
309
2862
9.26
Sin
dhul
i23
102.
000.
2058
879
3513
.49
410
4510
11.0
010
0812
447
12.3
5
Kav
re10
568
610.
9055
564
10.2
559
058
719.
9550
475
9.50
586
3164
5.40
1349
1013
57.
51
Bha
ktap
ur10
020
0020
.00
5140
88.
0027
189
7.00
5065
1.30
228
2662
11.6
8
Lalit
pur
1.5
1.5
10.
9011
312
4411
.00
868
9.00
11
0.80
214
9.50
125
1329
10.6
4
Kat
hman
du5
100
20.0
02
3216
.00
1915
28.
005
5010
.00
3133
410
.77
Nuw
akot
4539
20.3
0.52
243
2630
10.8
070
438
6.25
4740
08.
5160
1130
18.8
345
946
1810
.06
Dha
ding
76
4.6
0.77
220
3075
13.9
863
691.
1013
967.
7019
419
41.
0049
634
396.
94
Tab
le 2
.12
Are
a, P
rod
uct
ion
& Y
ield
of
Maj
or
Sp
ice
Cro
ps,
201
3/14
Are
a in
hec
tare
, Pro
duct
ion
in m
etric
tone
s, Y
ield
in m
etric
tone
s/ha
.
To
tal
Dis
tric
ts
Car
dam
om
Gin
ger
Gar
licT
urm
eric
Ch
illi
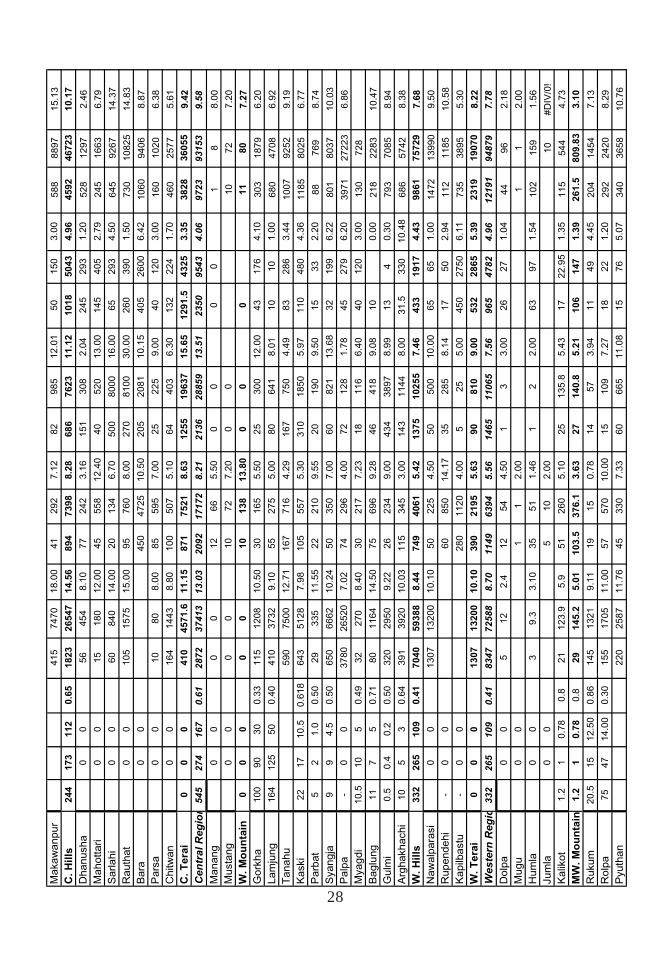
28
Mak
awan
pur
415
7470
18.0
041
292
7.12
8298
512
.01
5015
03.
0058
888
9715
.13
C. H
ills
244
173
112
0.65
1823
2654
714
.56
894
7398
8.28
686
7623
11.1
210
1850
434.
9645
9246
723
10.1
7
Dha
nush
a0
056
454
8.10
7724
23.
1615
130
82.
0424
529
31.
2052
812
972.
46
Mah
otta
ri0
015
180
12.0
045
558
12.4
040
520
13.0
014
540
52.
7924
516
636.
79
Sar
lahi
00
6084
014
.00
2013
46.
7050
080
0016
.00
6529
34.
5064
592
6714
.37
Rau
that
00
105
1575
15.0
095
760
8.00
270
8100
30.0
026
039
01.
5073
010
825
14.8
3
Bar
a0
045
047
2510
.50
205
2081
10.1
540
526
006.
4210
6094
068.
87
Par
sa0
010
808.
0085
595
7.00
2522
59.
0040
120
3.00
160
1020
6.38
Chi
twan
00
164
1443
8.80
100
507
5.10
6440
36.
3013
222
41.
7046
025
775.
61
C. T
erai
00
041
045
71.6
11.1
587
175
218.
6312
5519
637
15.6
512
91.5
4325
3.35
3828
3605
59.
42
Cen
tral
Reg
ion
545
274
167
0.61
2872
3741
313
.03
2092
1717
28.
2121
3628
859
13.5
123
5095
434.
0697
2393
153
9.58
Man
ang
00
00
1266
5.50
00
00
18
8.00
Mus
tang
00
00
1072
7.20
00
1072
7.20
W. M
ou
nta
in0
00
00
1013
813
.80
00
011
807.
27
Gor
kha
100
9030
0.33
115
1208
10.5
030
165
5.50
2530
012
.00
4317
64.
1030
318
796.
20
Lam
jung
164
125
500.
4041
037
329.
1055
275
5.00
8064
18.
0110
101.
0068
047
086.
92
Tan
ahu
590
7500
12.7
116
771
64.
2916
775
04.
4983
286
3.44
1007
9252
9.19
Kas
ki22
1710
.50.
618
643
5128
7.98
105
557
5.30
310
1850
5.97
110
480
4.36
1185
8025
6.77
Par
bat
52
1.0
0.50
2933
511
.55
2221
09.
5520
190
9.50
1533
2.20
8876
98.
74
Sya
ngja
99
4.5
0.50
650
6662
10.2
450
350
7.00
6082
113
.68
3219
96.
2280
180
3710
.03
Pal
pa-
00
3780
2652
07.
0274
296
4.00
7212
81.
7845
279
6.20
3971
2722
36.
86
Mya
gdi
10.5
105
0.49
3227
08.
4030
217
7.23
1811
66.
4040
120
3.00
130
728
Bag
lung
117
50.
7180
1164
14.5
075
696
9.28
4641
89.
0810
0.00
218
2283
10.4
7
Gul
mi
0.5
0.4
0.2
0.50
320
2950
9.22
2623
49.
0043
438
978.
9913
40.
3079
370
858.
94
Arg
hakh
achi
105
30.
6439
139
2010
.03
115
345
3.00
143
1144
8.00
31.5
330
10.4
868
657
428.
38
W. H
ills
332
265
109
0.41
7040
5938
88.
4474
940
615.
4213
7510
255
7.46
433
1917
4.43
9861
7572
97.
68
Naw
alpa
rasi
00
1307
1320
010
.10
5022
54.
5050
500
10.0
065
651.
0014
7213
990
9.50
Rup
ende
hi-
00
6085
014
.17
3528
58.
1417
502.
9411
211
8510
.58
Kap
ilbas
tu-
00
280
1120
4.00
525
5.00
450
2750
6.11
735
3895
5.30
W. T
erai
00
013
0713
200
10.1
039
021
955.
6390
810
9.00
532
2865
5.39
2319
1907
08.
22
Wes
tern
Reg
io33
226
510
90.
4183
4772
588
8.70
1149
6394
5.56
1465
1106
57.
5696
547
824.
9612
191
9487
97.
78
Dol
pa0
05
122.
412
544.
501
33.
0026
271.
0444
962.
18
Mug
u0
01
12.
001
12.
00
Hum
la0
03
9.3
3.10
3551
1.46
12
2.00
6397
1.54
102
159
1.56
Jum
la0
05
102.
0010
#DIV
/0!
Kal
ikot
1.2
10.
780.
821
123.
95.
951
260
5.10
2513
5.8
5.43
1722
.95
1.35
115
544
4.73
MW
. Mo
un
tain
1.2
10.
780.
829
145.
25.
0110
3.5
376.
13.
6327
140.
85.
2110
614
71.
3926
1.5
809.
833.
10
Ruk
um20
.515
12.5
00.
8614
513
219.
1119
150.
7814
573.
9411
494.
4520
414
547.
13
Rol
pa75
4714
.00
0.30
155
1705
11.0
057
570
10.0
015
109
7.27
1822
1.20
292
2420
8.29
Pyu
than
220
2587
11.7
645
330
7.33
6066
511
.08
1576
5.07
340
3658
10.7
6
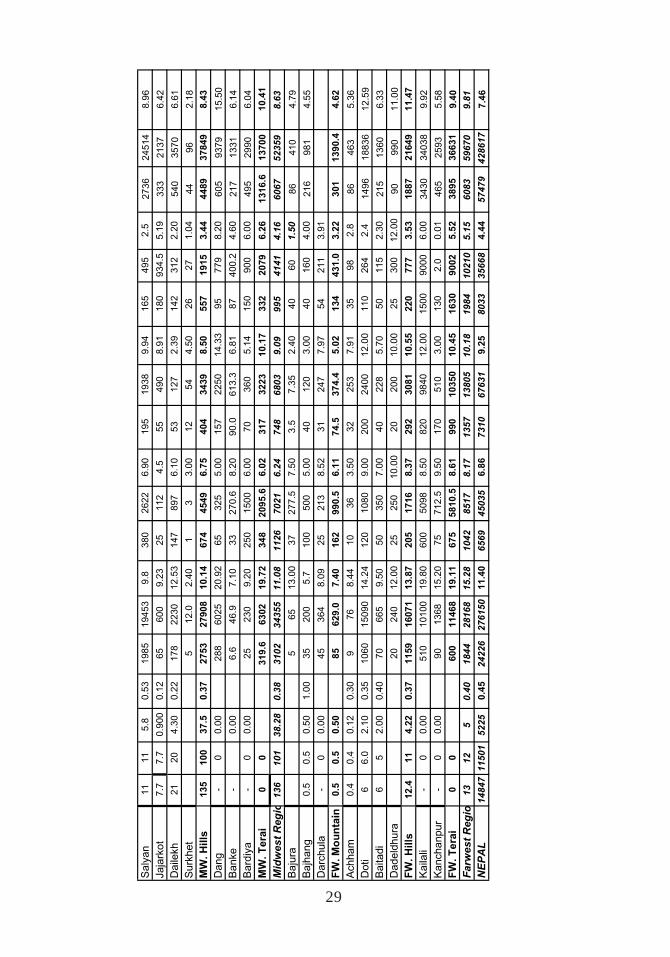
29
Sal
yan
1111
5.8
0.53
1985
1945
39.
838
026
226.
9019
519
389.
9416
549
52.
527
3624
514
8.96
Jaja
rkot
7.7
7.7
0.90
00.
1265
600
9.23
2511
24.
555
490
8.91
180
934.
55.
1933
321
376.
42
Dai
lekh
2120
4.30
0.22
178
2230
12.5
314
789
76.
1053
127
2.39
142
312
2.20
540
3570
6.61
Sur
khet
512
.02.
401
33.
0012
544.
5026
271.
0444
962.
18
MW
. Hill
s13
510
037
.50.
3727
5327
908
10.1
467
445
496.
7540
434
398.
5055
719
153.
4444
8937
849
8.43
Dan
g-
00.
0028
860
2520
.92
6532
55.
0015
722
5014
.33
9577
98.
2060
593
7915
.50
Ban
ke-
0.00
6.6
46.9
7.10
3327
0.6
8.20
90.0
613.
36.
8187
400.
24.
6021
713
316.
14
Bar
diya
-0
0.00
2523
09.
2025
015
006.
0070
360
5.14
150
900
6.00
495
2990
6.04
MW
. Ter
ai0
031
9.6
6302
19.7
234
820
95.6
6.02
317
3223
10.1
733
220
796.
2613
16.6
1370
010
.41
Mid
wes
t R
egio
136
101
38.2
80.
3831
0234
355
11.0
811
2670
216.
2474
868
039.
0999
541
414.
1660
6752
359
8.63
Baj
ura
565
13.0
037
277.
57.
503.
57.
352.
4040
601.
5086
410
4.79
Baj
hang
0.5
0.5
0.50
1.00
3520
05.
710
050
05.
0040
120
3.00
4016
04.
0021
698
14.
55
Dar
chul
a-
00.
0045
364
8.09
2521
38.
5231
247
7.97
5421
13.
91
FW
. Mo
un
tain
0.5
0.5
0.50
8562
9.0
7.40
162
990.
56.
1174
.537
4.4
5.02
134
431.
03.
2230
113
90.4
4.62
Ach
ham
0.4
0.4
0.12
0.30
976
8.44
1036
3.50
3225
37.
9135
982.
886
463
5.36
Dot
i6
6.0
2.10
0.35
1060
1509
014
.24
120
1080
9.00
200
2400
12.0
011
026
42.
414
9618
836
12.5
9
Bai
tadi
65
2.00
0.40
7066
59.
5050
350
7.00
4022
85.
7050
115
2.30
215
1360
6.33
Dad
eldh
ura
2024
012
.00
2525
010
.00
2020
010
.00
2530
012
.00
9099
011
.00
FW
. Hill
s12
.411
4.22
0.37
1159
1607
113
.87
205
1716
8.37
292
3081
10.5
522
077
73.
5318
8721
649
11.4
7
Kai
lali
-0
0.00
510
1010
019
.80
600
5098
8.50
820
9840
12.0
015
0090
006.
0034
3034
038
9.92
Kan
chan
pur
-0
0.00
9013
6815
.20
7571
2.5
9.50
170
510
3.00
130
2.0
0.01
465
2593
5.58
FW
. Ter
ai0
060
011
468
19.1
167
558
10.5
8.61
990
1035
010
.45
1630
9002
5.52
3895
3663
19.
40
Far
wes
t R
egio
1312
50.
4018
4428
168
15.2
810
4285
178.
1713
5713
805
10.1
819
8410
210
5.15
6083
5967
09.
81
NE
PA
L14
847
1150
152
250.
4524
226
2761
5011
.40
6569
4503
56.
8673
1067
631
9.25
8033
3566
84.
4457
479
4286
177.
46

30
31
3.PULSE CROPS

32
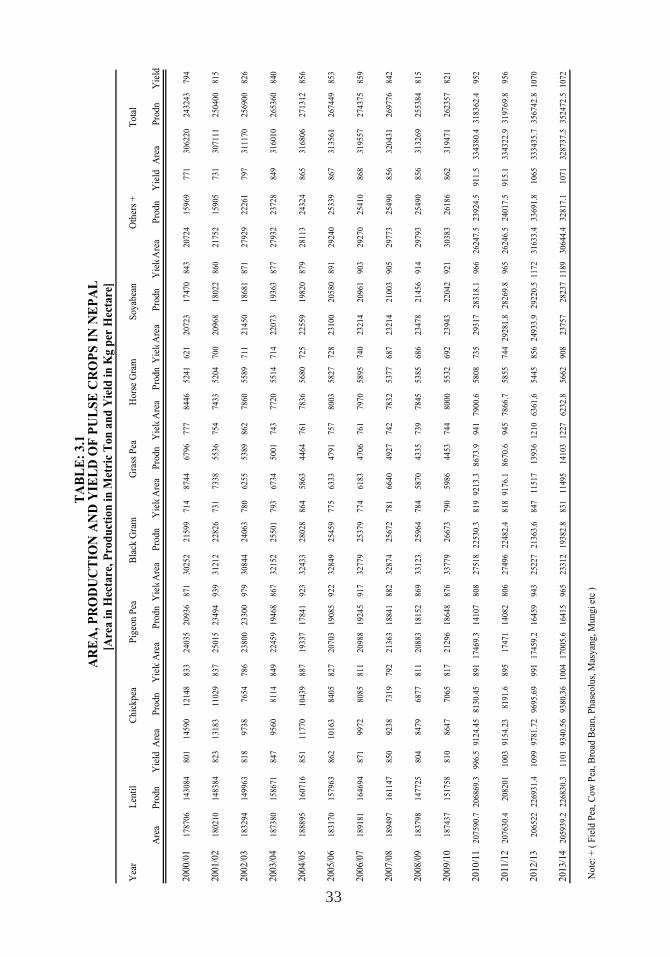
33
Yea
r
Are
aP
rodn
Yie
ldA
rea
Pro
dn
Yie
l dA
rea
Pro
dn
Yie
ldA
rea
Pro
dn
Yie
ldA
rea
Pro
dn
Yie
ldA
rea
Pro
dn
Yie
ldA
rea
Pro
dn
Yie
ldA
rea
Pro
dn
Yie
ldA
rea
Pro
dn
Yie
ld
2000/0
1178706
14308
48
01
14
59
01
21
48
83
32
40
35
20
936
871
30252
21599
714
8744
6796
777
8446
5241
621
20723
17470
84
32
07
24
15
96
97
71
30
62
20
24
32
43
79
4
2001/0
2180210
14838
48
23
13
18
31
10
29
83
72
50
15
23
494
939
31212
22826
731
7338
5536
754
7433
5204
700
20968
18022
86
02
17
52
15
90
57
31
30
71
11
25
04
00
81
5
2002/0
3183294
14996
38
18
97
38
76
54
78
62
38
00
23
300
979
30844
24063
780
6255
5389
862
7860
5589
711
21450
18681
87
12
79
29
22
26
17
97
31
11
70
25
69
00
82
6
2003/0
4187380
15867
18
47
95
60
81
14
84
92
24
59
19
468
867
32152
25501
793
6734
5001
743
7720
5514
714
22073
19363
87
72
79
32
23
72
88
49
31
60
10
26
53
60
84
0
2004/0
5188895
16071
68
51
11
77
01
04
39
88
71
93
37
17
841
923
32433
28028
864
5863
4464
761
7836
5680
725
22559
19820
87
92
81
13
24
32
48
65
31
68
06
27
13
12
85
6
2005/0
6183170
15796
38
62
10
16
38
40
58
27
20
70
31
90
85
922
32849
25459
775
6333
4791
757
8003
5827
728
23100
20580
89
12
92
40
25
33
98
67
31
35
61
26
74
49
85
3
2006/0
7189181
16469
48
71
99
72
80
85
81
12
09
88
19
245
917
32779
25379
774
6183
4706
761
7970
5895
740
23214
20961
90
32
92
70
25
41
08
68
31
95
57
27
43
75
85
9
2007/0
8189497
16114
78
50
92
38
73
19
79
22
13
63
18
841
882
32874
25672
781
6640
4927
742
7832
5377
687
23214
21003
90
52
97
73
25
49
08
56
32
04
31
26
97
76
84
2
2008/0
9183798
14772
58
04
84
79
68
77
81
12
08
83
18
152
869
33123
25964
784
5870
4335
739
7845
5385
686
23478
21456
91
42
97
93
25
49
08
56
31
32
69
25
53
84
81
5
2009/1
0187437
15175
88
10
86
47
70
65
81
72
12
96
18
648
876
33779
26673
790
5986
4453
744
8000
5532
692
23943
22042
92
13
03
83
26
18
68
62
31
94
71
26
23
57
82
1
2010/1
1207590.7
20686
9.3
99
6.5
91
24
.45
81
30
.45
89
11
74
69
.31
4107
808
27518
22530.3
819
9213.3
8673.9
941
7900.6
5808
735
29317
28318.1
96
62
62
47
.52
39
24
.59
11
.53
34
38
0.4
31
83
62
.49
52
2011/1
2207630.4
20820
11
00
39
15
4.2
38
19
1.6
89
51
74
71
14
082
806
27496
22482.4
818
9176.1
8670.6
945
7866.7
5855
744
29281.8
28269.8
96
52
62
46
.52
40
17
.59
15
.133
43
22
.93
19
76
9.8
95
6
2012/1
3206522
22693
1.4
10
99
97
81
.72
96
95
.69
99
11
74
59
.21
6459
943
25227
21363.6
847
11517
13936
1210
6361.6
5445
856
24933.9
29220.5
11
72
31
63
3.4
33
69
1.8
10
65
33
34
35
.73
56
74
2.8
10
70
2013/1
4205939.2
22683
0.3
11
01
93
40
.56
93
80
.36
10
04
17
00
5.6
16
415
965
23312
19382.8
831
11495
14103
1227
6232.8
5662
908
23757
28237
11
89
30
64
4.4
32
81
7.1
10
71
32
87
37
.53
52
47
2.5
10
72
Note
: +
( F
ield
Pea
, C
ow
Pea
, B
road
Bea
n, P
has
eolu
s, M
asyan
g, M
ungi
etc
)
Chic
kpea
Len
til
T
AB
LE
: 3
.1 A
RE
A,
PR
OD
UC
TIO
N A
ND
YIE
LD
OF
PU
LS
E C
RO
PS
IN
NE
PA
L [
Are
a i
n H
ecta
re, P
rod
uct
ion
in
Met
ric
Ton
an
d Y
ield
in
Kg p
er H
ecta
re]
Tota
lO
ther
s +
Soyab
ean
Hors
e G
ram
Gra
ss P
eaB
lack
Gra
mP
igeo
n P
ea
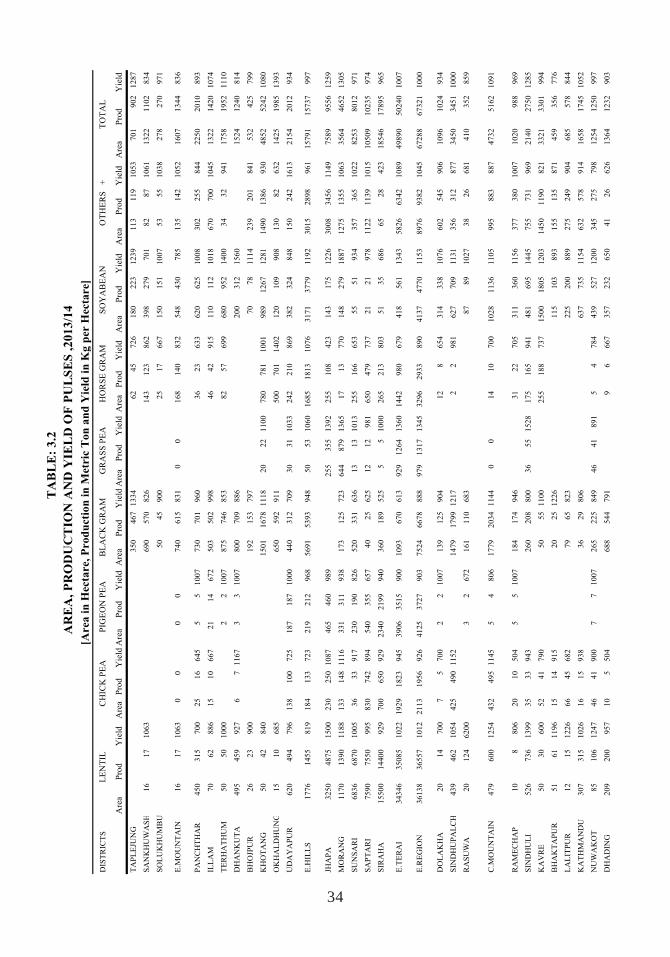
34
DIS
TR
ICT
S
Are
aP
rod
Yie
ldA
rea
Pro
dY
ield
Are
aP
rod
Yie
ldA
rea
Pro
dY
ield
Are
aP
rod
Yie
ldA
rea
Pro
dY
ield
Are
aP
rod
Yie
ldA
rea
Pro
dY
ield
Are
aP
rod
Yie
ld
TA
PL
EJU
NG
35
04
67
13
34
62
45
72
61
80
22
31
23
91
13
11
91
05
37
01
90
21
28
7
SA
NK
HU
WA
SH
16
17
10
63
69
05
70
82
61
43
12
38
62
39
82
79
70
18
28
71
06
11
32
21
10
28
34
SO
LU
KH
UM
BU
50
45
90
02
51
76
67
15
01
51
10
07
53
55
10
38
27
82
70
97
10
0
E.M
OU
NT
AIN
16
17
10
63
00
00
74
06
15
83
10
01
68
14
08
32
54
84
30
78
51
35
14
21
05
21
60
71
34
48
36
PA
NC
HT
HA
R4
50
31
57
00
25
16
64
55
51
00
77
30
70
19
60
36
23
63
36
20
62
51
00
83
02
25
58
44
22
50
20
10
89
3
ILL
AM
70
62
88
61
51
06
67
21
14
67
25
03
50
29
98
46
42
91
51
10
11
21
01
86
70
70
01
04
51
32
21
42
01
07
4
TE
RH
AT
HU
M5
05
01
00
02
21
00
78
75
74
68
53
82
57
69
96
80
95
21
40
03
43
29
41
17
58
19
52
11
10
DH
AN
KU
TA
49
54
59
92
76
71
16
73
31
00
78
00
70
98
86
20
03
12
15
60
15
24
12
40
81
4
BH
OJP
UR
26
23
90
01
92
15
37
97
70
78
11
14
23
92
01
84
15
32
42
57
99
KH
OT
AN
G5
04
28
40
15
01
16
78
11
18
20
22
11
00
78
07
81
10
01
98
91
26
71
28
11
49
01
38
69
30
48
52
52
42
10
80
OK
HA
LD
HU
NG
15
10
68
56
50
59
29
11
50
07
01
14
02
12
01
09
90
81
30
82
63
21
42
51
98
51
39
3
UD
AY
AP
UR
62
04
94
79
61
38
10
07
25
18
71
87
10
00
44
03
12
70
93
03
11
03
32
42
21
08
69
38
23
24
84
81
50
24
21
61
32
15
42
01
29
34
E.H
ILL
S1
77
61
45
58
19
18
41
33
72
32
19
21
29
68
56
91
53
93
94
85
05
31
06
01
68
51
81
31
07
63
17
13
77
91
19
23
01
52
89
89
61
15
79
11
57
37
99
7
JHA
PA
32
50
48
75
15
00
23
02
50
10
87
46
54
60
98
92
55
35
51
39
22
55
10
84
23
14
31
75
12
26
30
08
34
56
11
49
75
89
95
56
12
59
MO
RA
NG
11
70
13
90
11
88
13
31
48
11
16
33
13
11
93
81
73
12
57
23
64
48
79
13
65
17
13
77
01
48
27
91
88
71
27
51
35
51
06
33
56
44
65
21
30
5
SU
NS
AR
I6
83
66
87
01
00
53
63
39
17
23
01
90
82
65
20
33
16
36
13
13
10
13
25
51
66
65
35
55
19
34
35
73
65
10
22
82
53
80
12
97
1
SA
PT
AR
I7
59
07
55
09
95
83
07
42
89
45
40
35
56
57
40
25
62
51
21
29
81
65
04
79
73
72
12
19
78
11
22
11
39
10
15
10
50
91
02
35
97
4
SIR
AH
A1
55
00
14
40
09
29
70
06
50
92
92
34
02
19
99
40
36
01
89
52
55
51
00
02
65
21
38
03
51
35
68
66
52
84
23
18
54
61
78
95
96
5
E.T
ER
AI
34
34
63
50
85
10
22
19
29
18
23
94
53
90
63
51
59
00
10
93
67
06
13
92
91
26
41
36
01
44
29
80
67
94
18
56
11
34
35
82
66
34
21
08
94
98
90
50
24
01
00
7
E.R
EG
ION
36
13
83
65
57
10
12
21
13
19
56
92
64
12
53
72
79
03
75
24
66
78
88
89
79
13
17
13
45
32
96
29
33
89
04
13
74
77
01
15
38
97
69
38
21
04
56
72
88
67
32
11
00
0
DO
LA
KH
A2
01
47
00
75
70
02
21
00
71
39
12
59
04
12
86
54
31
43
38
10
76
60
25
45
90
61
09
61
02
49
34
SIN
DH
UP
AL
CH
43
94
62
10
54
42
54
90
11
52
14
79
17
99
12
17
22
98
16
27
70
91
13
13
56
31
28
77
34
50
34
51
10
00
RA
SU
WA
20
12
46
20
03
26
72
16
11
10
68
38
78
91
02
73
82
66
81
41
03
52
85
9
C.M
OU
NT
AIN
47
96
00
12
54
43
24
95
11
45
54
80
61
77
92
03
41
14
40
01
41
07
00
10
28
11
36
11
05
99
58
83
88
74
73
25
16
21
09
1
RA
ME
CH
AP
10
88
06
20
10
50
45
51
00
71
84
17
49
46
31
22
70
53
11
36
01
15
63
77
38
01
00
71
02
09
88
96
9
SIN
DH
UL
I5
26
73
61
39
93
53
39
43
26
02
08
80
03
65
51
52
81
75
16
59
41
48
16
95
14
45
75
57
31
96
92
14
02
75
01
28
5
KA
VR
E5
03
06
00
52
41
79
05
05
51
10
02
55
18
87
37
15
00
18
05
12
03
14
50
11
90
82
13
32
13
30
19
94
BH
AK
TA
PU
R5
16
11
19
61
51
49
15
20
25
12
26
11
51
03
89
31
55
13
58
71
45
93
56
77
6
LA
LIT
PU
R1
21
51
22
66
64
56
82
79
65
82
32
25
20
08
89
27
52
49
90
46
85
57
88
44
KA
TH
MA
ND
U3
07
31
51
02
61
61
59
38
36
29
80
66
37
73
51
15
46
32
57
89
14
16
58
17
45
10
52
NU
WA
KO
T8
51
06
12
47
46
41
90
07
71
00
72
65
22
58
49
46
41
89
15
47
84
43
95
27
12
00
34
52
75
79
81
25
41
25
09
97
DH
AD
ING
20
92
00
95
71
05
50
46
88
54
47
91
96
66
73
57
23
26
50
41
26
62
61
36
41
23
29
03
TA
BL
E:
3.2
AR
EA
, P
RO
DU
CT
ION
AN
D Y
IEL
D O
F P
UL
SE
S ,
20
13
/14
[
Area i
n H
ecta
re, P
rod
ucti
on
in
Metr
ic T
on
an
d Y
ield
in
Kg p
er H
ecta
re]
CH
ICK
PE
AP
IGE
ON
PE
AB
LA
CK
GR
AM
GR
AS
S P
EA
HO
RS
E G
RA
MS
OY
AB
EA
NO
TH
ER
S
+T
OT
AL
LE
NT
IL
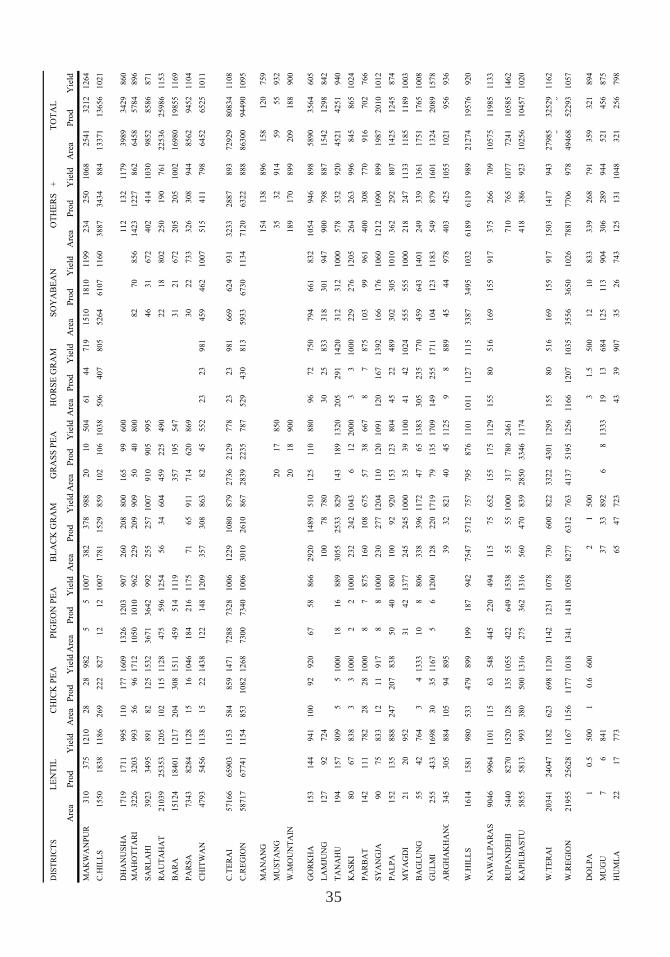
35
DIS
TR
ICT
S
Are
aP
rod
Yie
ldA
rea
Pro
dY
ield
Are
aP
rod
Yie
ldA
rea
Pro
dY
ield
Are
aP
rod
Yie
ldA
rea
Pro
dY
ield
Are
aP
rod
Yie
ldA
rea
Pro
dY
ield
Are
aP
rod
Yie
ld
CH
ICK
PE
AP
IGE
ON
PE
AB
LA
CK
GR
AM
GR
AS
S P
EA
HO
RS
E G
RA
MS
OY
AB
EA
NO
TH
ER
S
+T
OT
AL
LE
NT
IL
MA
KW
AN
PU
R310
375
1210
28
28
982
55
1007
382
378
988
20
10
504
61
44
719
1510
1810
1199
234
250
1068
2541
3212
1264
C.H
ILL
S1550
1838
1186
269
222
827
12
12
1007
1781
1529
859
102
106
1038
506
407
805
5264
6107
1160
3887
3434
884
13371
13656
1021
DH
AN
US
HA
1719
1711
995
110
177
1609
1326
1203
907
260
208
800
165
99
600
112
132
1179
3989
3429
860
MA
HO
TT
AR
I3226
3203
993
56
96
1712
1050
1010
962
229
209
909
50
40
800
82
70
856
1423
1227
862
6458
5784
896
SA
RL
AH
I3923
3495
891
82
125
1532
3671
3642
992
255
257
1007
910
905
995
46
31
672
402
414
1030
9852
8586
871
RA
UT
AH
AT
21039
25353
1205
102
115
1128
475
596
1254
56
34
604
459
225
490
22
18
802
250
190
761
22536
25986
1153
BA
RA
15124
18401
1217
204
308
1511
459
514
1119
357
195
547
31
21
672
205
205
1002
16980
19855
1169
PA
RS
A7343
8284
1128
15
16
1046
184
216
1175
71
65
911
714
620
869
30
22
733
326
308
944
8562
9452
1104
CH
ITW
AN
4793
5456
1138
15
22
1438
122
148
1209
357
308
863
82
45
552
23
23
981
459
462
1007
515
411
798
6452
6525
1011
C.T
ER
AI
57166
65903
1153
584
859
1471
7288
7328
1006
1229
1080
879
2736
2129
778
23
23
981
669
624
931
3233
2887
893
72929
80834
1108
C.R
EG
ION
58717
67741
1154
853
1082
1268
7300
7340
1006
3010
2610
867
2839
2235
787
529
430
813
5933
6730
1134
7120
6322
888
86300
94490
1095
MA
NA
NG
154
138
896
158
120
759
MU
ST
AN
G20
17
850
35
32
914
59
55
932
W.M
OU
NT
AIN
20
18
900
189
170
899
209
188
900
GO
RK
HA
153
144
941
100
92
920
67
58
866
2920
1489
510
125
110
880
96
72
750
794
661
832
1054
946
898
5890
3564
605
LA
MJU
NG
127
92
724
100
78
780
30
25
833
318
301
947
900
798
887
1542
1298
842
TA
NA
HU
194
157
809
55
1000
18
16
889
3055
2533
829
143
189
1320
205
291
1420
312
312
1000
578
532
920
4521
4251
940
KA
SK
I80
67
838
33
1000
22
1000
232
242
1043
612
2000
33
1000
229
276
1205
264
263
996
845
865
1024
PA
RB
AT
142
111
782
28
28
1000
87
875
160
108
675
57
38
667
87
875
103
99
961
400
308
770
916
702
766
SY
AN
GJA
90
75
833
12
11
917
88
1000
230
277
1204
110
120
1091
120
167
1392
166
176
1060
1212
1090
899
1987
2010
1012
PA
LP
A152
135
888
247
207
838
50
40
800
100
92
920
153
123
804
45
22
489
302
305
1010
362
292
807
1425
1245
874
MY
AG
DI
21
20
952
31
42
1377
245
245
1000
35
39
1100
41
42
1024
555
555
1000
218
247
1133
1185
1189
1003
BA
GL
UN
G55
42
764
34
1333
10
8806
338
396
1172
47
65
1383
305
235
770
459
643
1401
249
339
1361
1751
1765
1008
GU
LM
I255
433
1698
30
35
1167
56
1200
128
220
1719
79
135
1709
149
255
1711
104
123
1183
549
879
1601
1324
2089
1578
AR
GH
AK
HA
NC
345
305
884
105
94
895
39
32
821
40
45
1125
98
889
45
44
978
403
425
1055
1021
956
936
W.H
ILL
S1614
1581
980
533
479
899
199
187
942
7547
5712
757
795
876
1101
1011
1127
1115
3387
3495
1032
6189
6119
989
21274
19576
920
NA
WA
LP
AR
AS
9046
9964
1101
115
63
548
445
220
494
115
75
652
155
175
1129
155
80
516
169
155
917
375
266
709
10575
11985
1133
RU
PA
ND
EH
I5440
8270
1520
128
135
1055
422
649
1538
55
55
1000
317
780
2461
710
765
1077
7241
10585
1462
KA
PIL
BA
ST
U5855
5813
993
380
500
1316
275
362
1316
560
470
839
2850
3346
1174
418
386
923
10256
10457
1020
W.T
ER
AI
20341
24047
1182
623
698
1120
1142
1231
1078
730
600
822
3322
4301
1295
155
80
516
169
155
917
1503
1417
943
27985
32529
1162
00
W.R
EG
ION
21955
25628
1167
1156
1177
1018
1341
1418
1058
8277
6312
763
4137
5195
1256
1166
1207
1035
3556
3650
1026
7881
7706
978
49468
52293
1057
DO
LP
A1
0.5
500
10.6
600
21
500
31.5
500
12
10
833
339
268
791
359
321
894
MU
GU
76
841
37
33
892
68
1333
19
13
684
125
113
904
306
289
944
521
456
875
HU
ML
A22
17
773
65
47
723
43
39
907
35
26
743
125
131
1048
321
256
798
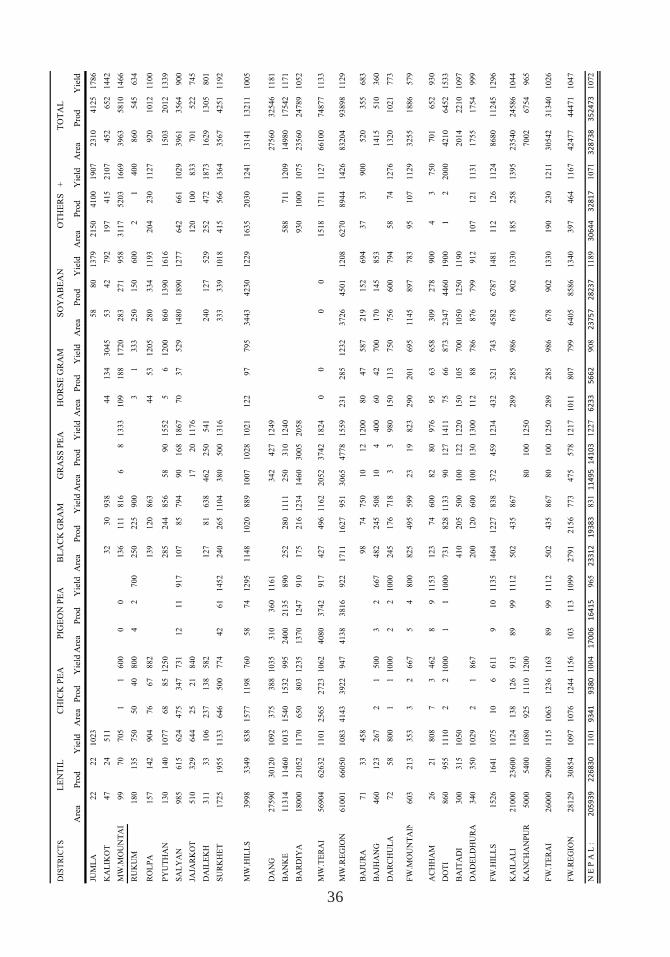
36
DIS
TR
ICT
S
Are
aP
rod
Yie
ldA
rea
Pro
dY
ield
Are
aP
rod
Yie
ldA
rea
Pro
dY
ield
Are
aP
rod
Yie
ldA
rea
Pro
dY
ield
Are
aP
rod
Yie
ldA
rea
Pro
dY
ield
Are
aP
rod
Yie
ld
CH
ICK
PE
AP
IGE
ON
PE
AB
LA
CK
GR
AM
GR
AS
S P
EA
HO
RS
E G
RA
MS
OY
AB
EA
NO
TH
ER
S +
TO
TA
LL
EN
TIL
JUM
LA
22
22
1023
58
80
1379
2150
4100
1907
2310
4125
1786
KA
LIK
OT
47
24
511
32
30
938
44
134
3045
53
42
792
197
415
2107
452
652
1442
MW
.MO
UN
TA
IN99
70
705
11
600
00
136
111
816
68
1333
109
188
1720
283
271
958
3117
5203
1669
3963
5810
1466
RU
KU
M180
135
750
50
40
800
42
700
250
225
900
31
333
250
150
600
21
400
860
545
634
RO
LP
A157
142
904
76
67
882
139
120
863
44
53
1205
280
334
1193
204
230
1127
920
1012
1100
PY
UT
HA
N130
140
1077
68
85
1250
285
244
856
58
90
1552
56
1200
860
1390
1616
1503
2012
1339
SA
LY
AN
985
615
624
475
347
731
12
11
917
107
85
794
90
168
1867
70
37
529
1480
1890
1277
642
661
1029
3961
3564
900
JAJA
RK
OT
510
329
644
25
21
840
17
20
1176
120
100
833
701
522
745
DA
ILE
KH
311
33
106
237
138
582
127
81
638
462
250
541
240
127
529
252
472
1873
1629
1305
801
SU
RK
HE
T1725
1955
1133
646
500
774
42
61
1452
240
265
1104
380
500
1316
333
339
1018
415
566
1364
3567
4251
1192
MW
.HIL
LS
3998
3349
838
1577
1198
760
58
74
1295
1148
1020
889
1007
1028
1021
122
97
795
3443
4230
1229
1635
2030
1241
13141
13211
1005
DA
NG
27590
30120
1092
375
388
1035
310
360
1161
342
427
1249
27560
32546
1181
BA
NK
E11314
11460
1013
1540
1532
995
2400
2135
890
252
280
1111
250
310
1240
588
711
1209
14980
17542
1171
BA
RD
IYA
18000
21052
1170
650
803
1235
1370
1247
910
175
216
1234
1460
3005
2058
930
1000
1075
23560
24789
1052
MW
.TE
RA
I56904
62632
1101
2565
2723
1062
4080
3742
917
427
496
1162
2052
3742
1824
00
00
1518
1711
1127
66100
74877
1133
MW
.RE
GIO
N61001
66050
1083
4143
3922
947
4138
3816
922
1711
1627
951
3065
4778
1559
231
285
1232
3726
4501
1208
6270
8944
1426
83204
93898
1129
BA
JUR
A71
33
458
98
74
750
10
12
1200
80
47
587
219
152
694
37
33
900
520
355
683
BA
JHA
NG
460
123
267
21
500
32
667
482
245
508
10
4400
60
42
700
170
145
853
1415
510
360
DA
RC
HU
LA
72
58
800
11
1000
22
1000
245
176
718
33
980
150
113
750
756
600
794
58
74
1276
1320
1021
773
FW
.MO
UN
TA
IN603
213
353
32
667
54
800
825
495
599
23
19
823
290
201
695
1145
897
783
95
107
1129
3255
1886
579
AC
HH
AM
26
21
808
73
462
89
1153
123
74
600
82
80
976
95
63
658
309
278
900
43
750
701
652
930
DO
TI
860
955
1110
22
1000
11
1000
731
828
1133
90
127
1411
75
66
873
2347
4460
1900
12
2000
4210
6452
1533
BA
ITA
DI
300
315
1050
410
205
500
100
122
1220
150
105
700
1050
1250
1190
2014
2210
1097
DA
DE
LD
HU
RA
340
350
1029
21
867
200
120
600
100
130
1300
112
88
786
876
799
912
107
121
1131
1755
1754
999
FW
.HIL
LS
1526
1641
1075
10
6611
910
1135
1464
1227
838
372
459
1234
432
321
743
4582
6787
1481
112
126
1124
8680
11245
1296
KA
ILA
LI
21000
23600
1124
138
126
913
89
99
1112
502
435
867
289
285
986
678
902
1330
185
258
1395
23540
24586
1044
KA
NC
HA
NP
UR
5000
5400
1080
925
1110
1200
80
100
1250
7002
6754
965
FW
.TE
RA
I26000
29000
1115
1063
1236
1163
89
99
1112
502
435
867
80
100
1250
289
285
986
678
902
1330
190
230
1211
30542
31340
1026
FW
.RE
GIO
N28129
30854
1097
1076
1244
1156
103
113
1099
2791
2156
773
475
578
1217
1011
807
799
6405
8586
1340
397
464
1167
42477
44471
1047
N E
P A
L :
205939
226830
1101
9341
9380
1004
17006
16415
965
23312
19383
831
11495
14103
1227
6233
5662
908
23757
28237
1189
30644
32817
1071
328738
352473
1072
37
4.LIVESTOCK

38
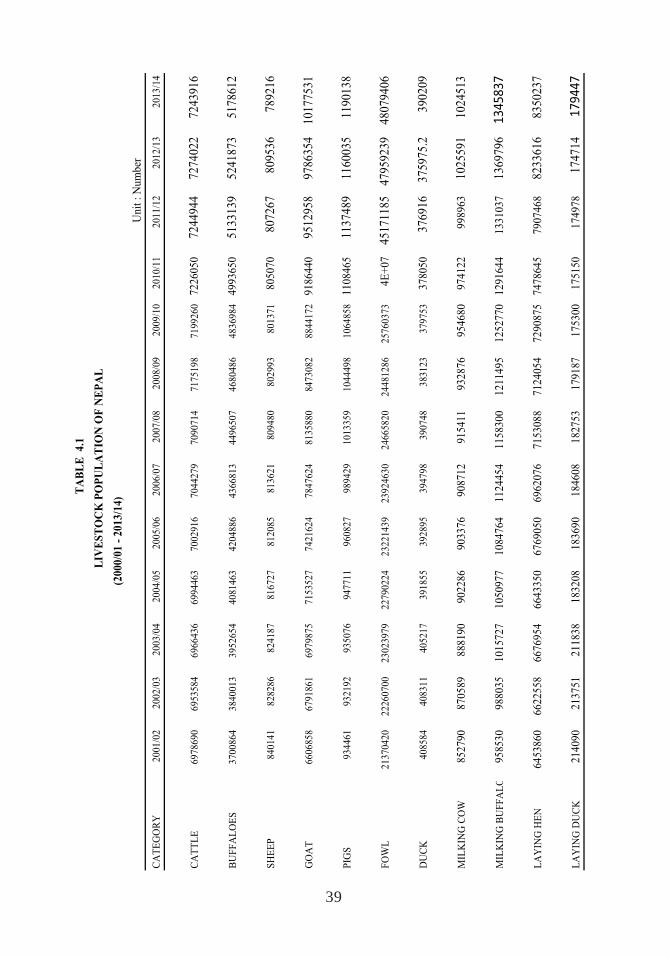
39
U
nit
: N
um
ber
CA
TE
GO
RY
2001/0
22002/0
32003/0
42004/0
52005/0
62006/0
72007/0
82008/0
92009/1
02010/1
12011/1
22012/1
32013/1
4
CA
TT
LE
6978690
6953584
6966436
6994463
7002916
7044279
7090714
7175198
7199260
7226050
7244944
7274022
7243916
BU
FF
AL
OE
S3700864
3840013
3952654
4081463
4204886
4366813
4496507
4680486
4836984
4993650
5133139
5241873
5178612
SH
EE
P840141
828286
824187
816727
812085
813621
809480
802993
801371
805070
807267
809536
789216
GO
AT
6606858
6791861
6979875
7153527
7421624
7847624
8135880
8473082
8844172
9186440
9512958
9786354
10177531
PIG
S934461
932192
935076
947711
960827
989429
1013359
1044498
1064858
1108465
1137489
1160035
1190138
FO
WL
21370420
22260700
23023979
22790224
23221439
23924630
24665820
24481286
25760373
4E
+07
45171185
47959239
48079406
DU
CK
408584
408311
405217
391855
392895
394798
390748
383123
379753
378050
376916
375975.2
390209
MIL
KIN
G C
OW
852790
870589
888190
902286
903376
908712
915411
932876
954680
974122
998963
1025591
1024513
MIL
KIN
G B
UF
FA
LO
958530
988035
1015727
1050977
1084764
1124454
1158300
1211495
1252770
1291644
1331037
1369796
1345837
LA
YIN
G H
EN
6453860
6622558
6676954
6643350
6769050
6962076
7153088
7124054
7290875
7478645
7907468
8233616
8350237
LA
YIN
G D
UC
K214090
213751
211838
183208
183690
184608
182753
179187
175300
175150
174978
174714
179447
T
AB
LE
4.1
L
IVE
ST
OC
K P
OP
UL
AT
ION
OF
NE
PA
L
(2000/0
1 -
2013/1
4)
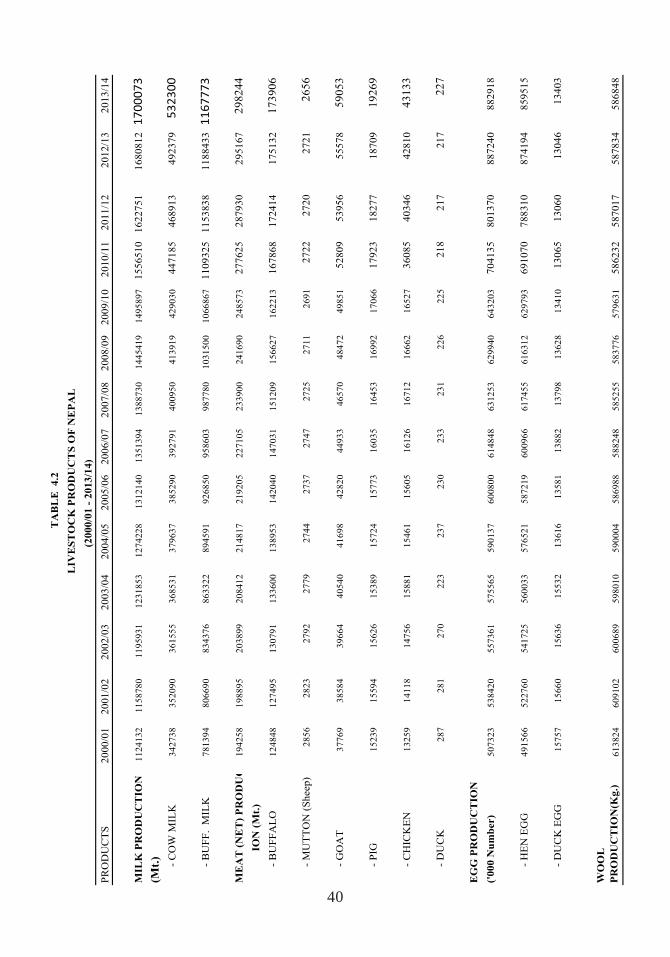
40
PR
OD
UC
TS
2000/0
12001/0
22002/0
32003/0
42004/0
52005/0
62006/0
72007/0
82008/0
92009/1
02010/1
12011/1
22012/1
32013/1
4
MIL
K P
RO
DU
CT
ION
11
24
13
21
15
87
80
11
95
93
11
23
18
53
12
74
22
81
31
21
40
13
51
39
41
38
87
30
14
45
41
91
49
58
97
1556510
1622751
16808121700073
(Mt.
)
-
CO
W M
ILK
34
27
38
35
20
90
36
15
55
36
85
31
37
96
37
38
52
90
39
27
91
40
09
50
41
39
19
42
90
30
447185
468913
492379
532300
-
BU
FF
. M
ILK
78
13
94
80
66
90
83
43
76
86
33
22
89
45
91
92
68
50
95
86
03
98
77
80
10
31
50
01
06
68
67
1109325
1153838
11884331167773
ME
AT
(N
ET
) P
RO
DU
C1
94
25
81
98
89
52
03
89
92
08
41
22
14
81
72
19
20
52
27
10
52
33
90
02
41
69
02
48
57
3277625
287930
295167
298244
IO
N (
Mt.
)
-
BU
FF
AL
O1
24
84
81
27
49
51
30
79
11
33
60
01
38
95
31
42
04
01
47
03
11
51
20
91
56
62
71
62
21
3167868
172414
175132
173906
-
MU
TT
ON
(S
heep)
28
56
28
23
27
92
27
79
27
44
27
37
27
47
27
25
27
11
26
91
2722
2720
2721
2656
-
GO
AT
37
76
93
85
84
39
66
44
05
40
41
69
84
28
20
44
93
34
65
70
48
47
24
98
51
52809
53956
55578
59053
-
PIG
15
23
91
55
94
15
62
61
53
89
15
72
41
57
73
16
03
51
64
53
16
99
21
70
66
17923
18277
18709
19269
-
CH
ICK
EN
13
25
91
41
18
14
75
61
58
81
15
46
11
56
05
16
12
61
67
12
16
66
21
65
27
36085
40346
42810
43133
-
DU
CK
28
72
81
27
02
23
23
72
30
23
32
31
22
62
25
218
217
217
227
EG
G P
RO
DU
CT
ION
('000 N
um
ber)
50
73
23
53
84
20
55
73
61
57
55
65
59
01
37
60
08
00
61
48
48
63
12
53
62
99
40
64
32
03
704135
801370
887240
882918
-
HE
N E
GG
49
15
66
52
27
60
54
17
25
56
00
33
57
65
21
58
72
19
60
09
66
61
74
55
61
63
12
62
97
93
691070
788310
874194
859515
-
DU
CK
EG
G1
57
57
15
66
01
56
36
15
53
21
36
16
13
58
11
38
82
13
79
81
36
28
13
41
013065
13060
13046
13403
WO
OL
PR
OD
UC
TIO
N(K
g.)
61
38
24
60
91
02
60
06
89
59
80
10
59
00
04
58
69
88
58
82
48
58
52
55
58
37
76
57
96
31
586232
587017
587834
586848
T
AB
LE
4.2
(
2000/0
1 -
2013/1
4)
LIV
ES
TO
CK
PR
OD
UC
TS
OF
NE
PA
L
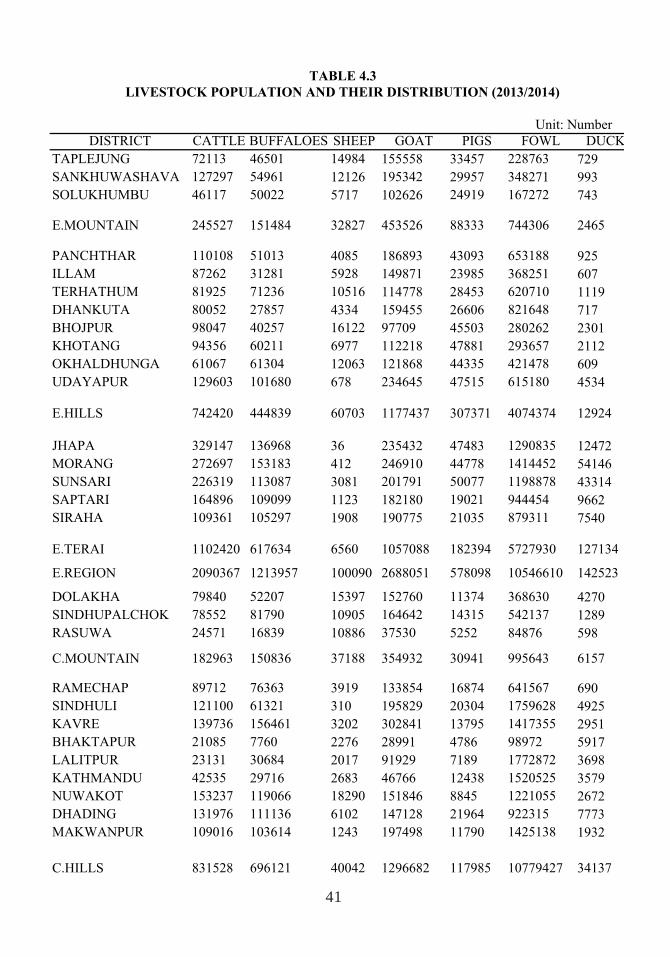
41
Unit: Number
DISTRICT CATTLE BUFFALOES SHEEP GOAT PIGS FOWL DUCK
TAPLEJUNG 72113 46501 14984 155558 33457 228763 729
SANKHUWASHAVA 127297 54961 12126 195342 29957 348271 993
SOLUKHUMBU 46117 50022 5717 102626 24919 167272 743
E.MOUNTAIN 245527 151484 32827 453526 88333 744306 2465
PANCHTHAR 110108 51013 4085 186893 43093 653188 925
ILLAM 87262 31281 5928 149871 23985 368251 607
TERHATHUM 81925 71236 10516 114778 28453 620710 1119
DHANKUTA 80052 27857 4334 159455 26606 821648 717
BHOJPUR 98047 40257 16122 97709 45503 280262 2301
KHOTANG 94356 60211 6977 112218 47881 293657 2112
OKHALDHUNGA 61067 61304 12063 121868 44335 421478 609
UDAYAPUR 129603 101680 678 234645 47515 615180 4534
E.HILLS 742420 444839 60703 1177437 307371 4074374 12924
JHAPA 329147 136968 36 235432 47483 1290835 12472
MORANG 272697 153183 412 246910 44778 1414452 54146
SUNSARI 226319 113087 3081 201791 50077 1198878 43314
SAPTARI 164896 109099 1123 182180 19021 944454 9662
SIRAHA 109361 105297 1908 190775 21035 879311 7540
E.TERAI 1102420 617634 6560 1057088 182394 5727930 127134
E.REGION 2090367 1213957 100090 2688051 578098 10546610 142523
DOLAKHA 79840 52207 15397 152760 11374 368630 4270
SINDHUPALCHOK 78552 81790 10905 164642 14315 542137 1289
RASUWA 24571 16839 10886 37530 5252 84876 598
C.MOUNTAIN 182963 150836 37188 354932 30941 995643 6157
RAMECHAP 89712 76363 3919 133854 16874 641567 690
SINDHULI 121100 61321 310 195829 20304 1759628 4925
KAVRE 139736 156461 3202 302841 13795 1417355 2951
BHAKTAPUR 21085 7760 2276 28991 4786 98972 5917
LALITPUR 23131 30684 2017 91929 7189 1772872 3698
KATHMANDU 42535 29716 2683 46766 12438 1520525 3579
NUWAKOT 153237 119066 18290 151846 8845 1221055 2672
DHADING 131976 111136 6102 147128 21964 922315 7773
MAKWANPUR 109016 103614 1243 197498 11790 1425138 1932
C.HILLS 831528 696121 40042 1296682 117985 10779427 34137
TABLE 4.3
LIVESTOCK POPULATION AND THEIR DISTRIBUTION (2013/2014)
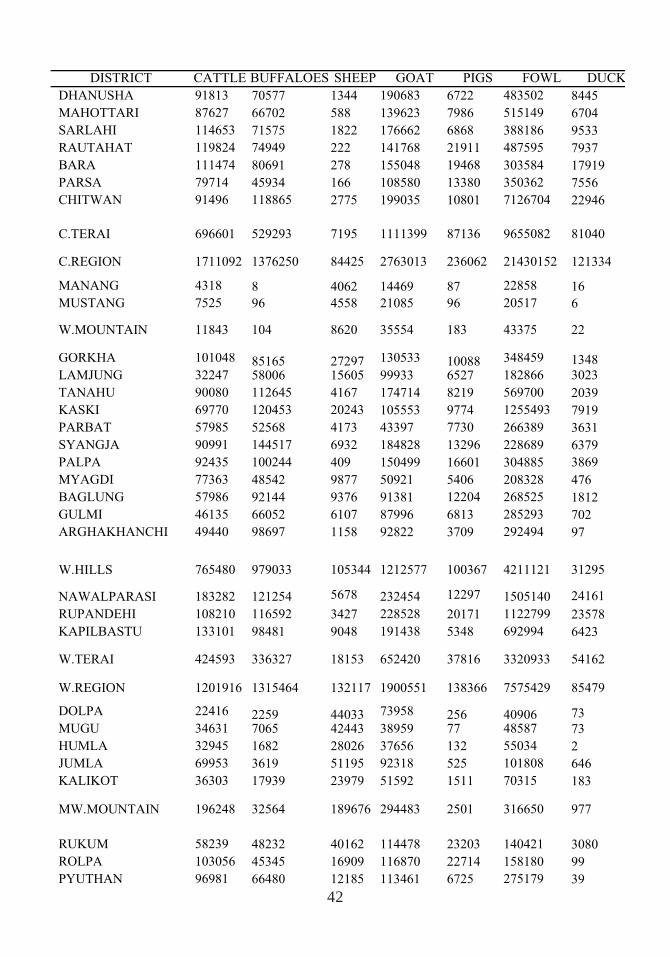
42
DHANUSHA 91813 70577 1344 190683 6722 483502 8445
MAHOTTARI 87627 66702 588 139623 7986 515149 6704
SARLAHI 114653 71575 1822 176662 6868 388186 9533
RAUTAHAT 119824 74949 222 141768 21911 487595 7937
BARA 111474 80691 278 155048 19468 303584 17919
PARSA 79714 45934 166 108580 13380 350362 7556
CHITWAN 91496 118865 2775 199035 10801 7126704 22946
C.TERAI 696601 529293 7195 1111399 87136 9655082 81040
C.REGION 1711092 1376250 84425 2763013 236062 21430152 121334
MANANG 4318 8 4062 14469 87 22858 16
MUSTANG 7525 96 4558 21085 96 20517 6
W.MOUNTAIN 11843 104 8620 35554 183 43375 22
GORKHA 101048 85165 27297 130533 10088 348459 1348
LAMJUNG 32247 58006 15605 99933 6527 182866 3023
TANAHU 90080 112645 4167 174714 8219 569700 2039
KASKI 69770 120453 20243 105553 9774 1255493 7919
PARBAT 57985 52568 4173 43397 7730 266389 3631
SYANGJA 90991 144517 6932 184828 13296 228689 6379
PALPA 92435 100244 409 150499 16601 304885 3869
MYAGDI 77363 48542 9877 50921 5406 208328 476
BAGLUNG 57986 92144 9376 91381 12204 268525 1812
GULMI 46135 66052 6107 87996 6813 285293 702
ARGHAKHANCHI 49440 98697 1158 92822 3709 292494 97
W.HILLS 765480 979033 105344 1212577 100367 4211121 31295
NAWALPARASI 183282 121254 5678 232454 12297 1505140 24161
RUPANDEHI 108210 116592 3427 228528 20171 1122799 23578
KAPILBASTU 133101 98481 9048 191438 5348 692994 6423
W.TERAI 424593 336327 18153 652420 37816 3320933 54162
W.REGION 1201916 1315464 132117 1900551 138366 7575429 85479
DOLPA 22416 2259 44033 73958 256 40906 73
MUGU 34631 7065 42443 38959 77 48587 73
HUMLA 32945 1682 28026 37656 132 55034 2
JUMLA 69953 3619 51195 92318 525 101808 646
KALIKOT 36303 17939 23979 51592 1511 70315 183
MW.MOUNTAIN 196248 32564 189676 294483 2501 316650 977
RUKUM 58239 48232 40162 114478 23203 140421 3080
ROLPA 103056 45345 16909 116870 22714 158180 99
PYUTHAN 96981 66480 12185 113461 6725 275179 39
DISTRICT CATTLE BUFFALOES SHEEP GOAT PIGS FOWL DUCK
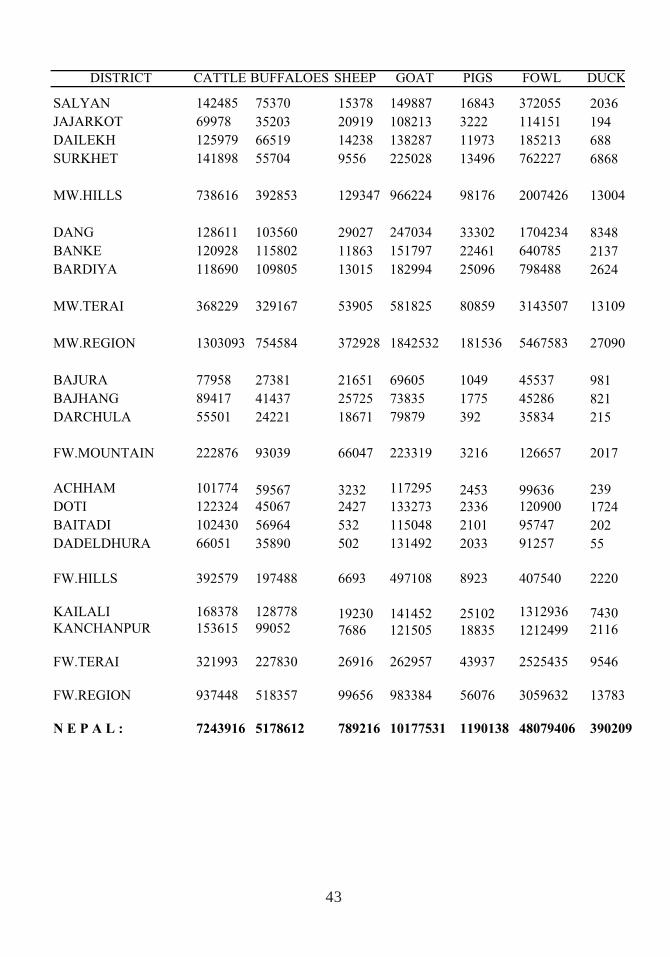
43
SALYAN 142485 75370 15378 149887 16843 372055 2036
JAJARKOT 69978 35203 20919 108213 3222 114151 194
DAILEKH 125979 66519 14238 138287 11973 185213 688
SURKHET 141898 55704 9556 225028 13496 762227 6868
MW.HILLS 738616 392853 129347 966224 98176 2007426 13004
DANG 128611 103560 29027 247034 33302 1704234 8348
BANKE 120928 115802 11863 151797 22461 640785 2137
BARDIYA 118690 109805 13015 182994 25096 798488 2624
MW.TERAI 368229 329167 53905 581825 80859 3143507 13109
MW.REGION 1303093 754584 372928 1842532 181536 5467583 27090
BAJURA 77958 27381 21651 69605 1049 45537 981
BAJHANG 89417 41437 25725 73835 1775 45286 821
DARCHULA 55501 24221 18671 79879 392 35834 215
FW.MOUNTAIN 222876 93039 66047 223319 3216 126657 2017
ACHHAM 101774 59567 3232 117295 2453 99636 239
DOTI 122324 45067 2427 133273 2336 120900 1724
BAITADI 102430 56964 532 115048 2101 95747 202
DADELDHURA 66051 35890 502 131492 2033 91257 55
FW.HILLS 392579 197488 6693 497108 8923 407540 2220
KAILALI 168378 128778 19230 141452 25102 1312936 7430KANCHANPUR 153615 99052 7686 121505 18835 1212499 2116
FW.TERAI 321993 227830 26916 262957 43937 2525435 9546
FW.REGION 937448 518357 99656 983384 56076 3059632 13783
N E P A L : 7243916 5178612 789216 10177531 1190138 48079406 390209
DISTRICT CATTLE BUFFALOES SHEEP GOAT PIGS FOWL DUCK
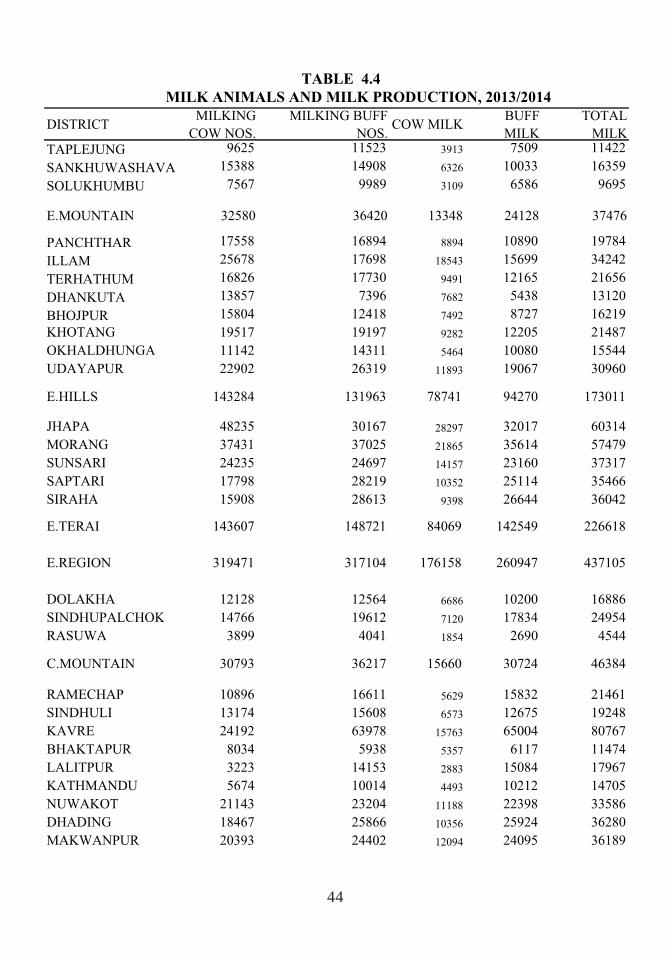
44
DISTRICTMILKING
COW NOS.
MILKING BUFF
NOS.COW MILK
BUFF
MILK
TOTAL
MILK
TAPLEJUNG 9625 11523 3913 7509 11422
SANKHUWASHAVA 15388 14908 6326 10033 16359
SOLUKHUMBU 7567 9989 3109 6586 9695
E.MOUNTAIN 32580 36420 13348 24128 37476
PANCHTHAR 17558 16894 8894 10890 19784
ILLAM 25678 17698 18543 15699 34242
TERHATHUM 16826 17730 9491 12165 21656
DHANKUTA 13857 7396 7682 5438 13120
BHOJPUR 15804 12418 7492 8727 16219
KHOTANG 19517 19197 9282 12205 21487
OKHALDHUNGA 11142 14311 5464 10080 15544
UDAYAPUR 22902 26319 11893 19067 30960
E.HILLS 143284 131963 78741 94270 173011
JHAPA 48235 30167 28297 32017 60314
MORANG 37431 37025 21865 35614 57479
SUNSARI 24235 24697 14157 23160 37317
SAPTARI 17798 28219 10352 25114 35466
SIRAHA 15908 28613 9398 26644 36042
E.TERAI 143607 148721 84069 142549 226618
E.REGION 319471 317104 176158 260947 437105
DOLAKHA 12128 12564 6686 10200 16886
SINDHUPALCHOK 14766 19612 7120 17834 24954
RASUWA 3899 4041 1854 2690 4544
C.MOUNTAIN 30793 36217 15660 30724 46384
RAMECHAP 10896 16611 5629 15832 21461
SINDHULI 13174 15608 6573 12675 19248
KAVRE 24192 63978 15763 65004 80767
BHAKTAPUR 8034 5938 5357 6117 11474
LALITPUR 3223 14153 2883 15084 17967
KATHMANDU 5674 10014 4493 10212 14705
NUWAKOT 21143 23204 11188 22398 33586
DHADING 18467 25866 10356 25924 36280
MAKWANPUR 20393 24402 12094 24095 36189
TABLE 4.4
MILK ANIMALS AND MILK PRODUCTION, 2013/2014
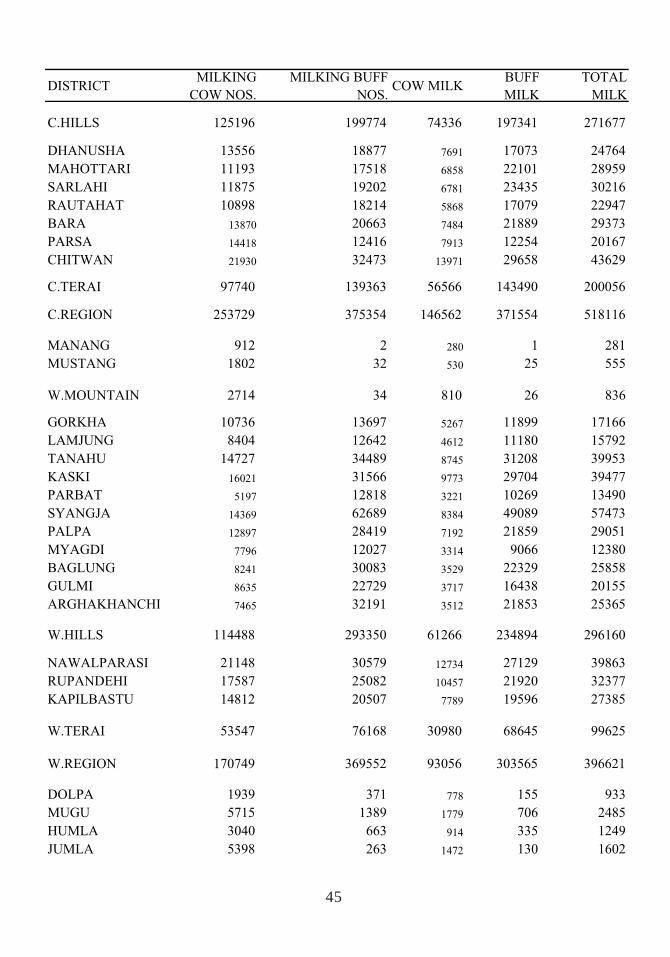
45
DISTRICTMILKING
COW NOS.
MILKING BUFF
NOS.COW MILK
BUFF
MILK
TOTAL
MILK
C.HILLS 125196 199774 74336 197341 271677
DHANUSHA 13556 18877 7691 17073 24764
MAHOTTARI 11193 17518 6858 22101 28959
SARLAHI 11875 19202 6781 23435 30216
RAUTAHAT 10898 18214 5868 17079 22947
BARA 13870 20663 7484 21889 29373
PARSA 14418 12416 7913 12254 20167
CHITWAN 21930 32473 13971 29658 43629
C.TERAI 97740 139363 56566 143490 200056
C.REGION 253729 375354 146562 371554 518116
MANANG 912 2 280 1 281
MUSTANG 1802 32 530 25 555
W.MOUNTAIN 2714 34 810 26 836
GORKHA 10736 13697 5267 11899 17166
LAMJUNG 8404 12642 4612 11180 15792
TANAHU 14727 34489 8745 31208 39953
KASKI 16021 31566 9773 29704 39477
PARBAT 5197 12818 3221 10269 13490
SYANGJA 14369 62689 8384 49089 57473
PALPA 12897 28419 7192 21859 29051
MYAGDI 7796 12027 3314 9066 12380
BAGLUNG 8241 30083 3529 22329 25858
GULMI 8635 22729 3717 16438 20155
ARGHAKHANCHI 7465 32191 3512 21853 25365
W.HILLS 114488 293350 61266 234894 296160
NAWALPARASI 21148 30579 12734 27129 39863
RUPANDEHI 17587 25082 10457 21920 32377
KAPILBASTU 14812 20507 7789 19596 27385
W.TERAI 53547 76168 30980 68645 99625
W.REGION 170749 369552 93056 303565 396621
DOLPA 1939 371 778 155 933
MUGU 5715 1389 1779 706 2485
HUMLA 3040 663 914 335 1249
JUMLA 5398 263 1472 130 1602
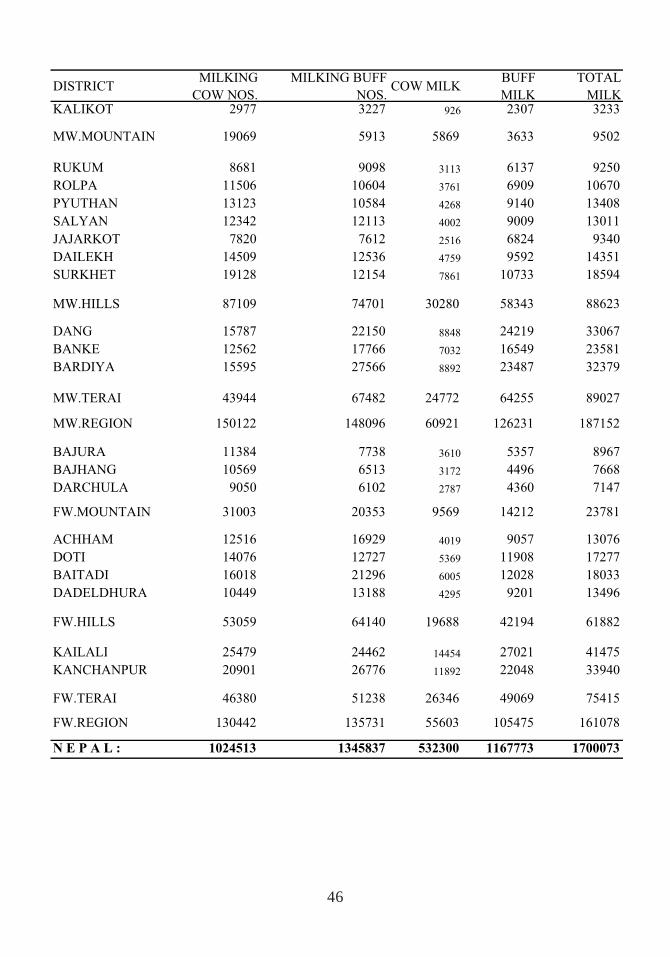
46
DISTRICTMILKING
COW NOS.
MILKING BUFF
NOS.COW MILK
BUFF
MILK
TOTAL
MILKKALIKOT 2977 3227 926 2307 3233
MW.MOUNTAIN 19069 5913 5869 3633 9502
RUKUM 8681 9098 3113 6137 9250
ROLPA 11506 10604 3761 6909 10670
PYUTHAN 13123 10584 4268 9140 13408
SALYAN 12342 12113 4002 9009 13011
JAJARKOT 7820 7612 2516 6824 9340
DAILEKH 14509 12536 4759 9592 14351
SURKHET 19128 12154 7861 10733 18594
MW.HILLS 87109 74701 30280 58343 88623
DANG 15787 22150 8848 24219 33067
BANKE 12562 17766 7032 16549 23581
BARDIYA 15595 27566 8892 23487 32379
MW.TERAI 43944 67482 24772 64255 89027
MW.REGION 150122 148096 60921 126231 187152
BAJURA 11384 7738 3610 5357 8967
BAJHANG 10569 6513 3172 4496 7668
DARCHULA 9050 6102 2787 4360 7147
FW.MOUNTAIN 31003 20353 9569 14212 23781
ACHHAM 12516 16929 4019 9057 13076
DOTI 14076 12727 5369 11908 17277
BAITADI 16018 21296 6005 12028 18033
DADELDHURA 10449 13188 4295 9201 13496
FW.HILLS 53059 64140 19688 42194 61882
KAILALI 25479 24462 14454 27021 41475
KANCHANPUR 20901 26776 11892 22048 33940
FW.TERAI 46380 51238 26346 49069 75415
FW.REGION 130442 135731 55603 105475 161078
N E P A L : 1024513 1345837 532300 1167773 1700073
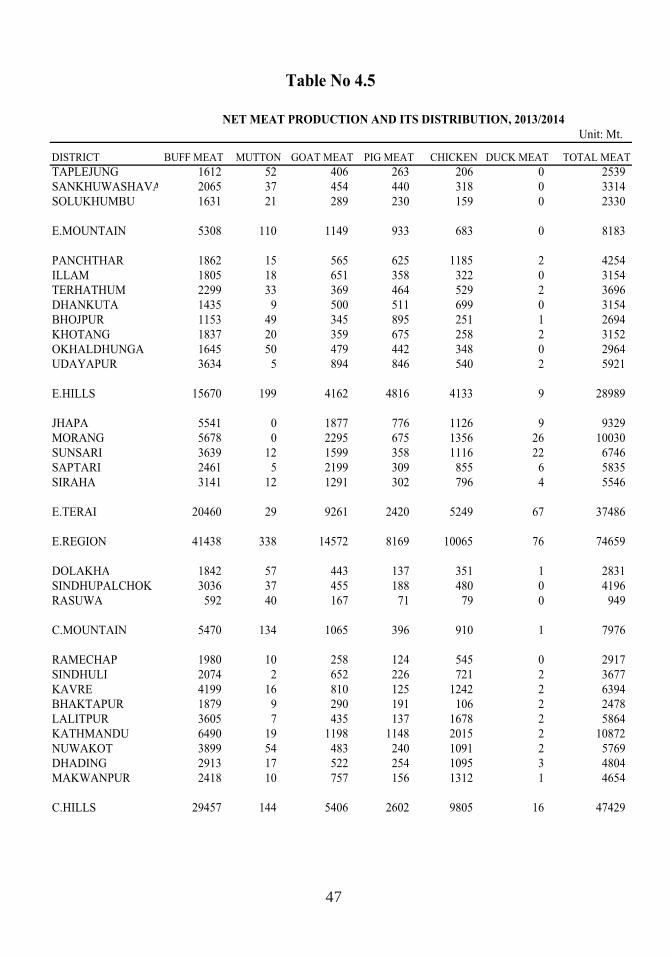
47
Table No 4.5
Unit: Mt.
DISTRICT BUFF MEAT MUTTON GOAT MEAT PIG MEAT CHICKEN DUCK MEAT TOTAL MEAT
TAPLEJUNG 1612 52 406 263 206 0 2539
SANKHUWASHAVA 2065 37 454 440 318 0 3314
SOLUKHUMBU 1631 21 289 230 159 0 2330
E.MOUNTAIN 5308 110 1149 933 683 0 8183
PANCHTHAR 1862 15 565 625 1185 2 4254
ILLAM 1805 18 651 358 322 0 3154
TERHATHUM 2299 33 369 464 529 2 3696
DHANKUTA 1435 9 500 511 699 0 3154
BHOJPUR 1153 49 345 895 251 1 2694
KHOTANG 1837 20 359 675 258 2 3152
OKHALDHUNGA 1645 50 479 442 348 0 2964
UDAYAPUR 3634 5 894 846 540 2 5921
E.HILLS 15670 199 4162 4816 4133 9 28989
JHAPA 5541 0 1877 776 1126 9 9329
MORANG 5678 0 2295 675 1356 26 10030
SUNSARI 3639 12 1599 358 1116 22 6746
SAPTARI 2461 5 2199 309 855 6 5835
SIRAHA 3141 12 1291 302 796 4 5546
E.TERAI 20460 29 9261 2420 5249 67 37486
E.REGION 41438 338 14572 8169 10065 76 74659
DOLAKHA 1842 57 443 137 351 1 2831
SINDHUPALCHOK 3036 37 455 188 480 0 4196
RASUWA 592 40 167 71 79 0 949
C.MOUNTAIN 5470 134 1065 396 910 1 7976
RAMECHAP 1980 10 258 124 545 0 2917
SINDHULI 2074 2 652 226 721 2 3677
KAVRE 4199 16 810 125 1242 2 6394
BHAKTAPUR 1879 9 290 191 106 2 2478
LALITPUR 3605 7 435 137 1678 2 5864
KATHMANDU 6490 19 1198 1148 2015 2 10872
NUWAKOT 3899 54 483 240 1091 2 5769
DHADING 2913 17 522 254 1095 3 4804
MAKWANPUR 2418 10 757 156 1312 1 4654
C.HILLS 29457 144 5406 2602 9805 16 47429
NET MEAT PRODUCTION AND ITS DISTRIBUTION, 2013/2014
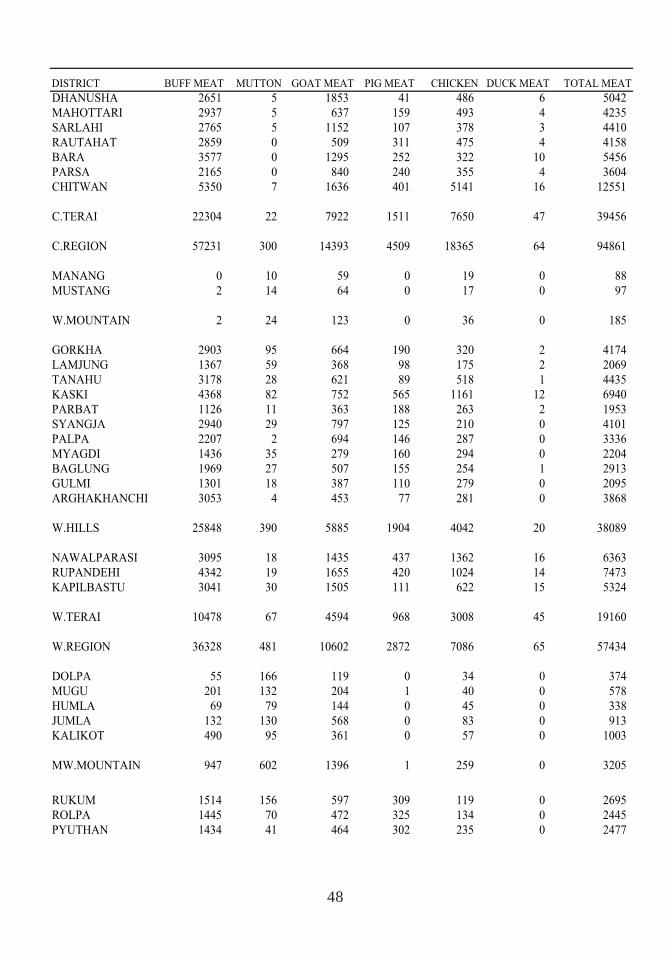
48
DISTRICT BUFF MEAT MUTTON GOAT MEAT PIG MEAT CHICKEN DUCK MEAT TOTAL MEAT
DHANUSHA 2651 5 1853 41 486 6 5042
MAHOTTARI 2937 5 637 159 493 4 4235
SARLAHI 2765 5 1152 107 378 3 4410
RAUTAHAT 2859 0 509 311 475 4 4158
BARA 3577 0 1295 252 322 10 5456
PARSA 2165 0 840 240 355 4 3604
CHITWAN 5350 7 1636 401 5141 16 12551
C.TERAI 22304 22 7922 1511 7650 47 39456
C.REGION 57231 300 14393 4509 18365 64 94861
MANANG 0 10 59 0 19 0 88
MUSTANG 2 14 64 0 17 0 97
W.MOUNTAIN 2 24 123 0 36 0 185
GORKHA 2903 95 664 190 320 2 4174
LAMJUNG 1367 59 368 98 175 2 2069
TANAHU 3178 28 621 89 518 1 4435
KASKI 4368 82 752 565 1161 12 6940
PARBAT 1126 11 363 188 263 2 1953
SYANGJA 2940 29 797 125 210 0 4101
PALPA 2207 2 694 146 287 0 3336
MYAGDI 1436 35 279 160 294 0 2204
BAGLUNG 1969 27 507 155 254 1 2913
GULMI 1301 18 387 110 279 0 2095
ARGHAKHANCHI 3053 4 453 77 281 0 3868
W.HILLS 25848 390 5885 1904 4042 20 38089
NAWALPARASI 3095 18 1435 437 1362 16 6363
RUPANDEHI 4342 19 1655 420 1024 14 7473
KAPILBASTU 3041 30 1505 111 622 15 5324
W.TERAI 10478 67 4594 968 3008 45 19160
W.REGION 36328 481 10602 2872 7086 65 57434
DOLPA 55 166 119 0 34 0 374
MUGU 201 132 204 1 40 0 578
HUMLA 69 79 144 0 45 0 338
JUMLA 132 130 568 0 83 0 913
KALIKOT 490 95 361 0 57 0 1003
MW.MOUNTAIN 947 602 1396 1 259 0 3205
RUKUM 1514 156 597 309 119 0 2695
ROLPA 1445 70 472 325 134 0 2445
PYUTHAN 1434 41 464 302 235 0 2477
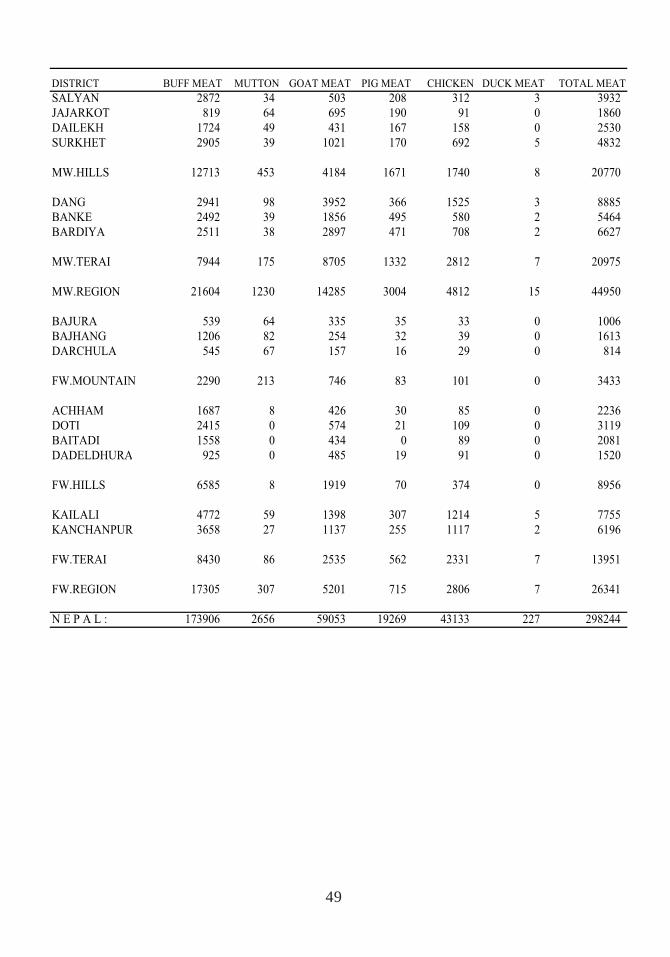
49
DISTRICT BUFF MEAT MUTTON GOAT MEAT PIG MEAT CHICKEN DUCK MEAT TOTAL MEAT
SALYAN 2872 34 503 208 312 3 3932
JAJARKOT 819 64 695 190 91 0 1860
DAILEKH 1724 49 431 167 158 0 2530
SURKHET 2905 39 1021 170 692 5 4832
MW.HILLS 12713 453 4184 1671 1740 8 20770
DANG 2941 98 3952 366 1525 3 8885
BANKE 2492 39 1856 495 580 2 5464
BARDIYA 2511 38 2897 471 708 2 6627
MW.TERAI 7944 175 8705 1332 2812 7 20975
MW.REGION 21604 1230 14285 3004 4812 15 44950
BAJURA 539 64 335 35 33 0 1006
BAJHANG 1206 82 254 32 39 0 1613
DARCHULA 545 67 157 16 29 0 814
FW.MOUNTAIN 2290 213 746 83 101 0 3433
ACHHAM 1687 8 426 30 85 0 2236
DOTI 2415 0 574 21 109 0 3119
BAITADI 1558 0 434 0 89 0 2081
DADELDHURA 925 0 485 19 91 0 1520
FW.HILLS 6585 8 1919 70 374 0 8956
KAILALI 4772 59 1398 307 1214 5 7755
KANCHANPUR 3658 27 1137 255 1117 2 6196
FW.TERAI 8430 86 2535 562 2331 7 13951
FW.REGION 17305 307 5201 715 2806 7 26341
N E P A L : 173906 2656 59053 19269 43133 227 298244
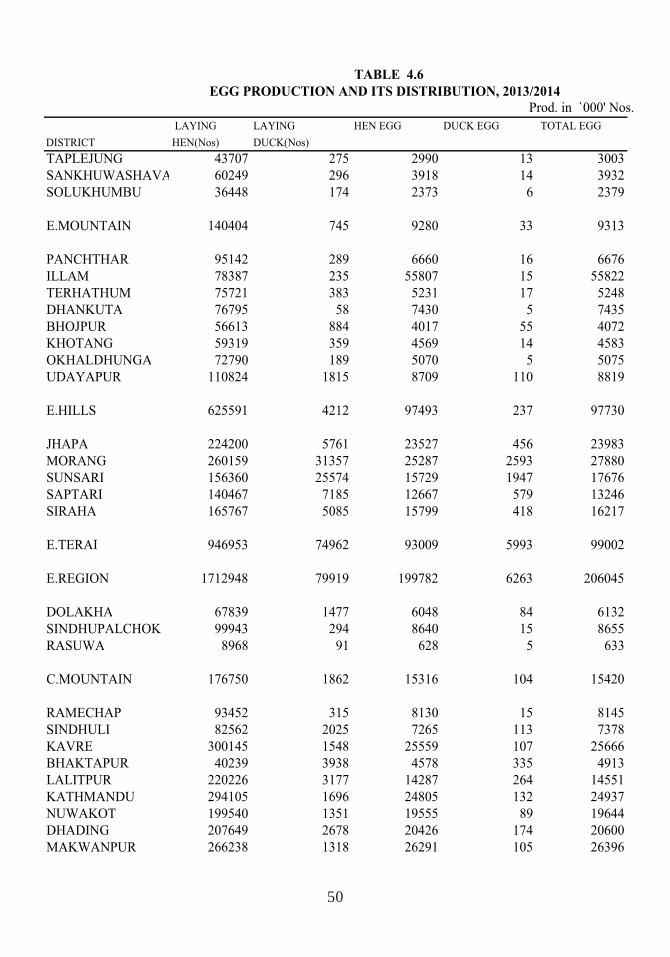
50
TABLE 4.6
EGG PRODUCTION AND ITS DISTRIBUTION, 2013/2014
Prod. in `000' Nos.
LAYING LAYING HEN EGG DUCK EGG TOTAL EGG
DISTRICT HEN(Nos) DUCK(Nos)
TAPLEJUNG 43707 275 2990 13 3003
SANKHUWASHAVA 60249 296 3918 14 3932
SOLUKHUMBU 36448 174 2373 6 2379
E.MOUNTAIN 140404 745 9280 33 9313
PANCHTHAR 95142 289 6660 16 6676
ILLAM 78387 235 55807 15 55822
TERHATHUM 75721 383 5231 17 5248
DHANKUTA 76795 58 7430 5 7435
BHOJPUR 56613 884 4017 55 4072
KHOTANG 59319 359 4569 14 4583
OKHALDHUNGA 72790 189 5070 5 5075
UDAYAPUR 110824 1815 8709 110 8819
E.HILLS 625591 4212 97493 237 97730
JHAPA 224200 5761 23527 456 23983
MORANG 260159 31357 25287 2593 27880
SUNSARI 156360 25574 15729 1947 17676
SAPTARI 140467 7185 12667 579 13246
SIRAHA 165767 5085 15799 418 16217
E.TERAI 946953 74962 93009 5993 99002
E.REGION 1712948 79919 199782 6263 206045
DOLAKHA 67839 1477 6048 84 6132
SINDHUPALCHOK 99943 294 8640 15 8655
RASUWA 8968 91 628 5 633
C.MOUNTAIN 176750 1862 15316 104 15420
RAMECHAP 93452 315 8130 15 8145
SINDHULI 82562 2025 7265 113 7378
KAVRE 300145 1548 25559 107 25666
BHAKTAPUR 40239 3938 4578 335 4913
LALITPUR 220226 3177 14287 264 14551
KATHMANDU 294105 1696 24805 132 24937
NUWAKOT 199540 1351 19555 89 19644
DHADING 207649 2678 20426 174 20600
MAKWANPUR 266238 1318 26291 105 26396
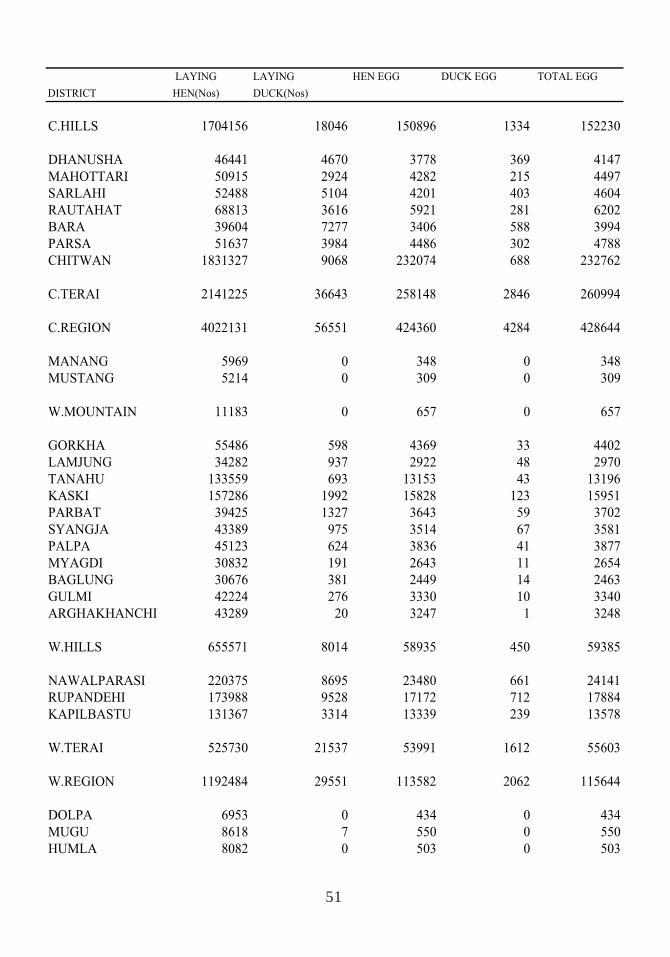
51
LAYING LAYING HEN EGG DUCK EGG TOTAL EGG
DISTRICT HEN(Nos) DUCK(Nos)
C.HILLS 1704156 18046 150896 1334 152230
DHANUSHA 46441 4670 3778 369 4147
MAHOTTARI 50915 2924 4282 215 4497
SARLAHI 52488 5104 4201 403 4604
RAUTAHAT 68813 3616 5921 281 6202
BARA 39604 7277 3406 588 3994
PARSA 51637 3984 4486 302 4788
CHITWAN 1831327 9068 232074 688 232762
C.TERAI 2141225 36643 258148 2846 260994
C.REGION 4022131 56551 424360 4284 428644
MANANG 5969 0 348 0 348
MUSTANG 5214 0 309 0 309
W.MOUNTAIN 11183 0 657 0 657
GORKHA 55486 598 4369 33 4402
LAMJUNG 34282 937 2922 48 2970
TANAHU 133559 693 13153 43 13196
KASKI 157286 1992 15828 123 15951
PARBAT 39425 1327 3643 59 3702
SYANGJA 43389 975 3514 67 3581
PALPA 45123 624 3836 41 3877
MYAGDI 30832 191 2643 11 2654
BAGLUNG 30676 381 2449 14 2463
GULMI 42224 276 3330 10 3340
ARGHAKHANCHI 43289 20 3247 1 3248
W.HILLS 655571 8014 58935 450 59385
NAWALPARASI 220375 8695 23480 661 24141
RUPANDEHI 173988 9528 17172 712 17884
KAPILBASTU 131367 3314 13339 239 13578
W.TERAI 525730 21537 53991 1612 55603
W.REGION 1192484 29551 113582 2062 115644
DOLPA 6953 0 434 0 434
MUGU 8618 7 550 0 550
HUMLA 8082 0 503 0 503
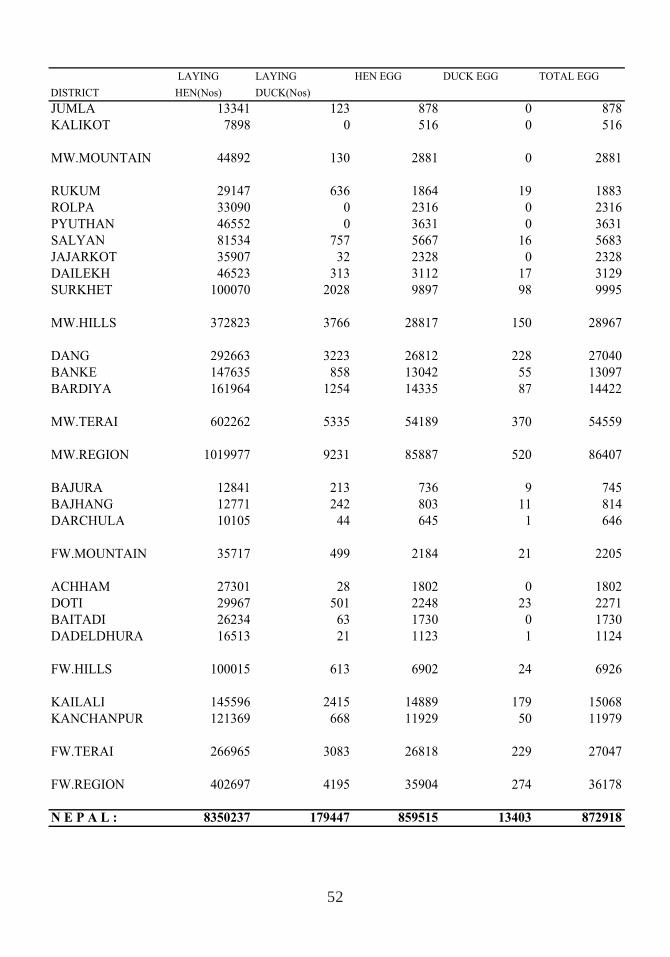
52
LAYING LAYING HEN EGG DUCK EGG TOTAL EGG
DISTRICT HEN(Nos) DUCK(Nos)
JUMLA 13341 123 878 0 878
KALIKOT 7898 0 516 0 516
MW.MOUNTAIN 44892 130 2881 0 2881
RUKUM 29147 636 1864 19 1883
ROLPA 33090 0 2316 0 2316
PYUTHAN 46552 0 3631 0 3631
SALYAN 81534 757 5667 16 5683
JAJARKOT 35907 32 2328 0 2328
DAILEKH 46523 313 3112 17 3129
SURKHET 100070 2028 9897 98 9995
MW.HILLS 372823 3766 28817 150 28967
DANG 292663 3223 26812 228 27040
BANKE 147635 858 13042 55 13097
BARDIYA 161964 1254 14335 87 14422
MW.TERAI 602262 5335 54189 370 54559
MW.REGION 1019977 9231 85887 520 86407
BAJURA 12841 213 736 9 745
BAJHANG 12771 242 803 11 814
DARCHULA 10105 44 645 1 646
FW.MOUNTAIN 35717 499 2184 21 2205
ACHHAM 27301 28 1802 0 1802
DOTI 29967 501 2248 23 2271
BAITADI 26234 63 1730 0 1730
DADELDHURA 16513 21 1123 1 1124
FW.HILLS 100015 613 6902 24 6926
KAILALI 145596 2415 14889 179 15068
KANCHANPUR 121369 668 11929 50 11979
FW.TERAI 266965 3083 26818 229 27047
FW.REGION 402697 4195 35904 274 36178
N E P A L : 8350237 179447 859515 13403 872918
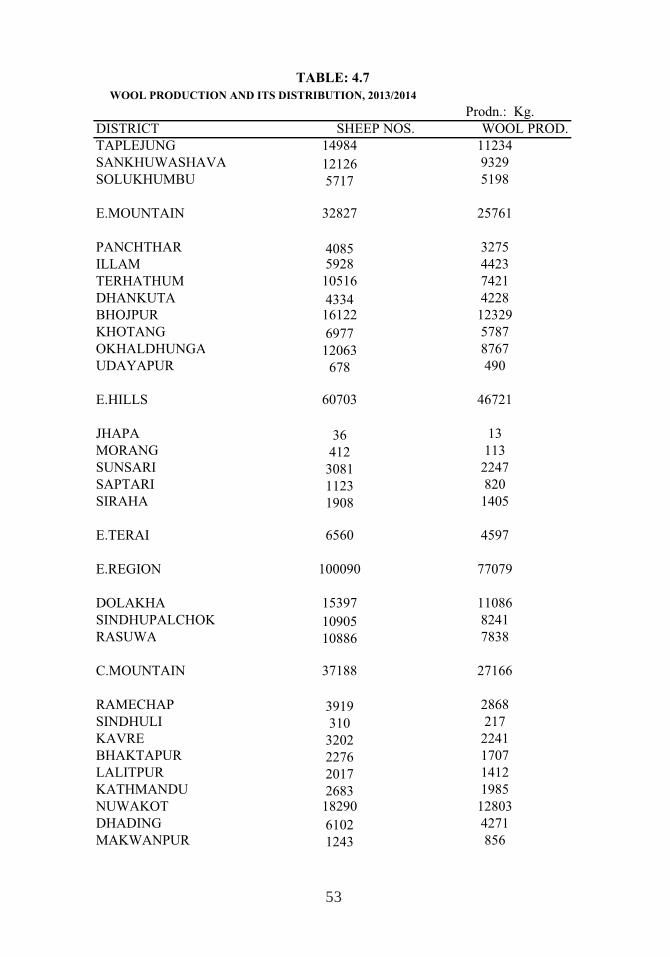
53
WOOL PRODUCTION AND ITS DISTRIBUTION, 2013/2014
Prodn.: Kg.
DISTRICT SHEEP NOS. WOOL PROD.
TAPLEJUNG 14984 11234
SANKHUWASHAVA 12126 9329
SOLUKHUMBU 5717 5198
E.MOUNTAIN 32827 25761
PANCHTHAR 4085 3275
ILLAM 5928 4423
TERHATHUM 10516 7421
DHANKUTA 4334 4228
BHOJPUR 16122 12329
KHOTANG 6977 5787
OKHALDHUNGA 12063 8767
UDAYAPUR 678 490
E.HILLS 60703 46721
JHAPA 36 13
MORANG 412 113
SUNSARI 3081 2247
SAPTARI 1123 820
SIRAHA 1908 1405
E.TERAI 6560 4597
E.REGION 100090 77079
DOLAKHA 15397 11086
SINDHUPALCHOK 10905 8241
RASUWA 10886 7838
C.MOUNTAIN 37188 27166
RAMECHAP 3919 2868
SINDHULI 310 217
KAVRE 3202 2241
BHAKTAPUR 2276 1707
LALITPUR 2017 1412
KATHMANDU 2683 1985
NUWAKOT 18290 12803
DHADING 6102 4271
MAKWANPUR 1243 856
TABLE: 4.7
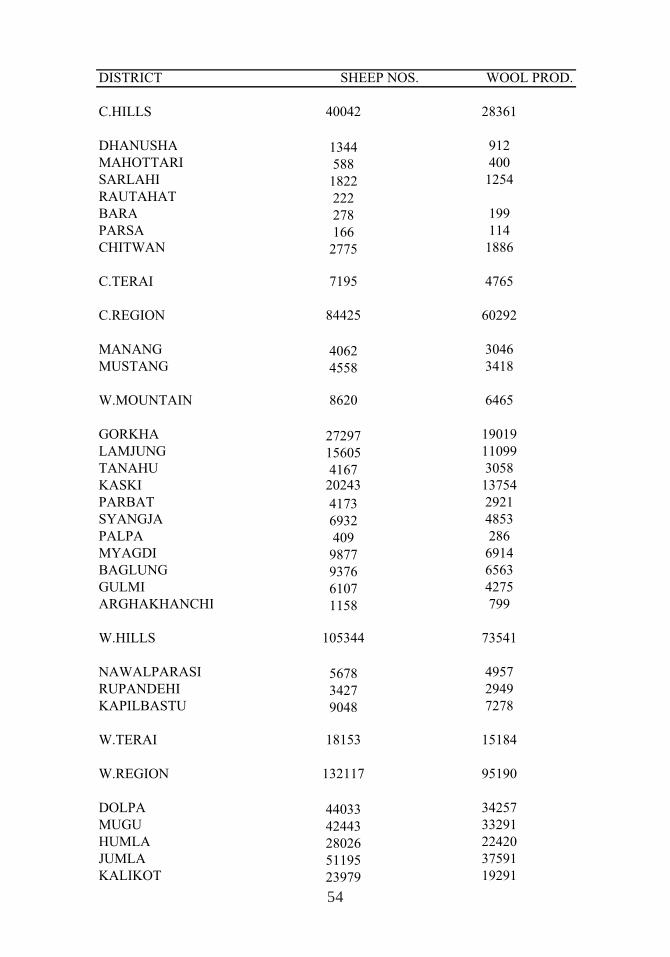
54
DISTRICT SHEEP NOS. WOOL PROD.
C.HILLS 40042 28361
DHANUSHA 1344 912
MAHOTTARI 588 400
SARLAHI 1822 1254
RAUTAHAT 222BARA 278 199
PARSA 166 114
CHITWAN 2775 1886
C.TERAI 7195 4765
C.REGION 84425 60292
MANANG 4062 3046
MUSTANG 4558 3418
W.MOUNTAIN 8620 6465
GORKHA 27297 19019
LAMJUNG 15605 11099
TANAHU 4167 3058
KASKI 20243 13754
PARBAT 4173 2921
SYANGJA 6932 4853
PALPA 409 286
MYAGDI 9877 6914
BAGLUNG 9376 6563
GULMI 6107 4275
ARGHAKHANCHI 1158 799
W.HILLS 105344 73541
NAWALPARASI 5678 4957
RUPANDEHI 3427 2949
KAPILBASTU 9048 7278
W.TERAI 18153 15184
W.REGION 132117 95190
DOLPA 44033 34257
MUGU 42443 33291
HUMLA 28026 22420
JUMLA 51195 37591
KALIKOT 23979 19291
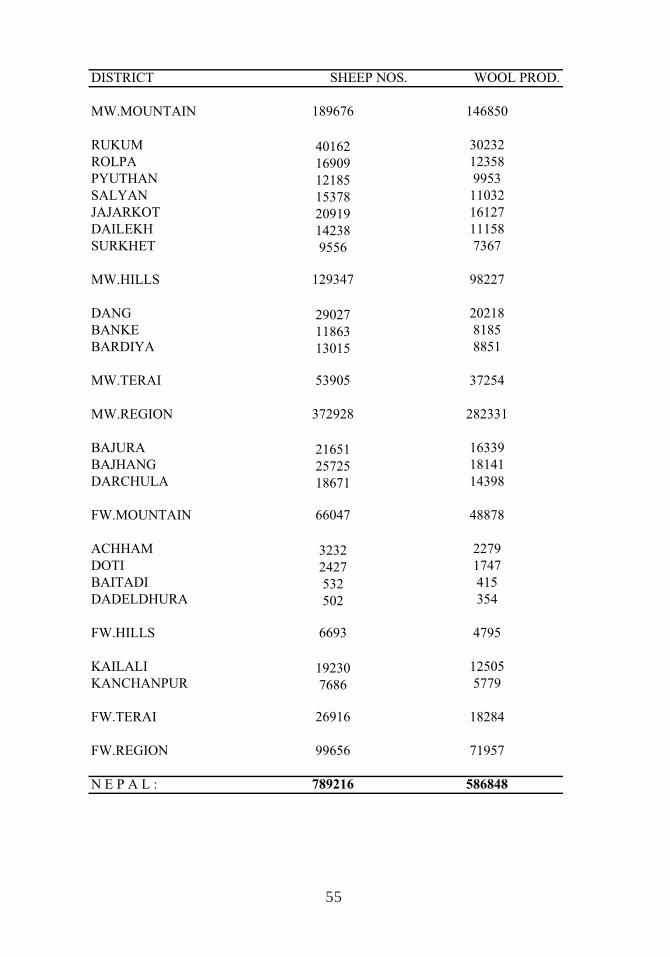
55
DISTRICT SHEEP NOS. WOOL PROD.
MW.MOUNTAIN 189676 146850
RUKUM 40162 30232
ROLPA 16909 12358
PYUTHAN 12185 9953
SALYAN 15378 11032
JAJARKOT 20919 16127
DAILEKH 14238 11158
SURKHET 9556 7367
MW.HILLS 129347 98227
DANG 29027 20218
BANKE 11863 8185
BARDIYA 13015 8851
MW.TERAI 53905 37254
MW.REGION 372928 282331
BAJURA 21651 16339
BAJHANG 25725 18141
DARCHULA 18671 14398
FW.MOUNTAIN 66047 48878
ACHHAM 3232 2279
DOTI 2427 1747
BAITADI 532 415
DADELDHURA 502 354
FW.HILLS 6693 4795
KAILALI 19230 12505
KANCHANPUR 7686 5779
FW.TERAI 26916 18284
FW.REGION 99656 71957
N E P A L : 789216 586848
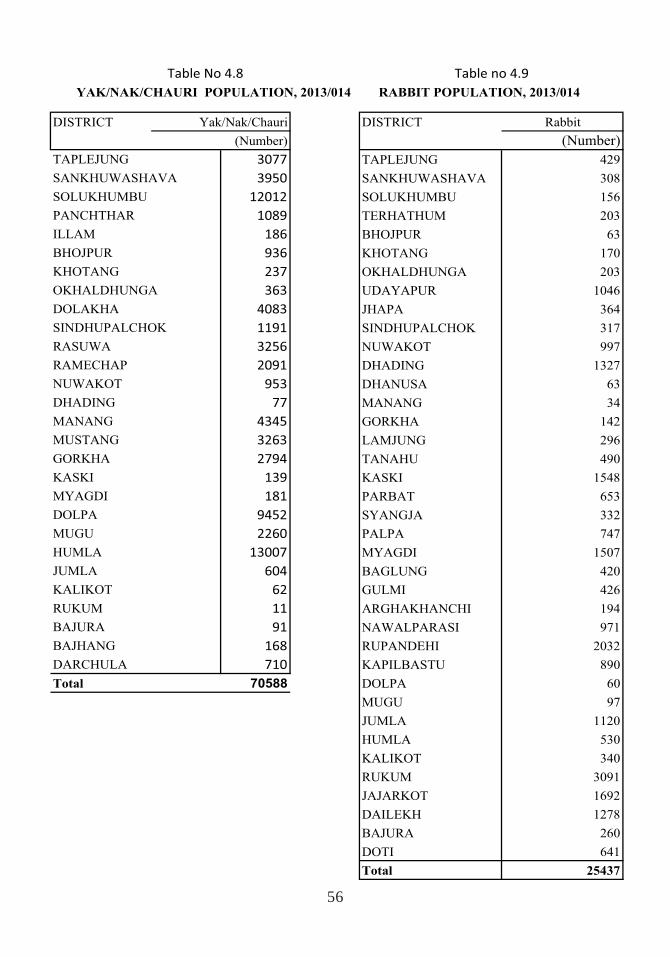
56
RABBIT POPULATION, 2013/014
DISTRICT Yak/Nak/Chauri DISTRICT Rabbit
(Number) (Number)
TAPLEJUNG 3077 TAPLEJUNG 429
SANKHUWASHAVA 3950 SANKHUWASHAVA 308
SOLUKHUMBU 12012 SOLUKHUMBU 156
PANCHTHAR 1089 TERHATHUM 203
ILLAM 186 BHOJPUR 63
BHOJPUR 936 KHOTANG 170
KHOTANG 237 OKHALDHUNGA 203
OKHALDHUNGA 363 UDAYAPUR 1046
DOLAKHA 4083 JHAPA 364
SINDHUPALCHOK 1191 SINDHUPALCHOK 317
RASUWA 3256 NUWAKOT 997
RAMECHAP 2091 DHADING 1327
NUWAKOT 953 DHANUSA 63
DHADING 77 MANANG 34
MANANG 4345 GORKHA 142
MUSTANG 3263 LAMJUNG 296
GORKHA 2794 TANAHU 490
KASKI 139 KASKI 1548
MYAGDI 181 PARBAT 653
DOLPA 9452 SYANGJA 332
MUGU 2260 PALPA 747
HUMLA 13007 MYAGDI 1507
JUMLA 604 BAGLUNG 420
KALIKOT 62 GULMI 426
RUKUM 11 ARGHAKHANCHI 194
BAJURA 91 NAWALPARASI 971
BAJHANG 168 RUPANDEHI 2032
DARCHULA 710 KAPILBASTU 890
Total 70588 DOLPA 60
MUGU 97
JUMLA 1120
HUMLA 530
KALIKOT 340
RUKUM 3091
JAJARKOT 1692
DAILEKH 1278
BAJURA 260
DOTI 641
Total 25437
YAK/NAK/CHAURI POPULATION, 2013/014
Table no 4.9Table No 4.8
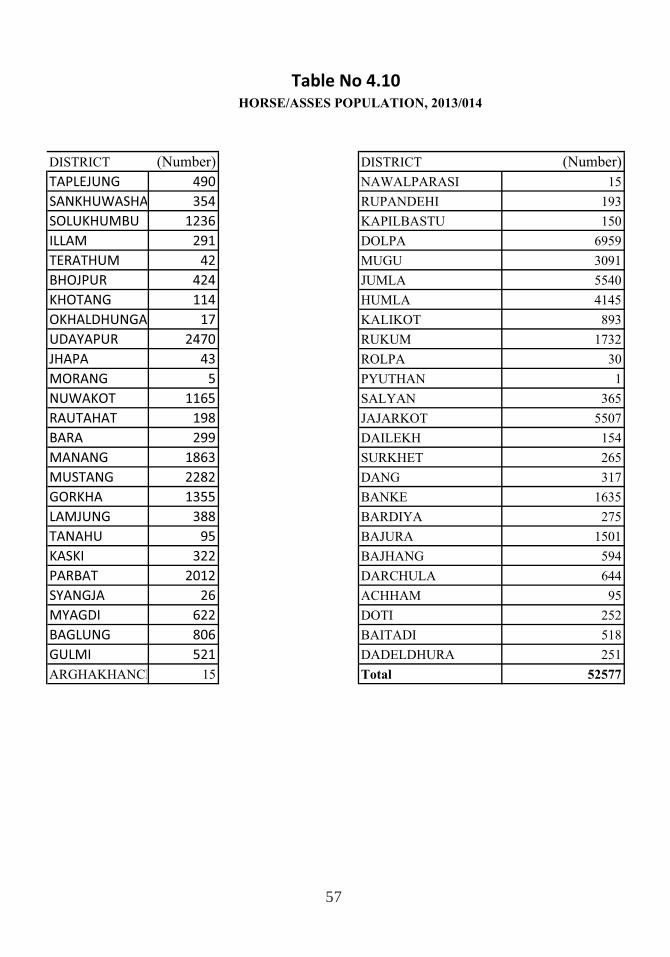
57
Table No 4.10 HORSE/ASSES POPULATION, 2013/014
DISTRICT (Number) DISTRICT (Number)
TAPLEJUNG 490 NAWALPARASI 15
SANKHUWASHA 354 RUPANDEHI 193
SOLUKHUMBU 1236 KAPILBASTU 150
ILLAM 291 DOLPA 6959
TERATHUM 42 MUGU 3091
BHOJPUR 424 JUMLA 5540
KHOTANG 114 HUMLA 4145
OKHALDHUNGA 17 KALIKOT 893
UDAYAPUR 2470 RUKUM 1732
JHAPA 43 ROLPA 30
MORANG 5 PYUTHAN 1
NUWAKOT 1165 SALYAN 365
RAUTAHAT 198 JAJARKOT 5507
BARA 299 DAILEKH 154
MANANG 1863 SURKHET 265
MUSTANG 2282 DANG 317
GORKHA 1355 BANKE 1635
LAMJUNG 388 BARDIYA 275
TANAHU 95 BAJURA 1501
KASKI 322 BAJHANG 594
PARBAT 2012 DARCHULA 644
SYANGJA 26 ACHHAM 95
MYAGDI 622 DOTI 252
BAGLUNG 806 BAITADI 518
GULMI 521 DADELDHURA 251
ARGHAKHANCH 15 Total 52577

58

59
5.FISHERY

60
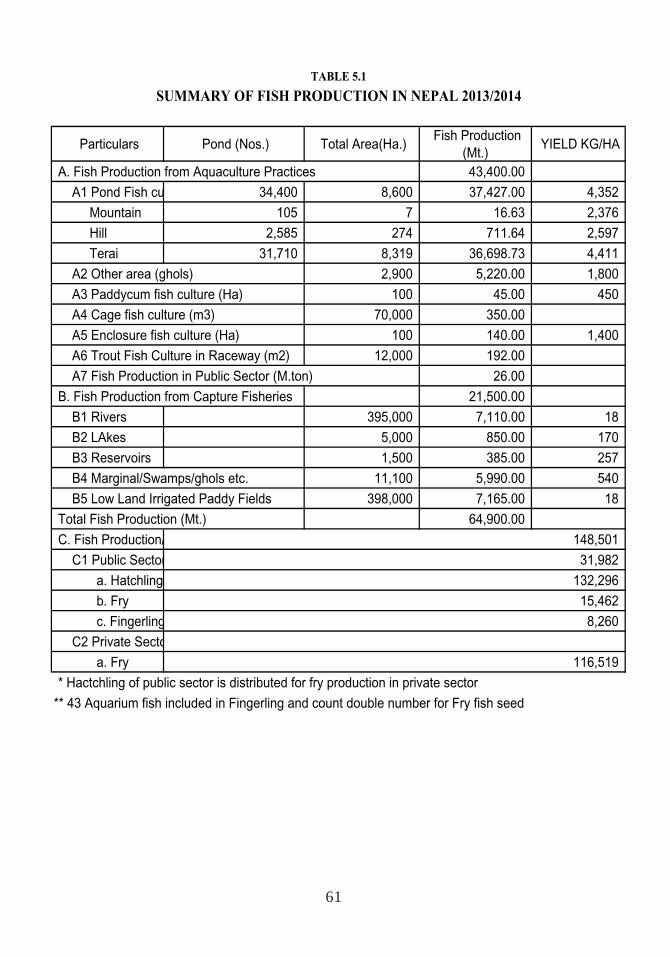
61
Particulars Pond (Nos.) Total Area(Ha.) Fish Production
(Mt.) YIELD KG/HA
A. Fish Production from Aquaculture Practices 43,400.00 A1 Pond Fish cu 34,400 8,600 37,427.00 4,352 Mountain 105 7 16.63 2,376 Hill 2,585 274 711.64 2,597 Terai 31,710 8,319 36,698.73 4,411 A2 Other area (ghols) 2,900 5,220.00 1,800 A3 Paddycum fish culture (Ha) 100 45.00 450 A4 Cage fish culture (m3) 70,000 350.00 A5 Enclosure fish culture (Ha) 100 140.00 1,400 A6 Trout Fish Culture in Raceway (m2) 12,000 192.00 A7 Fish Production in Public Sector (M.ton) 26.00 B. Fish Production from Capture Fisheries 21,500.00 B1 Rivers 395,000 7,110.00 18 B2 LAkes 5,000 850.00 170 B3 Reservoirs 1,500 385.00 257 B4 Marginal/Swamps/ghols etc. 11,100 5,990.00 540 B5 Low Land Irrigated Paddy Fields 398,000 7,165.00 18 Total Fish Production (Mt.) 64,900.00 C. Fish Production/ C1 Public Sector a. Hatchling b. Fry c. Fingerling C2 Private Secto a. Fry* Hactchling of public sector is distributed for fry production in private sector
** 43 Aquarium fish included in Fingerling and count double number for Fry fish seed
TABLE 5.1
SUMMARY OF FISH PRODUCTION IN NEPAL 2013/2014
116,519
148,501 31,982
132,296 15,462 8,260
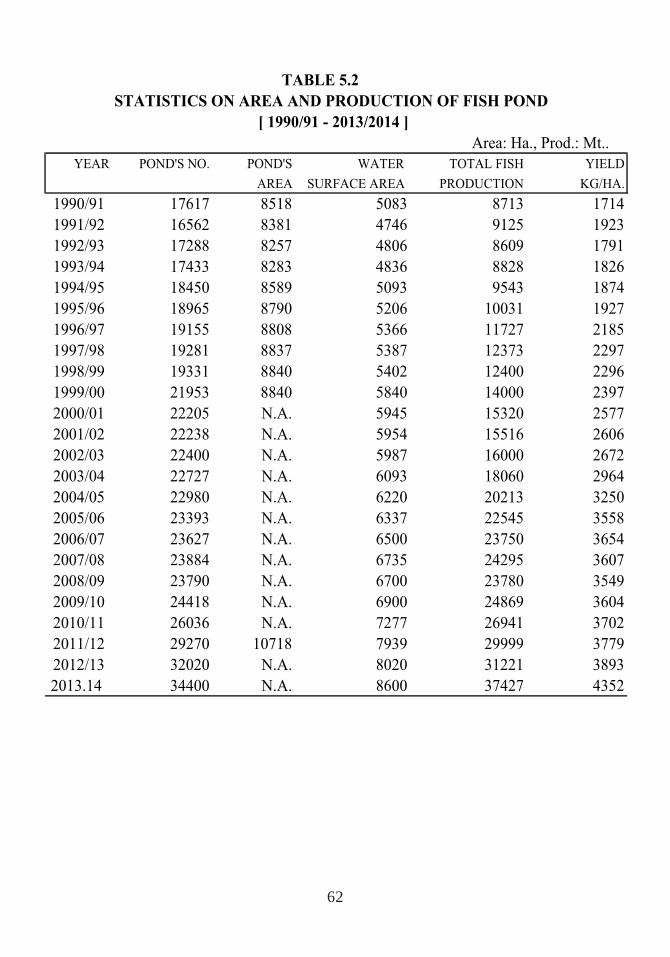
62
TABLE 5.2
STATISTICS ON AREA AND PRODUCTION OF FISH POND
[ 1990/91 - 2013/2014 ]
Area: Ha., Prod.: Mt..
YEAR POND'S NO. POND'S WATER TOTAL FISH YIELD
AREA SURFACE AREA PRODUCTION KG/HA.
1990/91 17617 8518 5083 8713 1714
1991/92 16562 8381 4746 9125 1923
1992/93 17288 8257 4806 8609 1791
1993/94 17433 8283 4836 8828 1826
1994/95 18450 8589 5093 9543 1874
1995/96 18965 8790 5206 10031 1927
1996/97 19155 8808 5366 11727 2185
1997/98 19281 8837 5387 12373 2297
1998/99 19331 8840 5402 12400 2296
1999/00 21953 8840 5840 14000 2397
2000/01 22205 N.A. 5945 15320 2577
2001/02 22238 N.A. 5954 15516 2606
2002/03 22400 N.A. 5987 16000 2672
2003/04 22727 N.A. 6093 18060 2964
2004/05 22980 N.A. 6220 20213 3250
2005/06 23393 N.A. 6337 22545 3558
2006/07 23627 N.A. 6500 23750 3654
2007/08 23884 N.A. 6735 24295 3607
2008/09 23790 N.A. 6700 23780 3549
2009/10 24418 N.A. 6900 24869 3604
2010/11 26036 N.A. 7277 26941 3702
2011/12 29270 10718 7939 29999 3779
2012/13 32020 N.A. 8020 31221 3893
2013.14 34400 N.A. 8600 37427 4352
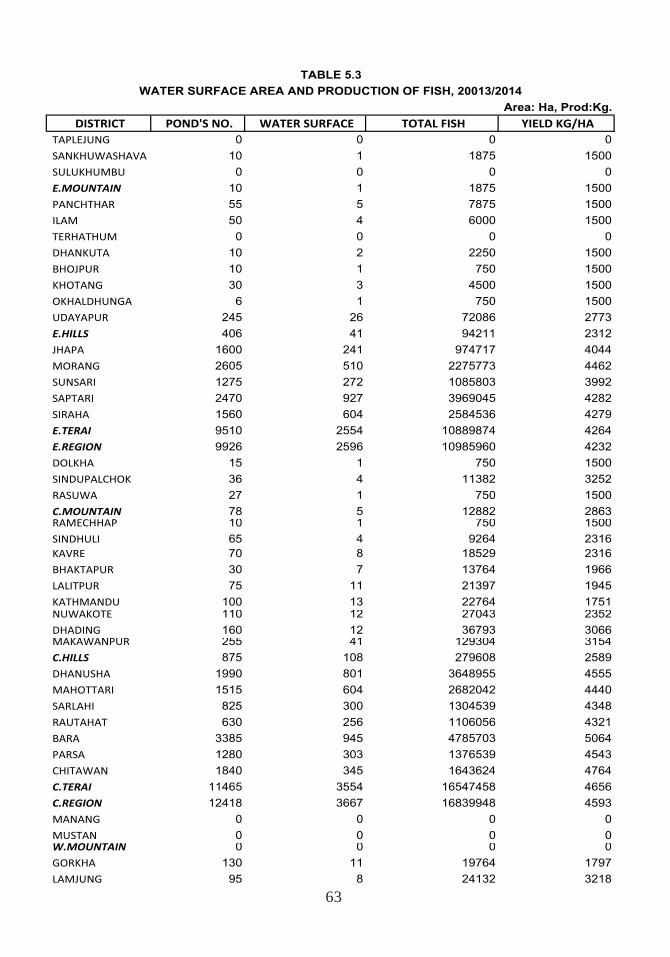
63
WATER SURFACE AREA AND PRODUCTION OF FISH, 20013/2014 Area: Ha, Prod:Kg.
DISTRICT POND'S NO. WATER SURFACE TOTAL FISH YIELD KG/HA
TAPLEJUNG 0 0 0 0SANKHUWASHAVA 10 1 1875 1500SULUKHUMBU 0 0 0 0E.MOUNTAIN 10 1 1875 1500PANCHTHAR 55 5 7875 1500ILAM 50 4 6000 1500TERHATHUM 0 0 0 0DHANKUTA 10 2 2250 1500BHOJPUR 10 1 750 1500KHOTANG 30 3 4500 1500OKHALDHUNGA 6 1 750 1500UDAYAPUR 245 26 72086 2773E.HILLS 406 41 94211 2312JHAPA 1600 241 974717 4044MORANG 2605 510 2275773 4462SUNSARI 1275 272 1085803 3992SAPTARI 2470 927 3969045 4282SIRAHA 1560 604 2584536 4279E.TERAI 9510 2554 10889874 4264E.REGION 9926 2596 10985960 4232DOLKHA 15 1 750 1500SINDUPALCHOK 36 4 11382 3252RASUWA 27 1 750 1500C.MOUNTAIN 78 5 12882 2863RAMECHHAP 10 1 750 1500SINDHULI 65 4 9264 2316KAVRE 70 8 18529 2316BHAKTAPUR 30 7 13764 1966LALITPUR 75 11 21397 1945KATHMANDU 100 13 22764 1751NUWAKOTE 110 12 27043 2352DHADING 160 12 36793 3066MAKAWANPUR 255 41 129304 3154C.HILLS 875 108 279608 2589DHANUSHA 1990 801 3648955 4555MAHOTTARI 1515 604 2682042 4440SARLAHI 825 300 1304539 4348RAUTAHAT 630 256 1106056 4321BARA 3385 945 4785703 5064PARSA 1280 303 1376539 4543CHITAWAN 1840 345 1643624 4764C.TERAI 11465 3554 16547458 4656C.REGION 12418 3667 16839948 4593MANANG 0 0 0 0MUSTAN 0 0 0 0W.MOUNTAIN 0 0 0 0GORKHA 130 11 19764 1797LAMJUNG 95 8 24132 3218
TABLE 5.3
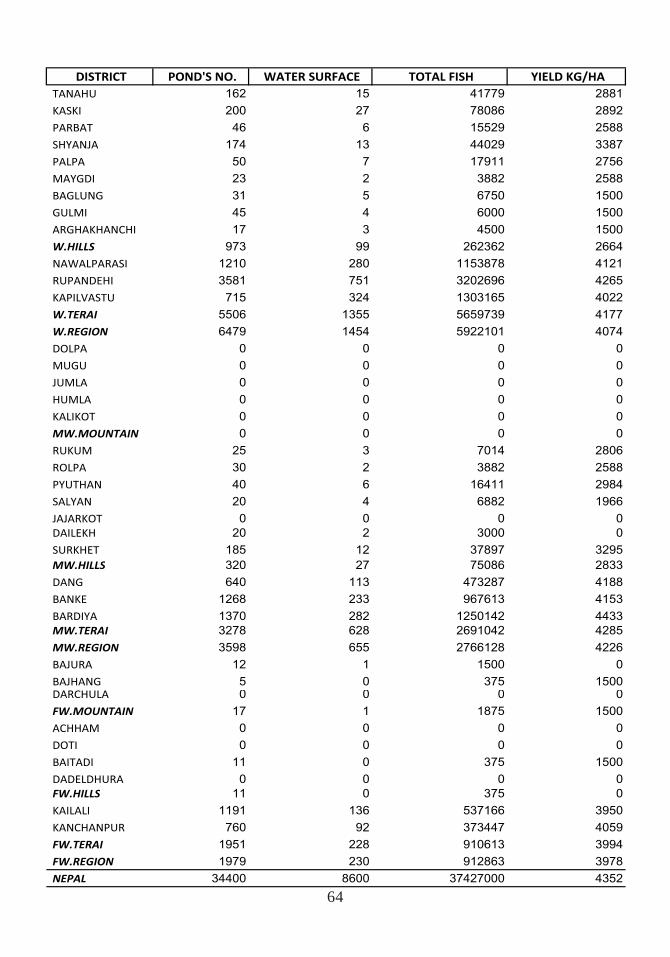
64
DISTRICT POND'S NO. WATER SURFACE TOTAL FISH YIELD KG/HA
TANAHU 162 15 41779 2881KASKI 200 27 78086 2892PARBAT 46 6 15529 2588SHYANJA 174 13 44029 3387PALPA 50 7 17911 2756MAYGDI 23 2 3882 2588BAGLUNG 31 5 6750 1500GULMI 45 4 6000 1500ARGHAKHANCHI 17 3 4500 1500W.HILLS 973 99 262362 2664NAWALPARASI 1210 280 1153878 4121RUPANDEHI 3581 751 3202696 4265KAPILVASTU 715 324 1303165 4022W.TERAI 5506 1355 5659739 4177W.REGION 6479 1454 5922101 4074DOLPA 0 0 0 0MUGU 0 0 0 0JUMLA 0 0 0 0HUMLA 0 0 0 0KALIKOT 0 0 0 0MW.MOUNTAIN 0 0 0 0RUKUM 25 3 7014 2806ROLPA 30 2 3882 2588PYUTHAN 40 6 16411 2984SALYAN 20 4 6882 1966JAJARKOT 0 0 0 0DAILEKH 20 2 3000 0SURKHET 185 12 37897 3295MW.HILLS 320 27 75086 2833DANG 640 113 473287 4188BANKE 1268 233 967613 4153BARDIYA 1370 282 1250142 4433MW.TERAI 3278 628 2691042 4285MW.REGION 3598 655 2766128 4226BAJURA 12 1 1500 0BAJHANG 5 0 375 1500DARCHULA 0 0 0 0FW.MOUNTAIN 17 1 1875 1500ACHHAM 0 0 0 0DOTI 0 0 0 0BAITADI 11 0 375 1500DADELDHURA 0 0 0 0FW.HILLS 11 0 375 0KAILALI 1191 136 537166 3950KANCHANPUR 760 92 373447 4059FW.TERAI 1951 228 910613 3994FW.REGION 1979 230 912863 3978NEPAL 34400 8600 37427000 4352
65
6.HORTICULTURE

66
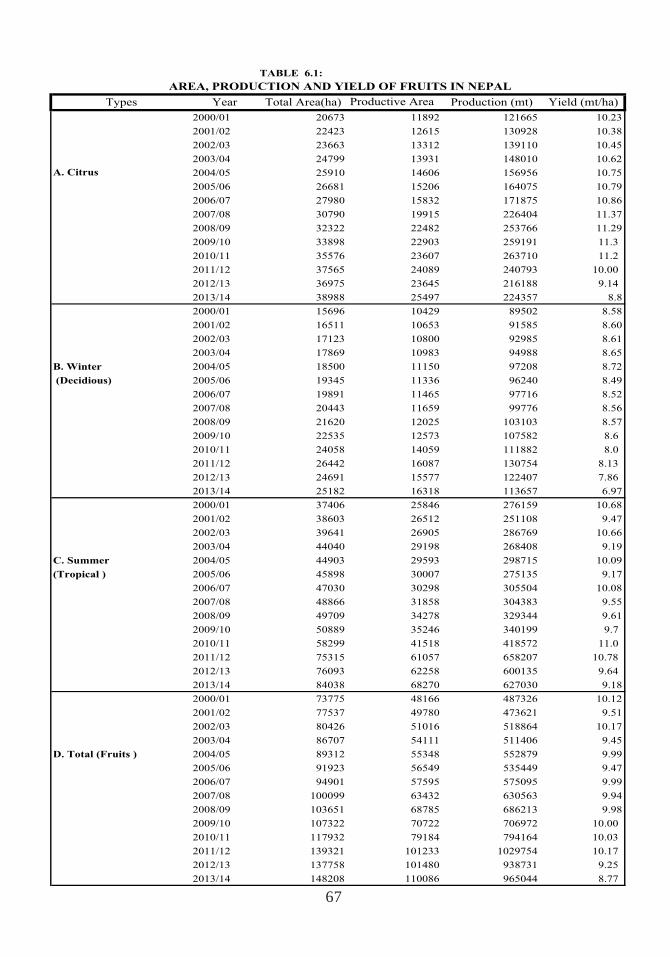
67
TABLE 6.1:
Types Year Total Area(ha) Productive Area Production (mt) Yield (mt/ha)
2000/01 20673 11892 121665 10.23
2001/02 22423 12615 130928 10.38
2002/03 23663 13312 139110 10.45
2003/04 24799 13931 148010 10.62
A. Citrus 2004/05 25910 14606 156956 10.75
2005/06 26681 15206 164075 10.79
2006/07 27980 15832 171875 10.86
2007/08 30790 19915 226404 11.37
2008/09 32322 22482 253766 11.29
2009/10 33898 22903 259191 11.3
2010/11 35576 23607 263710 11.2
2011/12 37565 24089 240793 10.00
2012/13 36975 23645 216188 9.14
2013/14 38988 25497 224357 8.8
2000/01 15696 10429 89502 8.58
2001/02 16511 10653 91585 8.60
2002/03 17123 10800 92985 8.61
2003/04 17869 10983 94988 8.65
B. Winter 2004/05 18500 11150 97208 8.72
(Decidious) 2005/06 19345 11336 96240 8.49
2006/07 19891 11465 97716 8.52
2007/08 20443 11659 99776 8.56
2008/09 21620 12025 103103 8.57
2009/10 22535 12573 107582 8.6
2010/11 24058 14059 111882 8.0
2011/12 26442 16087 130754 8.13
2012/13 24691 15577 122407 7.86
2013/14 25182 16318 113657 6.97
2000/01 37406 25846 276159 10.68
2001/02 38603 26512 251108 9.47
2002/03 39641 26905 286769 10.66
2003/04 44040 29198 268408 9.19
C. Summer 2004/05 44903 29593 298715 10.09
(Tropical ) 2005/06 45898 30007 275135 9.17
2006/07 47030 30298 305504 10.08
2007/08 48866 31858 304383 9.55
2008/09 49709 34278 329344 9.61
2009/10 50889 35246 340199 9.7
2010/11 58299 41518 418572 11.0
2011/12 75315 61057 658207 10.78
2012/13 76093 62258 600135 9.64
2013/14 84038 68270 627030 9.18
2000/01 73775 48166 487326 10.12
2001/02 77537 49780 473621 9.51
2002/03 80426 51016 518864 10.17
2003/04 86707 54111 511406 9.45
D. Total (Fruits ) 2004/05 89312 55348 552879 9.99
2005/06 91923 56549 535449 9.47
2006/07 94901 57595 575095 9.99
2007/08 100099 63432 630563 9.94
2008/09 103651 68785 686213 9.98
2009/10 107322 70722 706972 10.00
2010/11 117932 79184 794164 10.03
2011/12 139321 101233 1029754 10.17
2012/13 137758 101480 938731 9.25
2013/14 148208 110086 965044 8.77
AREA, PRODUCTION AND YIELD OF FRUITS IN NEPAL
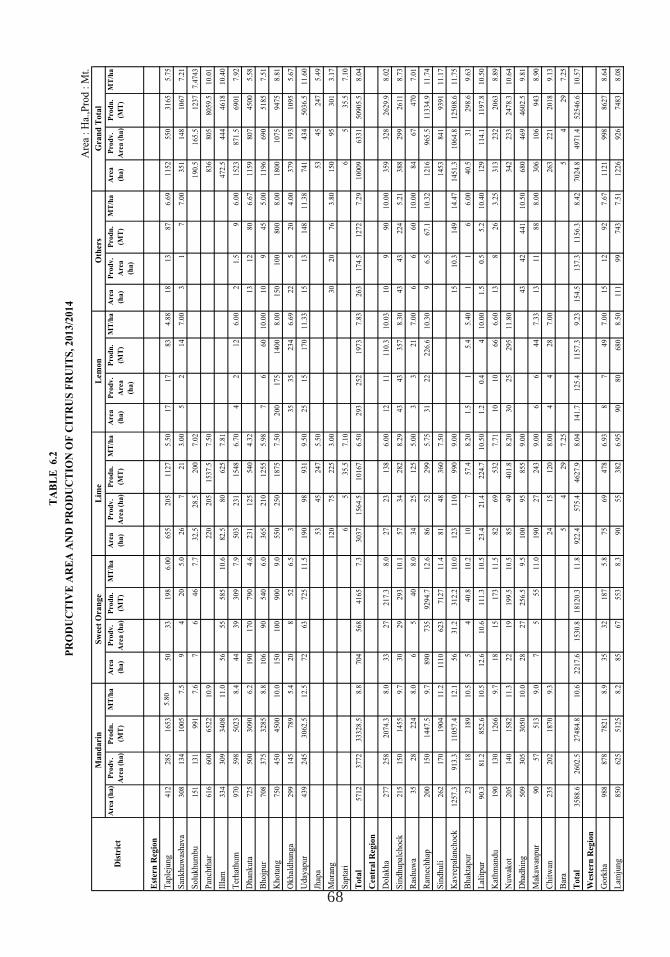
68
Are
a (
ha)
Pro
dv.
Are
a (
ha)
Pro
dn
.
(MT
)
MT
/ha
Are
a
(ha)
Pro
dv.
Are
a (
ha)
Pro
dn
.
(MT
)
MT
/ha
Are
a
(ha)
Pro
dv.
Are
a (
ha)
Pro
dn
.
(MT
)
MT
/ha
Are
a
(ha)
Pro
dv.
Are
a
(ha)
Pro
dn
.
(MT
)
MT
/ha
Are
a
(ha)
Pro
dv.
Are
a
(ha)
Pro
dn
.
(MT
)
MT
/ha
Are
a
(ha)
Pro
dv.
Are
a (
ha)
Pro
dn
.
(MT
)
MT
/ha
Est
ern
Reg
ion
Tap
leju
ng
412
285
1653
5.8
050
33
198
6.0
0655
205
1127
5.5
017
17
83
4.8
818
13
87
6.6
91152
550
3165
5.7
5
San
khuw
ashav
a308
134
1005
7.5
94
20
5.0
26
721
3.0
05
214
7.0
03
17
7.0
0351
148
1067
7.2
1
Solu
khum
bu
151
131
991
7.6
76
46
7.7
32.5
28.5
200
7.0
2190.5
165.5
1237
7.4
743
Pan
chth
ar616
600
6522
10.9
220
205
1537.5
7.5
0836
805
8059.5
10.0
1
Illa
m334
309
3408
11.0
56
55
585
10.6
82.5
80
625
7.8
1472.5
444
4618
10.4
0
Ter
hat
hum
970
598
5023
8.4
44
39
309
7.9
503
231
1548
6.7
04
212
6.0
02
1.5
96.0
01523
871.5
6901
7.9
2
Dhan
kuta
725
500
3090
6.2
190
170
790
4.6
231
125
540
4.3
213
12
80
6.6
71159
807
4500
5.5
8
Bhojp
ur
708
375
3285
8.8
106
90
540
6.0
365
210
1255
5.9
87
660
10.0
010
945
5.0
01196
690
5185
7.5
1
Khota
ng
750
450
4500
10.0
150
100
900
9.0
550
250
1875
7.5
0200
175
1400
8.0
0150
100
800
8.0
01800
1075
9475
8.8
1
Okhal
dhunga
299
145
789
5.4
20
852
6.5
335
35
234
6.6
922
520
4.0
0379
193
1095
5.6
7
Uday
apur
439
245
3062.5
12.5
72
63
725
11.5
190
98
931
9.5
025
15
170
11.3
315
13
148
11.3
8741
434
5036.5
11.6
0
Jhap
a53
45
247
5.5
053
45
247
5.4
9
Mora
ng
120
75
225
3.0
030
20
76
3.8
0150
95
301
3.1
7
Sap
tari
65
35.5
7.1
06
535.5
7.1
0
Tota
l5712
3772
33328.5
8.8
704
568
4165
7.3
3037
1564.5
10167
6.5
0293
252
1973
7.8
3263
174.5
1272
7.2
910009
6331
50905.5
8.0
4
Cen
tral
Reg
ion
Dola
kha
277
258
2074.3
8.0
33
27
217.3
8.0
27
23
138
6.0
012
11
110.3
10.0
310
990
10.0
0359
328
2629.9
8.0
2
Sin
dhupal
chock
215
150
1455
9.7
30
29
293
10.1
57
34
282
8.2
943
43
357
8.3
043
43
224
5.2
1388
299
2611
8.7
3
Ras
huw
a35
28
224
8.0
65
40
8.0
34
25
125
5.0
03
321
7.0
06
660
10.0
084
67
470
7.0
1
Ram
echhap
200
150
1447.5
9.7
890
735
9294.7
12.6
86
52
299
5.7
531
22
226.6
10.3
09
6.5
67.1
10.3
21216
965.5
11334.9
11.7
4
Sin
dhuli
262
170
1904
11.2
1110
623
7127
11.4
81
48
360
7.5
01453
841
9391
11.1
7
Kav
repal
anch
ock
1257.3
913.3
11057.4
12.1
56
31.2
312.2
10.0
123
110
990
9.0
015
10.3
149
14.4
71451.3
1064.8
12508.6
11.7
5
Bhak
tapur
23
18
189
10.5
54
40.8
10.2
10
757.4
8.2
01.5
15.4
5.4
01
16
6.0
040.5
31
298.6
9.6
3
Lal
itpur
90.3
81.2
852.6
10.5
12.6
10.6
111.3
10.5
23.4
21.4
224.7
10.5
01.2
0.4
410.0
01.5
0.5
5.2
10.4
0129
114.1
1197.8
10.5
0
Kat
hm
andu
190
130
1266
9.7
18
15
173
11.5
82
69
532
7.7
110
10
66
6.6
013
826
3.2
5313
232
2063
8.8
9
Nuw
akot
205
140
1582
11.3
22
19
199.5
10.5
85
49
401.8
8.2
030
25
295
11.8
0342
233
2478.3
10.6
4
Dhad
hin
g509
305
3050
10.0
28
27
256.5
9.5
100
95
855
9.0
043
42
441
10.5
0680
469
4602.5
9.8
1
Mak
awan
pur
90
57
513
9.0
75
55
11.0
190
27
243
9.0
06
644
7.3
313
11
88
8.0
0306
106
943
8.9
0
Chit
wan
235
202
1870
9.3
24
15
120
8.0
04
428
7.0
0263
221
2018
9.1
3
Bar
a5
429
7.2
55
429
7.2
5
Tota
l3588.6
2602.5
27484.8
10.6
2217.6
1530.8
18120.3
11.8
922.4
575.4
4627.9
8.0
4141.7
125.4
1157.3
9.2
3154.5
137.3
1156.3
8.4
27024.8
4971.4
52546.6
10
.57
Wes
tern
Reg
ion
Gork
ha
988
878
7821
8.9
35
32
187
5.8
75
69
478
6.9
38
749
7.0
015
12
92
7.6
71121
998
8627
8.6
4
Lam
jung
850
625
5125
8.2
85
67
553
8.3
90
55
382
6.9
590
80
680
8.5
0111
99
743
7.5
11226
926
7483
8.0
8
TA
BL
E 6.2
Lem
on
Oth
ers
Gra
nd
Tota
l
PR
OD
UC
TIV
E A
RE
A A
ND
PR
OD
UC
TIO
N O
F C
ITR
US
FR
UIT
S, 2013/2
014
Are
a :
Ha.
,Pro
d :
Mt.
Dis
tric
t
Man
dari
nS
wee
t O
ran
ge
Lim
e
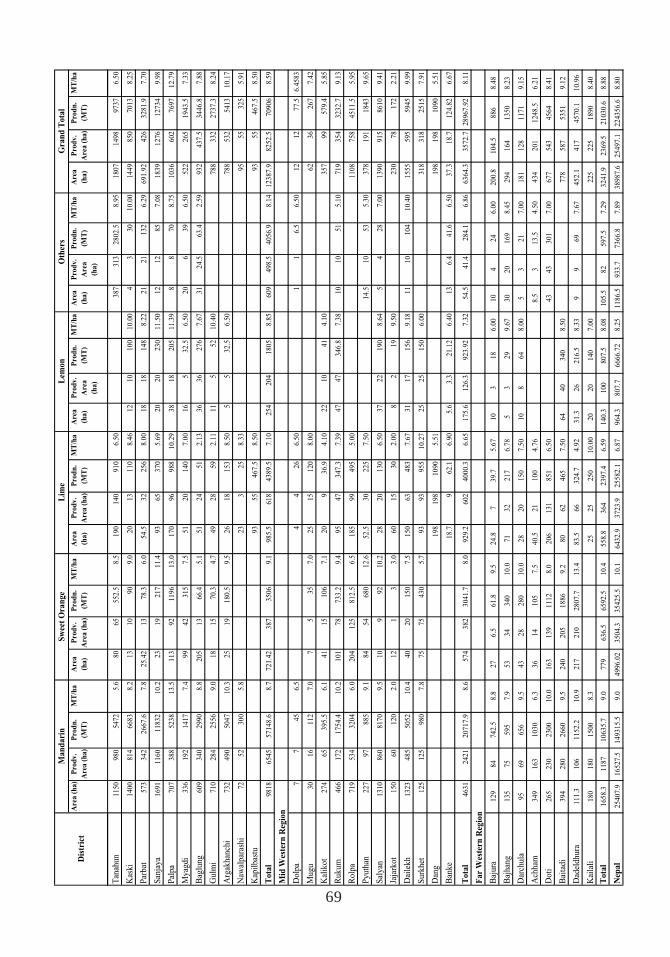
69
Are
a (
ha)
Pro
dv.
Are
a (
ha)
Pro
dn
.
(MT
)
MT
/ha
Are
a
(ha)
Pro
dv.
Are
a (
ha)
Pro
dn
.
(MT
)
MT
/ha
Are
a
(ha)
Pro
dv.
Are
a (
ha)
Pro
dn
.
(MT
)
MT
/ha
Are
a
(ha)
Pro
dv.
Are
a
(ha)
Pro
dn
.
(MT
)
MT
/ha
Are
a
(ha)
Pro
dv.
Are
a
(ha)
Pro
dn
.
(MT
)
MT
/ha
Are
a
(ha)
Pro
dv.
Are
a (
ha)
Pro
dn
.
(MT
)
MT
/ha
Lem
on
Oth
ers
Gra
nd
To
tal
Dis
tric
t
Ma
nd
ari
nS
wee
t O
ran
ge
Lim
e
Tan
ahu
n1150
980
5472
5.6
80
65
552.5
8.5
190
140
910
6.5
0387
313
2802.5
8.9
51807
1498
9737
6.5
0
Kas
ki
1400
814
6683
8.2
13
10
90
9.0
20
13
110
8.4
612
10
100
10.0
04
330
10.0
01449
850
7013
8.2
5
Par
bat
573
342
2667.6
7.8
25.4
213
78.3
6.0
54.5
32
256
8.0
018
18
148
8.2
221
21
132
6.2
9691.9
2426
3281.9
7.7
0
San
jay
a1691
1160
11832
10.2
23
19
217
11.4
93
65
370
5.6
920
20
230
11.5
012
12
85
7.0
81839
1276
12734
9.9
8
Pal
pa
707
388
5238
13.5
113
92
1196
13.0
170
96
988
10.2
938
18
205
11.3
98
870
8.7
51036
602
7697
12.7
9
My
agd
i336
192
1417
7.4
99
42
315
7.5
51
20
140
7.0
016
532.5
6.5
020
639
6.5
0522
265
1943.5
7.3
3
Bag
lun
g609
340
2990
8.8
205
13
66.4
5.1
51
24
51
2.1
336
36
276
7.6
731
24.5
63.4
2.5
9932
437.5
3446.8
7.8
8
Gu
lmi
710
284
2556
9.0
18
15
70.3
4.7
49
28
59
2.1
111
552
10.4
0788
332
2737.3
8.2
4
Arg
akh
anch
i732
490
5047
10.3
25
19
180.5
9.5
26
18
153
8.5
05
532.5
6.5
0788
532
5413
10.1
7
Naw
alp
aras
hi
72
52
300
5.8
23
325
8.3
395
55
325
5.9
1
Kap
ilb
astu
93
55
467.5
8.5
093
55
467.5
8.5
0
To
tal
9818
6545
57148.6
8.7
721.4
2387
3506
9.1
985.5
618
4389.5
7.1
0254
204
1805
8.8
5609
498.5
4056.9
8.1
412387.9
8252.5
70906
8.5
9
Mid
Wes
tern
Reg
ion
Do
lpa
77
45
6.5
44
26
6.5
01
16.5
6.5
012
12
77.5
6.4
583
Mu
gu
30
16
112
7.0
75
35
7.0
25
15
120
8.0
062
36
267
7.4
2
Kal
iko
t274
65
395.5
6.1
41
15
106
7.1
20
936.9
4.1
022
10
41
4.1
0357
99
579.4
5.8
5
Ru
ku
m466
172
1754.4
10.2
101
78
733.2
9.4
95
47
347.3
7.3
947
47
346.8
7.3
810
10
51
5.1
0719
354
3232.7
9.1
3
Ro
lpa
719
534
3204
6.0
204
125
812.5
6.5
185
99
495
5.0
01108
758
4511.5
5.9
5
Py
uth
an227
97
885
9.1
84
54
680
12.6
52.5
30
225
7.5
014.5
10
53
5.3
0378
191
1843
9.6
5
Sal
yan
1310
860
8170
9.5
10
992
10.2
28
20
130
6.5
037
22
190
8.6
45
428
7.0
01390
915
8610
9.4
1
Jaja
rko
t150
60
120
2.0
12
13
3.0
60
15
30
2.0
08
219
9.5
0230
78
172
2.2
1
Dai
lek
h1323
485
5052
10.4
40
20
150
7.5
150
63
483
7.6
731
17
156
9.1
811
10
104
10.4
01555
595
5945
9.9
9
Su
rkh
et125
125
980
7.8
75
75
430
5.7
93
93
955
10.2
725
25
150
6.0
0318
318
2515
7.9
1
Dan
g198
198
1090
5.5
1198
198
1090
5.5
1
Ban
ke
18.7
962.1
6.9
05.6
3.3
21.1
26.4
013
6.4
41.6
6.5
037.3
18.7
124.8
26.6
7
To
tal
4631
2421
20717.9
8.6
574
382
3041.7
8.0
929.2
602
4000.3
6.6
5175.6
126.3
923.9
27.3
254.5
41.4
284.1
6.8
66364.3
3572.7
28967.9
28.1
1
Fa
r W
este
rn R
egio
n
Baj
ura
129
84
742.5
8.8
27
6.5
61.8
9.5
24.8
739.7
5.6
710
318
6.0
010
424
6.0
0200.8
104.5
886
8.4
8
Baj
han
g135
75
595
7.9
53
34
340
10.0
71
32
217
6.7
85
329
9.6
730
20
169
8.4
5294
164
1350
8.2
3
Dar
chu
la95
69
656
9.5
43
28
280
10.0
28
20
150
7.5
010
864
8.0
05
321
7.0
0181
128
1171
9.1
5
Ach
ham
349
163
1030
6.3
36
14
105
7.5
40.5
21
100
4.7
68.5
313.5
4.5
0434
201
1248.5
6.2
1
Do
ti265
230
2300
10.0
163
139
1112
8.0
206
131
851
6.5
043
43
301
7.0
0677
543
4564
8.4
1
Bai
tad
i394
280
2660
9.5
240
205
1886
9.2
80
62
465
7.5
064
40
340
8.5
0778
587
5351
9.1
2
Dad
eld
hu
ra111.3
106
1152.2
10.9
217
210
2807.7
13.4
83.5
66
324.7
4.9
231.3
26
216.5
8.3
39
969
7.6
7452.1
417
4570.1
10.9
6
Kai
lali
180
180
1500
8.3
25
25
250
10.0
020
20
140
7.0
0225
225
1890
8.4
0
To
tal
1658.3
1187
10635.7
9.0
779
636.5
6592.5
10.4
558.8
364
2397.4
6.5
9140.3
100
807.5
8.0
8105.5
82
597.5
7.2
93241.9
2369.5
21030.6
8.8
8
Nep
al
25407.9
16527.5
149315.5
9.0
4996.0
23504.3
35425.5
10.1
6432.9
3723.9
25582.1
6.8
7964.3
807.7
6666.7
28.2
51186.5
933.7
7366.8
7.8
938987.6
25497.1
224356.6
8.8
0
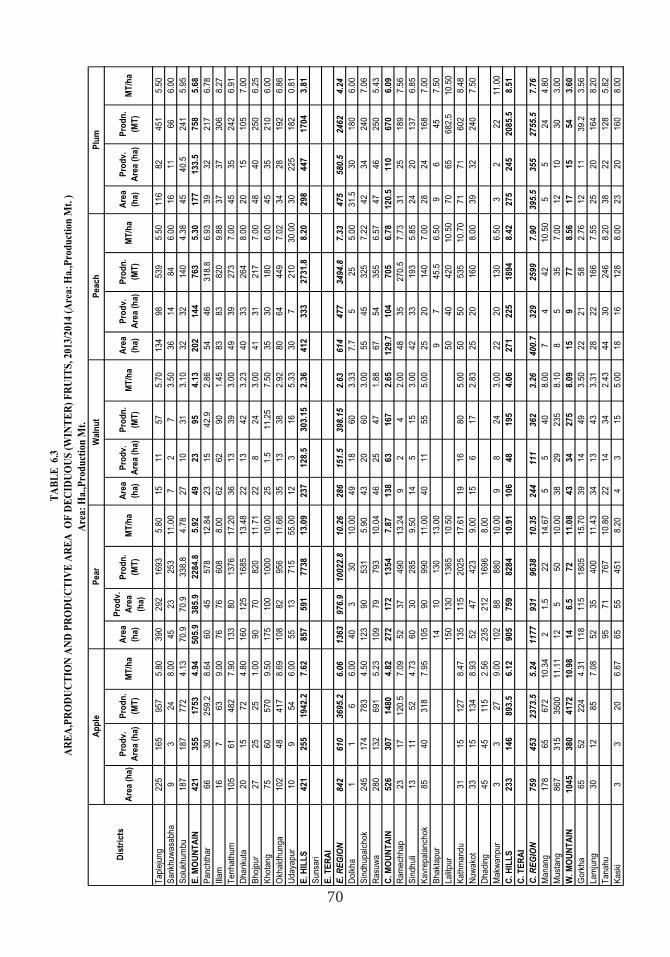
70
Are
a (h
a)Pr
odv.
A
rea
(ha)
Prod
n.
(MT)
MT/
haA
rea
(ha)
Prod
v.
Are
a (h
a)
Prod
n.
(MT)
MT/
haA
rea
(ha)
Prod
v.
Are
a (h
a)Pr
odn.
(M
T)M
T/ha
Are
a (h
a)Pr
odv.
A
rea
(ha)
Prod
n.
(MT)
MT/
haA
rea
(ha)
Prod
v.
Are
a (h
a)Pr
odn.
(M
T)M
T/ha
Tapl
ejun
g22
516
595
75.
8039
029
216
935.
8015
1157
5.70
134
9853
95.
5011
682
451
5.50
San
khuw
asab
ha9
324
8.00
4523
253
11.0
07
27
3.50
3614
846.
0016
1166
6.00
Sol
ukhu
mbu
187
187
772
4.13
70.9
70.9
338.
84.
7827
1031
3.10
3232
140
4.38
4540
.524
15.
95E.
MO
UN
TAIN
421
355
1753
4.94
505.
938
5.9
2284
.85.
9249
2395
4.13
202
144
763
5.30
177
133.
575
85.
68P
anch
thar
6630
259.
28.
6460
4557
812
.84
2315
42.9
2.86
5446
318.
86.
9339
3221
76.
78Ill
am16
763
9.00
7676
608
8.00
6262
901.
4583
8382
09.
8837
3730
68.
27Te
rrha
thum
105
6148
27.
9013
380
1376
17.2
036
1339
3.00
4939
273
7.00
4535
242
6.91
Dha
nkut
a20
1572
4.80
160
125
1685
13.4
822
1342
3.23
4033
264
8.00
2015
105
7.00
Bho
jpur
2725
251.
0090
7082
011
.71
228
243.
0041
3121
77.
0048
4025
06.
25K
hota
ng75
6057
09.
5017
510
010
0010
.00
251.
511
.25
7.50
3530
180
6.00
4535
210
6.00
Okh
aldh
unga
102
4841
78.
6910
882
956
11.6
635
1338
2.92
8064
449
7.02
3428
192
6.86
Uda
yapu
r10
954
6.00
5513
715
55.0
012
316
5.33
307
210
30.0
030
225
182
0.81
E. H
ILLS
421
255
1942
.27.
6285
759
177
3813
.09
237
128.
530
3.15
2.36
412
333
2731
.88.
2029
844
717
043.
81S
unsa
riE.
TER
AI
E. R
EGIO
N84
261
036
95.2
6.06
1363
976.
910
022.
810
.26
286
151.
539
8.15
2.63
614
477
3494
.87.
3347
558
0.5
2462
4.24
Dol
kha
11
66.
0040
330
10.0
049
1860
3.33
7.7
525
5.00
31.5
3018
06.
00S
indh
upal
chok
245
174
783
4.50
123
9053
15.
9043
2060
3.00
5545
325
7.22
4234
240
7.06
Ras
uwa
280
132
691
5.23
109
7979
310
.04
4625
471.
8867
5435
56.
5747
4625
05.
43C
. MO
UN
TAIN
526
307
1480
4.82
272
172
1354
7.87
138
6316
72.
6512
9.7
104
705
6.78
120.
511
067
06.
09R
amec
hhap
2317
120.
57.
0952
3749
013
.24
92
42.
0048
3527
0.5
7.73
3125
189
7.56
Sin
dhul
i13
1152
4.73
6030
285
9.50
145
153.
0042
3319
35.
8524
2013
76.
85K
avre
pala
ncho
k85
4031
87.
9510
590
990
11.0
040
1155
5.00
2520
140
7.00
2824
168
7.00
Bha
ktap
ur14
1013
013
.00
97
45.5
6.50
96
457.
50La
litpu
r15
013
013
6510
.50
5040
420
10.5
070
6568
2.5
10.5
0K
athm
andu
3115
127
8.47
135
115
2025
17.6
119
1680
5.00
5050
535
10.7
071
7160
28.
48N
uwak
ot33
1513
48.
9352
4742
39.
0015
617
2.83
2520
160
8.00
3932
240
7.50
Dha
ding
4545
115
2.56
235
212
1696
8.00
Mak
wan
pur
33
279.
0010
288
880
10.0
09
824
3.00
2220
130
6.50
32
2211
.00
C. H
ILLS
233
146
893.
56.
1290
575
982
8410
.91
106
4819
54.
0627
122
518
948.
4227
524
520
85.5
8.51
C. T
ERA
IC
. REG
ION
759
453
2373
.55.
2411
7793
196
3810
.35
244
111
362
3.26
400.
732
925
997.
9039
5.5
355
2755
.57.
76M
anan
g17
865
672
10.3
42
1.5
2214
.67
55
408.
007
442
10.5
05
524
4.80
Mus
tang
867
315
3500
11.1
112
550
10.0
038
2923
58.
108
535
7.00
1210
303.
00W
. MO
UN
TAIN
1045
380
4172
10.9
814
6.5
7211
.08
4334
275
8.09
159
778.
5617
1554
3.60
Gor
kha
6552
224
4.31
118
115
1805
15.7
039
1449
3.50
2221
582.
7612
1139
.23.
56La
mju
ng30
1285
7.08
5235
400
11.4
334
1343
3.31
2822
166
7.55
2520
164
8.20
Tana
hu95
7176
710
.80
2214
342.
4344
3024
68.
2038
2212
85.
82K
aski
33
206.
6765
5545
18.
204
315
5.00
1816
128
8.00
2320
160
8.00
Plum
TA
BL
E 6
.3
AR
EA
,PR
OD
UC
TIO
N A
ND
PR
OD
UC
TIV
E A
RE
A O
F D
EC
IDU
OU
S (
WIN
TE
R)
FR
UIT
S, 2
013/
2014
(A
rea:
Ha.
,Pro
du
ctio
n M
t. )
App
le
Dis
tric
ts
Peac
hW
alnu
tPe
ar
Are
a: H
a.,P
rod
uct
ion
Mt.
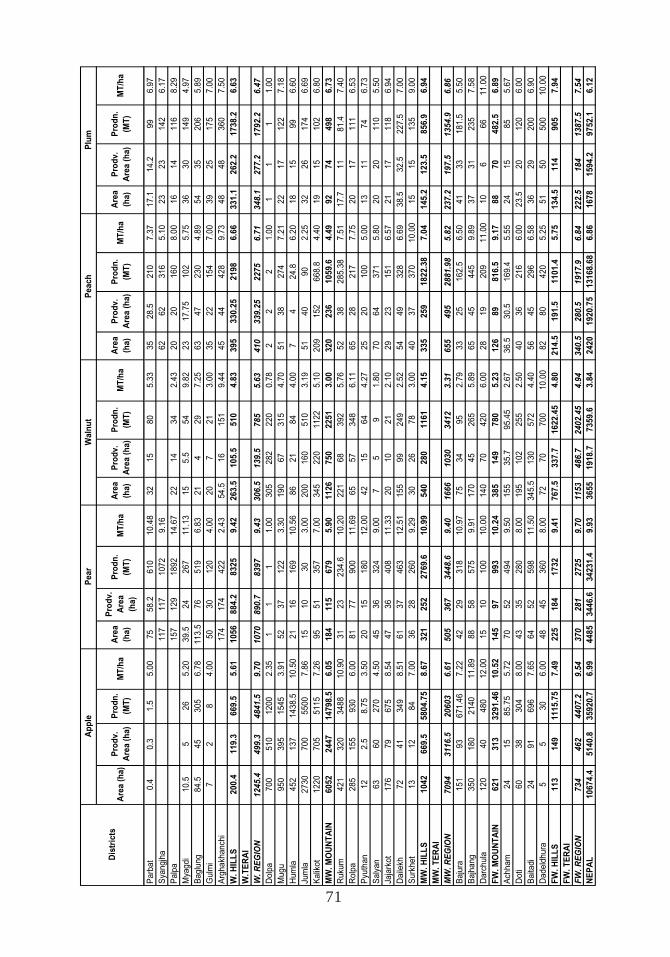
71
Are
a (h
a)P
rodv
. A
rea
(ha)
Pro
dn.
(MT)
MT/
haA
rea
(ha)
Pro
dv.
Are
a (h
a)
Pro
dn.
(MT)
MT/
haA
rea
(ha)
Pro
dv.
Are
a (h
a)P
rodn
. (M
T)M
T/ha
Are
a (h
a)P
rodv
. A
rea
(ha)
Pro
dn.
(MT)
MT/
haA
rea
(ha)
Pro
dv.
Are
a (h
a)P
rodn
. (M
T)M
T/ha
Plu
mA
pple
Dis
tric
ts
Pea
chW
alnu
tP
ear
Par
bat
0.4
0.3
1.5
5.00
7558
.261
010
.48
3215
805.
3335
28.5
210
7.37
17.1
14.2
996.
97S
yang
jha
117
117
1072
9.16
6262
316
5.10
2323
142
6.17
Pal
pa15
712
918
9214
.67
2214
342.
4320
2016
08.
0016
1411
68.
29M
yagd
i10
.55
265.
2039
.524
267
11.1
315
5.5
549.
8223
17.7
510
25.
7536
3014
94.
97B
aglu
ng84
.545
305
6.78
113.
576
519
6.83
214
297.
2563
4723
04.
8954
3520
65.
89G
ulm
i7
28
4.00
5030
120
4.00
207
213.
0035
2215
47.
0039
2517
57.
00A
rgha
khan
chi
174
174
422
2.43
54.5
1615
19.
4445
4442
89.
7348
4836
07.
50W
. HIL
LS20
0.4
119.
366
9.5
5.61
1056
884.
283
259.
4226
3.5
105.
551
04.
8339
533
0.25
2198
6.66
331.
126
2.2
1738
.26.
63W
.TE
RA
IW
. RE
GIO
N12
45.4
499.
348
41.5
9.70
1070
890.
783
979.
4330
6.5
139.
578
55.
6341
033
9.25
2275
6.71
348.
127
7.2
1792
.26.
47D
olpa
700
510
1200
2.35
11
11.
0030
528
222
00.
782
22
1.00
11
11.
00M
ugu
950
395
1545
3.91
5237
122
3.30
190
6731
54.
7051
3827
47.
2122
1712
27.
18H
umla
452
137
1438
.510
.50
2116
169
10.5
686
2184
4.00
74
24.8
6.20
1815
996.
60Ju
mla
2730
700
5500
7.86
1510
303.
0020
016
051
03.
1951
4090
2.25
3226
174
6.69
Kal
ikot
1220
705
5115
7.26
9551
357
7.00
345
220
1122
5.10
209
152
668.
84.
4019
1510
26.
80M
W. M
OU
NTA
IN60
5224
4714
798.
56.
0518
411
567
95.
9011
2675
022
513.
0032
023
610
59.6
4.49
9274
498
6.73
Ruk
um42
132
034
8810
.90
3123
234.
610
.20
221
6839
25.
7652
3828
5.38
7.51
17.7
1181
.47.
40R
olpa
285
155
930
6.00
8177
900
11.6
965
5734
86.
1165
2821
77.
7520
1711
16.
53P
yuth
an12
2.5
8.75
3.50
2015
180
12.0
042
1564
4.27
2520
100
5.00
1311
746.
73S
alya
n63
6027
04.
5045
3632
49.
007
59
1.80
7064
371
5.80
2020
110
5.50
Jaja
rkot
176
7967
58.
5447
3640
811
.33
2010
212.
1029
2315
16.
5721
1711
86.
94D
aile
kh72
4134
98.
5161
3746
312
.51
155
9924
92.
5254
4932
86.
6938
.532
.522
7.5
7.00
Sur
khet
1312
847.
0036
2826
09.
2930
2678
3.00
4037
370
10.0
015
1513
59.
00M
W. H
ILLS
1042
669.
558
04.7
58.
6732
125
227
69.6
10.9
954
028
011
614.
1533
525
918
22.3
87.
0414
5.2
123.
585
6.9
6.94
MW
. TE
RA
IM
W. R
EG
ION
7094
3116
.520
603
6.61
505
367
3448
.69.
4016
6610
3034
123.
3165
549
528
81.9
85.
8223
7.2
197.
513
54.9
6.86
Baj
ura
151
9367
1.46
7.22
4229
318
10.9
775
3495
2.79
3325
162.
56.
5041
3318
1.5
5.50
Baj
hang
350
180
2140
11.8
988
5857
59.
9117
045
265
5.89
6545
445
9.89
3731
235
7.58
Dar
chul
a12
040
480
12.0
015
1010
010
.00
140
7042
06.
0028
1920
911
.00
106
6611
.00
FW. M
OU
NTA
IN62
131
332
91.4
610
.52
145
9799
310
.24
385
149
780
5.23
126
8981
6.5
9.17
8870
482.
56.
89A
chha
m24
1585
.75
5.72
7052
494
9.50
155
35.7
95.4
52.
6736
.530
.516
9.4
5.55
2415
855.
67D
oti
6038
304
8.00
4335
280
8.00
195
102
255
2.50
4036
216
6.00
23.5
2012
06.
00B
aita
di24
9169
67.
6564
5259
811
.50
345.
513
057
24.
4056
4529
66.
5836
2920
06.
90D
adel
dhur
a5
530
6.00
4845
360
8.00
7270
700
10.0
082
8042
05.
2551
5050
010
.00
FW. H
ILLS
113
149
1115
.75
7.49
225
184
1732
9.41
767.
533
7.7
1622
.45
4.80
214.
519
1.5
1101
.45.
7513
4.5
114
905
7.94
FW. T
ER
AI
FW. R
EG
ION
734
462
4407
.29.
5437
028
127
259.
7011
5348
6.7
2402
.45
4.94
340.
528
0.5
1917
.96.
8422
2.5
184
1387
.57.
54N
EP
AL
1067
4.4
5140
.835
920.
76.
9944
8534
46.6
3423
1.4
9.93
3655
1918
.773
59.6
3.84
2420
1920
.75
1316
8.68
6.86
1678
1594
.297
52.1
6.12
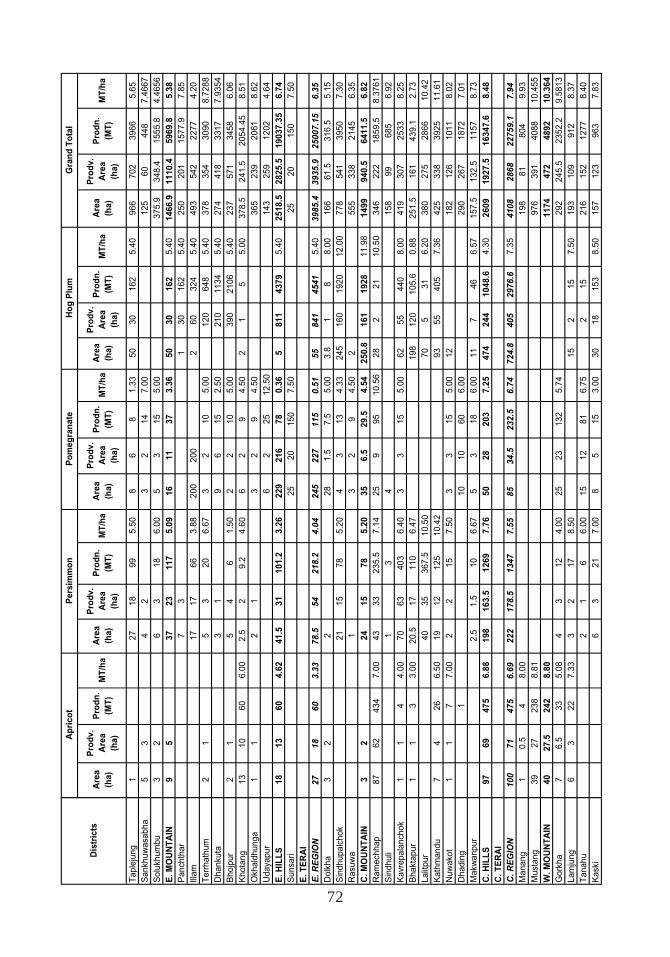
72
Tapl
ejun
gS
ankh
uwas
abha
Sol
ukhu
mbu
E. M
OU
NTA
INP
anch
thar
Illam
Terr
hath
umD
hank
uta
Bho
jpur
Kho
tang
Okh
aldh
unga
Uda
yapu
rE
. HIL
LSS
unsa
riE
. TE
RA
IE
. RE
GIO
ND
olkh
aS
indh
upal
chok
Ras
uwa
C. M
OU
NTA
INR
amec
hhap
Sin
dhul
iK
avre
pala
ncho
kB
hakt
apur
Lalit
pur
Kat
hman
duN
uwak
otD
hadi
ngM
akw
anpu
rC
. HIL
LSC
. TE
RA
IC
. RE
GIO
NM
anan
gM
usta
ngW
. MO
UN
TAIN
Gor
kha
Lam
jung
Tana
huK
aski
Dis
tric
tsA
rea
(ha)
Pro
dv.
Are
a (h
a)
Pro
dn.
(MT)
MT/
haA
rea
(ha)
Pro
dv.
Are
a (h
a)
Pro
dn.
(MT)
MT/
haA
rea
(ha)
Pro
dv.
Are
a (h
a)
Pro
dn.
(MT)
MT/
haA
rea
(ha)
Pro
dv.
Are
a (h
a)
Pro
dn.
(MT)
MT/
haA
rea
(ha)
Pro
dv.
Are
a (h
a)
Pro
dn.
(MT)
MT/
ha
127
1899
5.50
86
81.
3350
3016
25.
4096
670
239
665.
655
34
23
214
7.00
125
6044
87.
4667
32
63
186.
005
315
5.00
375.
934
8.4
1555
.84.
4656
95
3723
117
5.09
1611
373.
3650
3016
25.
4014
66.9
1110
.459
69.8
5.38
73
130
162
5.40
250
201
1577
.97.
8517
1766
3.88
200
200
260
324
5.40
493
542
2277
4.20
21
53
206.
673
210
5.00
120
648
5.40
378
354
3090
8.72
883
19
615
2.50
210
1134
5.40
274
418
3317
7.93
542
15
46
1.50
22
105.
0039
021
065.
4023
757
134
586.
0613
1060
6.00
2.5
29.
24.
606
29
4.50
21
55.
0037
8.5
241.
520
54.4
58.
511
12
13
29
4.50
365
239
2061
8.62
62
2512
.50
143
259
1202
4.64
1813
604.
6241
.531
101.
23.
2622
921
678
0.36
581
143
795.
4025
18.5
2825
.519
037.
356.
7425
2015
07.
5025
2015
07.
50
2718
603.
3378
.554
218.
24.
0424
522
711
50.
5155
841
4541
5.40
3985
.439
35.9
2500
7.15
6.35
32
228
1.5
7.5
5.00
3.8
18
8.00
166
61.5
316.
55.
1521
1578
5.20
43
134.
3324
516
019
2012
.00
778
541
3950
7.30
13
29
4.50
255
533
821
456.
353
224
1578
5.20
356.
529
.54.
5425
0.8
161
1928
11.9
814
9994
0.5
6411
.56.
8287
6243
47.
0043
3323
5.5
7.14
259
9510
.56
282
2110
.50
346
222
1859
.58.
3761
13
415
899
685
6.92
11
44.
0070
6340
36.
403
315
5.00
6255
440
8.00
419
307
2533
8.25
11
33.
0020
.517
110
6.47
198
120
105.
60.
8825
1.5
161
439.
12.
7340
3536
7.5
10.5
070
531
6.20
380
275
2866
10.4
27
426
6.50
1912
125
10.4
293
5540
57.
3642
533
839
2511
.61
11
77.
002
215
7.50
33
155.
0012
182
126
1011
8.02
110
1060
6.00
290
267
1872
7.01
2.5
1.5
106.
675
318
6.00
117
466.
5715
7.5
132.
511
578.
7397
6947
56.
8819
816
3.5
1269
7.76
5028
203
7.25
474
244
1048
.64.
3026
0919
27.5
1634
7.6
8.48
100
7147
56.
6922
217
8.5
1347
7.55
8534
.523
2.5
6.74
724.
840
529
76.6
7.35
4108
2868
2275
9.1
7.94
10.
54
8.00
198
8180
49.
9339
2723
88.
8197
639
140
8810
.455
4027
.524
28.
8011
7447
248
9210
.364
76.
533
5.08
43
124.
0025
2313
25.
7429
224
5.5
2352
.29.
5813
63
227.
333
217
8.50
152
157.
5019
310
991
28.
372
16
6.00
1512
816.
752
1521
615
212
778.
406
321
7.00
85
153.
0030
1815
38.
5015
712
396
37.
83
Per
sim
mon
Apr
icot
Hog
Plu
mG
rand
Tot
alP
omeg
rana
te
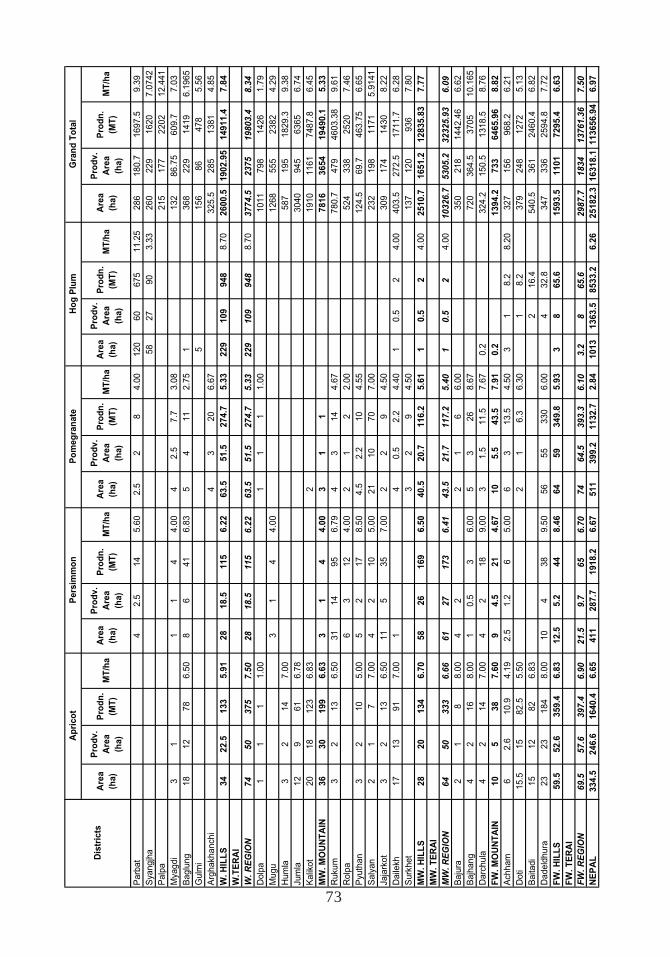
73
Dis
tric
ts
Par
bat
Sya
ngjh
aP
alpa
Mya
gdi
Bag
lung
Gul
mi
Arg
hakh
anch
iW
. HIL
LSW
.TE
RA
IW
. RE
GIO
ND
olpa
Mug
uH
umla
Jum
laK
alik
otM
W. M
OU
NTA
INR
ukum
Rol
paP
yuth
anS
alya
nJa
jark
otD
aile
khS
urkh
etM
W. H
ILLS
MW
. TE
RA
IM
W. R
EG
ION
Baj
ura
Baj
hang
Dar
chul
aFW
. MO
UN
TAIN
Ach
ham
Dot
iB
aita
diD
adel
dhur
aFW
. HIL
LSFW
. TE
RA
IFW
. RE
GIO
NN
EP
AL
Are
a (h
a)
Pro
dv.
Are
a (h
a)
Pro
dn.
(MT)
MT/
haA
rea
(ha)
Pro
dv.
Are
a (h
a)
Pro
dn.
(MT)
MT/
haA
rea
(ha)
Pro
dv.
Are
a (h
a)
Pro
dn.
(MT)
MT/
haA
rea
(ha)
Pro
dv.
Are
a (h
a)
Pro
dn.
(MT)
MT/
haA
rea
(ha)
Pro
dv.
Are
a (h
a)
Pro
dn.
(MT)
MT/
ha
Per
sim
mon
Apr
icot
Hog
Plu
mG
rand
Tot
alP
omeg
rana
te
42.
514
5.60
2.5
28
4.00
120
6067
511
.25
286
180.
716
97.5
9.39
5827
903.
3326
022
916
207.
0742
215
177
2202
12.4
413
11
14
4.00
42.
57.
73.
0813
286
.75
609.
77.
0318
1278
6.50
86
416.
835
411
2.75
136
822
914
196.
1965
515
686
478
5.56
43
206.
6732
5.5
285
1381
4.85
3422
.513
35.
9128
18.5
115
6.22
63.5
51.5
274.
75.
3322
910
994
88.
7026
00.5
1902
.95
1491
1.4
7.84
7450
375
7.50
2818
.511
56.
2263
.551
.527
4.7
5.33
229
109
948
8.70
3774
.523
7519
803.
48.
341
11
1.00
11
11.
0010
1179
814
261.
793
14
4.00
1268
555
2382
4.29
32
147.
0058
719
518
29.3
9.38
129
616.
7830
4094
563
656.
7420
1812
36.
832
1910
1161
7487
.86.
4536
3019
96.
633
14
4.00
31
178
1636
5419
490.
15.
333
213
6.50
3114
956.
794
314
4.67
780.
747
946
03.3
89.
616
312
4.00
21
22.
0052
433
825
207.
463
210
5.00
52
178.
504.
52.
210
4.55
124.
569
.746
3.75
6.65
21
77.
004
210
5.00
2110
707.
0023
219
811
715.
9141
32
136.
5011
535
7.00
22
94.
5030
917
414
308.
2217
1391
7.00
14
0.5
2.2
4.40
10.
52
4.00
403.
527
2.5
1711
.76.
283
29
4.50
137
120
936
7.80
2820
134
6.70
5826
169
6.50
40.5
20.7
116.
25.
611
0.5
24.
0025
10.7
1651
.212
835.
837.
77
6450
333
6.66
6127
173
6.41
43.5
21.7
117.
25.
401
0.5
24.
0010
326.
753
05.2
3232
5.93
6.09
21
88.
004
22
16
6.00
350
218
1442
.46
6.62
42
168.
001
0.5
36.
005
326
8.67
720
364.
537
0510
.165
42
147.
004
218
9.00
31.
511
.57.
670.
232
4.2
150.
513
18.5
8.76
105
387.
609
4.5
214.
6710
5.5
43.5
7.91
0.2
1394
.273
364
65.9
68.
826
2.6
10.9
4.19
2.5
1.2
65.
006
313
.54.
503
18.
28.
2032
715
696
8.2
6.21
15.5
1582
.55.
502
16.
36.
301
8.2
379
248
1272
5.13
1512
826.
832
16.4
540.
536
124
60.4
6.82
2323
184
8.00
104
389.
5056
5533
06.
004
32.8
347
336
2594
.87.
7259
.552
.635
9.4
6.83
12.5
5.2
448.
4664
5934
9.8
5.93
38
65.6
1593
.511
0172
95.4
6.63
69.5
57.6
397.
46.
9021
.59.
765
6.70
7464
.539
3.3
6.10
3.2
865
.629
87.7
1834
1376
1.36
7.50
334.
524
6.6
1640
.46.
6541
128
7.7
1918
.26.
6751
139
9.2
1132
.72.
8410
1313
63.5
8533
.26.
2625
182.
316
318.
111
3656
.94
6.97
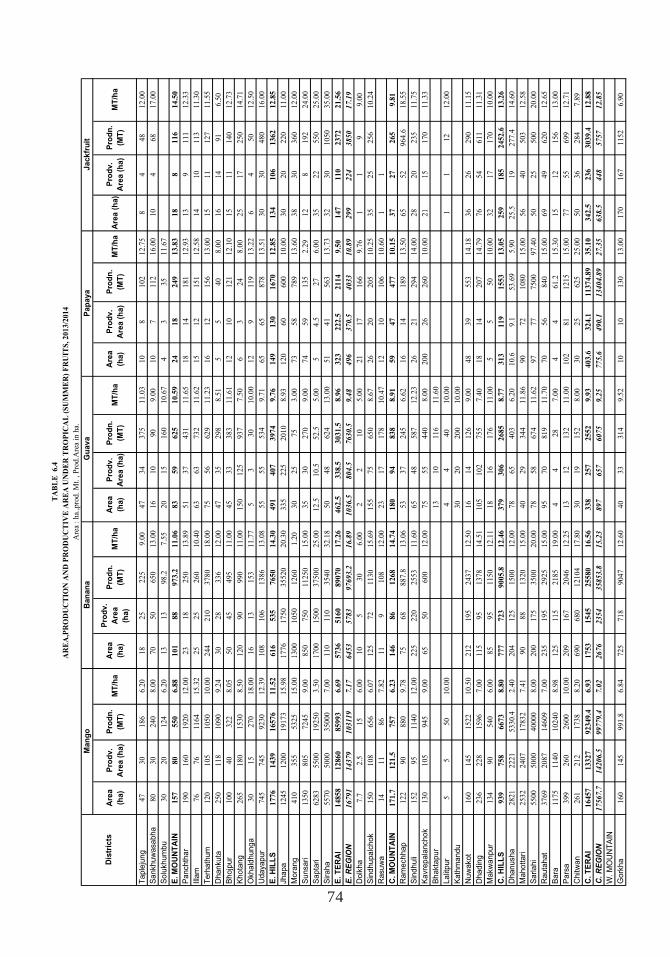
74
Are
a (h
a)P
rodv
. A
rea
(ha)
Pro
dn.
(MT)
MT/
haA
rea
(ha)
Pro
dv.
Are
a (h
a)
Pro
dn.
(MT)
MT/
haA
rea
(ha)
Pro
dv.
Are
a (h
a)P
rodn
. (M
T)M
T/ha
Are
a (h
a)P
rodv
. A
rea
(ha)
Pro
dn.
(MT)
MT/
haA
rea
(ha)
Pro
dv.
Are
a (h
a)P
rodn
. (M
T)M
T/ha
Tapl
ejun
g47
30
186
6.2
018
25
225
9.0
047
34
375
11.0
310
8102
12.7
58
448
12.0
0
San
khuw
asab
ha80
30
240
8.0
070
50
650
13.0
016
10
90
9.0
010
7112
16.0
010
468
17.0
0
Sol
ukhu
mbu
30
20
124
6.2
013
13
98.2
7.5
520
15
160
10.6
74
335
11.6
7
E. M
OU
NTA
IN157
80
550
6.8
8101
88
973.2
11.0
683
59
625
10.5
924
18
249
13.8
318
8116
14.5
0
Pan
chth
ar190
160
1920
12.0
023
18
250
13.8
951
37
431
11.6
518
14
181
12.9
313
9111
12.3
3
Illam
76
76
1164
15.3
225
25
260
10.4
063
63
732
11.6
215
12
151
12.5
814
10
113
11.3
0
Terh
athu
m120
105
1050
10.0
0244
210
3780
18.0
075
56
629
11.2
316
12
156
13.0
015
11
127
11.5
5
Dha
nkut
a250
118
1090
9.2
430
28
336
12.0
047
35
298
8.5
15
540
8.0
016
14
91
6.5
0
Bho
jpur
100
40
322
8.0
550
45
495
11.0
045
33
383
11.6
112
10
121
12.1
015
11
140
12.7
3
Kho
tang
265
180
1530
8.5
0120
90
990
11.0
0150
125
937
7.5
06
324
8.0
025
17
250
14.7
1
Okh
aldh
unga
30
15
270
18.0
016
13
153
11.7
75
330
10.0
012
9119
13.2
26
450
12.5
0
Uda
yapu
r745
745
9230
12.3
9108
106
1386
13.0
855
55
534
9.7
165
65
878
13.5
130
30
480
16.0
0
E. H
ILLS
1776
1439
16576
11.5
2616
535
7650
14.3
0491
407
3974
9.7
6149
130
1670
12.8
5134
106
1362
12.8
5
Jhap
a1245
1200
19173
15.9
81776
1750
35520
20.3
0335
225
2010
8.9
3120
60
600
10.0
030
20
220
11.0
0
Mor
ang
410
355
5325
15.0
01300
1050
1260
1.2
030
25
75
3.0
073
58
789
13.6
038
30
360
12.0
0
Sun
sari
1350
805
7245
9.0
0850
750
11250
15.0
035
30
270
9.0
074
59
135
2.2
912
8192
24.0
0
Sap
tari
6283
5500
19250
3.5
01700
1500
37500
25.0
012.5
10.5
52.5
5.0
05
4.5
27
6.0
035
22
550
25.0
0
Sira
ha5570
5000
35000
7.0
0110
110
3540
32.1
850
48
624
13.0
051
41
563
13.7
332
30
1050
35.0
0
E. T
ER
AI
14858
12860
85993
6.6
95736
5160
89070
17.2
6462.5
338.5
3031.5
8.9
6323
222.5
2114
9.5
0147
110
2372
21.5
6
E. R
EG
ION
16791
14379
103119
7.1
76453
5783
97693.2
16.8
91036.5
804.5
7630.5
9.4
8496
370.5
4033
10.8
9299
224
3850
17.1
9
Dol
kha
7.7
2.5
15
6.0
010
530
6.0
02
210
5.0
021
17
166
9.7
61
19
9.0
0
Sin
dhup
alch
ok150
108
656
6.0
7125
72
1130
15.6
9155
75
650
8.6
726
20
205
10.2
535
25
256
10.2
4
Ras
uwa
14
11
86
7.8
211
9108
12.0
023
17
178
10.4
712
10
106
10.6
01
1
C. M
OU
NTA
IN171.7
121.5
757
6.2
3146
86
1268
14.7
4180
94
838
8.9
159
47
477
10.1
537
27
265
9.8
1
Ram
echh
ap122
90
880
9.7
875
68
887.8
13.0
653
37
245
6.6
216
14
189
13.5
065
52
964.6
18.5
5
Sin
dhul
i152
95
1140
12.0
0225
220
2553
11.6
065
48
587
12.2
326
21
294
14.0
028
20
235
11.7
5
Kav
repa
lanc
hok
130
105
945
9.0
065
50
600
12.0
075
55
440
8.0
0200
26
260
10.0
021
15
170
11.3
3
Bha
ktap
ur13
10
116
11.6
0
Lalit
pur
55
50
10.0
04
440
10.0
01
112
12.0
0
Kat
hman
du30
20
200
10.0
0
Nuw
akot
160
145
1522
10.5
0212
195
2437
12.5
016
14
126
9.0
048
39
553
14.1
836
26
290
11.1
5
Dha
ding
236
228
1596
7.0
0115
95
1378
14.5
1105
102
755
7.4
018
14
207
14.7
976
54
611
11.3
1
Mak
wan
pur
134
90
540
6.0
085
95
1150
12.1
118
16
176
11.0
05
550
10.0
032
17
170
10.0
0
C. H
ILLS
939
758
6673
8.8
0777
723
9005.8
12.4
6379
306
2685
8.7
7313
119
1553
13.0
5259
185
2452.6
13.2
6
Dha
nush
a2821
2221
5330.4
2.4
0204
125
1500
12.0
078
65
403
6.2
010.6
9.1
53.6
95.9
025.5
19
277.4
14.6
0
Mah
otta
ri2532
2407
17832
7.4
190
88
1320
15.0
040
29
344
11.8
690
72
1080
15.0
056
40
503
12.5
8
Sar
lahi
5500
5000
40000
8.0
0200
175
3500
20.0
078
58
674
11.6
297
77
7500
97.4
050
25
500
20.0
0
Rau
taha
t3769
2087
14609
7.0
0235
195
2925
15.0
095
70
819
11.7
070
56
840
15.0
069
49
620
12.6
5
Bar
a1175
1140
10240
8.9
8125
115
2185
19.0
04
428
7.0
04
461.2
15.3
015
12
156
13.0
0
Par
sa399
260
2600
10.0
0209
167
2046
12.2
513
12
132
11.0
0102
81
1215
15.0
077
55
699
12.7
1
Chi
twan
261
212
1738
8.2
0690
680
12104
17.8
030
19
152
8.0
030
25
625
25.0
050
36
284
7.8
9
C. T
ER
AI
16457
13327
92349.4
6.9
31753
1545
25580
16.5
6338
257
2552
9.9
3403.6
324.1
11374.8
935.1
0342.5
236
3039.4
12.8
8
C. R
EG
ION
17567.7
14206.5
99779.4
7.0
22676
2354
35853.8
15.2
3897
657
6075
9.2
5775.6
490.1
13404.8
927.3
5638.5
448
5757
12.8
5
W. M
OU
NTA
ING
orkh
a160
145
991.8
6.8
4725
718
9047
12.6
040
33
314
9.5
210
10
130
13.0
0170
167
1152
6.9
0
Pap
aya
Jack
frui
t
TA
BL
E 6.4
AR
EA
,PR
OD
UC
TIO
N A
ND
PR
OD
UC
TIV
E A
RE
A U
ND
ER
TR
OP
ICA
L (
SU
MM
ER
) F
RU
ITS
, 2013/2
014
Man
goB
anan
aG
uava
Dis
tric
ts
Are
a :
ha.
,pro
d. M
t. , P
rod.A
rea
in h
a.
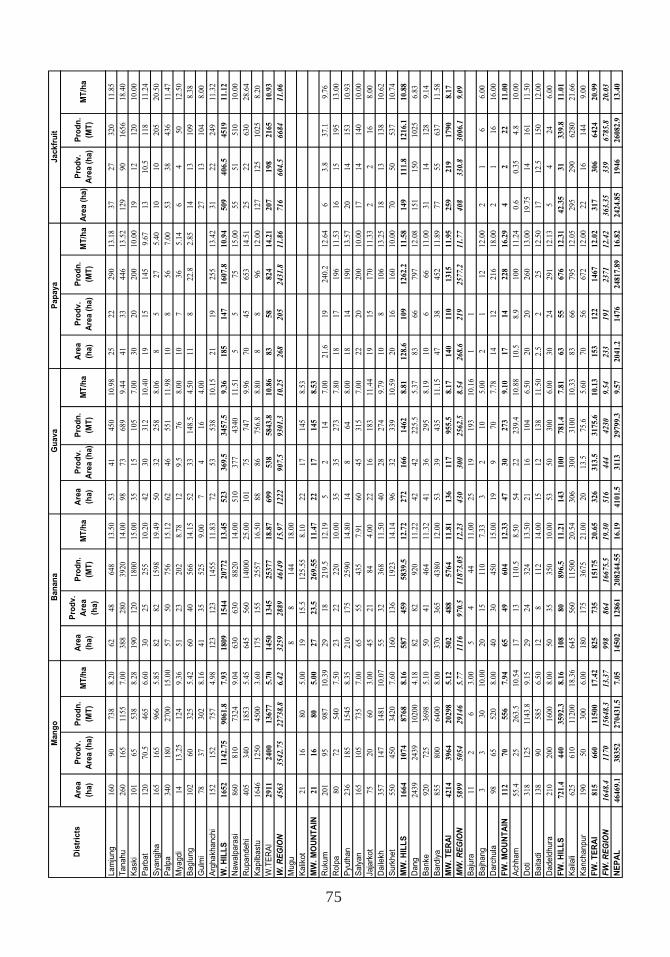
75
Are
a (h
a)P
rodv
. A
rea
(ha)
Pro
dn.
(MT)
MT/
haA
rea
(ha)
Pro
dv.
Are
a (h
a)
Pro
dn.
(MT)
MT/
haA
rea
(ha)
Pro
dv.
Are
a (h
a)P
rodn
. (M
T)M
T/ha
Are
a (h
a)P
rodv
. A
rea
(ha)
Pro
dn.
(MT)
MT/
haA
rea
(ha)
Pro
dv.
Are
a (h
a)P
rodn
. (M
T)M
T/ha
Pap
aya
Jack
frui
tM
ango
Ban
ana
Gua
va
Dis
tric
ts
Lam
jung
16
09
07
38
8.2
06
24
86
48
13
.50
53
41
45
01
0.9
82
52
22
90
13
.18
37
27
32
01
1.8
5
Tana
hu2
60
16
51
15
57
.00
38
82
80
39
20
14
.00
98
73
68
99
.44
41
33
44
61
3.5
21
29
90
16
56
18
.40
Kas
ki1
01
65
53
88
.28
19
01
20
18
00
15
.00
35
15
10
57
.00
30
20
20
01
0.0
01
91
21
20
10
.00
Par
bat
12
07
0.5
46
56
.60
30
25
25
51
0.2
04
23
03
12
10
.40
19
15
14
59
.67
13
10
.51
18
11
.24
Sya
ngjh
a1
65
16
59
66
5.8
58
28
21
59
81
9.4
95
03
22
58
8.0
68
52
75
.40
10
10
20
52
0.5
0
Pal
pa3
40
18
02
70
01
5.0
05
75
07
56
15
.12
62
46
55
11
1.9
81
08
56
7.0
05
33
84
36
11
.47
Mya
gdi
14
13
.25
12
49
.36
51
23
20
28
.78
12
9.5
76
8.0
01
07
36
5.1
46
45
01
2.5
0
Bag
lung
10
26
03
25
5.4
26
04
05
66
14
.15
52
33
14
8.5
4.5
01
18
22
.82
.85
14
13
10
98
.38
Gul
mi
78
37
30
28
.16
41
35
52
59
.00
74
16
4.0
02
71
31
04
8.0
0
Arg
hakh
anch
i1
52
15
27
57
4.9
81
23
12
31
45
51
1.8
37
25
35
38
10
.15
21
19
25
51
3.4
23
12
22
49
11
.32
W. H
ILLS
16
52
11
42
.75
90
61
.87
.93
18
09
15
44
20
77
21
3.4
55
23
36
9.5
34
57
.59
.36
18
51
47
16
07
.81
0.9
45
09
40
6.5
45
19
11
.12
Naw
alpa
rasi
86
08
10
73
24
9.0
46
30
63
08
82
01
4.0
05
10
37
74
34
01
1.5
15
57
51
5.0
05
55
15
10
10
.00
Rup
ande
hi4
05
34
01
85
35
.45
64
55
60
14
00
02
5.0
01
01
75
74
79
.96
70
45
65
31
4.5
12
52
26
30
28
.64
Kap
ilbas
tu1
64
61
25
04
50
03
.60
17
51
55
25
57
16
.50
88
86
75
6.8
8.8
08
89
61
2.0
01
27
12
51
02
58
.20
W.T
ER
AI
29
11
24
00
13
67
75
.70
14
50
13
45
25
37
71
8.8
76
99
53
85
84
3.8
10
.86
83
58
82
41
4.2
12
07
19
82
16
51
0.9
3
W. R
EG
ION
45
63
35
42
.75
22
73
8.8
6.4
23
25
92
88
94
61
49
15
.97
12
22
90
7.5
93
01
.31
0.2
52
68
20
52
43
1.8
11
.86
71
66
04
.56
68
41
1.0
6
Mug
u8
81
44
18
.00
Kal
ikot
21
16
80
5.0
01
91
5.5
12
5.5
58
.10
22
17
14
58
.53
MW
. MO
UN
TAIN
21
16
80
5.0
02
72
3.5
26
9.5
51
1.4
72
21
71
45
8.5
3
Ruk
um2
01
95
98
71
0.3
92
91
82
19
.51
2.1
95
21
47
.00
21
.61
92
40
.21
2.6
46
3.8
37
.19
.76
Rol
pa8
07
25
40
7.5
02
32
22
20
10
.00
35
35
27
37
.80
18
17
19
61
1.5
31
61
51
95
13
.00
Pyu
than
23
61
85
15
45
8.3
52
10
17
52
59
01
4.8
01
48
64
8.0
01
81
41
90
13
.57
20
14
15
31
0.9
3
Sal
yan
16
51
05
73
57
.00
65
55
43
57
.91
60
45
31
57
.00
22
20
20
01
0.0
01
71
41
40
10
.00
Jaja
rkot
75
20
60
3.0
04
52
18
44
.00
22
16
18
31
1.4
41
91
51
70
11
.33
22
16
8.0
0
Dai
lekh
35
71
47
14
81
10
.07
55
32
36
81
1.5
04
02
82
74
9.7
91
08
10
61
3.2
51
81
31
38
10
.62
Sur
khet
55
04
50
34
20
7.6
01
60
13
61
92
31
4.1
49
63
23
39
10
.59
20
16
16
01
0.0
07
05
05
37
10
.74
MW
. HIL
LS1
66
41
07
48
76
88
.16
58
74
59
58
39
.51
2.7
22
72
16
61
46
28
.81
12
8.6
10
91
26
2.2
11
.58
14
91
11
.81
21
6.1
10
.88
Dan
g2
43
92
43
91
02
00
4.1
88
28
29
20
11
.22
42
42
22
5.5
5.3
78
36
67
97
12
.08
15
11
50
10
25
6.8
3
Ban
ke9
20
72
53
69
85
.10
50
41
46
41
1.3
24
13
62
95
8.1
91
06
66
11
.00
31
14
12
89
.14
Bar
diya
85
58
00
64
00
8.0
03
70
36
54
38
01
2.0
05
33
94
35
11
.15
47
38
45
21
1.8
97
75
56
37
11
.58
MW
. TE
RA
I4
21
43
96
42
02
98
5.1
25
02
48
85
76
41
1.8
11
36
11
79
55
.58
.17
14
01
10
13
15
11
.95
25
92
19
17
90
8.1
7
MW
. RE
GIO
N5
89
95
05
42
91
46
5.7
71
11
69
70
.51
18
73
.05
12
.23
43
03
00
25
62
.58
.54
26
8.6
21
92
57
7.2
11
.77
40
83
30
.83
00
6.1
9.0
9
Baj
ura
11
26
3.0
05
44
41
1.0
02
51
91
93
10
.16
11
Baj
hang
33
30
10
.00
20
15
11
07
.33
32
10
5.0
02
11
21
2.0
02
16
6.0
0
Dar
chul
a9
86
55
20
8.0
04
03
04
50
15
.00
19
97
07
.78
14
12
21
61
8.0
02
11
61
6.0
0
FW. M
OU
NTA
IN1
12
70
55
67
.94
65
49
60
41
2.3
34
73
02
73
9.1
01
71
42
28
16
.29
42
22
11
.00
Ach
ham
55
.42
52
63
.51
0.5
41
71
31
10
.58
.50
54
22
23
9.4
10
.88
10
.58
.91
00
11
.24
0.6
0.3
54
.81
0.0
0
Dot
i3
18
12
51
14
3.8
9.1
52
92
43
24
13
.50
21
16
10
46
.50
20
20
26
01
3.0
01
9.7
51
41
61
11
.50
Bai
tadi
13
89
05
85
6.5
01
28
11
21
4.0
01
51
21
38
11
.50
2.5
22
51
2.5
01
71
2.5
15
01
2.0
0
Dad
eldh
ura
21
02
00
16
00
8.0
05
03
53
50
10
.00
53
50
30
06
.00
30
24
29
11
2.1
35
42
46
.00
FW. H
ILLS
72
1.4
44
03
59
2.3
8.1
61
08
80
89
6.5
11
.21
14
31
00
78
1.4
7.8
16
35
56
76
12
.31
42
.35
31
33
9.8
11
.01
Kai
lali
62
56
10
11
20
01
8.3
66
45
56
01
15
00
20
.54
30
63
00
31
00
10
.33
83
66
79
51
2.0
52
95
29
06
28
02
1.6
6
Kan
chan
pur
19
05
03
00
6.0
01
80
17
53
67
52
1.0
02
01
3.5
75
.65
.60
70
56
67
21
2.0
02
21
61
44
9.0
0
FW. T
ER
AI
81
56
60
11
50
01
7.4
28
25
73
51
51
75
20
.65
32
63
13
.53
17
5.6
10
.13
15
31
22
14
67
12
.02
31
73
06
64
24
20
.99
FW. R
EG
ION
16
48
.41
17
01
56
48
.31
3.3
79
98
86
41
66
75
.51
9.3
05
16
44
44
23
09
.54
23
31
91
23
71
12
.42
36
3.3
53
39
67
85
.82
0.0
3
NE
PA
L4
64
69
.13
83
52
27
04
31
.57
.05
14
50
21
28
61
20
82
44
.55
16
.19
41
01
.53
11
32
97
99
.39
.57
20
41
.21
47
62
48
17
.89
16
.82
24
24
.85
19
46
26
08
2.9
13
.40
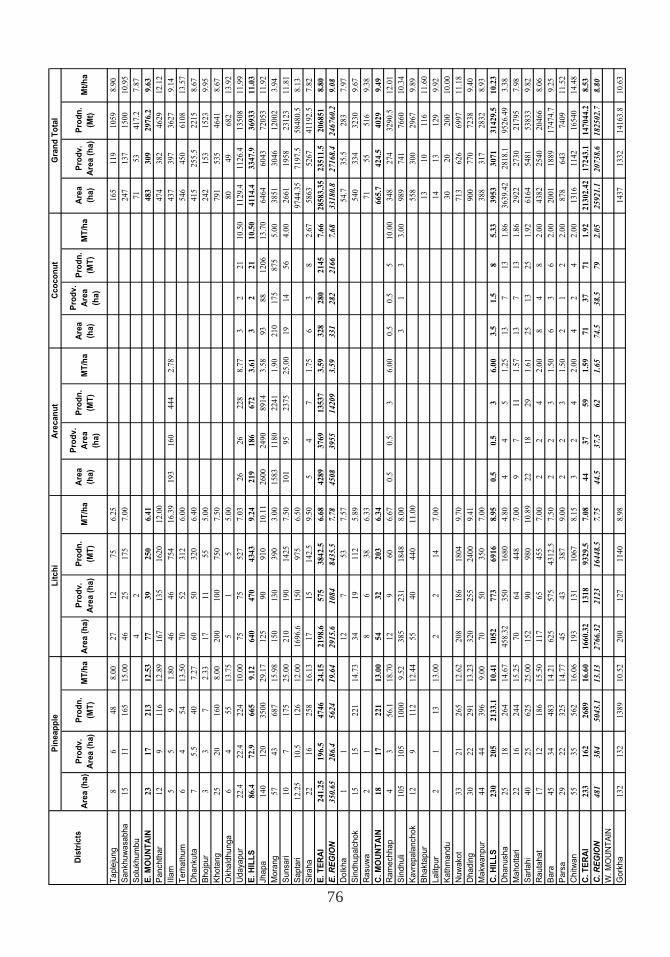
76
Tapl
ejun
gS
ankh
uwas
abha
Sol
ukhu
mbu
E. M
OU
NTA
INP
anch
thar
Illam
Terh
athu
mD
hank
uta
Bho
jpur
Kho
tang
Okh
aldh
unga
Uda
yapu
rE
. HIL
LSJh
apa
Mor
ang
Sun
sari
Sap
tari
Sira
haE
. TE
RA
IE
. RE
GIO
ND
olkh
aS
indh
upal
chok
Ras
uwa
C. M
OU
NTA
INR
amec
hhap
Sin
dhul
iK
avre
pala
ncho
kB
hakt
apur
Lalit
pur
Kat
hman
duN
uwak
otD
hadi
ngM
akw
anpu
rC
. HIL
LSD
hanu
sha
Mah
otta
riS
arla
hiR
auta
hat
Bar
aP
arsa
Chi
twan
C. T
ER
AI
C. R
EG
ION
W. M
OU
NTA
ING
orkh
aDis
tric
tsA
rea
(ha)
Pro
dv.
Are
a (h
a)P
rodn
. (M
T)M
T/ha
Are
a (h
a)P
rodv
. A
rea
(ha)
Pro
dn.
(MT)
MT/
haA
rea
(ha)
Pro
dv.
Are
a (h
a)
Pro
dn.
(MT)
MT/
haA
rea
(ha)
Pro
dv.
Are
a (h
a)
Pro
dn.
(MT)
MT/
haA
rea
(ha)
Pro
dv.
Are
a (h
a)P
rodn
. (M
t)M
t/ha
86
48
8.0
027
12
75
6.2
5165
119
1059
8.9
0
15
11
165
15.0
046
25
175
7.0
0247
137
1500
10.9
5
42
71
53
417.2
7.8
7
23
17
213
12.5
377
39
250
6.4
1483
309
2976.2
9.6
3
12
9116
12.8
9167
135
1620
12.0
0474
382
4629
12.1
2
55
91.8
046
46
754
16.3
9193
160
444
2.7
8437
397
3627
9.1
4
64
54
13.5
070
52
312
6.0
0546
450
6108
13.5
7
75.5
40
7.2
760
50
320
6.4
0415
255.5
2215
8.6
7
33
72.3
317
11
55
5.0
0242
153
1523
9.9
5
25
20
160
8.0
0200
100
750
7.5
0791
535
4641
8.6
7
64
55
13.7
55
15
5.0
080
49
682
13.9
2
22.4
22.4
224
10.0
075
75
527
7.0
326
26
228
8.7
73
221
10.5
01129.4
1126.4
13508
11.9
9
86.4
72.9
665
9.1
2640
470
4343
9.2
4219
186
672
3.6
13
221
10.5
04114.4
3347.9
36933
11.0
3
140
120
3500
29.1
7125
90
910
10.1
12600
2490
8914
3.5
893
88
1206
13.7
06464
6043
72053
11.9
2
57
43
687
15.9
8150
130
390
3.0
01583
1180
2241
1.9
0210
175
875
5.0
03851
3046
12002
3.9
4
10
7175
25.0
0210
190
1425
7.5
0101
95
2375
25.0
019
14
56
4.0
02661
1958
23123
11.8
1
12.2
510.5
126
12.0
01696.6
150
975
6.5
09744.3
57197.5
58480.5
8.1
3
22
16
258
16.1
317
15
142.5
9.5
05
47
1.7
56
38
2.6
75863
5267
41192.5
7.8
2
241.2
5196.5
4746
24.1
52198.6
575
3842.5
6.6
84289
3769
13537
3.5
9328
280
2145
7.6
628583.3
523511.5
206851
8.8
0
350.6
5286.4
5624
19.6
42915.6
1084
8435.5
7.7
84508
3955
14209
3.5
9331
282
2166
7.6
833180.8
27168.4
246760.2
9.0
8
11
12
753
7.5
754.7
35.5
283
7.9
7
15
15
221
14.7
334
19
112
5.8
9540
334
3230
9.6
7
21
86
38
6.3
371
55
516
9.3
8
18
17
221
13.0
054
32
203
6.3
4665.7
424.5
4029
9.4
9
43
56.1
18.7
012
960
6.6
70.5
0.5
36.0
00.5
0.5
510.0
0348
274
3290.5
12.0
1
105
105
1000
9.5
2385
231
1848
8.0
03
13
3.0
0989
741
7660
10.3
4
12
9112
12.4
455
40
440
11.0
0558
300
2967
9.8
9
13
10
116
11.6
0
21
13
13.0
02
214
7.0
014
13
129
9.9
2
30
20
200
10.0
0
33
21
265
12.6
2208
186
1804
9.7
0713
626
6997
11.1
8
30
22
291
13.2
3320
255
2400
9.4
1900
770
7238
9.4
0
44
44
396
9.0
070
50
350
7.0
0388
317
2832
8.9
3
230
205
2133.1
10.4
11052
773
6916
8.9
50.5
0.5
36.0
03.5
1.5
85.3
33953
3071
31429.5
10.2
3
25
18
264
14.6
7458.3
2350
1680
4.8
04
45
1.2
513
713
1.8
63639.4
22818.1
9526.4
93.3
8
22
16
244
15.2
570
64
448
7.0
09
711
1.5
713
713
1.8
62922
2730
21795
7.9
8
40
25
625
25.0
0152
90
980
10.8
922
18
29
1.6
125
13
25
1.9
26164
5481
53833
9.8
2
17
12
186
15.5
0117
65
455
7.0
02
24
2.0
08
48
2.0
04382
2540
20466
8.0
6
45
34
483
14.2
1625
575
4312.5
7.5
02
23
1.5
06
36
2.0
02001
1889
17474.7
9.2
5
29
22
325
14.7
745
43
387
9.0
02
23
1.5
02
12
2.0
0878
643
7409
11.5
2
55
35
562
16.0
6193
131
1067
8.1
53
24
2.0
04
24
2.0
01316
1142
16540
14.4
8
233
162
2689
16.6
01660.3
21318
9329.5
7.0
844
37
59
1.5
971
37
71
1.9
221302.4
217243.1
147044.2
8.5
3
481
384
5043.1
13.1
32766.3
22123
16448.5
7.7
544.5
37.5
62
1.6
574.5
38.5
79
2.0
525921.1
20738.6
182502.7
8.8
0
132
132
1389
10.5
2200
127
1140
8.9
81437
1332
14163.8
10.6
3
Gra
nd T
otal
Pin
eapp
leLi
tchi
Are
canu
tC
coco
nut
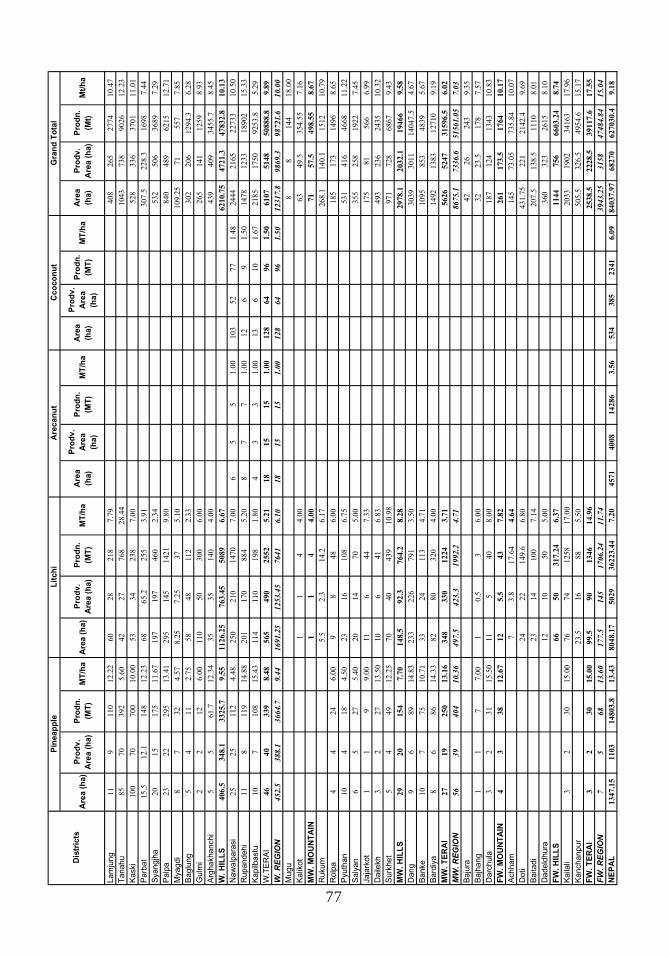
77
Dis
tric
ts
Lam
jung
Tan
ahu
Kas
kiP
arba
tS
yang
jha
Pal
paM
yagd
iB
aglu
ngG
ulm
iA
rgha
khan
chi
W. H
ILLS
Naw
alpa
rasi
Rup
ande
hiK
apilb
astu
W.T
ER
AI
W. R
EG
ION
Mug
uK
alik
otM
W. M
OU
NTA
INR
ukum
Rol
paP
yuth
anS
alya
nJa
jark
otD
aile
khS
urkh
etM
W. H
ILLS
Dan
gB
anke
Bar
diya
MW
. TE
RA
IM
W. R
EG
ION
Baj
ura
Baj
hang
Dar
chul
aFW
. MO
UN
TAIN
Ach
ham
Dot
iB
aita
diD
adel
dhur
aFW
. HIL
LSK
aila
liK
anch
anpu
rFW
. TE
RA
IFW
. RE
GIO
NN
EP
AL
Are
a (h
a)P
rodv
. A
rea
(ha)
Pro
dn.
(MT)
MT/
haA
rea
(ha)
Pro
dv.
Are
a (h
a)P
rodn
. (M
T)M
T/ha
Are
a (h
a)
Pro
dv.
Are
a (h
a)
Pro
dn.
(MT)
MT/
haA
rea
(ha)
Pro
dv.
Are
a (h
a)
Pro
dn.
(MT)
MT/
haA
rea
(ha)
Pro
dv.
Are
a (h
a)P
rodn
. (M
t)M
t/ha
Gra
nd T
otal
Pin
eapp
leLi
tchi
Are
canu
tC
coco
nut
11
9110
12.2
260
28
218
7.7
9408
265
2774
10.4
7
85
70
392
5.6
042
27
768
28.4
41043
738
9026
12.2
3
100
70
700
10.0
053
34
238
7.0
0528
336
3701
11.0
1
15.5
12.1
148
12.2
368
65.2
255
3.9
1307.5
228.3
1698
7.4
4
20
15
175
11.6
7197
197
460
2.3
4532
506
3689
7.2
9
23
22
295
13.4
1295
145
1421
9.8
0840
489
6215
12.7
1
87
32
4.5
78.2
57.2
537
5.1
0109.2
571
557
7.8
5
54
11
2.7
558
48
112
2.3
3302
206
1294.3
6.2
8
22
12
6.0
0110
50
300
6.0
0265
141
1259
8.9
3
55
61.7
12.3
435
35
140
4.0
0439
409
3455.7
8.4
5
406.5
348.1
3325.7
9.5
51126.2
5763.4
55089
6.6
76210.7
54721.3
47832.8
10.1
3
25
25
112
4.4
8250
210
1470
7.0
06
55
1.0
0103
52
77
1.4
82444
2165
22733
10.5
0
11
8119
14.8
8201
170
884
5.2
08
77
1.0
012
69
1.5
01478
1233
18902
15.3
3
10
7108
15.4
3114
110
198
1.8
04
33
1.0
013
610
1.6
72185
1750
9253.8
5.2
9
46
40
339
8.4
8565
490
2552
5.2
118
15
15
1.0
0128
64
96
1.5
06107
5148
50888.8
9.8
9
452.5
388.1
3664.7
9.4
41691.2
51253.4
57641
6.1
018
15
15
1.0
0128
64
96
1.5
012317.8
9869.3
98721.6
10.0
0
88
144
18.0
0
11
44.0
063
49.5
354.5
57.1
6
11
44.0
071
57.5
498.5
58.6
7
5.5
2.3
14.2
6.1
7268.1
140.1
1512
10.7
9
44
24
6.0
09
848
6.0
0185
173
1496
8.6
5
10
418
4.5
023
16
108
6.7
5531
416
4668
11.2
2
65
27
5.4
020
14
70
5.0
0355
258
1922
7.4
5
11
99.0
011
644
7.3
3175
81
566
6.9
9
32
27
13.5
010
641
6.8
3493
236
2435
10.3
2
54
49
12.2
570
40
439
10.9
8971
728
6867
9.4
3
29
20
154
7.7
0148.5
92.3
764.2
8.2
82978.1
2032.1
19466
9.5
8
96
89
14.8
3233
226
791
3.5
03039
3011
14047.5
4.6
7
10
775
10.7
133
24
113
4.7
11095
853
4839
5.6
7
86
86
14.3
382
80
320
4.0
01492
1383
12710
9.1
9
27
19
250
13.1
6348
330
1224
3.7
15626
5247
31596.5
6.0
2
56
39
404
10.3
6497.5
423.3
1992.2
4.7
18675.1
7336.6
51561.0
57.0
3
42
26
243
9.3
5
11
77.0
01
0.5
36.0
032
23.5
178
7.5
7
32
31
15.5
011
540
8.0
0187
124
1343
10.8
3
43
38
12.6
712
5.5
43
7.8
2261
173.5
1764
10.1
7
73.8
17.6
44.6
4145
73.0
5735.8
410.0
7
24
22
149.6
6.8
0431.7
5221
2142.4
9.6
9
23
14
100
7.1
4207.5
138.5
1110
8.0
1
12
10
50
5.0
0360
323
2615
8.1
0
66
50
317.2
46.3
71144
756
6603.2
48.7
4
32
30
15.0
076
74
1258
17.0
02033
1902
34163
17.9
6
23.5
16
88
5.5
0505.5
326.5
4954.6
15.1
7
32
30
15.0
099.5
90
1346
14.9
62538.5
2228.5
39117.6
17.5
5
75
68
13.6
0177.5
145
1706.2
411.7
43943.2
53158
47484.8
415.0
4
1347.1
51103
14803.8
13.4
38048.1
75029
36223.4
47.2
04571
4008
14286
3.5
6534
385
2341
6.0
984037.9
768270
627030.4
9.1
8
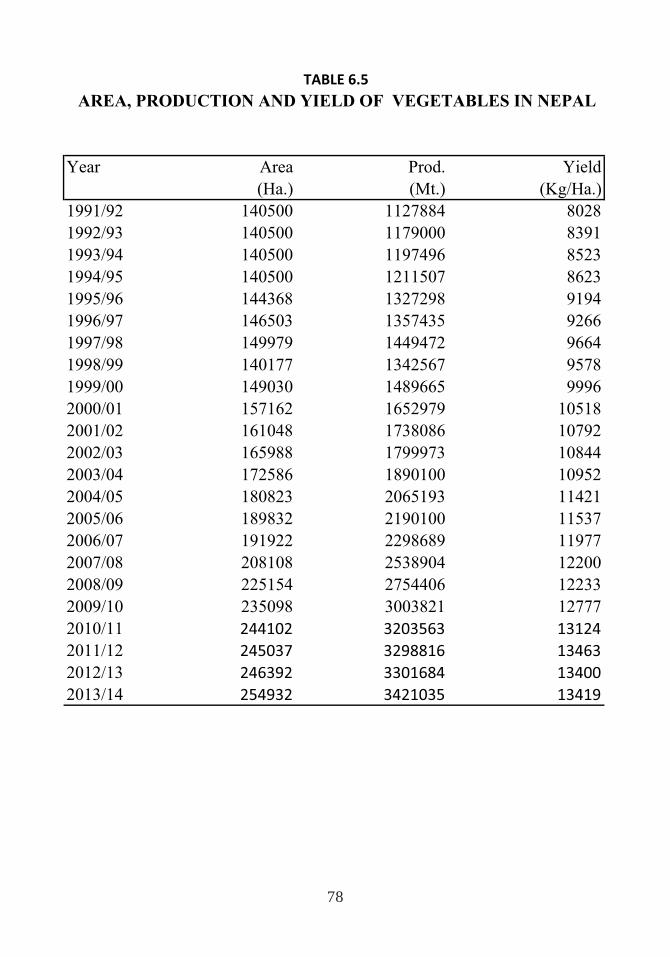
78
Year Area Prod. Yield
(Ha.) (Mt.) (Kg/Ha.)
1991/92 140500 1127884 8028
1992/93 140500 1179000 8391
1993/94 140500 1197496 8523
1994/95 140500 1211507 8623
1995/96 144368 1327298 9194
1996/97 146503 1357435 9266
1997/98 149979 1449472 9664
1998/99 140177 1342567 9578
1999/00 149030 1489665 9996
2000/01 157162 1652979 10518
2001/02 161048 1738086 10792
2002/03 165988 1799973 10844
2003/04 172586 1890100 10952
2004/05 180823 2065193 11421
2005/06 189832 2190100 11537
2006/07 191922 2298689 11977
2007/08 208108 2538904 12200
2008/09 225154 2754406 12233
2009/10 235098 3003821 12777
2010/11 244102 3203563 13124
2011/12 245037 3298816 13463
2012/13 246392 3301684 13400
2013/14 254932 3421035 13419
TABLE 6.5
AREA, PRODUCTION AND YIELD OF VEGETABLES IN NEPAL
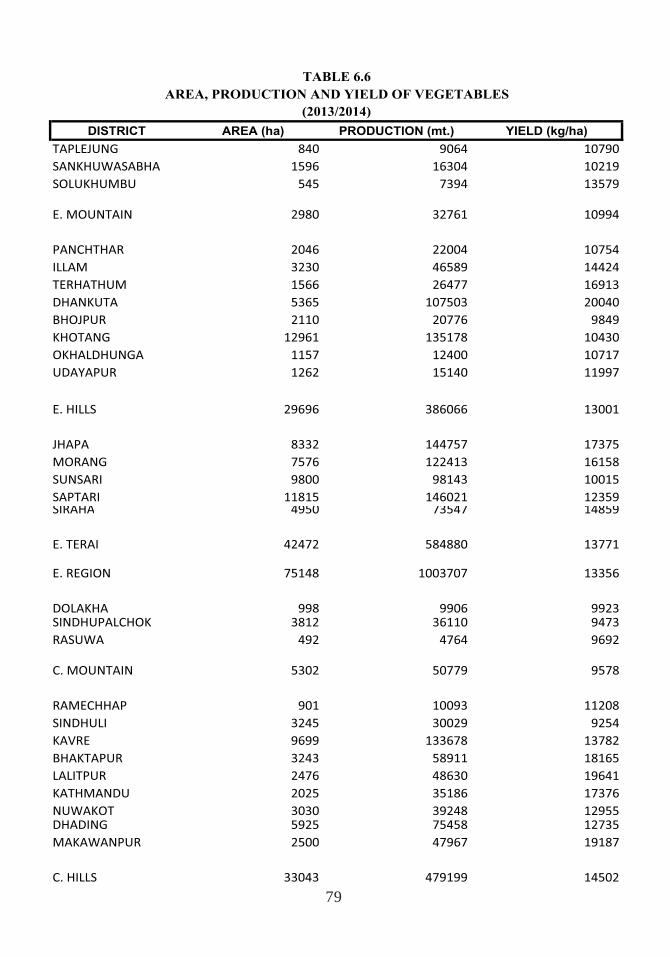
79
DISTRICT AREA (ha) PRODUCTION (mt.) YIELD (kg/ha)
TAPLEJUNG 840 9064 10790
SANKHUWASABHA 1596 16304 10219
SOLUKHUMBU 545 7394 13579
E. MOUNTAIN 2980 32761 10994
PANCHTHAR 2046 22004 10754
ILLAM 3230 46589 14424
TERHATHUM 1566 26477 16913
DHANKUTA 5365 107503 20040
BHOJPUR 2110 20776 9849
KHOTANG 12961 135178 10430
OKHALDHUNGA 1157 12400 10717
UDAYAPUR 1262 15140 11997
E. HILLS 29696 386066 13001
JHAPA 8332 144757 17375
MORANG 7576 122413 16158
SUNSARI 9800 98143 10015
SAPTARI 11815 146021 12359SIRAHA 4950 73547 14859
E. TERAI 42472 584880 13771
E. REGION 75148 1003707 13356
DOLAKHA 998 9906 9923SINDHUPALCHOK 3812 36110 9473
RASUWA 492 4764 9692
C. MOUNTAIN 5302 50779 9578
RAMECHHAP 901 10093 11208
SINDHULI 3245 30029 9254
KAVRE 9699 133678 13782
BHAKTAPUR 3243 58911 18165
LALITPUR 2476 48630 19641
KATHMANDU 2025 35186 17376
NUWAKOT 3030 39248 12955DHADING 5925 75458 12735
MAKAWANPUR 2500 47967 19187
C. HILLS 33043 479199 14502
TABLE 6.6
AREA, PRODUCTION AND YIELD OF VEGETABLES
(2013/2014)
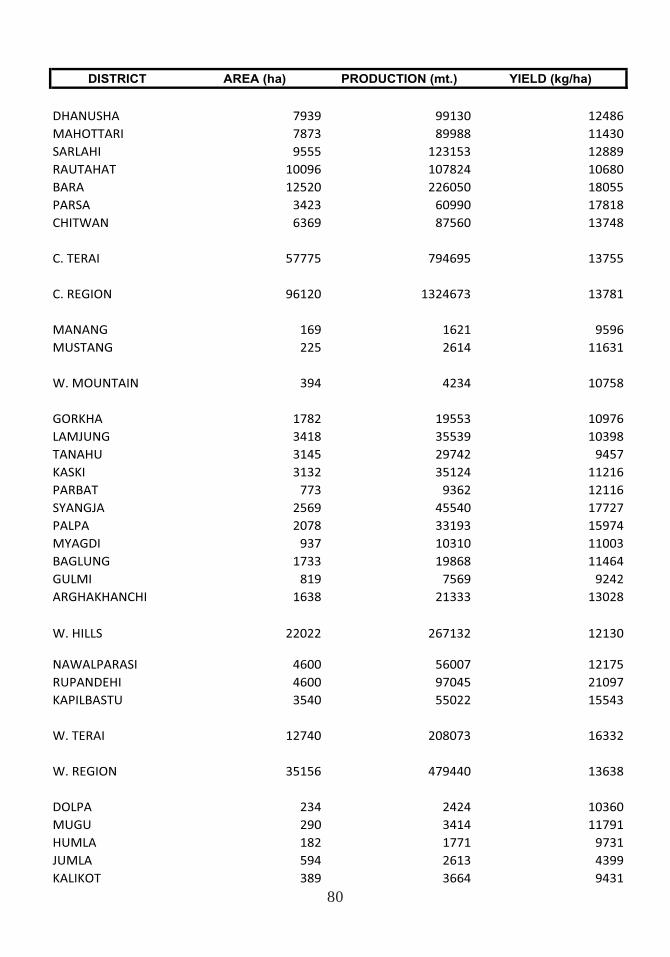
80
DISTRICT AREA (ha) PRODUCTION (mt.) YIELD (kg/ha)
DHANUSHA 7939 99130 12486
MAHOTTARI 7873 89988 11430
SARLAHI 9555 123153 12889
RAUTAHAT 10096 107824 10680
BARA 12520 226050 18055
PARSA 3423 60990 17818
CHITWAN 6369 87560 13748
C. TERAI 57775 794695 13755
C. REGION 96120 1324673 13781
MANANG 169 1621 9596
MUSTANG 225 2614 11631
W. MOUNTAIN 394 4234 10758
GORKHA 1782 19553 10976
LAMJUNG 3418 35539 10398
TANAHU 3145 29742 9457
KASKI 3132 35124 11216
PARBAT 773 9362 12116
SYANGJA 2569 45540 17727
PALPA 2078 33193 15974
MYAGDI 937 10310 11003
BAGLUNG 1733 19868 11464
GULMI 819 7569 9242
ARGHAKHANCHI 1638 21333 13028
W. HILLS 22022 267132 12130
NAWALPARASI 4600 56007 12175
RUPANDEHI 4600 97045 21097
KAPILBASTU 3540 55022 15543
W. TERAI 12740 208073 16332
W. REGION 35156 479440 13638
DOLPA 234 2424 10360
MUGU 290 3414 11791
HUMLA 182 1771 9731
JUMLA 594 2613 4399
KALIKOT 389 3664 9431
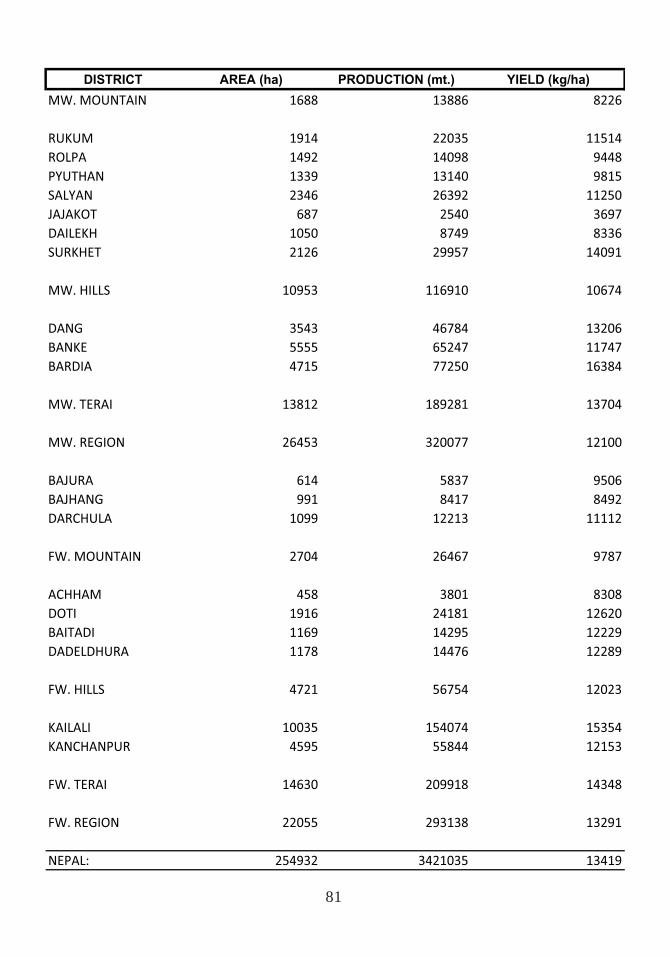
81
DISTRICT AREA (ha) PRODUCTION (mt.) YIELD (kg/ha)
MW. MOUNTAIN 1688 13886 8226
RUKUM 1914 22035 11514
ROLPA 1492 14098 9448
PYUTHAN 1339 13140 9815
SALYAN 2346 26392 11250
JAJAKOT 687 2540 3697
DAILEKH 1050 8749 8336
SURKHET 2126 29957 14091
MW. HILLS 10953 116910 10674
DANG 3543 46784 13206
BANKE 5555 65247 11747
BARDIA 4715 77250 16384
MW. TERAI 13812 189281 13704
MW. REGION 26453 320077 12100
BAJURA 614 5837 9506
BAJHANG 991 8417 8492
DARCHULA 1099 12213 11112
FW. MOUNTAIN 2704 26467 9787
ACHHAM 458 3801 8308
DOTI 1916 24181 12620
BAITADI 1169 14295 12229
DADELDHURA 1178 14476 12289
FW. HILLS 4721 56754 12023
KAILALI 10035 154074 15354
KANCHANPUR 4595 55844 12153
FW. TERAI 14630 209918 14348
FW. REGION 22055 293138 13291
NEPAL: 254932 3421035 13419
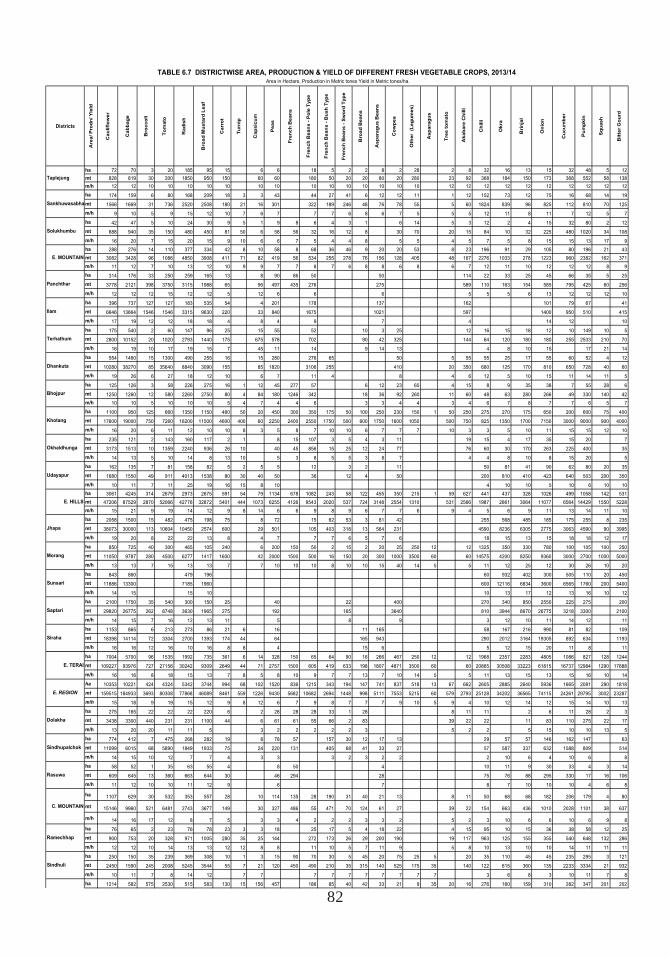
82
Districts
Are
a/ P
rod
n/ Y
ield
Ca
ulif
low
er
Ca
bb
ag
e
Bro
cc
oli
To
ma
to
Ra
dis
h
Bro
ad
Mu
sta
rd L
ea
f
Ca
rro
t
Tu
rnip
Ca
ps
icu
m
Pe
as
Fre
nc
h B
ea
ns
Fre
nc
h B
ea
ns
- P
ole
Ty
pe
Fre
nc
h B
ea
ns
- B
us
h T
yp
e
Fre
nc
h B
ea
ns
- S
wo
rd T
yp
e
Bro
ad
Be
an
s
As
pa
rag
us
Be
an
s
Co
wp
ea
Oth
er
(L
eg
um
es
)
As
pa
rag
us
Tre
e t
om
ato
Ak
ab
are
Ch
illi
Ch
illi
Ok
ra
Bri
nja
l
On
ion
Cu
cu
mb
er
Pu
mp
kin
Sq
ua
sh
Bit
ter
Go
urd
ha 72 70 3 20 185 95 15 6 6 18 5 2 2 8 2 28 2 8 32 16 13 15 32 48 5 12
mt 828 819 30 200 1850 950 150 60 60 180 50 20 20 80 20 280 23 92 368 184 150 173 368 552 58 138
m/h 12 12 10 10 10 10 10 10 10 10 10 10 10 10 10 10 12 12 12 12 12 12 12 12 12 12
ha 174 159 6 80 168 209 18 3 3 43 44 27 41 6 12 12 11 1 12 152 73 12 75 16 68 14 19
mt 1566 1669 31 736 2520 2508 180 21 16 301 322 189 246 48 76 78 55 5 60 1824 839 96 825 112 810 70 125
m/h 9 10 5 9 15 12 10 7 6 7 7 7 6 8 6 7 5 5 5 12 11 8 11 7 12 5 7
ha 42 47 5 10 24 30 9 5 1 9 8 6 4 3 1 6 14 5 3 12 2 4 15 32 80 2 12
mt 688 940 35 150 480 450 81 50 6 58 56 32 16 12 8 30 70 20 15 84 10 32 225 480 1020 34 108
m/h 16 20 7 15 20 15 9 10 6 6 7 5 4 4 8 5 5 4 5 7 5 8 15 15 13 17 9
ha 288 276 14 110 377 334 42 8 10 58 8 68 36 46 9 20 20 53 8 23 196 91 29 105 80 196 21 43
mt 3082 3428 96 1086 4850 3908 411 71 82 419 56 534 255 278 76 156 128 405 48 167 2276 1033 278 1223 960 2382 162 371
m/h 11 12 7 10 13 12 10 9 9 7 7 8 7 6 8 8 6 8 6 7 12 11 10 12 12 12 8 9
ha 314 176 33 250 259 165 13 8 90 86 50 50 114 22 33 25 45 66 35 5 25
mt 3778 2121 398 3750 3115 1988 65 96 497 435 276 275 589 110 163 154 585 795 425 60 256
m/h 12 12 12 15 12 12 5 12 6 6 6 5 5 5 6 13 12 12 12 10
ha 396 737 127 127 183 535 54 4 201 178 137 162 101 79 67 41
mt 6646 13664 1546 1546 3315 9630 220 33 840 1675 1021 597 1400 950 510 415
m/h 17 19 12 12 18 18 4 8 4 9 7 4 14 12 10
ha 175 540 2 60 147 96 25 15 55 52 10 3 25 12 16 15 18 12 10 149 10 5
mt 2800 10152 20 1020 2793 1440 175 675 578 702 90 42 325 144 64 120 180 180 255 2533 210 70
m/h 16 19 10 17 19 15 7 45 11 14 9 14 13 4 8 10 15 17 21 14
ha 554 1460 15 1300 490 255 16 15 280 276 65 50 5 55 55 25 17 55 60 52 4 12
mt 10280 38270 85 35640 8840 3090 155 85 1820 3106 255 410 20 350 680 125 170 810 650 728 40 60
m/h 19 26 6 27 18 12 10 6 7 11 4 8 4 6 12 5 10 15 11 14 11 5
ha 125 126 3 58 226 275 16 1 12 45 277 57 6 12 23 65 4 15 8 9 35 38 7 55 28 6
mt 1250 1260 12 580 2260 2750 80 4 84 180 1246 342 18 36 92 260 11 60 48 63 280 266 49 330 140 42
m/h 10 10 5 10 10 10 5 4 7 4 4 6 3 3 4 4 3 4 6 7 8 7 7 6 5 7
ha 1100 950 125 660 1350 1150 460 50 20 450 300 350 175 50 100 250 230 150 1 50 250 275 270 175 650 200 600 75 400
mt 17600 19000 750 7260 16200 11500 4600 400 60 2250 2400 2550 1750 500 600 1750 1600 1050 500 750 825 1350 1700 7150 3000 9000 900 4000
m/h 16 20 6 11 12 10 10 8 3 5 8 7 10 10 6 7 7 7 10 3 3 5 10 11 15 15 12 10
ha 235 121 2 143 160 117 2 1 8 15 107 3 5 4 3 11 19 15 4 17 35 15 20 7
mt 3173 1513 10 1359 2240 936 26 10 40 45 856 15 25 12 24 77 76 60 30 170 263 225 400 35
m/h 14 13 5 10 14 8 13 10 5 3 8 5 5 3 8 7 4 4 8 10 8 15 20 5
ha 162 135 7 81 158 82 5 2 5 5 12 3 2 11 50 81 41 90 62 80 20 35
mt 1680 1550 49 911 4013 1538 80 30 40 50 36 12 4 50 200 810 410 423 640 503 200 350
m/h 10 11 7 11 25 19 16 15 8 10 4 10 10 5 10 6 10 10
ha 3061 4245 314 2679 2973 2675 591 54 79 1134 678 1082 243 58 122 455 350 215 1 59 627 441 437 328 1026 499 1058 142 531
mt 47206 87529 2870 52066 42776 32872 5401 444 1073 6255 4126 9543 2020 537 724 3148 2554 1310 531 2566 1987 2661 3064 11077 6564 14429 1550 5228
m/h 15 21 9 19 14 12 9 8 14 6 6 9 8 9 6 7 7 6 9 4 5 6 9 11 13 14 11 10
ha 2058 1500 15 482 475 198 75 8 72 15 62 53 3 81 42 255 568 485 185 175 255 8 235
mt 38073 30000 113 10604 10450 2574 600 29 501 105 403 318 13 564 231 4590 8236 6305 2775 3063 4590 90 3995
m/h 19 20 8 22 22 13 8 4 7 7 7 6 5 7 6 18 15 13 15 18 18 12 17
ha 850 725 40 300 465 105 240 6 200 150 50 2 15 2 20 25 250 12 12 1325 350 330 780 100 105 100 250
mt 11050 9787 280 4500 6277 1417 1600 42 2000 1500 500 16 150 20 300 1000 3500 60 60 14575 4200 8250 9360 3000 2700 1000 5000
m/h 13 13 7 15 13 13 7 7 10 10 10 8 10 10 15 40 14 5 5 11 12 25 12 30 26 10 20
ha 843 860 479 196 60 932 402 300 505 110 20 450
mt 11886 13300 7185 1960 600 12116 6834 3600 6565 1760 200 5400
m/h 14 15 15 10 10 13 17 12 13 16 10 12
ha 2100 1750 35 540 300 150 25 40 22 400 270 340 850 2550 225 275 200
mt 29820 26775 262 8748 3630 1965 275 192 165 3640 810 3944 8670 26775 3218 3300 2100
m/h 14 15 7 16 12 13 11 5 8 9 3 12 10 11 14 12 11
ha 1153 865 6 213 273 86 21 6 16 11 165 58 167 216 990 81 82 109
mt 18398 14114 72 3304 2700 1393 174 44 64 165 943 290 2012 3164 19305 892 634 1193
m/h 16 16 12 16 10 16 8 8 4 15 6 5 12 15 20 11 8 11
ha 7004 5700 96 1535 1992 735 361 6 14 328 150 65 64 90 16 266 467 250 12 12 1968 2357 2283 4805 1086 827 128 1244
mt 109227 93976 727 27156 30242 9309 2649 44 71 2757 1500 605 419 633 198 1807 4871 3500 60 60 20865 30508 33223 61815 16737 12984 1290 17688
m/h 16 16 8 18 15 13 7 8 5 8 10 9 7 7 13 7 10 14 5 5 11 13 15 13 15 16 10 14
ha 10353 10221 424 4324 5342 3744 994 68 102 1520 836 1215 343 194 147 741 837 518 13 67 662 2605 2885 2640 5936 1665 2081 290 1818
mt 159515 184933 3693 80308 77868 46089 8461 559 1226 9430 5682 10682 2694 1448 998 5111 7553 5215 60 579 2793 25128 34202 36565 74115 24261 29795 3002 23287
m/h 15 18 9 19 15 12 9 8 12 6 7 9 8 7 7 7 9 10 5 9 4 10 12 14 12 15 14 10 13
ha 275 165 22 22 22 220 6 2 28 28 28 33 1 28 8 11 11 2 6 11 28 2 3
mt 3438 3300 440 231 231 1100 44 6 61 61 55 66 2 83 39 22 22 11 83 110 275 22 17
m/h 13 20 20 11 11 5 3 2 2 2 2 2 3 5 2 2 5 15 10 10 13 5
ha 774 412 7 475 268 282 19 8 78 57 157 30 12 17 13 29 57 57 146 162 147 63
mt 11099 6015 68 5890 1849 1933 75 24 220 131 405 68 41 33 27 57 587 337 632 1588 809 514
m/h 14 15 10 12 7 7 4 3 3 3 2 3 2 2 2 10 6 4 10 6 8
ha 58 52 1 35 63 55 4 8 50 4 10 11 9 30 33 4 3 14
mt 609 645 13 360 663 644 30 46 294 28 75 76 88 295 330 17 16 106
m/h 11 12 10 10 11 12 9 6 7 8 7 10 10 10 4 6 8
ha 1107 629 30 532 353 557 28 10 114 135 28 190 31 40 21 13 8 11 50 68 68 182 206 179 4 80
mt 15146 9960 521 6481 2743 3677 149 30 327 486 55 471 70 124 61 27 39 22 154 663 436 1010 2028 1101 38 637
m/h 14 16 17 12 8 7 5 3 3 4 2 2 2 3 3 2 5 2 3 10 6 6 10 6 9 8
ha 76 65 2 23 76 78 23 3 3 18 25 17 5 4 18 22 4 15 95 10 15 36 38 58 12 25
mt 900 753 20 328 971 1005 280 35 25 144 272 173 26 29 200 190 19 117 963 125 155 355 540 648 132 286
m/h 12 12 10 14 13 13 12 12 8 8 11 10 5 7 11 9 5 8 10 13 10 10 14 11 11 11
ha 250 150 35 239 369 308 10 1 3 15 90 70 30 5 45 20 75 25 5 20 35 110 45 45 235 295 3 121
mt 2450 1590 245 2008 5245 3544 55 7 21 120 450 490 210 35 315 140 525 175 35 140 122 615 360 135 2233 3334 21 932
m/h 10 11 7 8 14 12 7 7 7 7 7 7 7 7 7 7 3 6 8 3 10 11 7 8
ha 1214 582 575 2530 515 583 130 15 156 457 186 85 40 42 33 21 9 35 20 16 276 160 159 310 282 347 201 202
TABLE 6.7 DISTRICTWISE AREA, PRODUCTION & YIELD OF DIFFERENT FRESH VEGETABLE CROPS, 2013/14
Rasuwa
C. MOUNTAIN
Ramechhap
Sindhuli
Saptari
Siraha
E. TERAI
E. REGION
Area in Hectare, Production in Metric tones Yield in Metric tones/ha.
E. MOUNTAIN
Panchthar
Ilam
Terhathum
Dhankuta
Taplejung
Sankhuwasabha
Solukhumbu
Morang
Dolakha
Sindhupalchok
Bhojpur
Khotang
Okhaldhunga
Udayapur
E. HILLS
Jhapa
Sunsari
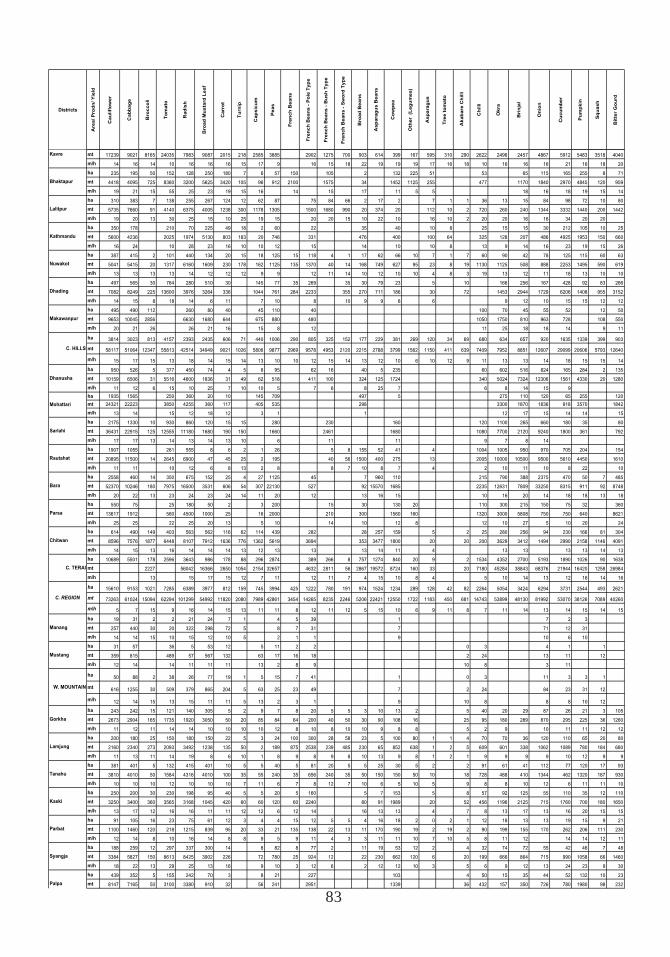
83
Districts
Are
a/ P
rod
n/ Y
ield
Ca
ulif
low
er
Ca
bb
ag
e
Bro
cc
oli
To
ma
to
Ra
dis
h
Bro
ad
Mu
sta
rd L
ea
f
Ca
rro
t
Tu
rnip
Ca
ps
icu
m
Pe
as
Fre
nc
h B
ea
ns
Fre
nc
h B
ea
ns
- P
ole
Ty
pe
Fre
nc
h B
ea
ns
- B
us
h T
yp
e
Fre
nc
h B
ea
ns
- S
wo
rd T
yp
e
Bro
ad
Be
an
s
As
pa
rag
us
Be
an
s
Co
wp
ea
Oth
er
(L
eg
um
es
)
As
pa
rag
us
Tre
e t
om
ato
Ak
ab
are
Ch
illi
Ch
illi
Ok
ra
Bri
nja
l
On
ion
Cu
cu
mb
er
Pu
mp
kin
Sq
ua
sh
Bit
ter
Go
urd
mt 17239 9021 8165 24035 7983 9087 2015 218 2585 3885 2902 1275 700 903 614 399 167 595 310 290 2622 2496 2457 4867 5912 5483 3518 4040
m/h 14 16 14 10 16 16 16 15 17 9 16 15 18 22 19 19 19 17 16 18 10 16 16 16 21 16 18 20
ha 235 195 50 152 128 250 180 7 6 57 150 105 2 132 225 51 53 65 115 165 255 8 71
mt 4418 4095 725 8360 3200 5625 3420 105 96 912 2100 1575 34 1452 1125 255 477 1170 1840 2970 4845 120 959
m/h 19 21 15 55 25 23 19 15 16 14 15 17 11 5 5 18 16 18 19 15 14
ha 310 383 7 138 255 267 124 12 62 87 75 84 66 2 17 2 7 1 1 36 13 15 84 98 72 10 80
mt 5735 7660 91 4140 6375 4005 1238 300 1178 1305 1500 1680 990 20 374 20 112 10 2 720 260 240 1344 3332 1440 200 1442
m/h 19 20 13 30 25 15 10 25 19 15 20 20 15 10 22 10 16 10 2 20 20 16 16 34 20 20
ha 350 178 210 70 225 49 18 2 60 22 35 40 10 8 25 15 15 30 212 105 10 25
mt 5600 4236 2025 1974 5130 803 183 20 746 331 476 400 100 64 325 128 207 486 4925 1953 150 660
m/h 16 24 10 28 23 16 10 10 12 15 14 10 10 8 13 9 14 16 23 19 15 26
ha 387 415 2 101 440 134 20 15 18 125 15 118 4 1 17 62 66 10 7 1 7 60 90 42 78 125 115 60 63
mt 5041 5415 20 1317 6160 1609 230 178 162 1125 135 1370 40 14 168 749 627 95 23 8 19 1130 1125 508 888 2253 1495 590 619
m/h 13 13 13 13 14 12 12 12 9 9 12 11 14 10 12 10 10 4 8 3 19 13 12 11 18 13 10 10
ha 497 565 30 764 280 510 30 145 77 35 269 35 30 79 23 5 10 166 256 167 428 92 83 266
mt 7082 8249 225 13600 3976 3264 336 1044 761 284 2233 355 270 711 186 30 72 1453 2944 1729 6206 1408 955 3152
m/h 14 15 8 18 14 6 11 7 10 8 10 9 9 8 6 9 12 10 15 15 12 12
ha 495 490 112 260 80 40 45 110 40 100 70 45 55 52 12 50
mt 9653 10045 2856 6630 1680 644 675 880 480 1050 1750 810 963 728 108 550
m/h 20 21 26 26 21 16 15 8 12 11 25 18 18 14 9 11
ha 3814 3023 813 4157 2393 2435 606 71 440 1006 290 805 325 152 177 229 381 269 120 34 69 680 634 657 920 1635 1339 399 903
mt 58117 51064 12347 55813 42514 34949 9021 1026 5806 9877 2969 9578 4953 2120 2215 2788 3799 1562 1150 411 639 7409 7952 8851 12607 29099 20606 5793 12640
m/h 15 17 15 13 18 14 15 14 13 10 10 12 15 14 13 12 10 6 10 12 9 11 13 13 14 18 15 15 14
ha 950 526 5 377 450 74 4 5 6 95 62 16 40 5 235 60 602 516 824 165 284 2 135
mt 10159 6506 31 5516 4600 1836 31 49 62 518 411 100 324 125 1724 340 5024 7324 12306 1561 4330 20 1280
m/h 11 12 6 15 10 25 7 10 10 5 7 6 8 25 7 6 8 14 15 9
ha 1935 1565 250 360 20 10 145 709 497 5 275 110 120 65 255 120
mt 24321 22223 3850 4255 360 117 405 535 298 3300 1870 1836 918 3570 1842
m/h 13 14 15 12 18 12 3 1 1 12 17 15 14 14 15
ha 2175 1330 10 930 860 120 15 15 280 230 160 120 1100 265 660 180 35 80
mt 36431 22915 125 12555 11180 1680 190 150 1660 2461 1680 1080 7700 2120 9240 1800 361 792
m/h 17 17 13 14 13 14 13 10 6 11 11 9 7 8 14
ha 1907 1055 261 555 8 6 2 1 26 5 8 155 52 41 4 1004 1005 950 970 705 204 154
mt 20895 11500 14 2645 6900 47 45 25 2 195 40 56 1500 400 275 13 2005 10000 10500 9500 5610 4450 1610
m/h 11 11 10 12 6 8 13 2 8 8 7 10 8 7 4 2 10 11 10 8 22 10
ha 2558 460 14 350 675 152 25 4 27 1125 45 7 960 110 215 790 388 2375 470 50 7 485
mt 52370 10246 180 7975 16500 3531 606 54 307 22130 527 92 15570 1685 2235 12631 7809 33250 8315 911 92 8748
m/h 20 22 13 23 24 23 24 14 11 20 12 13 16 15 10 16 20 14 18 18 13 18
ha 550 75 25 180 50 2 3 200 15 30 130 20 110 300 215 150 75 32 360
mt 13617 1912 560 4500 1000 25 16 2000 210 300 1560 160 1320 3000 5808 750 750 640 8621
m/h 25 25 22 25 20 13 5 10 14 10 12 8 12 10 27 5 10 20 24
ha 614 490 149 403 563 562 116 62 114 439 282 28 257 159 5 2 25 280 256 94 230 166 81 304
mt 8596 7576 1877 6448 8107 7912 1636 776 1362 5619 3694 353 3477 1800 20 20 200 3629 3412 1494 2990 2158 1146 4091
m/h 14 15 13 16 14 14 14 13 12 13 13 13 14 11 4 13 13 13 13 14 13
ha 10689 5501 178 2596 3643 986 178 88 296 2874 389 266 8 757 1274 840 20 9 2 1534 4352 2700 5193 1890 1026 90 1638
mt 2227 56042 16366 2650 1054 2154 32657 4632 2811 56 2867 19572 8724 160 33 20 7180 45284 38843 68376 21944 16420 1258 26984
m/h 13 15 17 15 12 7 11 12 11 7 4 15 10 8 4 5 10 14 13 12 16 14 16
ha 15610 9153 1021 7285 6389 3977 812 159 745 3994 425 1222 780 191 974 1524 1234 289 128 42 82 2264 5054 3424 6294 3731 2544 493 2621
mt 73263 61024 15094 62294 101299 54992 11820 2080 7989 42861 3454 14265 8235 2246 5206 22421 12550 1722 1183 450 681 14743 53899 48130 81992 53070 38126 7089 40260
m/h 5 7 15 9 16 14 15 13 11 11 8 12 11 12 5 15 10 6 9 11 8 7 11 14 13 14 15 14 15
ha 19 31 2 2 21 24 7 1 4 5 39 1 7 2 3
mt 257 440 30 20 322 298 72 5 8 7 31 7 71 12 31
m/h 14 14 15 10 15 12 10 5 2 1 1 9 10 6 10
ha 31 57 36 5 53 12 5 11 2 2 0 3 4 1 1
mt 359 815 489 57 567 132 63 17 16 18 2 24 13 11 12
m/h 12 14 14 11 11 11 13 2 8 9 10 8 3 11
ha 50 88 2 38 26 77 19 1 5 15 7 41 1 0 3 11 3 3 1
mt 616 1255 30 509 379 865 204 5 63 25 23 49 7 2 24 84 23 31 12
m/h 12 14 15 13 15 11 11 5 13 2 3 1 9 10 8 8 8 10 12
ha 243 242 15 121 140 305 5 2 9 7 8 20 5 5 3 10 13 2 5 40 20 29 87 26 21 3 105
mt 2673 2904 165 1735 1920 3050 50 20 85 84 64 200 40 50 30 90 108 16 25 95 180 289 870 295 225 36 1260
m/h 11 12 11 14 14 10 10 10 10 12 8 10 8 10 10 9 8 8 5 2 9 10 11 11 12 12
ha 200 180 25 150 180 150 22 5 3 24 100 300 28 58 23 5 100 80 1 1 4 70 70 36 120 110 65 20 80
mt 2160 2340 273 2093 3492 1238 135 50 2 189 875 2538 239 485 230 65 852 638 1 2 5 609 601 338 1062 1089 780 184 680
m/h 11 13 11 14 19 8 6 10 1 8 9 8 9 8 10 13 9 8 1 2 1 9 9 9 9 10 12 9 9
ha 381 401 5 132 415 401 10 5 5 40 5 81 20 5 5 25 30 5 2 2 91 61 41 112 77 120 17 93
mt 3810 4010 50 1584 4316 4010 100 35 55 240 35 656 240 35 50 150 150 50 10 18 728 488 410 1344 462 1320 187 930
m/h 10 10 10 12 10 10 10 7 11 6 7 8 12 7 10 6 5 10 5 9 8 8 10 12 6 11 11 10
ha 250 200 30 230 198 95 40 5 5 20 5 160 5 7 153 5 8 57 92 125 55 110 35 12 110
mt 3250 3400 360 3565 3168 1045 420 60 60 120 60 2240 80 91 1989 20 52 456 1196 2125 715 1760 700 180 1650
m/h 13 17 12 16 16 11 11 12 12 6 12 14 16 13 13 4 7 8 13 17 13 16 20 15 15
ha 91 105 16 23 75 61 12 3 4 4 15 12 5 5 4 16 18 2 0 2 1 12 18 13 13 19 15 9 21
mt 1100 1460 120 218 1215 839 95 20 33 21 135 138 22 13 11 170 190 19 2 19 2 90 199 155 170 262 206 111 230
m/h 12 14 8 10 16 14 8 8 9 5 9 11 4 3 3 11 11 10 7 10 5 8 11 12 14 14 12 11
ha 188 259 12 297 337 300 14 8 82 8 77 2 11 19 53 12 2 4 32 74 72 55 42 46 7 48
mt 3384 5827 150 8613 8425 3902 226 72 780 25 924 12 22 230 662 120 6 20 199 666 864 715 990 1058 66 1460
m/h 18 22 13 29 25 13 16 9 10 3 12 6 2 12 12 10 3 5 6 9 12 13 24 23 9 30
ha 439 352 5 155 242 70 3 8 21 227 103 4 50 15 35 44 52 132 10 23
mt 8147 7165 50 3100 3380 910 32 56 241 2951 1339 36 432 157 350 726 780 1980 98 232
Rautahat
Dhanusha
Mohattari
Kathmandu
Nuwakot
Dhading
Makawanpur
Kavre
Bhaktapur
Lalitpur
C. HILLS
C. TERAI
C. REGION
Manang
Mustang
Gorkha
Lamjung
Palpa
Syangja
Sarlahi
Bara
Chitwan
Parsa
Parbat
Tanahu
Kaski
W. MOUNTAIN
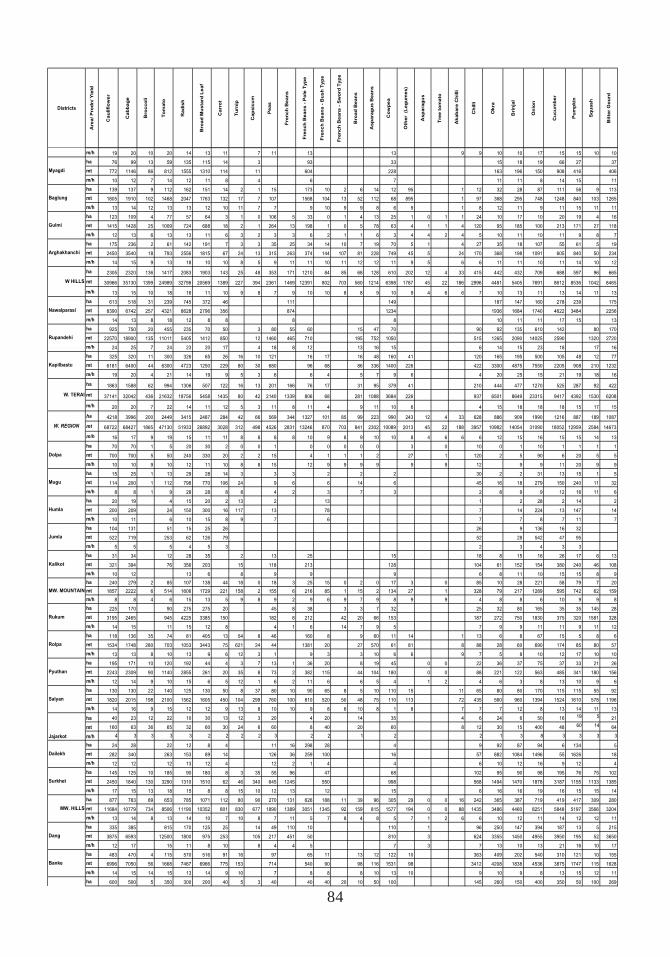
84
Districts
Are
a/ P
rod
n/ Y
ield
Ca
ulif
low
er
Ca
bb
ag
e
Bro
cc
oli
To
ma
to
Ra
dis
h
Bro
ad
Mu
sta
rd L
ea
f
Ca
rro
t
Tu
rnip
Ca
ps
icu
m
Pe
as
Fre
nc
h B
ea
ns
Fre
nc
h B
ea
ns
- P
ole
Ty
pe
Fre
nc
h B
ea
ns
- B
us
h T
yp
e
Fre
nc
h B
ea
ns
- S
wo
rd T
yp
e
Bro
ad
Be
an
s
As
pa
rag
us
Be
an
s
Co
wp
ea
Oth
er
(L
eg
um
es
)
As
pa
rag
us
Tre
e t
om
ato
Ak
ab
are
Ch
illi
Ch
illi
Ok
ra
Bri
nja
l
On
ion
Cu
cu
mb
er
Pu
mp
kin
Sq
ua
sh
Bit
ter
Go
urd
m/h 19 20 10 20 14 13 11 7 11 13 13 9 9 10 10 17 15 15 10 10
ha 76 99 13 59 135 115 14 3 93 33 15 18 19 66 27 37
mt 772 1146 86 812 1555 1310 114 11 604 228 163 196 150 908 416 406
m/h 10 12 7 14 12 11 8 4 6 7 11 11 8 14 15 11
ha 139 137 9 112 162 151 14 2 1 15 173 10 2 6 14 12 95 1 12 32 28 87 111 56 9 113
mt 1805 1910 102 1468 2047 1763 132 17 7 107 1568 104 13 52 112 68 895 1 97 368 295 748 1248 840 103 1265
m/h 13 14 12 13 13 12 10 11 7 7 9 10 9 9 8 6 9 1 8 12 11 9 11 15 11 11
ha 123 109 4 77 57 64 3 1 0 106 5 33 0 1 4 13 25 1 0 1 1 24 10 17 10 20 19 4 16
mt 1415 1428 25 1009 724 688 18 2 1 264 13 198 1 0 5 78 63 4 1 1 4 120 95 185 100 213 171 27 118
m/h 12 13 6 13 13 11 6 3 2 3 3 6 2 1 1 6 3 4 4 2 4 5 10 11 10 11 9 8 7
ha 175 236 2 61 142 191 7 3 3 35 25 34 14 10 7 19 70 5 1 4 27 35 18 107 55 61 5 19
mt 2450 3540 18 793 2556 1815 67 24 13 315 263 374 144 107 81 228 749 45 5 24 170 368 198 1091 605 840 50 234
m/h 14 15 9 13 18 10 10 8 5 9 11 11 10 11 12 12 11 9 5 6 6 11 11 10 11 14 10 12
ha 2305 2320 136 1417 2083 1903 143 25 48 353 171 1210 84 85 68 128 610 202 12 4 33 415 442 432 709 688 597 96 665
mt 30966 35130 1399 24989 32798 20569 1389 227 394 2361 1469 12391 802 703 560 1214 6398 1787 45 22 186 2996 4481 5405 7691 8612 8536 1042 8465
m/h 13 15 10 18 16 11 10 9 8 7 9 10 10 8 8 9 10 9 4 6 6 7 10 13 11 13 14 11 13
ha 613 518 31 239 745 372 46 111 149 187 147 160 278 239 175
mt 8390 6742 257 4321 8628 2796 356 874 1234 1936 1684 1740 4622 3484 2256
m/h 14 13 8 18 12 8 8 8 8 10 11 11 17 15 13
ha 925 750 20 455 235 70 50 3 80 55 60 15 47 70 90 92 135 610 142 80 170
mt 22570 18900 135 11011 5405 1412 850 12 1460 465 710 195 752 1050 515 1265 2090 14025 2590 1320 2720
m/h 24 25 7 24 23 20 17 4 18 8 12 13 16 15 6 14 15 23 18 17 16
ha 325 320 11 300 326 65 26 16 10 121 16 17 16 48 160 41 120 165 195 500 105 48 12 77
mt 6181 6400 44 6300 4723 1250 229 80 30 680 96 68 86 336 1400 226 422 3300 4875 7550 2205 908 210 1232
m/h 19 20 4 21 14 19 9 5 3 6 6 4 5 7 9 6 4 20 25 15 21 19 18 16
ha 1863 1588 62 994 1306 507 122 16 13 201 166 76 17 31 95 379 41 210 444 477 1270 525 287 92 422
mt 37141 32042 436 21632 18756 5458 1435 80 42 2140 1339 806 68 281 1088 3684 226 937 6501 8649 23315 9417 4392 1530 6208
m/h 20 20 7 22 14 11 12 5 3 11 8 11 4 9 11 10 6 4 15 18 18 18 15 17 15
ha 4218 3996 200 2449 3415 2487 284 42 66 569 344 1327 101 85 99 223 990 243 12 4 33 628 886 909 1990 1216 887 189 1087
mt 68722 68427 1865 47130 51933 26892 3028 312 498 4526 2831 13246 870 703 841 2302 10089 2013 45 22 188 3957 10982 14054 31090 18052 12959 2584 14673
m/h 16 17 9 19 15 11 11 8 8 8 8 10 9 8 9 10 10 8 4 6 6 6 12 15 16 15 15 14 13
ha 70 70 1 5 20 30 2 0 0 1 0 0 0 0 0 3 0 10 0 1 10 1 1 1 1
mt 700 700 5 50 240 330 20 2 2 15 4 1 1 1 2 27 1 120 2 5 90 6 20 5 5
m/h 10 10 9 10 12 11 10 8 8 15 12 9 9 9 9 9 9 12 9 9 11 20 9 9
ha 15 25 1 13 29 28 14 3 3 3 2 2 2 30 2 2 31 13 15 1 5
mt 114 200 1 112 798 770 106 24 9 6 6 14 6 45 16 18 279 150 240 11 32
m/h 8 8 1 9 28 28 8 8 4 2 3 7 3 2 8 9 9 12 16 11 6
ha 20 19 4 15 20 2 13 2 13 1 2 28 2 14 2
mt 200 209 24 150 300 16 117 13 78 7 14 224 13 147 14
m/h 10 11 6 10 15 8 9 7 6 7 7 8 7 11 7
ha 104 131 51 15 25 26 26 9 136 16 32
mt 522 719 253 62 126 79 52 28 542 47 95
m/h 5 5 5 4 5 3 2 3 4 3 3
ha 31 34 12 28 35 2 13 25 15 18 8 15 16 26 17 6 13
mt 321 394 76 356 203 15 118 213 128 104 61 152 154 380 240 46 108
m/h 10 12 13 6 8 9 9 9 6 8 11 10 15 15 8 9
ha 240 279 2 85 107 138 44 18 0 18 3 25 15 0 2 0 17 3 0 85 10 28 221 58 79 7 20
mt 1857 2222 6 514 1606 1729 221 158 2 155 6 216 85 1 15 2 134 27 1 328 79 217 1289 595 742 62 159
m/h 8 8 4 6 15 13 5 9 8 9 2 9 6 9 7 9 8 9 9 4 8 8 6 10 9 9 8
ha 225 170 90 275 275 20 45 8 38 3 3 7 32 25 32 80 165 35 35 145 28
mt 3195 2465 945 4225 3385 150 182 6 212 42 20 66 153 187 272 750 1830 375 320 1581 328
m/h 14 15 11 15 12 8 4 1 6 14 7 9 5 7 9 9 11 11 9 11 12
ha 118 136 35 74 81 405 13 54 8 46 160 8 9 60 11 14 1 13 6 8 67 15 5 8 6
mt 1534 1748 280 703 1053 3443 75 621 24 44 1381 20 27 570 61 81 8 88 28 60 690 174 85 80 57
m/h 13 13 8 10 13 9 6 12 3 1 9 3 3 10 6 6 9 7 5 8 10 12 17 10 10
ha 195 171 10 120 192 44 4 3 7 13 1 36 20 8 19 45 0 0 22 36 37 75 37 33 21 26
mt 2243 2309 90 1140 2855 261 20 35 8 73 2 382 115 44 104 180 0 0 88 221 122 563 485 341 180 156
m/h 12 14 9 10 15 6 5 12 1 6 2 11 6 6 5 4 1 2 4 6 3 8 13 10 9 6
ha 130 130 22 140 125 130 50 8 37 80 10 90 65 8 5 10 110 15 11 65 80 80 170 115 115 55 92
mt 1820 2015 198 2100 1562 1605 450 104 299 760 100 810 520 50 48 75 110 113 72 435 560 960 1394 1524 1610 578 1196
m/h 14 16 9 15 12 12 9 13 8 10 10 9 8 6 10 8 1 8 7 7 7 12 8 13 14 11 13
ha 40 23 12 22 10 30 13 12 3 20 4 20 14 35 4 6 24 6 50 16 19 5 21
mt 160 63 36 65 32 60 30 24 6 60 8 40 20 60 8 12 30 15 400 48 60 14 64
m/h 4 3 3 3 3 2 2 2 2 3 2 2 1 2 2 1 3 8 3 3 3 3
ha 24 28 22 12 8 4 11 16 298 28 4 9 92 87 94 6 134 5
mt 282 340 263 153 89 14 126 36 259 100 16 57 882 1084 1496 55 1626 18
m/h 12 12 12 13 12 4 12 2 1 4 4 6 10 12 16 9 12 4
ha 145 125 10 185 90 180 8 3 35 55 96 47 68 102 95 90 98 195 76 75 102
mt 2450 1840 130 3290 1310 1510 62 46 340 645 1245 550 998 568 1494 1470 1878 3187 1155 1133 1385
m/h 17 15 13 18 15 8 8 15 10 12 13 12 15 6 16 16 19 16 15 15 14
ha 877 783 89 653 785 1071 112 80 90 270 131 626 188 11 39 96 305 29 0 0 16 242 365 387 719 419 417 309 280
mt 11684 10779 734 8506 11190 10352 801 830 677 1890 1389 3051 1345 92 159 815 1577 194 0 0 88 1435 3486 4460 8251 5848 5197 3566 3204
m/h 13 14 8 13 14 10 7 10 8 7 11 5 7 8 4 8 5 7 1 2 6 6 10 12 11 14 12 12 11
ha 335 385 815 170 125 25 14 49 110 10 110 1 96 250 147 394 187 13 5 215
mt 3875 6593 12500 1800 975 253 105 217 451 50 810 3 624 3355 1450 4955 3950 195 52 3650
m/h 12 17 15 11 8 10 8 4 4 5 7 3 7 13 10 13 21 16 10 17
ha 483 470 4 115 570 516 91 16 97 65 11 13 12 122 10 363 409 202 540 310 121 10 155
mt 6996 7050 56 1668 7467 6966 775 153 714 540 90 98 116 1531 98 3412 4208 1838 4536 3875 1747 115 1628
m/h 14 15 14 15 13 14 9 10 7 8 8 8 10 13 10 9 10 9 8 13 15 12 11
ha 600 500 5 350 300 200 40 5 3 40 40 40 20 10 50 100 145 260 150 400 350 50 100 269
Myagdi
Baglung
W HILLS
Nawalparasi
Rupandehi
Mugu
Salyan
Gulmi
Arghakhanchi
Kapilbastu
W. TERAI
W. REGION
Dolpa
Jajarkot
Dailekh
Humla
Jumla
Kalikot
MW. MOUNTAIN
Rukum
Rolpa
Surkhet
Dang
Banke
Pyuthan
MW. HILLS
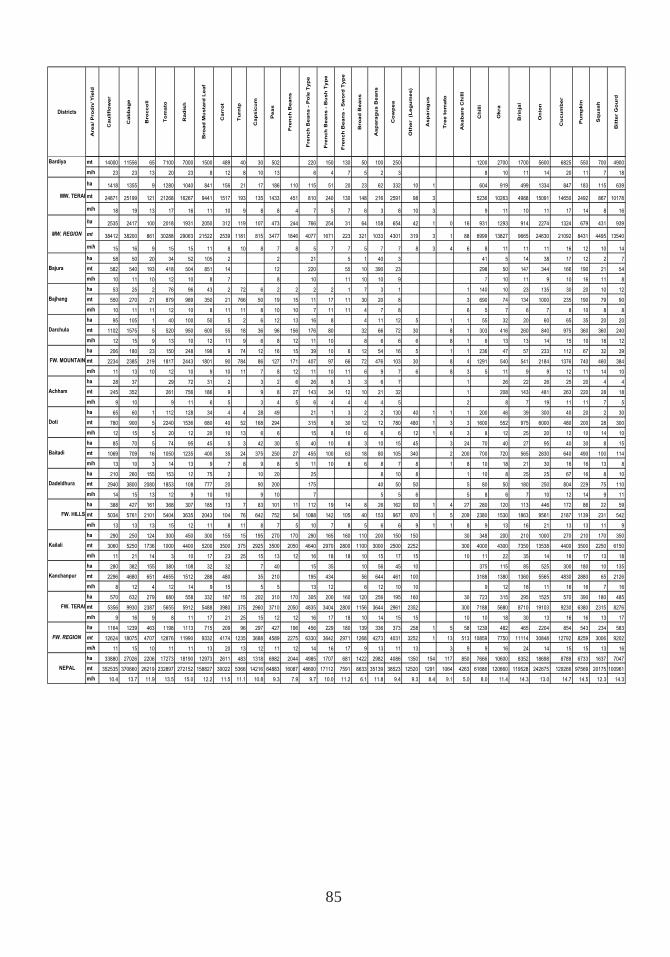
85
Districts
Are
a/ P
rod
n/ Y
ield
Ca
ulifl
ow
er
Ca
bb
ag
e
Bro
cc
oli
To
ma
to
Ra
dis
h
Bro
ad
Mu
sta
rd L
ea
f
Ca
rro
t
Tu
rnip
Ca
ps
icu
m
Pe
as
Fre
nc
h B
ea
ns
Fre
nc
h B
ea
ns
- P
ole
Ty
pe
Fre
nc
h B
ea
ns
- B
us
h T
yp
e
Fre
nc
h B
ea
ns
- S
wo
rd T
yp
e
Bro
ad
Be
an
s
As
pa
rag
us
Be
an
s
Co
wp
ea
Oth
er
(L
eg
um
es
)
As
pa
rag
us
Tre
e t
om
ato
Ak
ab
are
Ch
illi
Ch
illi
Ok
ra
Bri
nja
l
On
ion
Cu
cu
mb
er
Pu
mp
kin
Sq
ua
sh
Bit
ter
Go
urd
mt 14000 11556 65 7100 7000 1500 489 40 30 502 220 150 130 50 100 250 1200 2700 1700 5600 6825 550 700 4900
m/h 23 23 13 20 23 8 12 8 10 13 6 4 7 5 2 3 8 10 11 14 20 11 7 18
ha 1418 1355 9 1280 1040 841 156 21 17 186 110 115 51 20 23 62 332 10 1 604 919 499 1334 847 183 115 639
mt 24871 25199 121 21268 16267 9441 1517 193 135 1433 451 810 240 130 148 216 2591 98 3 5236 10263 4988 15091 14650 2492 867 10178
m/h 18 19 13 17 16 11 10 9 8 8 4 7 5 7 6 3 8 10 3 9 11 10 11 17 14 8 16
ha 2535 2417 100 2018 1931 2050 312 119 107 473 244 766 254 31 64 158 654 42 1 0 16 931 1293 914 2274 1324 679 431 939
mt 38412 38200 861 30288 29063 21522 2539 1181 815 3477 1846 4077 1671 223 321 1033 4301 319 3 1 88 6999 13827 9665 24630 21092 8431 4495 13540
m/h 15 16 9 15 15 11 8 10 8 7 8 5 7 7 5 7 7 8 3 4 6 8 11 11 11 16 12 10 14
ha 58 50 20 34 52 105 2 2 21 5 1 40 3 41 5 14 38 17 12 2 7
mt 582 540 193 418 504 851 14 12 220 55 10 390 23 298 50 147 344 166 190 21 54
m/h 10 11 10 12 10 8 7 8 10 11 10 10 9 7 10 11 9 10 16 11 8
ha 53 25 2 76 96 43 2 72 6 2 2 2 2 1 7 3 1 1 140 10 23 135 30 20 10 12
mt 550 270 21 879 989 350 21 766 50 19 15 11 17 11 30 20 8 3 690 74 134 1000 235 190 79 90
m/h 10 11 11 12 10 8 11 11 8 10 10 7 11 11 4 7 8 6 5 7 6 7 8 10 8 8
ha 95 105 1 40 100 50 5 2 6 12 13 16 8 4 11 12 5 1 1 55 32 20 60 65 35 20 20
mt 1102 1575 5 520 950 600 55 18 36 96 156 176 80 32 66 72 30 8 1 303 416 260 840 975 360 360 240
m/h 12 15 9 13 10 12 11 9 6 8 12 11 10 8 6 6 6 8 1 6 13 13 14 15 10 18 12
ha 206 180 23 150 248 198 9 74 12 16 15 39 10 6 12 54 16 5 1 1 236 47 57 233 112 67 32 39
mt 2234 2385 219 1817 2443 1801 90 784 86 127 171 407 97 66 72 476 103 30 8 4 1291 540 541 2184 1376 740 460 384
m/h 11 13 10 12 10 9 10 11 7 8 12 11 10 11 6 9 7 6 8 3 5 11 9 9 12 11 14 10
ha 28 37 29 72 31 2 3 2 6 26 8 3 3 6 7 1 26 22 26 25 20 4 4
mt 245 352 261 756 186 9 9 8 27 143 34 12 10 21 32 1 208 143 481 263 220 28 18
m/h 9 10 9 11 6 5 3 4 5 6 4 4 4 4 5 2 8 7 19 11 11 7 5
ha 65 60 1 112 128 34 4 4 28 49 21 1 3 2 2 130 40 1 1 1 200 46 39 300 40 20 2 30
mt 780 900 5 2240 1536 680 40 52 168 294 315 8 30 12 12 780 480 1 3 3 1600 552 975 6000 480 200 28 300
m/h 12 15 5 20 12 20 10 13 6 6 15 8 10 6 6 6 12 1 6 3 8 12 25 20 12 10 14 10
ha 85 70 5 74 95 45 5 3 42 30 5 40 10 8 3 10 15 45 3 24 70 40 27 95 40 30 8 15
mt 1069 709 16 1050 1235 400 35 24 375 250 27 455 100 63 18 80 105 340 2 200 700 720 565 2830 640 490 100 114
m/h 13 10 3 14 13 9 7 8 9 8 5 11 10 8 6 8 7 8 1 8 10 18 21 30 16 16 13 8
ha 210 260 155 153 12 75 2 10 20 25 8 10 8 1 10 8 25 25 67 16 8 10
mt 2940 3800 2080 1853 108 777 20 90 200 175 40 50 50 5 80 50 180 250 804 229 75 110
m/h 14 15 13 12 9 10 10 9 10 7 5 5 6 5 8 6 7 10 12 14 9 11
ha 388 427 161 368 307 185 13 7 83 101 11 112 19 14 8 26 162 93 1 4 27 280 120 113 446 172 86 22 59
mt 5034 5761 2101 5404 3635 2043 104 76 642 752 54 1088 142 105 40 153 967 870 1 5 209 2380 1530 1863 9561 2187 1139 231 542
m/h 13 13 13 15 12 11 8 11 8 7 5 10 7 8 5 6 6 9 1 1 8 9 13 16 21 13 13 11 9
ha 290 250 124 300 450 300 155 15 195 270 170 290 165 160 110 200 150 150 30 348 200 210 1000 270 210 170 350
mt 3060 5250 1736 1000 4400 5200 3500 375 2925 3500 2050 4640 2970 2800 1100 3000 2500 2252 300 4000 4300 7350 13538 4400 3500 2250 6150
m/h 11 21 14 3 10 17 23 25 15 13 12 16 18 18 10 15 17 15 10 11 22 35 14 16 17 13 18
ha 280 382 155 380 108 32 32 7 40 15 35 10 56 45 10 375 115 85 525 300 180 10 135
mt 2296 4680 651 4655 1512 288 480 35 210 195 434 56 644 461 100 3188 1380 1360 5565 4830 2880 65 2126
m/h 8 12 4 12 14 9 15 5 5 13 12 6 12 10 10 9 12 16 11 16 16 7 16
ha 570 632 279 680 558 332 187 15 202 310 170 305 200 160 120 256 195 160 30 723 315 295 1525 570 390 180 485
mt 5356 9930 2387 5655 5912 5488 3980 375 2960 3710 2050 4835 3404 2800 1156 3644 2961 2352 300 7188 5680 8710 19103 9230 6380 2315 8276
m/h 9 16 9 8 11 17 21 25 15 12 12 16 17 18 10 14 15 15 10 10 18 30 13 16 16 13 17
ha 1164 1239 463 1198 1113 715 209 96 297 427 196 456 229 180 139 336 373 258 1 5 58 1239 482 465 2204 854 543 234 583
mt 12624 18075 4707 12876 11990 9332 4174 1235 3688 4589 2275 6330 3642 2971 1268 4273 4031 3252 1 13 513 10859 7750 11114 30848 12792 8259 3006 9202
m/h 11 15 10 11 11 13 20 13 12 11 12 14 16 17 9 13 11 13 3 9 9 16 24 14 15 15 13 16
ha 33880 27026 2206 17273 18190 12973 2611 483 1318 6982 2044 4985 1707 681 1422 2982 4086 1350 154 117 850 7666 10600 8352 18698 8789 6733 1637 7047
mt 352535 370660 26219 232897 272152 158827 30022 5366 14216 64883 16087 48600 17112 7591 8633 35139 38523 12520 1291 1064 4263 61686 120660 119528 242675 129266 97569 20175 100961
m/h 10.4 13.7 11.9 13.5 15.0 12.2 11.5 11.1 10.8 9.3 7.9 9.7 10.0 11.2 6.1 11.8 9.4 9.3 8.4 9.1 5.0 8.0 11.4 14.3 13.0 14.7 14.5 12.3 14.3
NEPAL
Bajhang
FW. MOUNTAIN
Bardiya
FW. HILLS
Bajura
MW. TERAI
MW. REGION
FW. REGION
FW. TERAI
Kanchanpur
Kailali
Dadeldhura
Baitadi
Achham
Darchula
Doti
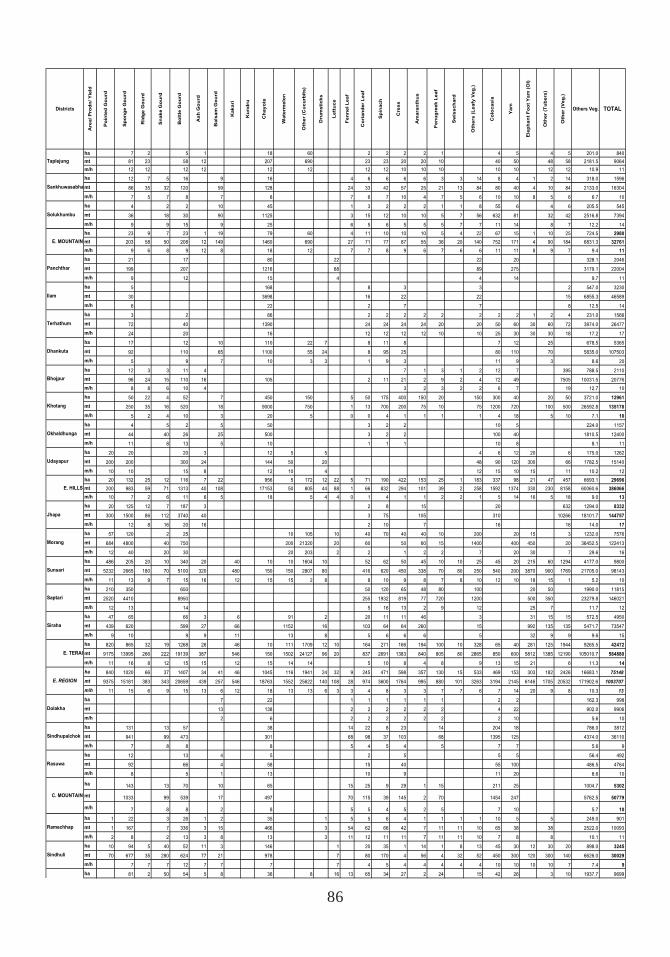
86
Districts
Are
a/ P
rod
n/ Y
ield
ha
mt
m/h
ha
mt
m/h
ha
mt
m/h
ha
mt
m/h
ha
mt
m/h
ha
mt
m/h
ha
mt
m/h
ha
mt
m/h
ha
mt
m/h
ha
mt
m/h
ha
mt
m/h
ha
mt
m/h
ha
mt
m/h
ha
mt
m/h
ha
mt
m/h
ha
mt
m/h
ha
mt
m/h
ha
mt
m/h
ha
mt
m/h
ha
mt
m/h
ha
mt
m/h
ha
mt
m/h
ha
mt
m/h
ha
mt
m/h
ha
mt
m/h
ha
mt
m/h
ha
Rasuwa
C. MOUNTAIN
Ramechhap
Sindhuli
Saptari
Siraha
E. TERAI
E. REGION
E. MOUNTAIN
Panchthar
Ilam
Terhathum
Dhankuta
Taplejung
Sankhuwasabha
Solukhumbu
Morang
Dolakha
Sindhupalchok
Bhojpur
Khotang
Okhaldhunga
Udayapur
E. HILLS
Jhapa
Sunsari
Po
inte
d G
ou
rd
Sp
on
ge
Go
urd
Rid
ge
Go
urd
Sn
ak
e G
ou
rd
Bo
ttle
Go
urd
As
h G
ou
rd
Ba
lsa
m G
ou
rd
Ka
ka
ri
Ku
nd
ru
Ch
ay
ote
Wa
term
elo
n
Oth
er
(Cu
cu
rbit
s)
Dru
ms
tic
ks
Le
ttu
ce
Fe
nn
el L
ea
f
Co
ria
nd
er
Le
af
Sp
ina
ch
Cre
ss
Am
ara
nth
us
Fe
nu
gre
ek
Le
af
Sw
iss
ch
ard
Oth
ers
(L
ea
fy V
eg
.)
Co
loc
as
ia
Ya
m
Ele
ph
an
t F
oo
t Y
am
(O
l)
Oth
er
(Tu
be
rs)
Oth
er
(Ve
g.)
Others Veg. TOTAL
7 2 5 1 18 60 2 2 2 2 1 4 5 4 5 201.0 840
81 23 58 12 207 690 23 23 20 20 10 40 50 48 58 2181.5 9064
12 12 12 12 12 12 12 12 10 10 10 10 10 12 12 10.9 11
12 7 5 16 9 16 4 6 6 6 6 3 3 14 8 4 1 2 14 318.0 1596
86 35 32 120 59 128 24 33 42 57 25 21 13 84 80 40 4 10 84 2133.0 16304
7 5 7 8 7 8 7 6 7 10 4 7 5 6 10 10 8 5 6 6.7 10
4 2 2 10 45 1 3 2 2 2 1 1 8 55 6 4 6 205.5 545
36 18 30 90 1125 3 15 12 10 10 5 7 56 632 81 32 42 2516.8 7394
9 9 15 9 25 6 5 6 5 5 5 7 7 11 14 8 7 12.2 14
23 9 7 23 1 19 79 60 4 11 10 10 10 5 4 22 67 15 1 10 25 724.5 2980
203 58 50 208 12 149 1460 690 27 71 77 87 55 36 20 140 752 171 4 90 184 6831.3 32761
9 6 8 9 12 8 18 12 7 7 8 9 6 7 6 6 11 11 8 9 7 9.4 11
21 17 80 22 22 20 328.1 2046
199 207 1216 88 89 275 3179.1 22004
9 12 15 4 4 14 9.7 11
5 168 8 3 3 2 547.0 3230
30 3698 16 22 22 15 6855.3 46589
6 22 2 7 7 8 12.5 14
3 2 86 2 2 2 2 2 2 2 2 1 2 4 231.0 1566
72 40 1390 24 24 24 24 20 20 50 60 30 60 72 3974.0 26477
24 20 16 12 12 12 12 10 10 25 30 30 30 18 17.2 17
17 12 10 110 22 7 8 11 8 7 12 25 678.5 5365
92 110 65 1100 55 24 8 95 25 80 110 70 5835.0 107503
5 9 7 10 3 3 1 9 3 11 9 3 8.6 20
12 3 3 11 4 7 1 3 1 2 12 7 395 788.5 2110
96 24 15 110 16 105 2 11 21 2 9 2 4 72 49 7505 10031.5 20776
8 8 6 10 4 3 2 3 2 2 6 7 19 12.7 10
50 22 4 52 7 450 150 5 50 175 400 150 20 150 300 40 20 50 3721.0 12961
250 35 16 520 18 9000 750 1 13 700 200 75 10 75 1200 720 100 500 26592.8 135178
5 2 4 10 3 20 5 0 0 4 1 1 1 1 4 18 5 10 7.1 10
4 5 2 5 50 3 2 2 10 5 224.0 1157
44 40 26 25 500 3 2 2 100 40 1810.5 12400
11 8 13 5 10 1 1 1 10 8 8.1 11
20 20 20 3 12 5 5 4 6 12 20 6 175.0 1262
200 200 300 24 144 50 20 48 90 120 300 66 1782.5 15140
10 10 15 8 12 10 4 12 15 10 15 11 10.2 12
20 132 25 12 116 7 22 956 5 172 12 22 5 71 190 422 153 25 1 183 337 98 21 47 457 6693.1 29696
200 983 59 71 1313 40 108 17153 50 805 44 88 1 66 832 294 101 39 2 258 1592 1374 330 230 8158 60060.6 386066
10 7 2 6 11 6 5 18 5 4 4 0 1 4 1 1 2 2 1 5 14 16 5 18 9.0 13
20 125 12 7 187 3 2 8 15 20 632 1294.0 8332
300 1500 86 112 3740 40 3 75 105 310 10266 18101.7 144757
12 8 16 20 16 2 10 7 16 16 14.0 17
57 120 2 25 10 105 10 40 70 40 40 10 200 20 15 3 1232.0 7576
684 4800 40 750 200 21320 20 60 50 60 15 1400 400 450 20 36452.5 122413
12 40 20 30 20 203 2 2 1 2 2 7 20 30 7 29.6 16
486 205 20 10 340 20 40 10 10 1604 10 52 62 50 45 10 10 25 45 20 215 60 1294 4177.0 9800
5232 2665 180 70 5100 320 480 150 150 2807 80 416 620 450 338 70 80 250 540 200 3870 900 1769 21705.0 98143
11 13 9 7 15 16 12 15 15 2 8 8 10 9 8 7 8 10 12 10 18 15 1 5.2 10
210 350 650 50 120 65 48 80 100 20 50 1990.0 11815
2520 4410 8950 255 1932 819 77 720 1200 500 350 23279.8 146021
12 13 14 5 16 13 2 9 12 25 7 11.7 12
47 65 66 3 6 91 2 20 11 11 46 3 31 15 15 572.5 4950
439 620 599 27 66 1152 16 103 64 64 260 15 992 135 135 5471.7 73547
9 10 9 9 11 13 8 5 6 6 6 5 32 9 9 9.6 15
820 865 32 19 1268 26 46 10 111 1709 12 10 164 271 166 194 100 10 328 65 40 281 125 1944 9265.5 42472
9175 13995 266 222 19139 387 546 150 1502 24127 96 20 837 2691 1383 840 805 80 2865 850 600 5812 1385 12190 105010.7 584880
11 16 8 12 15 15 12 15 14 14 5 10 8 4 8 9 13 15 21 6 11.3 14
840 1020 66 37 1407 34 41 46 1045 116 1941 24 32 9 245 471 598 357 130 15 533 469 153 303 182 2426 16683.1 75148
9375 15181 383 343 20659 439 257 546 18763 1552 25622 140 108 28 974 3600 1764 995 880 101 3263 3194 2145 6146 1705 20532 171902.6 1003707
11 15 6 9 15 13 6 12 18 13 13 6 3 3 4 8 3 3 7 7 6 7 14 20 9 8 10.3 13
7 22 1 1 1 1 1 1 2 2 162.3 998
13 138 2 2 2 2 2 2 4 22 902.0 9906
2 6 2 2 2 2 2 2 2 10 5.6 10
131 13 57 38 14 22 8 23 14 204 18 786.0 3812
941 99 473 301 68 98 37 103 68 1395 125 4374.0 36110
7 8 8 8 5 4 5 4 5 7 7 5.6 9
12 13 4 5 2 5 5 5 56.4 492
92 66 4 58 15 40 55 100 486.5 4764
8 5 1 13 10 9 11 20 8.6 10
143 13 70 10 65 15 25 9 29 1 15 211 25 1004.7 5302
1033 99 539 17 497 70 115 39 145 2 70 1454 247 5762.5 50779
7 8 8 2 8 5 5 4 5 2 5 7 10 5.7 10
1 22 3 26 1 2 35 1 5 5 6 4 1 1 1 1 10 5 5 249.0 901
1 167 7 336 3 15 466 3 54 62 66 42 7 11 11 10 65 38 38 2522.0 10093
2 8 2 13 3 8 13 3 11 12 11 11 7 11 11 10 7 8 8 10.1 11
10 94 5 40 52 11 3 146 1 20 35 1 14 1 8 13 45 30 12 30 20 898.0 3245
70 677 35 280 624 77 21 978 7 80 170 4 56 4 32 52 450 300 120 300 140 6626.0 30029
7 7 7 12 7 7 7 7 4 5 4 4 4 4 4 10 10 10 10 7 7.4 9
81 2 50 54 5 8 36 8 16 13 65 34 27 2 24 15 42 26 3 10 1937.7 9699
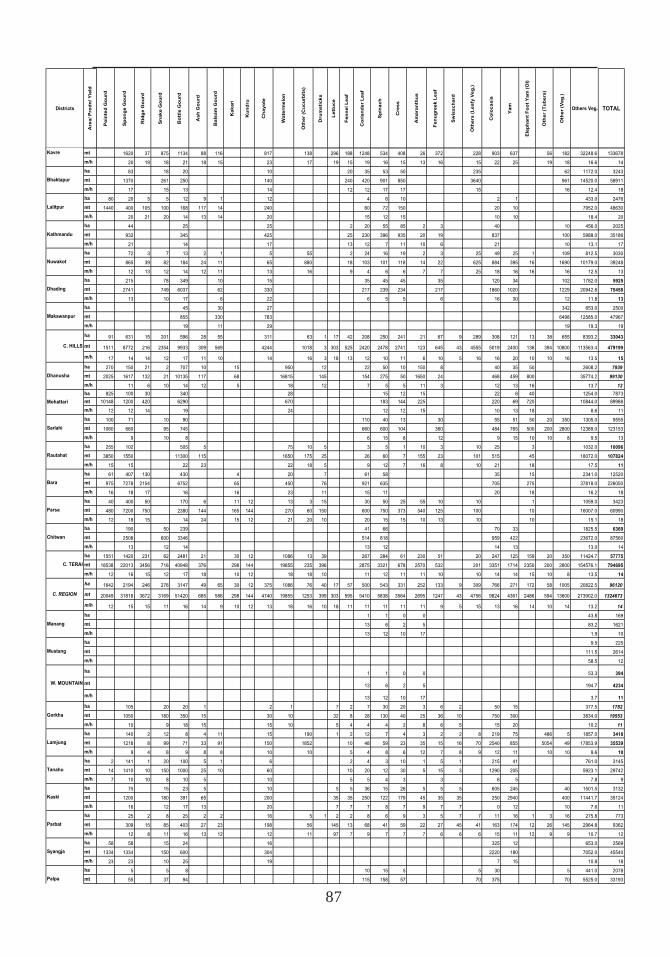
87
Districts
Are
a/ P
rod
n/ Y
ield
mt
m/h
ha
mt
m/h
ha
mt
m/h
ha
mt
m/h
ha
mt
m/h
ha
mt
m/h
ha
mt
m/h
ha
mt
m/h
ha
mt
m/h
ha
mt
m/h
ha
mt
m/h
ha
mt
m/h
ha
mt
m/h
ha
mt
m/h
ha
mt
m/h
ha
mt
m/h
ha
mt
m/h
ha
mt
m/h
ha
mt
m/h
ha
mt
m/h
ha
mt
m/h
ha
mt
m/h
ha
mt
m/h
ha
mt
m/h
ha
mt
m/h
ha
mt
m/h
ha
mt
Rautahat
Dhanusha
Mohattari
Kathmandu
Nuwakot
Dhading
Makawanpur
Kavre
Bhaktapur
Lalitpur
C. HILLS
C. TERAI
C. REGION
Manang
Mustang
Gorkha
Lamjung
Palpa
Syangja
Sarlahi
Bara
Chitwan
Parsa
Parbat
Tanahu
Kaski
W. MOUNTAIN
Po
inte
d G
ou
rd
Sp
on
ge
Go
urd
Rid
ge
Go
urd
Sn
ak
e G
ou
rd
Bo
ttle
Go
urd
As
h G
ou
rd
Ba
lsa
m G
ou
rd
Ka
ka
ri
Ku
nd
ru
Ch
ay
ote
Wa
term
elo
n
Oth
er
(Cu
cu
rbit
s)
Dru
ms
tic
ks
Le
ttu
ce
Fe
nn
el L
ea
f
Co
ria
nd
er
Le
af
Sp
ina
ch
Cre
ss
Am
ara
nth
us
Fe
nu
gre
ek
Le
af
Sw
iss
ch
ard
Oth
ers
(L
ea
fy V
eg
.)
Co
loc
as
ia
Ya
m
Ele
ph
an
t F
oo
t Y
am
(O
l)
Oth
er
(Tu
be
rs)
Oth
er
(Ve
g.)
Others Veg. TOTAL
1620 37 875 1134 88 116 817 138 296 188 1248 534 408 26 372 228 903 637 56 182 32248.6 133678
20 19 18 21 18 15 23 17 19 15 19 16 15 13 16 15 22 25 19 18 16.6 14
83 18 20 10 20 35 53 50 235 62 1172.0 3243
1370 261 250 140 240 420 901 850 3640 961 14520.0 58911
17 15 13 14 12 12 17 17 15 16 12.4 18
80 20 5 5 12 9 1 12 4 6 10 2 1 433.0 2476
1440 400 105 100 168 117 14 240 60 72 150 20 10 7952.0 48630
20 21 20 14 13 14 20 15 12 15 10 10 18.4 20
44 25 25 2 20 55 85 2 3 40 10 456.0 2025
932 345 425 25 230 396 935 20 19 837 100 5988.0 35186
21 14 17 13 12 7 11 10 6 21 10 13.1 17
72 3 7 13 2 1 5 55 2 24 16 19 2 3 25 49 25 1 109 812.5 3030
865 39 82 184 24 11 65 880 18 103 101 118 14 22 625 884 395 16 1690 10179.0 39248
12 13 12 14 12 11 13 16 9 4 6 6 7 7 25 18 16 16 16 12.5 13
215 78 349 10 15 35 45 45 35 120 34 102 1782.0 5925
2741 749 6037 62 330 217 239 234 217 1860 1020 1229 20942.8 75458
13 10 17 6 22 6 5 5 6 16 30 12 11.8 13
45 30 27 342 653.0 2500
855 330 783 6498 12585.0 47967
19 11 29 19 19.3 19
91 631 15 201 596 28 55 311 63 1 17 42 208 250 241 21 67 9 289 308 121 13 38 655 8393.2 33043
1511 8772 216 2354 9933 309 569 4244 1018 3 303 525 2420 2478 2741 123 645 43 4555 5019 2400 136 394 10800 113563.4 479199
17 14 14 12 17 11 10 14 16 3 18 13 12 10 11 6 10 5 16 16 20 10 10 16 13.5 15
270 150 21 2 707 10 15 950 12 22 50 10 150 8 40 35 50 2608.2 7939
2025 1617 132 21 10135 117 68 16815 145 154 275 50 1650 24 468 459 800 35774.2 99130
11 6 10 14 12 5 18 12 7 5 5 11 3 12 13 16 13.7 12
825 100 30 340 28 15 12 15 22 6 40 1254.0 7873
10148 1200 420 6290 670 183 144 225 220 69 720 10844.0 89988
12 12 14 19 24 12 12 15 10 13 18 8.6 11
100 71 10 90 110 40 13 30 55 51 50 20 350 1305.0 9555
1060 660 95 745 660 600 104 360 484 765 500 200 2800 12389.0 123153
9 10 8 6 15 8 12 9 15 10 10 8 9.5 13
255 102 505 5 75 10 5 3 5 1 10 3 10 25 3 1032.0 10096
3850 1550 11300 115 1650 175 25 26 60 7 155 23 101 515 45 18072.0 107824
15 15 22 23 22 18 5 9 12 7 16 8 10 21 18 17.5 11
61 407 130 430 4 20 7 61 58 35 15 2341.0 12520
975 7278 2154 6752 65 450 76 921 635 705 275 37818.0 226050
16 18 17 16 16 23 11 15 11 20 18 16.2 18
40 400 50 170 6 11 12 13 3 15 30 50 25 55 10 10 1 1059.0 3423
480 7200 750 2380 144 165 144 270 60 150 600 750 373 540 125 100 10 16007.0 60990
12 18 15 14 24 15 12 21 20 10 20 15 15 10 13 10 10 15.1 18
190 50 239 41 66 70 33 1825.5 6369
2508 600 3346 514 818 959 422 23672.0 87560
13 12 14 13 12 14 13 13.0 14
1551 1420 231 62 2481 21 30 12 1086 13 39 267 284 61 230 51 20 247 125 159 20 350 11424.7 57775
18538 22013 3456 716 40948 376 298 144 19855 235 396 2875 3321 678 2570 532 201 3351 1714 2350 200 2800 154576.1 794695
12 16 15 12 17 18 10 12 18 18 10 11 12 11 11 10 10 14 14 15 10 8 13.5 14
1642 2194 246 276 3147 49 65 30 12 375 1086 76 40 17 57 500 543 331 252 133 9 309 766 271 172 58 1005 20822.5 96120
20049 31818 3672 3169 51420 685 586 298 144 4740 19855 1253 399 303 595 5410 5838 3564 2695 1247 43 4756 9824 4361 2486 594 13600 273902.0 1324673
12 15 15 11 16 14 9 10 12 13 18 16 10 18 11 11 11 11 11 9 5 15 13 16 14 10 14 13.2 14
1 1 0 0 43.8 169
13 6 2 5 83.2 1621
13 12 10 17 1.9 10
9.5 225
111.5 2614
58.5 12
1 1 0 0 53.3 394
13 6 2 5 194.7 4234
13 12 10 17 3.7 11
105 20 20 1 2 1 7 2 7 30 20 3 6 2 50 15 377.5 1782
1050 180 350 15 30 10 32 8 28 130 40 25 36 10 750 300 3834.0 19553
10 9 18 15 15 10 5 4 4 4 2 8 6 5 15 20 10.2 11
140 2 12 8 4 11 15 190 1 2 12 7 4 3 2 2 8 219 75 486 5 1857.0 3418
1218 8 99 71 33 91 150 1852 10 48 59 23 35 15 16 70 2540 855 5054 49 17853.9 35539
9 4 8 9 8 8 10 10 5 4 8 6 12 7 8 9 12 11 10 10 9.6 10
2 141 1 20 100 5 1 6 2 4 3 10 1 5 1 215 41 761.0 3145
14 1410 10 150 1000 25 10 60 10 20 12 30 5 15 3 1290 205 5923.1 29742
7 10 10 8 10 5 10 5 5 4 3 3 6 5 7.8 9
75 15 23 5 10 5 5 36 15 26 5 5 5 605 245 40 1501.5 3132
1200 180 391 65 200 35 35 250 122 179 45 35 35 250 2940 400 11441.7 35124
16 12 17 13 20 7 7 7 8 7 9 7 7 0 12 10 7.6 11
25 2 8 25 2 2 16 5 1 2 2 8 6 9 3 5 7 7 11 16 1 3 16 275.8 773
309 15 85 403 27 23 198 56 145 13 68 41 59 22 27 45 41 163 174 12 26 145 2964.8 9362
12 8 11 16 13 12 12 11 97 7 9 7 7 7 6 6 6 15 11 12 9 9 10.7 12
58 58 15 24 16 325 12 653.0 2569
1334 1334 150 600 304 2220 180 7052.0 45540
23 23 10 25 19 7 15 10.8 18
5 5 8 10 15 5 5 30 5 441.0 2078
55 37 94 115 158 57 70 375 70 5525.0 33193
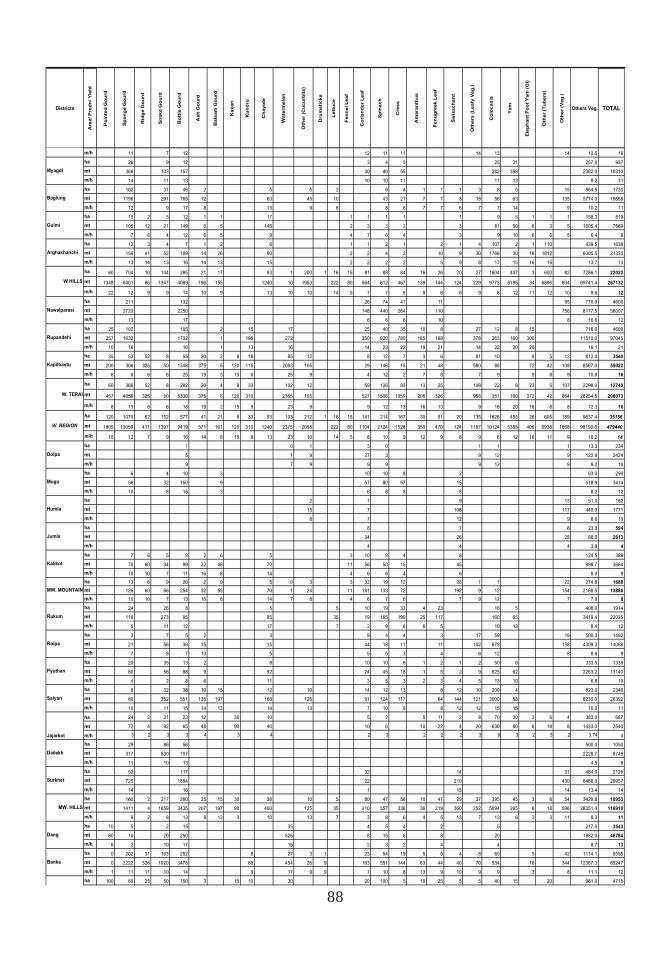
88
Districts
Are
a/ P
rod
n/ Y
ield
m/h
ha
mt
m/h
ha
mt
m/h
ha
mt
m/h
ha
mt
m/h
ha
mt
m/h
ha
mt
m/h
ha
mt
m/h
ha
mt
m/h
ha
mt
m/h
ha
mt
m/h
ha
mt
m/h
ha
mt
m/h
ha
mt
m/h
ha
mt
m/h
ha
mt
m/h
ha
mt
m/h
ha
mt
m/h
ha
mt
m/h
ha
mt
m/h
ha
mt
m/h
ha
mt
m/h
ha
mt
m/h
ha
mt
m/h
ha
mt
m/h
ha
mt
m/h
ha
mt
m/h
ha
Myagdi
Baglung
W HILLS
Nawalparasi
Rupandehi
Mugu
Salyan
Gulmi
Arghakhanchi
Kapilbastu
W. TERAI
W. REGION
Dolpa
Jajarkot
Dailekh
Humla
Jumla
Kalikot
MW. MOUNTAIN
Rukum
Rolpa
Surkhet
Dang
Banke
Pyuthan
MW. HILLS
Po
inte
d G
ou
rd
Sp
on
ge
Go
urd
Rid
ge
Go
urd
Sn
ak
e G
ou
rd
Bo
ttle
Go
urd
As
h G
ou
rd
Ba
lsa
m G
ou
rd
Ka
ka
ri
Ku
nd
ru
Ch
ay
ote
Wa
term
elo
n
Oth
er
(Cu
cu
rbit
s)
Dru
ms
tic
ks
Le
ttu
ce
Fe
nn
el L
ea
f
Co
ria
nd
er
Le
af
Sp
ina
ch
Cre
ss
Am
ara
nth
us
Fe
nu
gre
ek
Le
af
Sw
iss
ch
ard
Oth
ers
(L
ea
fy V
eg
.)
Co
loc
as
ia
Ya
m
Ele
ph
an
t F
oo
t Y
am
(O
l)
Oth
er
(Tu
be
rs)
Oth
er
(Ve
g.)
Others Veg. TOTAL
11 7 12 12 11 11 14 13 14 12.5 16
26 9 12 3 4 5 25 31 257.0 937
368 103 157 30 40 55 282 398 2362.0 10310
14 11 13 10 10 11 11 13 9.2 11
102 31 46 2 5 5 2 6 4 1 1 1 3 8 5 15 564.5 1733
1196 291 765 12 63 45 10 43 21 7 7 3 18 56 63 135 5774.0 19868
12 9 17 8 13 9 6 8 6 7 7 6 7 7 14 9 10.2 11
15 2 5 12 1 1 17 1 1 1 1 1 9 5 1 1 1 158.3 819
105 12 21 149 6 5 145 2 3 3 2 3 81 50 6 3 5 1005.4 7569
7 6 4 12 6 5 9 4 7 6 4 3 9 10 6 6 5 6.4 9
12 3 4 7 1 2 6 1 1 2 1 2 1 4 107 2 1 110 439.5 1638
156 41 52 109 14 26 90 2 2 4 2 10 9 30 1766 30 16 1812 6005.5 21333
13 14 13 16 14 13 15 2 2 2 2 5 9 8 17 15 16 16 13.7 13
60 704 10 144 285 21 17 93 1 200 1 16 15 81 88 84 16 26 20 27 1604 447 3 600 82 7286.1 22022
1348 8401 86 1347 4089 196 155 1240 10 1953 222 80 564 612 467 139 144 124 229 9773 5195 34 6896 804 69741.4 267132
22 12 9 9 14 10 9 13 10 10 14 5 7 7 6 9 6 6 9 6 12 11 12 10 9.6 12
211 132 26 74 41 11 95 770.0 4600
2720 2250 148 440 264 110 756 8177.5 56007
13 17 6 6 6 10 8 10.6 12
25 102 105 2 15 17 25 40 35 10 8 27 12 8 15 716.0 4600
257 1632 1732 1 195 272 350 920 780 185 168 378 263 160 300 11510.0 97045
10 16 16 1 13 16 14 23 22 19 21 14 22 20 20 16.1 21
35 53 52 8 55 20 2 8 18 85 12 8 12 7 3 6 81 10 8 5 12 812.0 3540
200 306 325 50 1348 375 5 120 115 2093 105 29 146 15 21 48 580 88 72 42 108 8567.0 55022
6 6 6 6 25 19 3 15 6 25 9 4 12 2 7 8 7 9 9 8 9 10.6 16
60 366 52 8 292 20 4 8 33 102 12 59 126 83 13 25 108 22 8 23 5 107 2298.0 12740
457 4658 325 50 5330 375 6 120 310 2365 105 527 1506 1059 206 326 958 351 160 372 42 864 28254.5 208073
8 13 6 6 18 19 2 15 9 23 9 9 12 13 16 13 9 16 20 16 8 8 12.3 16
120 1070 62 152 577 41 21 8 33 93 103 212 1 16 15 141 214 167 30 51 20 135 1626 455 26 605 189 9637.4 35156
1805 13059 411 1397 9419 571 161 120 310 1240 2375 2058 222 80 1104 2124 1528 350 470 124 1187 10124 5355 406 6938 1668 98190.6 479440
15 12 7 9 16 14 8 15 9 13 23 10 14 5 8 10 9 12 9 6 9 6 12 16 11 9 10.2 14
1 0 1 3 0 1 1 1 13.3 234
5 1 9 27 3 9 12 9 122.9 2424
9 7 9 9 9 9 12 9 9.2 10
6 4 10 3 10 10 8 2 63.0 290
56 32 150 9 57 80 57 15 518.9 3414
10 8 15 3 6 8 8 8 8.2 12
2 1 9 13 51.0 182
15 7 106 117 440.0 1771
8 7 12 9 8.6 10
8 7 8 23.0 594
34 26 28 88.0 2613
4 4 4 3.8 4
7 6 5 9 2 6 5 3 10 9 4 8 124.5 389
70 60 34 99 32 46 70 11 56 50 15 45 998.7 3664
10 10 7 11 16 8 14 4 6 6 4 6 8.0 9
13 6 9 20 2 9 5 0 3 3 32 19 12 26 1 1 22 274.8 1688
126 60 66 254 32 55 70 1 24 11 181 133 72 192 9 12 154 2168.5 13886
10 10 7 13 16 6 14 7 8 4 6 7 6 7 9 12 7 7.9 8
24 26 8 5 5 10 19 33 4 23 16 5 406.0 1914
116 273 95 85 35 19 165 190 25 117 160 65 3419.4 22035
5 11 12 17 7 2 9 6 6 5 10 13 8.4 12
3 7 5 2 3 9 4 4 3 17 59 19 500.3 1492
21 56 36 15 15 44 18 11 11 102 679 158 4309.3 14098
7 8 7 10 5 5 5 3 4 6 12 8 8.6 9
20 35 13 2 8 10 10 6 1 2 1 2 50 6 333.5 1339
80 56 98 9 92 24 45 18 1 5 2 9 625 62 2263.2 13140
4 2 8 6 11 3 5 3 2 3 4 5 13 10 6.8 10
8 32 38 10 15 12 10 14 12 13 8 12 10 200 4 823.0 2346
80 352 551 135 197 168 125 91 124 117 64 144 121 3000 58 8230.0 26392
10 11 15 14 13 14 13 7 10 9 8 12 12 15 15 10.0 11
24 2 31 23 12 30 10 5 2 5 11 2 8 70 30 3 6 4 383.0 687
72 4 92 65 48 90 40 10 6 10 22 4 20 630 80 6 18 8 1433.0 2540
3 2 3 3 4 3 4 2 3 2 2 2 3 9 3 2 3 2 3.74 4
29 86 56 500.0 1050
317 830 707 2228.7 8749
11 10 13 4.5 8
52 117 32 14 31 484.0 2126
725 1884 22 210 430 6468.0 29957
14 16 1 15 14 13.4 14
160 2 217 260 25 15 30 38 10 5 80 47 56 10 47 29 37 395 45 3 6 54 3429.8 10953
1411 4 1659 3435 207 197 90 400 125 35 210 357 336 36 219 360 252 5094 265 6 18 596 28351.4 116910
9 2 8 13 8 13 3 10 13 7 3 8 6 4 5 13 7 13 6 2 3 11 8.3 11
10 5 2 15 35 4 5 4 2 5 217.0 3543
60 10 20 250 525 8 15 6 8 20 1882.0 46784
6 2 10 17 15 2 3 2 4 4 8.7 13
0 202 31 103 252 8 27 3 1 23 54 19 5 5 4 8 60 5 42 1114.1 5555
0 2222 326 1020 3478 69 454 26 9 163 551 144 63 44 40 70 534 16 344 12367.3 65247
1 11 11 10 14 9 17 9 9 7 10 8 13 9 10 9 9 3 8 11.1 12
100 60 25 50 150 3 15 10 30 20 100 5 10 25 5 5 40 15 20 961.0 4715
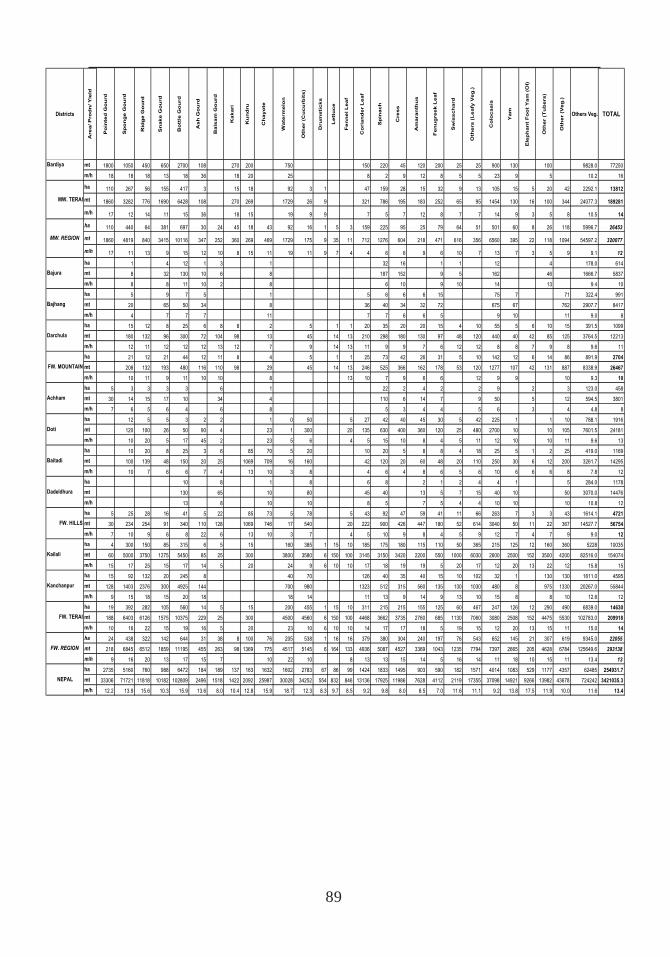
89
Districts
Are
a/ P
rod
n/ Y
ield
mt
m/h
ha
mt
m/h
ha
mt
m/h
ha
mt
m/h
ha
mt
m/h
ha
mt
m/h
ha
mt
m/h
ha
mt
m/h
ha
mt
m/h
ha
mt
m/h
ha
mt
m/h
ha
mt
m/h
ha
mt
m/h
ha
mt
m/h
ha
mt
m/h
ha
mt
m/h
ha
mt
m/h
NEPAL
Bajhang
FW. MOUNTAIN
Bardiya
FW. HILLS
Bajura
MW. TERAI
MW. REGION
FW. REGION
FW. TERAI
Kanchanpur
Kailali
Dadeldhura
Baitadi
Achham
Darchula
Doti
Po
inte
d G
ou
rd
Sp
on
ge
Go
urd
Rid
ge
Go
urd
Sn
ak
e G
ou
rd
Bo
ttle
Go
urd
As
h G
ou
rd
Ba
lsa
m G
ou
rd
Ka
ka
ri
Ku
nd
ru
Ch
ay
ote
Wa
term
elo
n
Oth
er
(Cu
cu
rbit
s)
Dru
ms
tic
ks
Le
ttu
ce
Fe
nn
el L
ea
f
Co
ria
nd
er
Le
af
Sp
ina
ch
Cre
ss
Am
ara
nth
us
Fe
nu
gre
ek
Le
af
Sw
iss
ch
ard
Oth
ers
(L
ea
fy V
eg
.)
Co
loc
as
ia
Ya
m
Ele
ph
an
t F
oo
t Y
am
(O
l)
Oth
er
(Tu
be
rs)
Oth
er
(Ve
g.)
Others Veg. TOTAL
1800 1050 450 650 2700 108 270 200 750 150 220 45 120 200 25 25 900 130 100 9828.0 77250
18 18 18 13 18 36 18 20 25 8 2 9 12 8 5 5 23 9 5 10.2 16
110 267 56 155 417 3 15 18 92 3 1 47 159 28 15 32 9 13 105 15 5 20 42 2292.1 13812
1860 3282 776 1690 6428 108 270 269 1729 26 9 321 786 195 183 252 65 95 1454 130 16 100 344 24077.3 189281
17 12 14 11 15 36 18 15 19 9 9 7 5 7 12 8 7 7 14 9 3 5 8 10.5 14
110 440 64 381 697 30 24 45 18 43 92 16 1 5 3 159 225 95 25 79 64 51 501 60 8 26 118 5996.7 26453
1860 4819 840 3415 10116 347 252 360 269 469 1729 175 9 35 11 712 1276 604 218 471 616 356 6560 395 22 118 1094 54597.2 320077
17 11 13 9 15 12 10 8 15 11 19 11 9 7 4 4 6 6 9 6 10 7 13 7 3 5 9 9.1 12
1 4 12 1 3 1 32 16 1 1 12 4 178.0 614
8 32 130 10 6 8 187 152 9 5 162 46 1666.7 5837
8 8 11 10 2 8 6 10 9 10 14 13 9.4 10
5 9 7 5 1 5 6 6 6 15 75 7 71 322.4 991
20 65 50 34 8 36 40 34 32 72 675 67 762 2907.7 8417
4 7 7 7 11 7 7 6 6 5 9 10 11 9.0 8
15 12 8 25 6 8 8 2 5 1 1 20 35 20 20 15 4 10 55 5 6 10 15 391.5 1099
180 132 96 300 72 104 98 13 45 14 13 210 298 180 130 97 48 120 440 40 42 85 125 3764.5 12213
12 11 12 12 12 13 12 7 9 14 13 11 9 9 7 6 12 12 8 8 7 9 8 9.6 11
21 12 21 44 12 11 8 4 5 1 1 25 73 42 26 31 5 10 142 12 6 14 86 891.9 2704
208 132 193 480 116 110 98 29 45 14 13 246 525 366 162 178 53 120 1277 107 42 131 887 8338.9 26467
10 11 9 11 10 10 8 13 10 7 9 6 6 12 9 9 10 9.3 10
5 3 3 3 3 6 1 22 2 4 2 2 9 2 3 123.0 458
30 14 15 17 10 34 4 110 6 14 7 9 50 5 12 594.5 3801
7 6 5 6 4 6 8 5 3 4 4 5 6 3 4 4.8 8
12 5 5 3 2 2 1 0 50 5 27 42 40 45 30 5 42 225 1 1 10 788.1 1916
120 100 26 50 90 4 23 1 300 20 135 630 400 360 120 25 480 2700 10 10 105 7601.5 24181
10 20 5 17 45 2 23 5 6 4 5 15 10 8 4 5 11 12 10 10 11 9.6 13
10 20 8 25 3 6 85 70 5 20 10 20 5 8 8 4 18 25 5 1 2 25 419.0 1169
100 139 48 150 20 25 1069 709 16 160 42 120 20 60 48 20 110 250 30 6 12 200 3261.7 14295
10 7 6 6 7 4 13 10 3 8 4 6 4 8 6 5 6 10 6 6 6 8 7.8 12
10 8 1 8 6 8 2 1 2 4 4 1 5 284.0 1178
130 65 10 80 45 40 13 5 7 15 40 10 50 3070.0 14476
13 8 10 10 8 5 7 5 4 4 10 10 10 10.8 12
5 25 28 16 41 5 22 85 73 5 78 5 43 92 47 59 41 11 66 263 7 3 3 43 1614.1 4721
30 234 254 91 340 110 128 1069 746 17 540 20 222 900 426 447 180 52 614 3040 50 11 22 367 14527.7 56754
7 10 9 6 8 22 6 13 10 3 7 4 5 10 9 8 4 5 9 12 7 4 7 9 9.0 12
4 300 150 85 315 6 5 15 160 385 1 15 10 185 175 180 115 110 50 365 215 125 12 160 360 5228 10035
60 5000 3750 1275 5450 85 25 300 3800 3580 6 150 100 3145 3150 3420 2200 550 1000 6030 2600 2500 152 3500 4200 82516.0 154074
15 17 25 15 17 14 5 20 24 9 6 10 10 17 18 19 19 5 20 17 12 20 13 22 12 15.8 15
15 92 132 20 245 8 40 70 126 40 35 40 15 10 102 32 1 130 130 1611.0 4595
128 1403 2376 300 4925 144 700 980 1323 512 315 560 135 130 1030 480 8 975 1330 20267.0 55844
9 15 18 15 20 18 18 14 11 13 9 14 9 13 10 15 8 8 10 12.6 12
19 392 282 105 560 14 5 15 200 455 1 15 10 311 215 215 155 125 60 467 247 126 12 290 490 6839.0 14630
188 6403 6126 1575 10375 229 25 300 4500 4560 6 150 100 4468 3662 3735 2760 685 1130 7060 3080 2508 152 4475 5530 102783.0 209918
10 16 22 15 19 16 5 20 23 10 6 10 10 14 17 17 18 5 19 15 12 20 13 15 11 15.0 14
24 438 322 142 644 31 38 8 100 76 205 538 1 16 16 379 380 304 240 197 76 543 652 145 21 307 619 9345.0 22055
218 6845 6512 1859 11195 455 263 98 1369 775 4517 5145 6 164 133 4936 5087 4527 3369 1043 1235 7794 7397 2665 205 4628 6784 125649.6 293138
9 16 20 13 17 15 7 10 22 10 8 13 13 15 14 5 16 14 11 18 10 15 11 13.4 13
2735 5160 760 988 6472 184 189 137 163 1632 1602 2783 67 86 99 1424 1833 1495 903 590 182 1571 4014 1083 529 1177 4357 62485 254931.7
33306 71721 11818 10182 102809 2496 1518 1422 2092 25987 30028 34252 554 832 846 13136 17925 11986 7628 4112 2119 17355 37098 14921 9266 13982 43678 724242 3421035.3
12.2 13.9 15.6 10.3 15.9 13.6 8.0 10.4 12.8 15.9 18.7 12.3 8.3 9.7 8.5 9.2 9.8 8.0 8.5 7.0 11.6 11.1 9.2 13.8 17.5 11.9 10.0 11.6 13.4

90

91
7.INVESTMENT

92
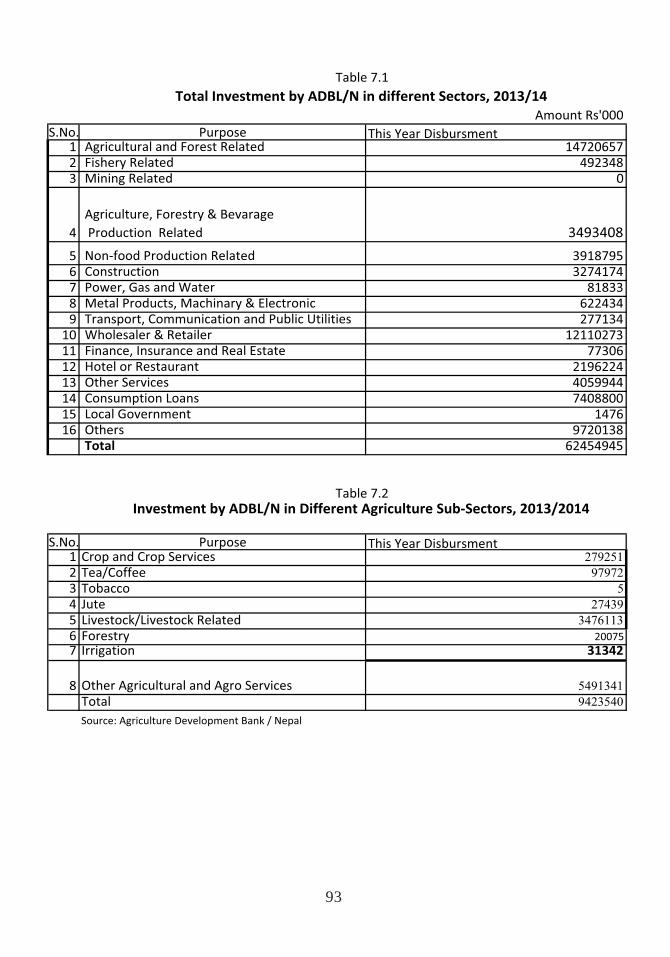
93
Amount Rs'000
S.No. Purpose This Year Disbursment1 Agricultural and Forest Related 14720657
2 Fishery Related 492348
3 Mining Related 0
4
Agriculture, Forestry & Bevarage
Production Related 3493408
5 Non food Production Related 3918795
6 Construction 3274174
7 Power, Gas and Water 81833
8 Metal Products, Machinary & Electronic 622434
9 Transport, Communication and Public Utilities 277134
10 Wholesaler & Retailer 12110273
11 Finance, Insurance and Real Estate 77306
12 Hotel or Restaurant 2196224
13 Other Services 4059944
14 Consumption Loans 7408800
15 Local Government 1476
16 Others 9720138Total 62454945
S.No. Purpose This Year Disbursment1 Crop and Crop Services 279251
2 Tea/Coffee 97972
3 Tobacco 5
4 Jute 27439
5 Livestock/Livestock Related 3476113
6 Forestry 20075
7 Irrigation 31342
8 Other Agricultural and Agro Services 5491341
Total 9423540
Source: Agriculture Development Bank / Nepal
Table 7.2Investment by ADBL/N in Different Agriculture Sub Sectors, 2013/2014
Total Investment by ADBL/N in different Sectors, 2013/14
Table 7.1
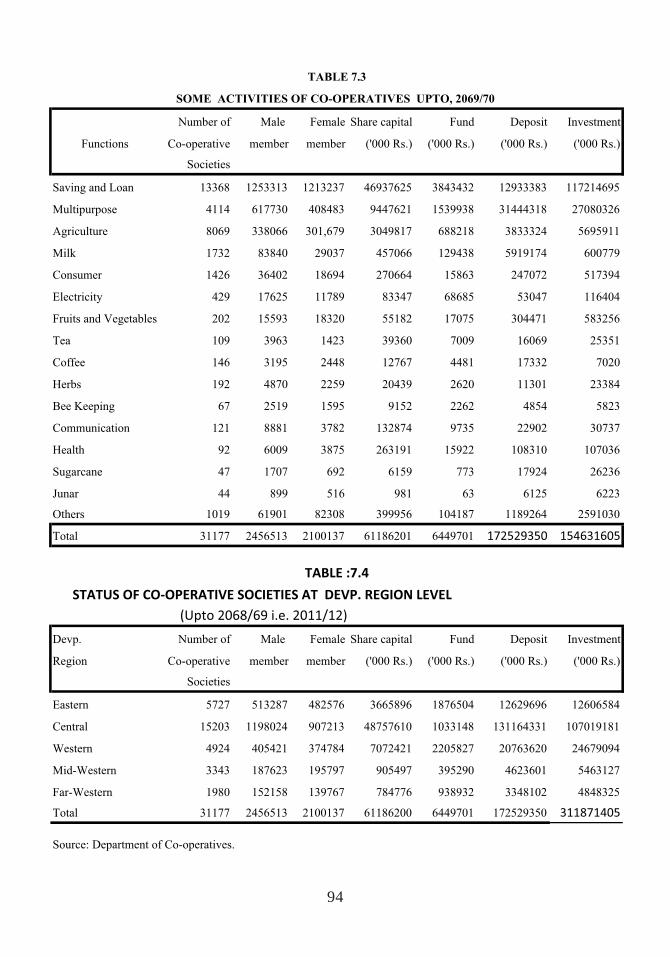
94
Number of Male Female Share capital Fund Deposit Investment
Functions Co-operative member member ('000 Rs.) ('000 Rs.) ('000 Rs.) ('000 Rs.)
Societies
Saving and Loan 13368 1253313 1213237 46937625 3843432 12933383 117214695
Multipurpose 4114 617730 408483 9447621 1539938 31444318 27080326
Agriculture 8069 338066 301,679 3049817 688218 3833324 5695911
Milk 1732 83840 29037 457066 129438 5919174 600779
Consumer 1426 36402 18694 270664 15863 247072 517394
Electricity 429 17625 11789 83347 68685 53047 116404
Fruits and Vegetables 202 15593 18320 55182 17075 304471 583256
Tea 109 3963 1423 39360 7009 16069 25351
Coffee 146 3195 2448 12767 4481 17332 7020
Herbs 192 4870 2259 20439 2620 11301 23384
Bee Keeping 67 2519 1595 9152 2262 4854 5823
Communication 121 8881 3782 132874 9735 22902 30737
Health 92 6009 3875 263191 15922 108310 107036
Sugarcane 47 1707 692 6159 773 17924 26236
Junar 44 899 516 981 63 6125 6223
Others 1019 61901 82308 399956 104187 1189264 2591030
Total 31177 2456513 2100137 61186201 6449701 172529350 154631605
Devp. Number of Male Female Share capital Fund Deposit Investment
Region Co-operative member member ('000 Rs.) ('000 Rs.) ('000 Rs.) ('000 Rs.)
Societies
Eastern 5727 513287 482576 3665896 1876504 12629696 12606584
Central 15203 1198024 907213 48757610 1033148 131164331 107019181
Western 4924 405421 374784 7072421 2205827 20763620 24679094
Mid-Western 3343 187623 195797 905497 395290 4623601 5463127
Far-Western 1980 152158 139767 784776 938932 3348102 4848325
Total 31177 2456513 2100137 61186200 6449701 172529350 311871405
Source: Department of Co-operatives.
STATUS OF CO OPERATIVE SOCIETIES AT DEVP. REGION LEVEL
(Upto 2068/69 i.e. 2011/12)
SOME ACTIVITIES OF CO-OPERATIVES UPTO, 2069/70
TABLE 7.3
TABLE :7.4
95
8.INPUTS

96
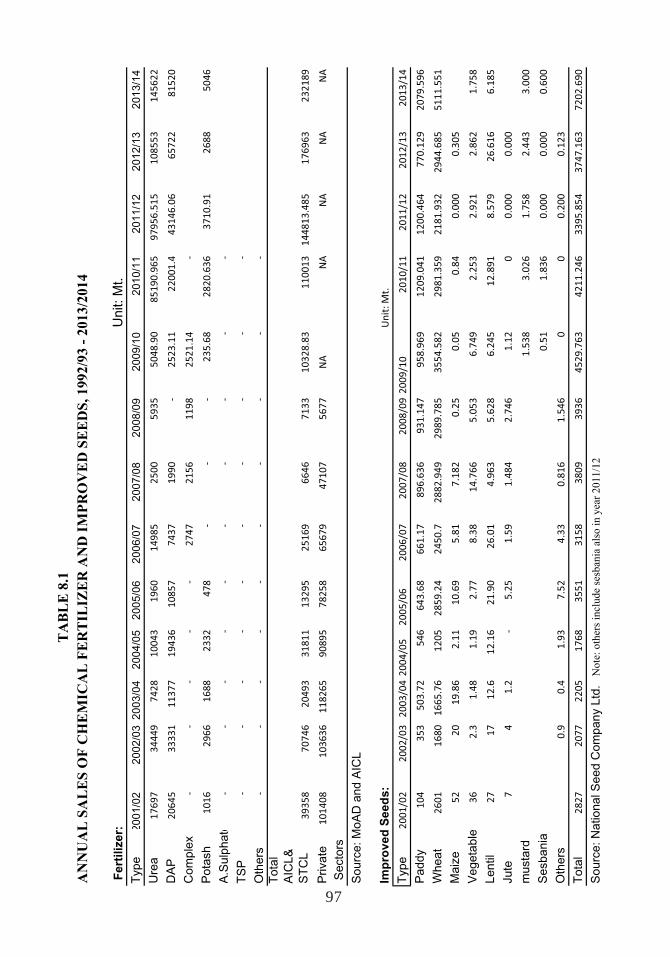
97
AN
NU
AL
SA
LE
S O
F C
HE
MIC
AL
FE
RT
ILIZ
ER
AN
D I
MP
RO
VE
D S
EE
DS
, 1992/9
3 -
2013/2
014
Fer
tiliz
er:
Uni
t: M
t.T
ype
2001
/02
2002
/03
2003
/04
2004
/05
2005
/06
2006
/07
2007
/08
2008
/09
2009
/10
2010
/11
2011
/12
2012
/13
2013
/14
Ure
a17697
34449
7428
10043
1960
14985
2500
5935
5048.90
85190.965
97956.515
108553
145622
DA
P20645
33331
11377
19436
10857
7437
1990
2523.11
22001.4
43146.06
65722
81520
Com
plex
2747
2156
1198
2521.14
Pot
ash
1016
2966
1688
2332
478
235.68
2820.636
3710.91
2688
5046
A.S
ulph
ate
TS
PO
ther
sT
otal
A
ICL&
S
TC
L39358
70746
20493
31811
13295
25169
6646
7133
10328.83
110013
144813.485
176963
232189
Priv
ate
101408
103636
118265
90895
78258
65679
47107
5677
NA
NA
NA
NA
NA
Sec
tors
Sou
rce:
MoA
D a
nd A
ICL
Imp
rove
d S
eed
s:Unit:Mt.
Typ
e2001/02
2002/03
2003/042004/05
2005/06
2006/07
2007/08
2008/092009/10
2010/11
2011/12
2012/13
2013/14
Pad
dy104
353
503.72
546
643.68
661.17
896.636
931.147
958.969
1209.041
1200.464
770.129
2079.596
Whe
at2601
1680
1665.76
1205
2859.24
2450.7
2882.949
2989.785
3554.582
2981.359
2181.932
2944.685
5111.551
Mai
ze52
20
19.86
2.11
10.69
5.81
7.182
0.25
0.05
0.84
0.000
0.305
Veg
etab
le36
2.3
1.48
1.19
2.77
8.38
14.766
5.053
6.749
2.253
2.921
2.862
1.758
Lent
il27
17
12.6
12.16
21.90
26.01
4.963
5.628
6.245
12.891
8.579
26.616
6.185
Jute
74
1.2
5.25
1.59
1.484
2.746
1.12
00.000
0.000
mus
tard
1.538
3.026
1.758
2.443
3.000
Ses
bani
a0.51
1.836
0.000
0.000
0.600
Oth
ers
0.9
0.4
1.93
7.52
4.33
0.816
1.546
00
0.200
0.123
Tot
al2827
2077
2205
1768
3551
3158
3809
3936
4529.763
4211.246
3395.854
3747.163
7202.690
Sou
rce:
Nat
iona
l See
d C
ompa
ny L
td.
Note
: oth
ers
incl
ude
sesb
ania
als
o i
n y
ear
2011/1
2
TA
BL
E 8
.1
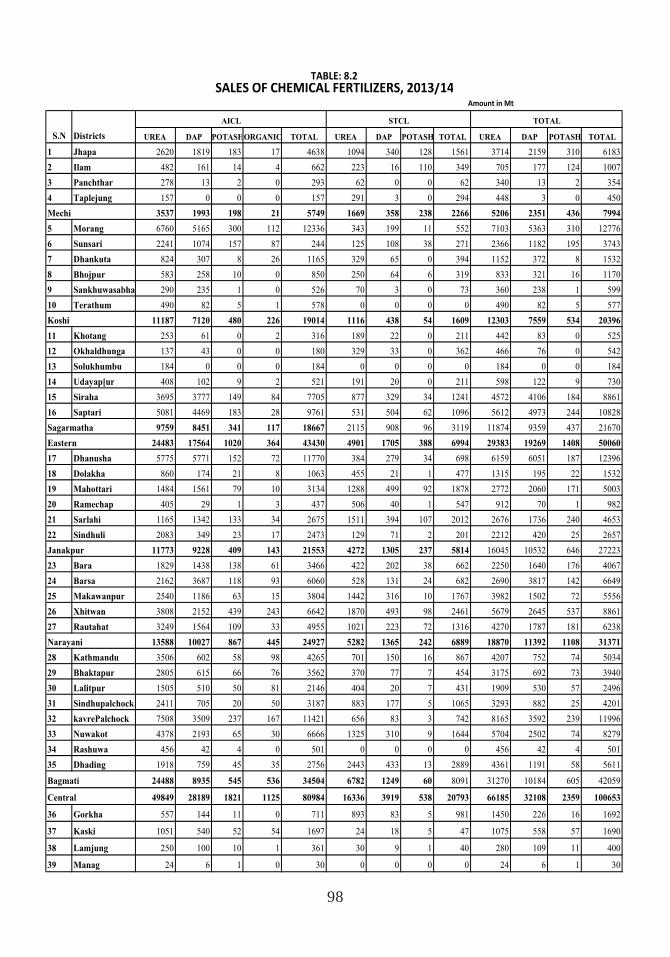
98
Amount in Mt
UREA DAP POTASHORGANIC TOTAL UREA DAP POTASH TOTAL UREA DAP POTASH TOTAL
1 Jhapa 2620 1819 183 17 4638 1094 340 128 1561 3714 2159 310 6183
2 Ilam 482 161 14 4 662 223 16 110 349 705 177 124 1007
3 Panchthar 278 13 2 0 293 62 0 0 62 340 13 2 354
4 Taplejung 157 0 0 0 157 291 3 0 294 448 3 0 450
3537 1993 198 21 5749 1669 358 238 2266 5206 2351 436 7994
5 Morang 6760 5165 300 112 12336 343 199 11 552 7103 5363 310 12776
6 Sunsari 2241 1074 157 87 244 125 108 38 271 2366 1182 195 3743
7 Dhankuta 824 307 8 26 1165 329 65 0 394 1152 372 8 1532
8 Bhojpur 583 258 10 0 850 250 64 6 319 833 321 16 1170
9 Sankhuwasabha 290 235 1 0 526 70 3 0 73 360 238 1 599
10 Terathum 490 82 5 1 578 0 0 0 0 490 82 5 577
11187 7120 480 226 19014 1116 438 54 1609 12303 7559 534 20396
11 Khotang 253 61 0 2 316 189 22 0 211 442 83 0 525
12 Okhaldhunga 137 43 0 0 180 329 33 0 362 466 76 0 542
13 Solukhumbu 184 0 0 0 184 0 0 0 0 184 0 0 184
14 Udayap[ur 408 102 9 2 521 191 20 0 211 598 122 9 730
15 Siraha 3695 3777 149 84 7705 877 329 34 1241 4572 4106 184 8861
16 Saptari 5081 4469 183 28 9761 531 504 62 1096 5612 4973 244 10828
9759 8451 341 117 18667 2115 908 96 3119 11874 9359 437 21670
24483 17564 1020 364 43430 4901 1705 388 6994 29383 19269 1408 50060
17 Dhanusha 5775 5771 152 72 11770 384 279 34 698 6159 6051 187 12396
18 Dolakha 860 174 21 8 1063 455 21 1 477 1315 195 22 1532
19 Mahottari 1484 1561 79 10 3134 1288 499 92 1878 2772 2060 171 5003
20 Ramechap 405 29 1 3 437 506 40 1 547 912 70 1 982
21 Sarlahi 1165 1342 133 34 2675 1511 394 107 2012 2676 1736 240 4653
22 Sindhuli 2083 349 23 17 2473 129 71 2 201 2212 420 25 2657
11773 9228 409 143 21553 4272 1305 237 5814 16045 10532 646 27223
23 Bara 1829 1438 138 61 3466 422 202 38 662 2250 1640 176 4067
24 Barsa 2162 3687 118 93 6060 528 131 24 682 2690 3817 142 6649
25 Makawanpur 2540 1186 63 15 3804 1442 316 10 1767 3982 1502 72 5556
26 Xhitwan 3808 2152 439 243 6642 1870 493 98 2461 5679 2645 537 8861
27 Rautahat 3249 1564 109 33 4955 1021 223 72 1316 4270 1787 181 6238
13588 10027 867 445 24927 5282 1365 242 6889 18870 11392 1108 31371
28 Kathmandu 3506 602 58 98 4265 701 150 16 867 4207 752 74 5034
29 Bhaktapur 2805 615 66 76 3562 370 77 7 454 3175 692 73 3940
30 Lalitpur 1505 510 50 81 2146 404 20 7 431 1909 530 57 2496
31 Sindhupalchock 2411 705 20 50 3187 883 177 5 1065 3293 882 25 4201
32 kavrePalchock 7508 3509 237 167 11421 656 83 3 742 8165 3592 239 11996
33 Nuwakot 4378 2193 65 30 6666 1325 310 9 1644 5704 2502 74 8279
34 Rashuwa 456 42 4 0 501 0 0 0 0 456 42 4 501
35 Dhading 1918 759 45 35 2756 2443 433 13 2889 4361 1191 58 5611
24488 8935 545 536 34504 6782 1249 60 8091 31270 10184 605 42059
49849 28189 1821 1125 80984 16336 3919 538 20793 66185 32108 2359 100653
36 Gorkha 557 144 11 0 711 893 83 5 981 1450 226 16 1692
37 Kaski 1051 540 52 54 1697 24 18 5 47 1075 558 57 1690
38 Lamjung 250 100 10 1 361 30 9 1 40 280 109 11 400
39 Manag 24 6 1 0 30 0 0 0 0 24 6 1 30
TABLE: 8.2SALES OF CHEMICAL FERTILIZERS, 2013/14
Eastern
Janakpur
Narayani
Bagmati
Central
STCL TOTAL
Mechi
Koshi
Sagarmatha
S.N Districts
AICL
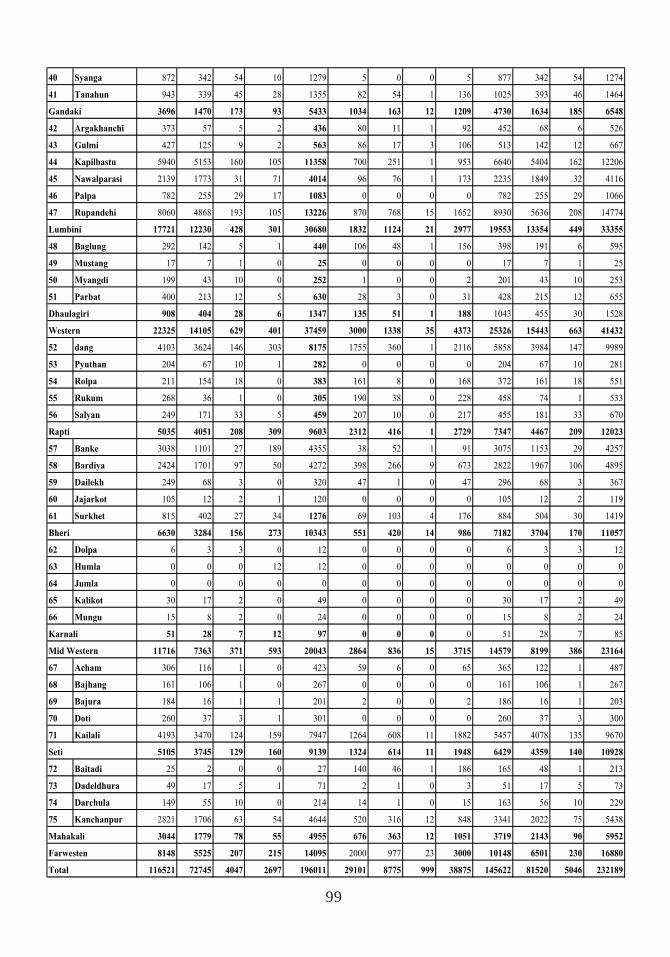
99
40 Syanga 872 342 54 10 1279 5 0 0 5 877 342 54 1274
41 Tanahun 943 339 45 28 1355 82 54 1 136 1025 393 46 1464
3696 1470 173 93 5433 1034 163 12 1209 4730 1634 185 6548
42 Argakhanchi 373 57 5 2 436 80 11 1 92 452 68 6 526
43 Gulmi 427 125 9 2 563 86 17 3 106 513 142 12 667
44 Kapilbastu 5940 5153 160 105 11358 700 251 1 953 6640 5404 162 12206
45 Nawalparasi 2139 1773 31 71 4014 96 76 1 173 2235 1849 32 4116
46 Palpa 782 255 29 17 1083 0 0 0 0 782 255 29 1066
47 Rupandehi 8060 4868 193 105 13226 870 768 15 1652 8930 5636 208 14774
17721 12230 428 301 30680 1832 1124 21 2977 19553 13354 449 33355
48 Baglung 292 142 5 1 440 106 48 1 156 398 191 6 595
49 Mustang 17 7 1 0 25 0 0 0 0 17 7 1 25
50 Myangdi 199 43 10 0 252 1 0 0 2 201 43 10 253
51 Parbat 400 213 12 5 630 28 3 0 31 428 215 12 655
908 404 28 6 1347 135 51 1 188 1043 455 30 1528
22325 14105 629 401 37459 3000 1338 35 4373 25326 15443 663 41432
52 dang 4103 3624 146 303 8175 1755 360 1 2116 5858 3984 147 9989
53 Pyuthan 204 67 10 1 282 0 0 0 0 204 67 10 281
54 Rolpa 211 154 18 0 383 161 8 0 168 372 161 18 551
55 Rukum 268 36 1 0 305 190 38 0 228 458 74 1 533
56 Salyan 249 171 33 5 459 207 10 0 217 455 181 33 670
5035 4051 208 309 9603 2312 416 1 2729 7347 4467 209 12023
57 Banke 3038 1101 27 189 4355 38 52 1 91 3075 1153 29 4257
58 Bardiya 2424 1701 97 50 4272 398 266 9 673 2822 1967 106 4895
59 Dailekh 249 68 3 0 320 47 1 0 47 296 68 3 367
60 Jajarkot 105 12 2 1 120 0 0 0 0 105 12 2 119
61 Surkhet 815 402 27 34 1276 69 103 4 176 884 504 30 1419
6630 3284 156 273 10343 551 420 14 986 7182 3704 170 11057
62 Dolpa 6 3 3 0 12 0 0 0 0 6 3 3 12
63 Humla 0 0 0 12 12 0 0 0 0 0 0 0 0
64 Jumla 0 0 0 0 0 0 0 0 0 0 0 0 0
65 Kalikot 30 17 2 0 49 0 0 0 0 30 17 2 49
66 Mungu 15 8 2 0 24 0 0 0 0 15 8 2 24
51 28 7 12 97 0 0 0 0 51 28 7 85
11716 7363 371 593 20043 2864 836 15 3715 14579 8199 386 23164
67 Acham 306 116 1 0 423 59 6 0 65 365 122 1 487
68 Bajhang 161 106 1 0 267 0 0 0 0 161 106 1 267
69 Bajura 184 16 1 1 201 2 0 0 2 186 16 1 203
70 Doti 260 37 3 1 301 0 0 0 0 260 37 3 300
71 Kailali 4193 3470 124 159 7947 1264 608 11 1882 5457 4078 135 9670
5105 3745 129 160 9139 1324 614 11 1948 6429 4359 140 10928
72 Baitadi 25 2 0 0 27 140 46 1 186 165 48 1 213
73 Dadeldhura 49 17 5 1 71 2 1 0 3 51 17 5 73
74 Darchula 149 55 10 0 214 14 1 0 15 163 56 10 229
75 Kanchanpur 2821 1706 63 54 4644 520 316 12 848 3341 2022 75 5438
3044 1779 78 55 4955 676 363 12 1051 3719 2143 90 5952
8148 5525 207 215 14095 2000 977 23 3000 10148 6501 230 16880
116521 72745 4047 2697 196011 29101 8775 999 38875 145622 81520 5046 232189
Farwesten
Total
Bheri
Karnali
Mid Western
Seti
Mahakali
Gandaki
Lumbini
Dhaulagiri
Western
Rapti
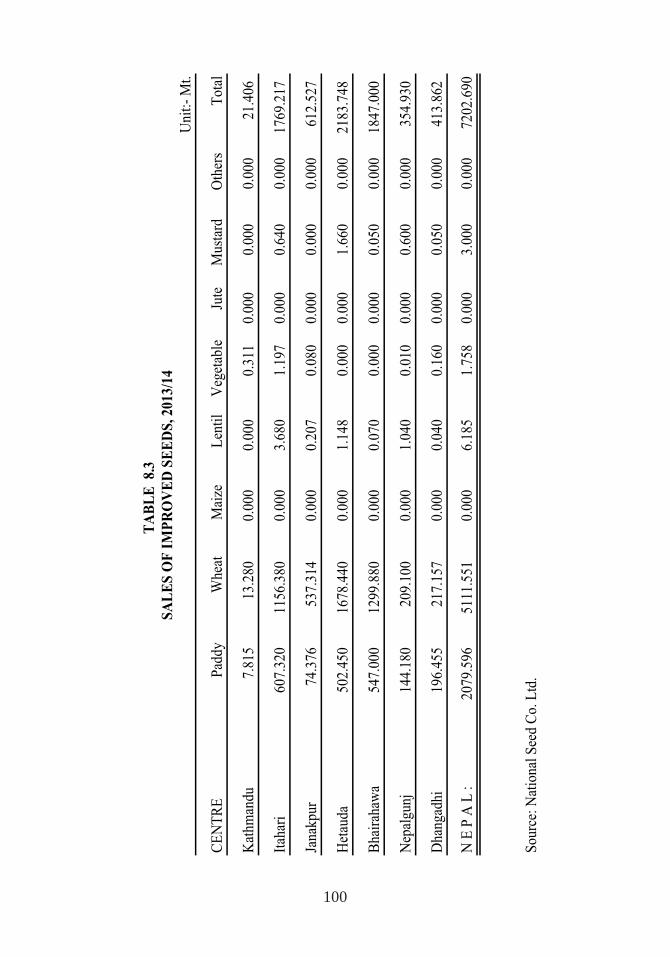
100
TA
BL
E
8.3
SA
LE
S O
F I
MP
RO
VE
D S
EE
DS
, 2
01
3/1
4
Uni
t:-
Mt.
CE
NT
RE
Pad
dyW
heat
Mai
zeL
enti
lV
eget
able
Jute
Mus
tard
Oth
ers
Tot
al
Kat
hman
du7.
815
13.2
800.
000
0.00
00.
311
0.00
00.
000
0.00
021
.406
Itah
ari
607.
320
1156
.380
0.00
03.
680
1.19
70.
000
0.64
00.
000
1769
.217
Jana
kpur
74.3
7653
7.31
40.
000
0.20
70.
080
0.00
00.
000
0.00
061
2.52
7
Het
auda
502.
450
1678
.440
0.00
01.
148
0.00
00.
000
1.66
00.
000
2183
.748
Bha
irah
awa
547.
000
1299
.880
0.00
00.
070
0.00
00.
000
0.05
00.
000
1847
.000
Nep
algu
nj14
4.18
020
9.10
00.
000
1.04
00.
010
0.00
00.
600
0.00
035
4.93
0
Dha
ngad
hi19
6.45
521
7.15
70.
000
0.04
00.
160
0.00
00.
050
0.00
041
3.86
2
N E
P A
L :
2079
.596
5111
.551
0.00
06.
185
1.75
80.
000
3.00
00.
000
7202
.690
Sou
rce:
Nat
iona
l S
eed
Co.
Ltd
.

101
9.PRICE

102
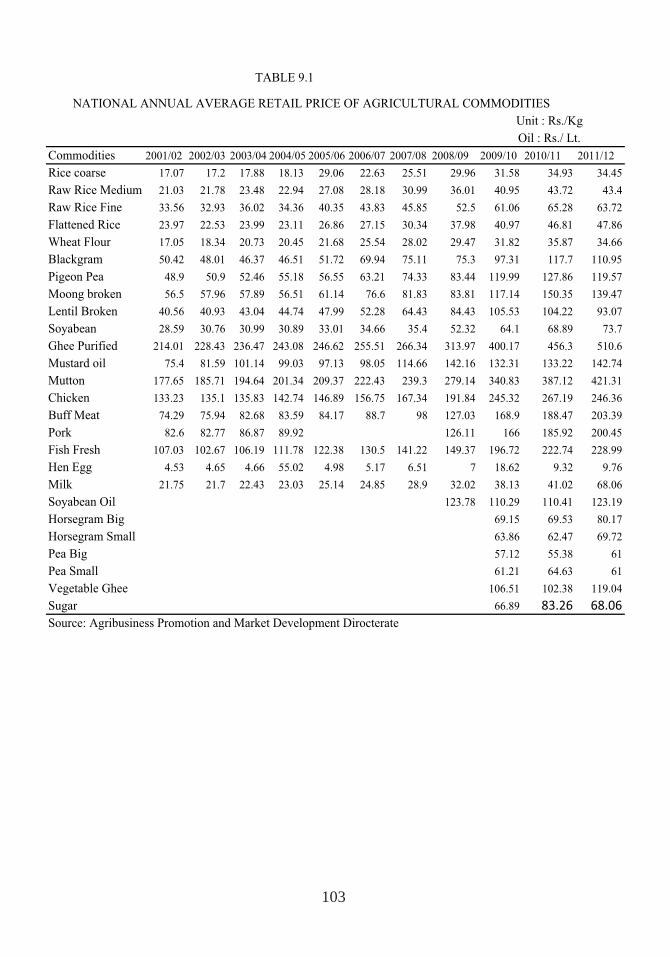
103
Unit : Rs./Kg
Oil : Rs./ Lt.
Commodities 2001/02 2002/03 2003/04 2004/05 2005/06 2006/07 2007/08 2008/09 2009/10 2010/11 2011/12
Rice coarse 17.07 17.2 17.88 18.13 29.06 22.63 25.51 29.96 31.58 34.93 34.45
Raw Rice Medium 21.03 21.78 23.48 22.94 27.08 28.18 30.99 36.01 40.95 43.72 43.4
Raw Rice Fine 33.56 32.93 36.02 34.36 40.35 43.83 45.85 52.5 61.06 65.28 63.72
Flattened Rice 23.97 22.53 23.99 23.11 26.86 27.15 30.34 37.98 40.97 46.81 47.86
Wheat Flour 17.05 18.34 20.73 20.45 21.68 25.54 28.02 29.47 31.82 35.87 34.66
Blackgram 50.42 48.01 46.37 46.51 51.72 69.94 75.11 75.3 97.31 117.7 110.95
Pigeon Pea 48.9 50.9 52.46 55.18 56.55 63.21 74.33 83.44 119.99 127.86 119.57
Moong broken 56.5 57.96 57.89 56.51 61.14 76.6 81.83 83.81 117.14 150.35 139.47
Lentil Broken 40.56 40.93 43.04 44.74 47.99 52.28 64.43 84.43 105.53 104.22 93.07
Soyabean 28.59 30.76 30.99 30.89 33.01 34.66 35.4 52.32 64.1 68.89 73.7
Ghee Purified 214.01 228.43 236.47 243.08 246.62 255.51 266.34 313.97 400.17 456.3 510.6
Mustard oil 75.4 81.59 101.14 99.03 97.13 98.05 114.66 142.16 132.31 133.22 142.74
Mutton 177.65 185.71 194.64 201.34 209.37 222.43 239.3 279.14 340.83 387.12 421.31
Chicken 133.23 135.1 135.83 142.74 146.89 156.75 167.34 191.84 245.32 267.19 246.36
Buff Meat 74.29 75.94 82.68 83.59 84.17 88.7 98 127.03 168.9 188.47 203.39
Pork 82.6 82.77 86.87 89.92 126.11 166 185.92 200.45
Fish Fresh 107.03 102.67 106.19 111.78 122.38 130.5 141.22 149.37 196.72 222.74 228.99
Hen Egg 4.53 4.65 4.66 55.02 4.98 5.17 6.51 7 18.62 9.32 9.76
Milk 21.75 21.7 22.43 23.03 25.14 24.85 28.9 32.02 38.13 41.02 68.06
Soyabean Oil 123.78 110.29 110.41 123.19
Horsegram Big 69.15 69.53 80.17
Horsegram Small 63.86 62.47 69.72
Pea Big 57.12 55.38 61
Pea Small 61.21 64.63 61
Vegetable Ghee 106.51 102.38 119.04
Sugar 66.89 83.26 68.06
Source: Agribusiness Promotion and Market Development Dirocterate
TABLE 9.1
NATIONAL ANNUAL AVERAGE RETAIL PRICE OF AGRICULTURAL COMMODITIES
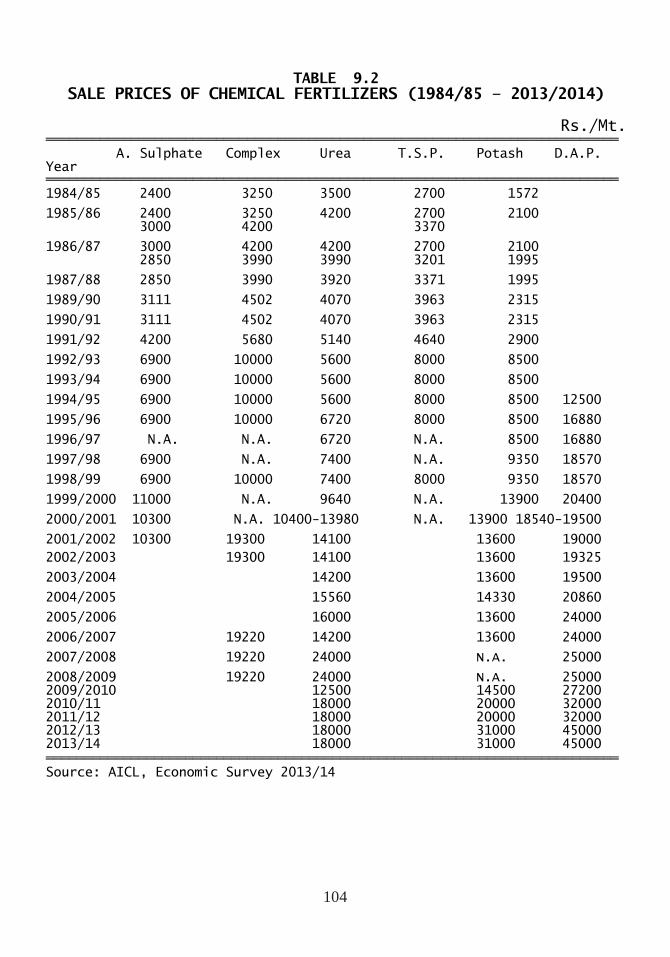
104
TABLE 9.2 SALE PRICES OF CHEMICAL FERTILIZERS (1984/85 – 2013/2014)
Rs./Mt.
A. Sulphate Complex Urea T.S.P. Potash D.A.P. Year
1984/85 2400 3250 3500 2700 1572
1985/86 2400 3250 4200 2700 2100 3000 4200 3370
1986/87 3000 4200 4200 2700 2100 2850 3990 3990 3201 1995
1987/88 2850 3990 3920 3371 1995
1989/90 3111 4502 4070 3963 2315
1990/91 3111 4502 4070 3963 2315
1991/92 4200 5680 5140 4640 2900
1992/93 6900 10000 5600 8000 8500
1993/94 6900 10000 5600 8000 8500
1994/95 6900 10000 5600 8000 8500 12500
1995/96 6900 10000 6720 8000 8500 16880
1996/97 N.A. N.A. 6720 N.A. 8500 16880
1997/98 6900 N.A. 7400 N.A. 9350 18570
1998/99 6900 10000 7400 8000 9350 18570
1999/2000 11000 N.A. 9640 N.A. 13900 20400
2000/2001 10300 N.A. 10400-13980 N.A. 13900 18540-19500
2001/2002 10300 19300 14100 13600 19000
2002/2003 19300 14100 13600 19325
2003/2004 14200 13600 19500
2004/2005 15560 14330 20860
2005/2006 16000 13600 24000
2006/2007 19220 14200 13600 24000
2007/2008 19220 24000 N.A. 25000
2008/2009 19220 24000 N.A. 25000 2009/2010 12500 14500 27200 2010/11 18000 20000 32000 2011/12 18000 20000 32000 2012/13 18000 31000 45000 2013/14 18000 31000 45000
Source: AICL, Economic Survey 2013/14
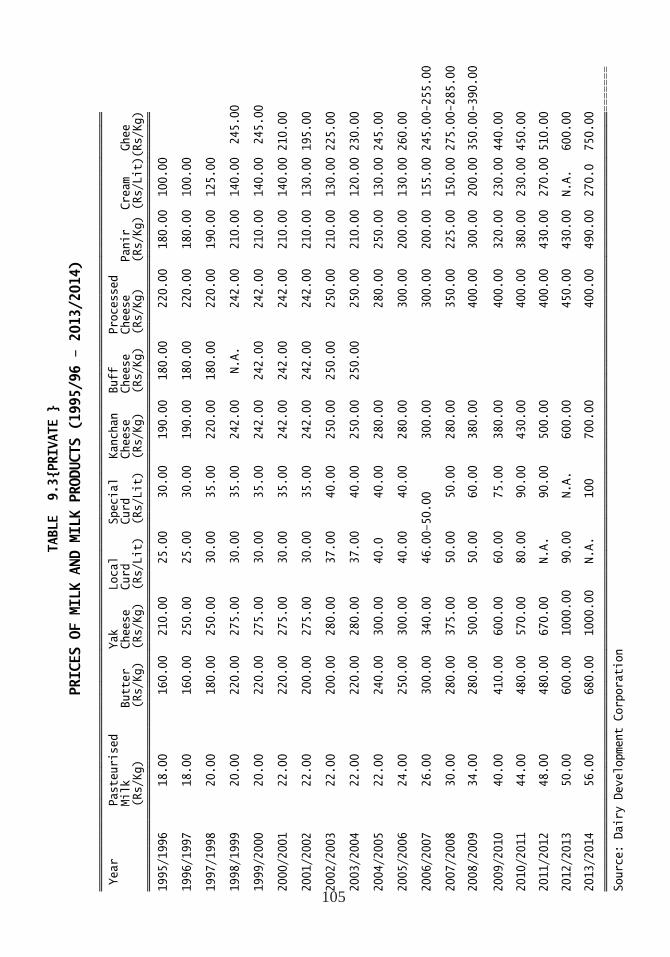
105
TABLE 9.3{PRIVATE }
PRICES OF MILK AND MILK PRODUCTS (1995/96 – 2013/2014)
Year Pasteurised Yak Local Special Kanchan Buff Processed
Milk Butter Cheese Curd Curd Cheese Cheese Cheese Panir Cream Ghee
(Rs/Kg) (Rs/Kg) (Rs/Kg) (Rs/Lit) (Rs/Lit) (Rs/Kg) (Rs/Kg) (Rs/Kg) (Rs/Kg) (Rs/Lit)(Rs/Kg)
1995/1996 18.00 160.00 210.00 25.00 30.00 190.00 180.00 220.00 180.00 100.00
1996/1997 18.00 160.00 250.00 25.00 30.00 190.00 180.00 220.00 180.00 100.00
1997/1998 20.00 180.00 250.00 30.00 35.00 220.00 180.00 220.00 190.00 125.00
1998/1999 20.00 220.00 275.00 30.00 35.00 242.00 N.A. 242.00 210.00 140.00 245.00
1999/2000 20.00 220.00 275.00 30.00 35.00 242.00 242.00 242.00 210.00 140.00 245.00
2000/2001 22.00 220.00 275.00 30.00 35.00 242.00 242.00 242.00 210.00 140.00 210.00
2001/2002 22.00 200.00 275.00 30.00 35.00 242.00 242.00 242.00 210.00 130.00 195.00
2002/2003 22.00 200.00 280.00 37.00 40.00 250.00 250.00 250.00 210.00 130.00 225.00
2003/2004 22.00 220.00 280.00 37.00 40.00 250.00 250.00 250.00 210.00 120.00 230.00
2004/2005 22.00 240.00 300.00 40.0 40.00 280.00 280.00 250.00 130.00 245.00
2005/2006 24.00 250.00 300.00 40.00 40.00 280.00 300.00 200.00 130.00 260.00
2006/2007 26.00 300.00 340.00 46.00–50.00 300.00 300.00 200.00 155.00 245.00-255.00
2007/2008 30.00 280.00 375.00 50.00 50.00 280.00 350.00 225.00 150.00 275.00-285.00
2008/2009 34.00 280.00 500.00 50.00 60.00 380.00 400.00 300.00 200.00 350.00-390.00
2009/2010 40.00 410.00 600.00 60.00 75.00 380.00 400.00 320.00 230.00 440.00
2010/2011 44.00 480.00 570.00 80.00 90.00 430.00 400.00 380.00 230.00 450.00
2011/2012 48.00 480.00 670.00 N.A. 90.00 500.00 400.00 430.00 270.00 510.00
2012/2013 50.00 600.00 1000.00 90.00 N.A. 600.00 450.00 430.00 N.A. 600.00
2013/2014 56.00 680.00 1000.00 N.A. 100 700.00 400.00 490.00 270.0 750.00 =======
Source: Dairy Development Corporation

106
107
10.IRRIGATION

108
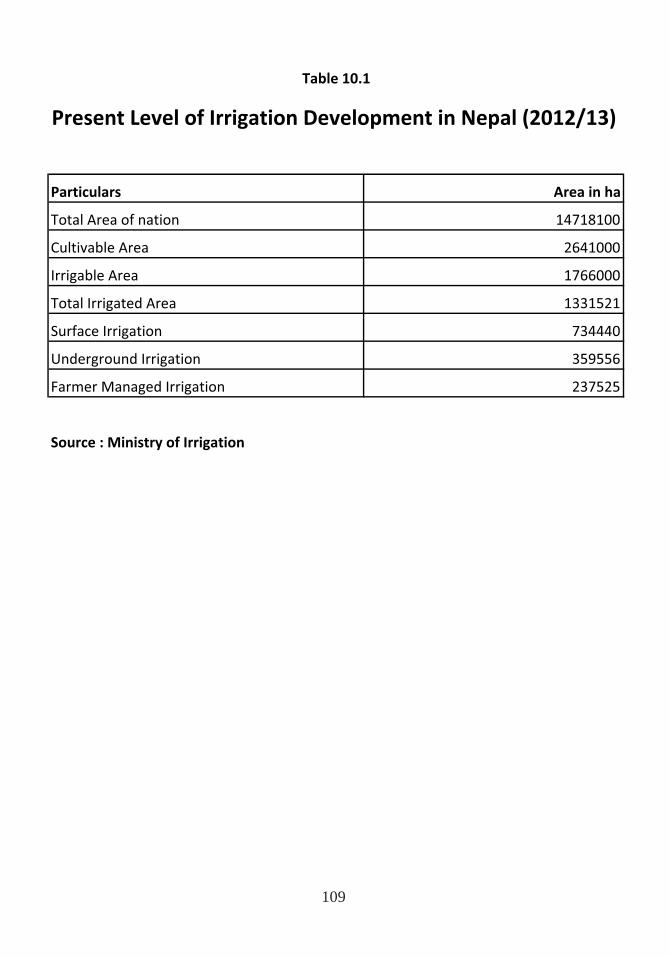
109
Present Level of Irrigation Development in Nepal (2012/13)
Particulars Area in ha
Total Area of nation 14718100
Cultivable Area 2641000
Irrigable Area 1766000
Total Irrigated Area 1331521
Surface Irrigation 734440
Underground Irrigation 359556
Farmer Managed Irrigation 237525
Source : Ministry of Irrigation
Table 10.1

110
111
11.MISCELLANANEOUS

112
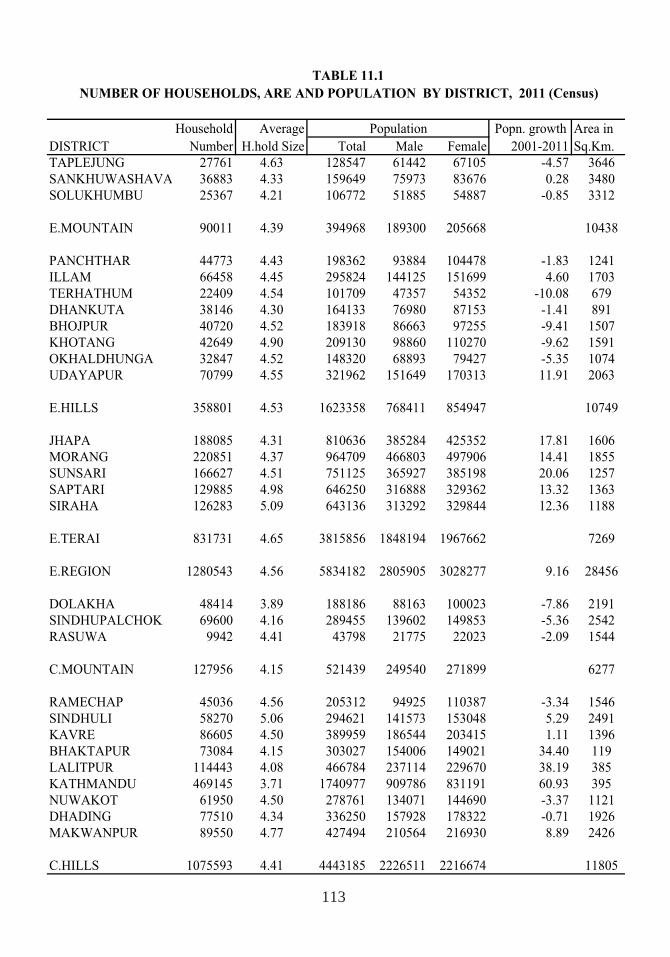
113
Household Average Popn. growth Area in
DISTRICT Number H.hold Size Total Male Female 2001-2011 Sq.Km.
TAPLEJUNG 27761 4.63 128547 61442 67105 -4.57 3646
SANKHUWASHAVA 36883 4.33 159649 75973 83676 0.28 3480
SOLUKHUMBU 25367 4.21 106772 51885 54887 -0.85 3312
E.MOUNTAIN 90011 4.39 394968 189300 205668 10438
PANCHTHAR 44773 4.43 198362 93884 104478 -1.83 1241
ILLAM 66458 4.45 295824 144125 151699 4.60 1703
TERHATHUM 22409 4.54 101709 47357 54352 -10.08 679
DHANKUTA 38146 4.30 164133 76980 87153 -1.41 891
BHOJPUR 40720 4.52 183918 86663 97255 -9.41 1507
KHOTANG 42649 4.90 209130 98860 110270 -9.62 1591
OKHALDHUNGA 32847 4.52 148320 68893 79427 -5.35 1074
UDAYAPUR 70799 4.55 321962 151649 170313 11.91 2063
E.HILLS 358801 4.53 1623358 768411 854947 10749
JHAPA 188085 4.31 810636 385284 425352 17.81 1606
MORANG 220851 4.37 964709 466803 497906 14.41 1855
SUNSARI 166627 4.51 751125 365927 385198 20.06 1257
SAPTARI 129885 4.98 646250 316888 329362 13.32 1363
SIRAHA 126283 5.09 643136 313292 329844 12.36 1188
E.TERAI 831731 4.65 3815856 1848194 1967662 7269
E.REGION 1280543 4.56 5834182 2805905 3028277 9.16 28456
DOLAKHA 48414 3.89 188186 88163 100023 -7.86 2191
SINDHUPALCHOK 69600 4.16 289455 139602 149853 -5.36 2542
RASUWA 9942 4.41 43798 21775 22023 -2.09 1544
C.MOUNTAIN 127956 4.15 521439 249540 271899 6277
RAMECHAP 45036 4.56 205312 94925 110387 -3.34 1546
SINDHULI 58270 5.06 294621 141573 153048 5.29 2491
KAVRE 86605 4.50 389959 186544 203415 1.11 1396
BHAKTAPUR 73084 4.15 303027 154006 149021 34.40 119
LALITPUR 114443 4.08 466784 237114 229670 38.19 385
KATHMANDU 469145 3.71 1740977 909786 831191 60.93 395
NUWAKOT 61950 4.50 278761 134071 144690 -3.37 1121
DHADING 77510 4.34 336250 157928 178322 -0.71 1926
MAKWANPUR 89550 4.77 427494 210564 216930 8.89 2426
C.HILLS 1075593 4.41 4443185 2226511 2216674 11805
TABLE 11.1
Population
NUMBER OF HOUSEHOLDS, ARE AND POPULATION BY DISTRICT, 2011 (Census)
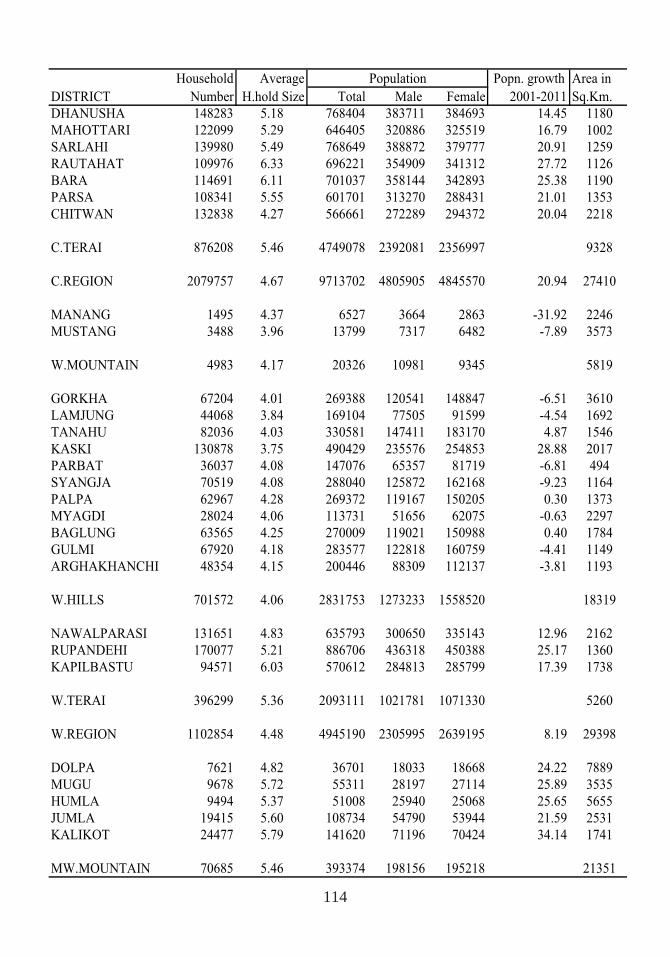
114
Household Average Popn. growth Area in
DISTRICT Number H.hold Size Total Male Female 2001-2011 Sq.Km.
DHANUSHA 148283 5.18 768404 383711 384693 14.45 1180
MAHOTTARI 122099 5.29 646405 320886 325519 16.79 1002
SARLAHI 139980 5.49 768649 388872 379777 20.91 1259
RAUTAHAT 109976 6.33 696221 354909 341312 27.72 1126
BARA 114691 6.11 701037 358144 342893 25.38 1190
PARSA 108341 5.55 601701 313270 288431 21.01 1353
CHITWAN 132838 4.27 566661 272289 294372 20.04 2218
C.TERAI 876208 5.46 4749078 2392081 2356997 9328
C.REGION 2079757 4.67 9713702 4805905 4845570 20.94 27410
MANANG 1495 4.37 6527 3664 2863 -31.92 2246
MUSTANG 3488 3.96 13799 7317 6482 -7.89 3573
W.MOUNTAIN 4983 4.17 20326 10981 9345 5819
GORKHA 67204 4.01 269388 120541 148847 -6.51 3610
LAMJUNG 44068 3.84 169104 77505 91599 -4.54 1692
TANAHU 82036 4.03 330581 147411 183170 4.87 1546
KASKI 130878 3.75 490429 235576 254853 28.88 2017
PARBAT 36037 4.08 147076 65357 81719 -6.81 494
SYANGJA 70519 4.08 288040 125872 162168 -9.23 1164
PALPA 62967 4.28 269372 119167 150205 0.30 1373
MYAGDI 28024 4.06 113731 51656 62075 -0.63 2297
BAGLUNG 63565 4.25 270009 119021 150988 0.40 1784
GULMI 67920 4.18 283577 122818 160759 -4.41 1149
ARGHAKHANCHI 48354 4.15 200446 88309 112137 -3.81 1193
W.HILLS 701572 4.06 2831753 1273233 1558520 18319
NAWALPARASI 131651 4.83 635793 300650 335143 12.96 2162
RUPANDEHI 170077 5.21 886706 436318 450388 25.17 1360
KAPILBASTU 94571 6.03 570612 284813 285799 17.39 1738
W.TERAI 396299 5.36 2093111 1021781 1071330 5260
W.REGION 1102854 4.48 4945190 2305995 2639195 8.19 29398
DOLPA 7621 4.82 36701 18033 18668 24.22 7889
MUGU 9678 5.72 55311 28197 27114 25.89 3535
HUMLA 9494 5.37 51008 25940 25068 25.65 5655
JUMLA 19415 5.60 108734 54790 53944 21.59 2531
KALIKOT 24477 5.79 141620 71196 70424 34.14 1741
MW.MOUNTAIN 70685 5.46 393374 198156 195218 21351
Population
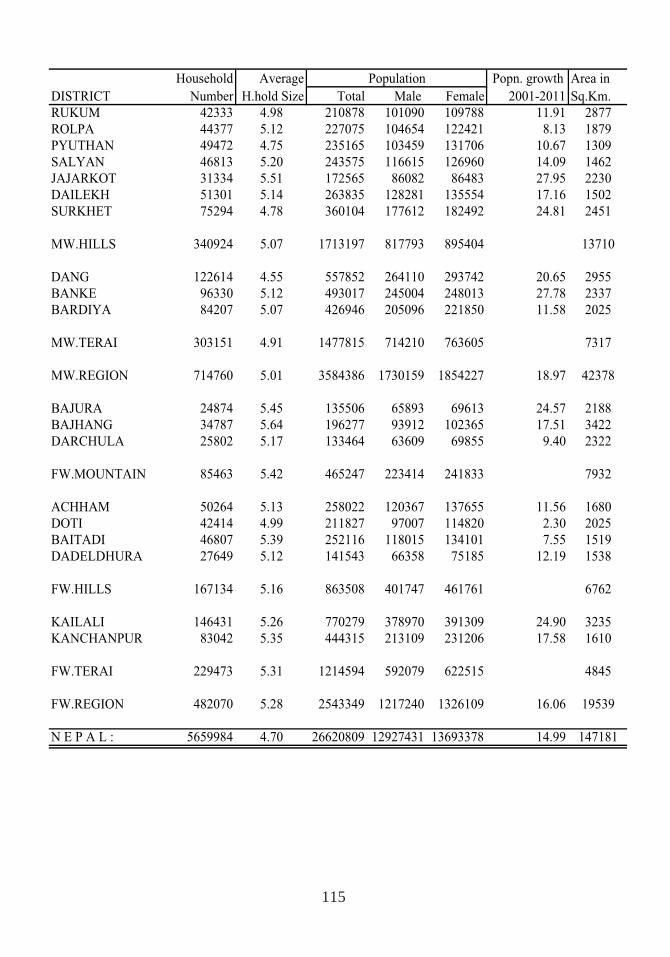
115
Household Average Popn. growth Area in
DISTRICT Number H.hold Size Total Male Female 2001-2011 Sq.Km.
RUKUM 42333 4.98 210878 101090 109788 11.91 2877
ROLPA 44377 5.12 227075 104654 122421 8.13 1879
PYUTHAN 49472 4.75 235165 103459 131706 10.67 1309
SALYAN 46813 5.20 243575 116615 126960 14.09 1462
JAJARKOT 31334 5.51 172565 86082 86483 27.95 2230
DAILEKH 51301 5.14 263835 128281 135554 17.16 1502
SURKHET 75294 4.78 360104 177612 182492 24.81 2451
MW.HILLS 340924 5.07 1713197 817793 895404 13710
DANG 122614 4.55 557852 264110 293742 20.65 2955
BANKE 96330 5.12 493017 245004 248013 27.78 2337
BARDIYA 84207 5.07 426946 205096 221850 11.58 2025
MW.TERAI 303151 4.91 1477815 714210 763605 7317
MW.REGION 714760 5.01 3584386 1730159 1854227 18.97 42378
BAJURA 24874 5.45 135506 65893 69613 24.57 2188
BAJHANG 34787 5.64 196277 93912 102365 17.51 3422
DARCHULA 25802 5.17 133464 63609 69855 9.40 2322
FW.MOUNTAIN 85463 5.42 465247 223414 241833 7932
ACHHAM 50264 5.13 258022 120367 137655 11.56 1680
DOTI 42414 4.99 211827 97007 114820 2.30 2025
BAITADI 46807 5.39 252116 118015 134101 7.55 1519
DADELDHURA 27649 5.12 141543 66358 75185 12.19 1538
FW.HILLS 167134 5.16 863508 401747 461761 6762
KAILALI 146431 5.26 770279 378970 391309 24.90 3235
KANCHANPUR 83042 5.35 444315 213109 231206 17.58 1610
FW.TERAI 229473 5.31 1214594 592079 622515 4845
FW.REGION 482070 5.28 2543349 1217240 1326109 16.06 19539
N E P A L : 5659984 4.70 26620809 12927431 13693378 14.99 147181
Population
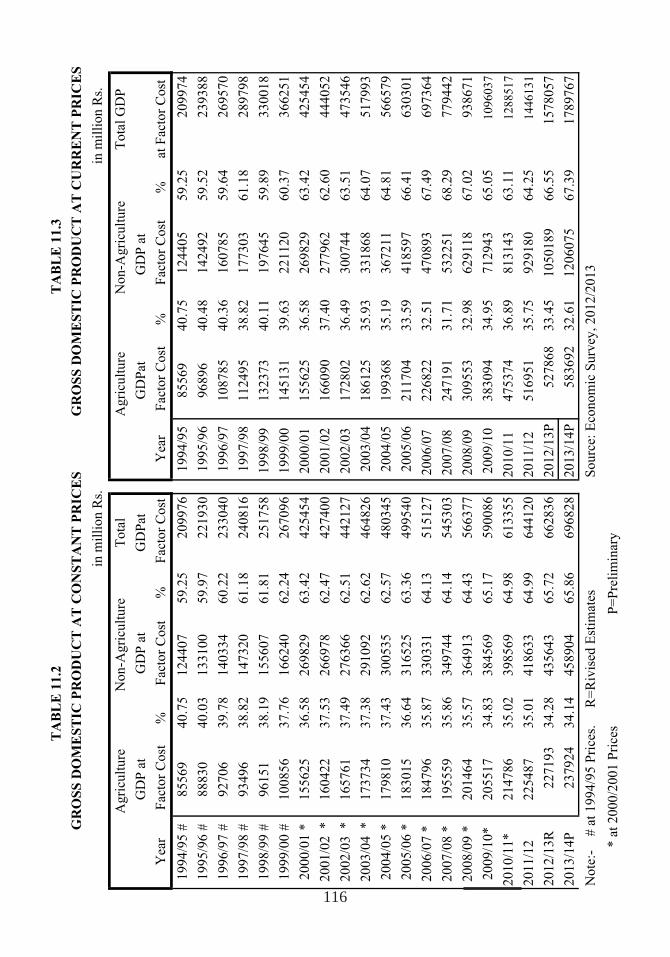
116
TA
BL
E 1
1.2
TA
BL
E 1
1.3
G
RO
SS
DO
ME
ST
IC P
RO
DU
CT
AT
CO
NS
TA
NT
PR
ICE
S
GR
OS
S D
OM
ES
TIC
PR
OD
UC
T A
T C
UR
RE
NT
PR
ICE
S
in m
illi
on R
s.in
mil
lion R
s.
Tota
l T
ota
l G
DP
GD
P a
t G
DP
at
GD
Pat
G
DP
atG
DP
at
Yea
r F
acto
r C
ost
% F
acto
r C
ost
%F
acto
r C
ost
Yea
r F
acto
r C
ost
%F
acto
r C
ost
%at
Fac
tor
Cost
1994/9
5 #
85569
40.7
5124407
59.2
5209976
1994/9
585569
40.7
5124405
59.2
5209974
1995/9
6 #
88830
40.0
3133100
59.9
7221930
1995/9
696896
40.4
8142492
59.5
2239388
1996/9
7 #
92706
39.7
8140334
60.2
2233040
1996/9
7108785
40.3
6160785
59.6
4269570
1997/9
8 #
93496
38.8
2147320
61.1
8240816
1997/9
8112495
38.8
2177303
61.1
8289798
1998/9
9 #
96151
38.1
9155607
61.8
1251758
1998/9
9
132373
40.1
1197645
59.8
9330018
1999/0
0 #
100856
37.7
6166240
62.2
4267096
1999/0
0
145131
39.6
3221120
60.3
7366251
2000/0
1 *
155625
36.5
8269829
63.4
2425454
2000/0
1
155625
36.5
8269829
63.4
2425454
2001/0
2 *
160422
37.5
3266978
62.4
7427400
2001/0
2
166090
37.4
0277962
62.6
0444052
2002/0
3 *
165761
37.4
9276366
62.5
1442127
2002/0
3
172802
36.4
9300744
63.5
1473546
2003/0
4 *
173734
37.3
8291092
62.6
2464826
2003/0
4186125
35.9
3331868
64.0
7517993
2004/0
5 *
179810
37.4
3300535
62.5
7480345
2004/0
5199368
35.1
9367211
64.8
1566579
2005/0
6 *
183015
36.6
4316525
63.3
6499540
2005/0
6211704
33.5
9418597
66.4
1630301
2006/0
7 *
184796
35.8
7330331
64.1
3515127
2006/0
7
226822
32.5
1470893
67.4
9697364
2007/0
8 *
195559
35.8
6349744
64.1
4545303
2007/0
8
247191
31.7
1532251
68.2
9779442
2008/0
9 *
201464
35.5
7364913
64.4
3566377
2008/0
9
309553
32.9
8629118
67.0
2938671
2009/1
0*
205517
34.8
3384569
65.1
7590086
2009/1
0
383094
34.9
5712943
65.0
51
09
60
37
2010/1
1*
214786
35.0
2398569
64.9
8613355
2010/1
1475374
36.8
9813143
63.1
11
28
85
17
2011/1
2225487
35.0
1418633
64.9
9644120
2011/1
2516951
35.7
5929180
64.2
51
44
61
31
2012/1
3R
227193
34.2
8435643
65.7
2662836
2012/1
3P
527868
33.4
51050189
66.5
51578057
2013/1
4P
237924
34.1
4458904
65.8
6696828
2013/1
4P
583692
32.6
11206075
67.3
91789767
Note
:- # a
t 1994/9
5 P
rice
s. R
=R
ivis
ed E
stim
ates
Sourc
e: E
conom
ic S
urv
ey, 2012/2
013
*
at
2000/2
001 P
rice
s
P=
Pre
lim
inar
y
Non-A
gri
cult
ure
A
gri
cult
ure
N
on-A
gri
cult
ure
Agri
cult
ure
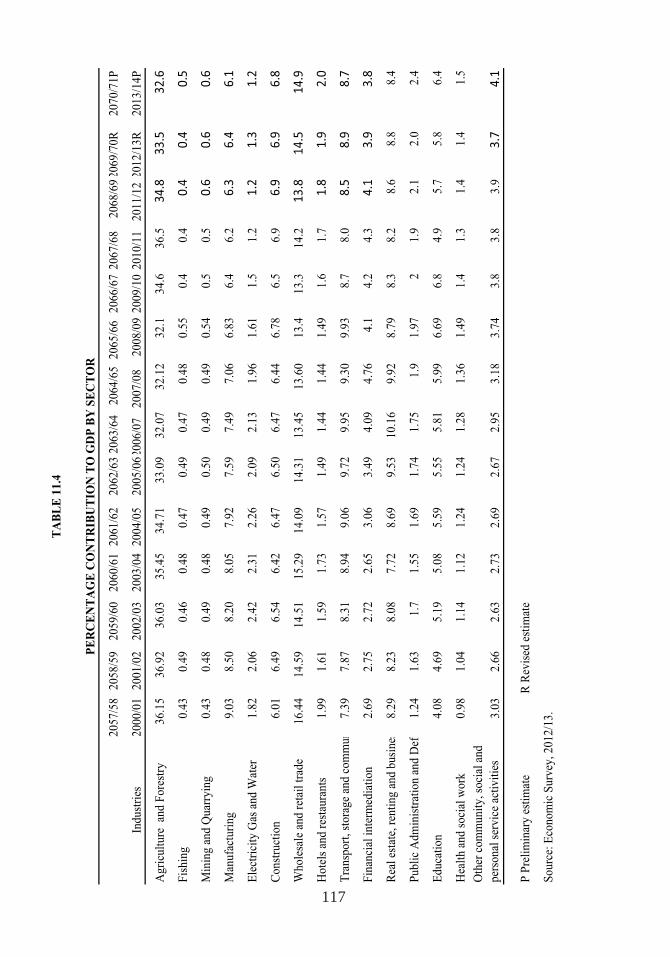
117
2057/5
82058/5
92059/6
02060/6
12061/6
22062/6
32063/6
4
2064/6
5
2065/6
6
2066/6
72067/6
8
2068/6
92069/7
0R
2070/7
1P
Indust
ries
2000/0
12001/0
22002/0
32003/0
42004/0
52005/0
62006/0
7
2007/0
8
2008/0
92009/1
0 2
010/1
1
2011/1
2 2
012/1
3R
2013/1
4P
Agri
cult
ure
an
d F
ore
stry
36.1
536.9
236.0
335.4
534.7
133.0
932.0
732.1
232.1
34.6
36.5
34.8
33.5
32.6
Fis
hin
g0.4
30.4
90.4
60.4
80.4
70.4
90.4
70.4
80.5
50.4
0.4
0.4
0.4
0.5
Min
ing a
nd Q
uar
ryin
g0.4
30.4
80.4
90.4
80.4
90.5
00.4
90.4
90.5
40.5
0.5
0.6
0.6
0.6
Man
ufa
cturi
ng
9.0
38.5
08.2
08.0
57.9
27.5
97.4
97.0
66.8
36.4
6.2
6.3
6.4
6.1
Ele
ctri
city
Gas
and W
ater
1.8
22.0
62.4
22.3
12.2
62.0
92.1
31.9
61.6
11.5
1.2
1.2
1.3
1.2
Const
ruct
ion
6.0
16.4
96.5
46.4
26.4
76.5
06.4
76.4
46.7
86.5
6.9
6.9
6.9
6.8
Whole
sale
and r
etai
l tr
ade
16.4
414.5
914.5
115.2
914.0
914.3
113.4
513.6
013.4
13.3
14.2
13.8
14.5
14.9
Hote
ls a
nd r
esta
ura
nts
1.9
91.6
11.5
91.7
31.5
71.4
91.4
41.4
41.4
91.6
1.7
1.8
1.9
2.0
Tra
nsp
ort
, st
ora
ge
and c
om
mun
7.3
97.8
78.3
18.9
49.0
69.7
29.9
59.3
09.9
38.7
8.0
8.5
8.9
8.7
Fin
anci
al i
nte
rmed
iati
on
2.6
92.7
52.7
22.6
53.0
63.4
94.0
94.7
64.1
4.2
4.3
4.1
3.9
3.8
Rea
l es
tate
, re
nti
ng a
nd b
usi
nes
8.2
98.2
38.0
87.7
28.6
99.5
310.1
69.9
28.7
98.3
8.2
8.6
8.8
8.4
Publi
c A
dm
inis
trat
ion a
nd D
e f1.2
41.6
31.7
1.5
51.6
91.7
41.7
51.9
1.9
72
1.9
2.1
2.0
2.4
Educa
tion
4.0
84.6
95.1
95.0
85.5
95.5
55.8
15.9
96.6
96.8
4.9
5.7
5.8
6.4
Hea
lth a
nd s
oci
al w
ork
0.9
81.0
41.1
41.1
21.2
41.2
41.2
81.3
61.4
91.4
1.3
1.4
1.4
1.5
Oth
er c
om
munit
y, so
cial
and
per
sonal
ser
vic
e ac
tivit
ies
3.0
32.6
62.6
32.7
32.6
92.6
72.9
53.1
83.7
43.8
3.8
3.9
3.7
4.1
P P
reli
min
ary e
stim
ate
R R
evis
ed e
stim
ate
Sourc
e: E
conom
ic S
urv
ey, 2012/1
3.
PE
RC
EN
TA
GE
CO
NT
RIB
UT
ION
TO
GD
P B
Y S
EC
TO
R
TA
BL
E 1
1.4
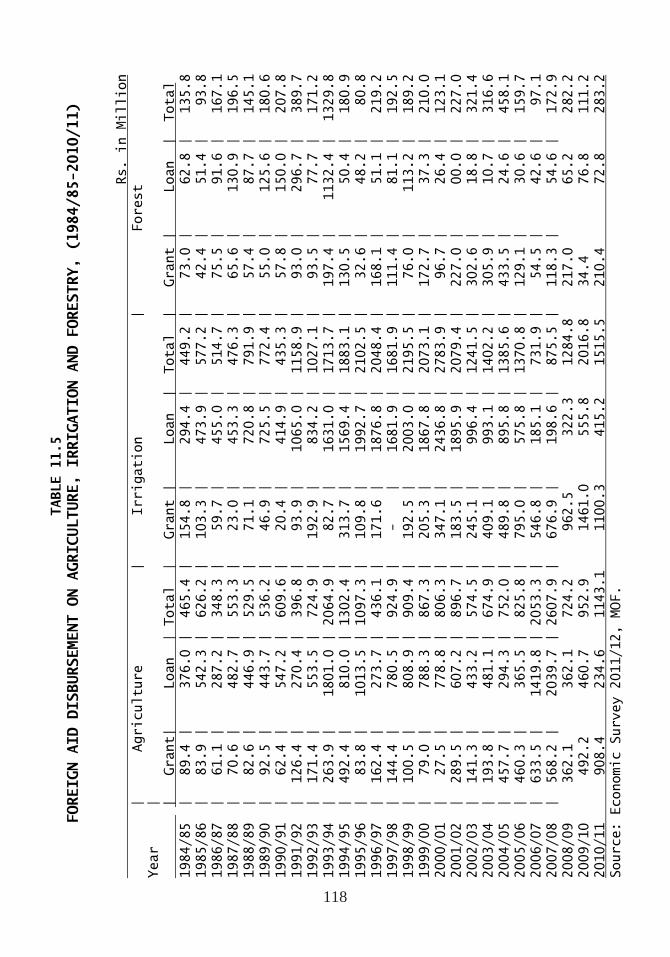
118
TABLE 11.5
FOREIGN AID DISBURSEMENT ON AGRICULTURE, IRRIGATION AND FORESTRY, (1984/85-2010/11)
Rs. in Million
| Agriculture | Irrigation | Forest
Year |
| Grant| Loan | Total | Grant | Loan | Total | Grant | Loan | Total
1984/85 | 89.4 | 376.0 | 465.4 | 154.8 | 294.4 | 449.2 | 73.0 | 62.8 | 135.8
1985/86 | 83.9 | 542.3 | 626.2 | 103.3 | 473.9 | 577.2 | 42.4 | 51.4 | 93.8
1986/87 | 61.1 | 287.2 | 348.3 | 59.7 | 455.0 | 514.7 | 75.5 | 91.6 | 167.1
1987/88 | 70.6 | 482.7 | 553.3 | 23.0 | 453.3 | 476.3 | 65.6 | 130.9 | 196.5
1988/89 | 82.6 | 446.9 | 529.5 | 71.1 | 720.8 | 791.9 | 57.4 | 87.7 | 145.1
1989/90 | 92.5 | 443.7 | 536.2 | 46.9 | 725.5 | 772.4 | 55.0 | 125.6 | 180.6
1990/91 | 62.4 | 547.2 | 609.6 | 20.4 | 414.9 | 435.3 | 57.8 | 150.0 | 207.8
1991/92 | 126.4 | 270.4 | 396.8 | 93.9 | 1065.0 | 1158.9 | 93.0 | 296.7 | 389.7
1992/93 | 171.4 | 553.5 | 724.9 | 192.9 | 834.2 | 1027.1 | 93.5 | 77.7 | 171.2
1993/94 | 263.9 | 1801.0 | 2064.9 | 82.7 | 1631.0 | 1713.7 | 197.4 | 1132.4 | 1329.8
1994/95 | 492.4 | 810.0 | 1302.4 | 313.7 | 1569.4 | 1883.1 | 130.5 | 50.4 | 180.9
1995/96 | 83.8 | 1013.5 | 1097.3 | 109.8 | 1992.7 | 2102.5 | 32.6 | 48.2 | 80.8
1996/97 | 162.4 | 273.7 | 436.1 | 171.6 | 1876.8 | 2048.4 | 168.1 | 51.1 | 219.2
1997/98 | 144.4 | 780.5 | 924.9 | - | 1681.9 | 1681.9 | 111.4 | 81.1 | 192.5
1998/99 | 100.5 | 808.9 | 909.4 | 192.5 | 2003.0 | 2195.5 | 76.0 | 113.2 | 189.2
1999/00 | 79.0 | 788.3 | 867.3 | 205.3 | 1867.8 | 2073.1 | 172.7 | 37.3 | 210.0
2000/01 | 27.5 | 778.8 | 806.3 | 347.1 | 2436.8 | 2783.9 | 96.7 | 26.4 | 123.1
2001/02 | 289.5 | 607.2 | 896.7 | 183.5 | 1895.9 | 2079.4 | 227.0 | 00.0 | 227.0
2002/03 | 141.3 | 433.2 | 574.5 | 245.1 | 996.4 | 1241.5 | 302.6 | 18.8 | 321.4
2003/04 | 193.8 | 481.1 | 674.9 | 409.1 | 993.1 | 1402.2 | 305.9 | 10.7 | 316.6
2004/05 | 457.7 | 294.3 | 752.0 | 489.8 | 895.8 | 1385.6 | 433.5 | 24.6 | 458.1
2005/06 | 460.3 | 365.5 | 825.8 | 795.0 | 575.8 | 1370.8 | 129.1 | 30.6 | 159.7
2006/07 | 633.5 | 1419.8 | 2053.3 | 546.8 | 185.1 | 731.9 | 54.5 | 42.6 | 97.1
2007/08 | 568.2 | 2039.7 | 2607.9 | 676.9 | 198.6 | 875.5 | 118.3 | 54.6 | 172.9
2008/09 362.1 362.1 724.2 962.5 322.3 1284.8 217.0 65.2 282.2
2009/10 492.2 460.7 952.9 1461.0 555.8 2016.8 34.4 76.8 111.2
2010/11 908.4 234.6 1143.1 1100.3 415.2 1515.5 210.4 72.8 283.2
Source: Economic Survey 2011/12, MOF.
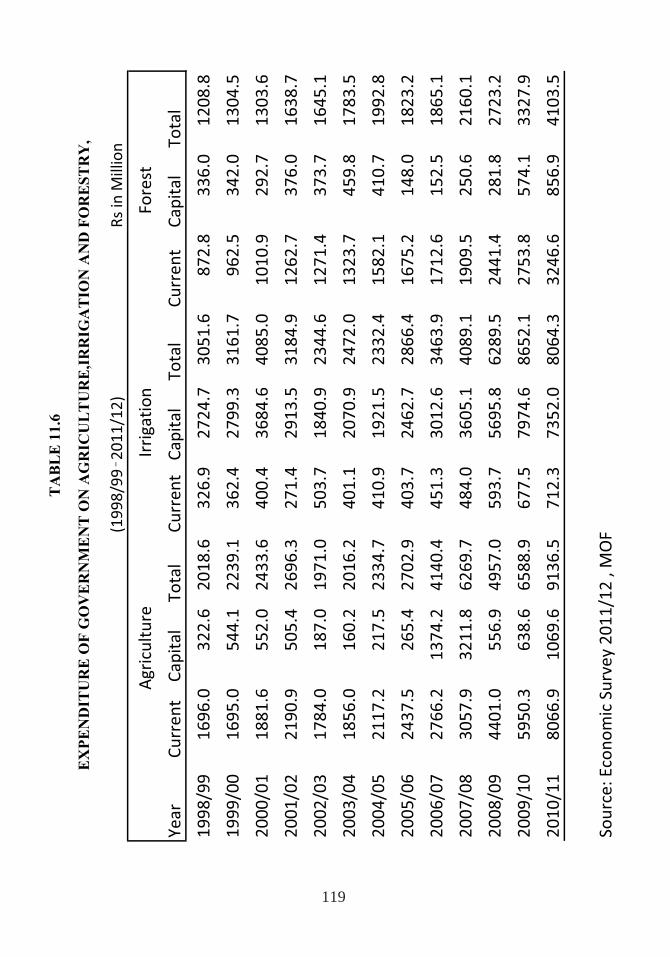
119
(1998/99
2011/12)
RsinMillion
Year
Current
Capital
Total
Current
Capital
Total
Current
Capital
Total
1998/99
1696.0
322.6
2018.6
326.9
2724.7
3051.6
872.8
336.0
1208.8
1999/00
1695.0
544.1
2239.1
362.4
2799.3
3161.7
962.5
342.0
1304.5
2000/01
1881.6
552.0
2433.6
400.4
3684.6
4085.0
1010.9
292.7
1303.6
2001/02
2190.9
505.4
2696.3
271.4
2913.5
3184.9
1262.7
376.0
1638.7
2002/03
1784.0
187.0
1971.0
503.7
1840.9
2344.6
1271.4
373.7
1645.1
2003/04
1856.0
160.2
2016.2
401.1
2070.9
2472.0
1323.7
459.8
1783.5
2004/05
2117.2
217.5
2334.7
410.9
1921.5
2332.4
1582.1
410.7
1992.8
2005/06
2437.5
265.4
2702.9
403.7
2462.7
2866.4
1675.2
148.0
1823.2
2006/07
2766.2
1374.2
4140.4
451.3
3012.6
3463.9
1712.6
152.5
1865.1
2007/08
3057.9
3211.8
6269.7
484.0
3605.1
4089.1
1909.5
250.6
2160.1
2008/09
4401.0
556.9
4957.0
593.7
5695.8
6289.5
2441.4
281.8
2723.2
2009/10
5950.3
638.6
6588.9
677.5
7974.6
8652.1
2753.8
574.1
3327.9
2010/11
8066.9
1069.6
9136.5
712.3
7352.0
8064.3
3246.6
856.9
4103.5
Source:EconomicSurvey2011/12,MOF
Agriculture
Irrigation
Forest
EX
PE
ND
ITU
RE
OF
GO
VE
RN
ME
NT
ON
AG
RIC
UL
TU
RE
,IR
RIG
AT
ION
AN
D F
OR
ES
TR
Y,
TA
BL
E 1
1.6
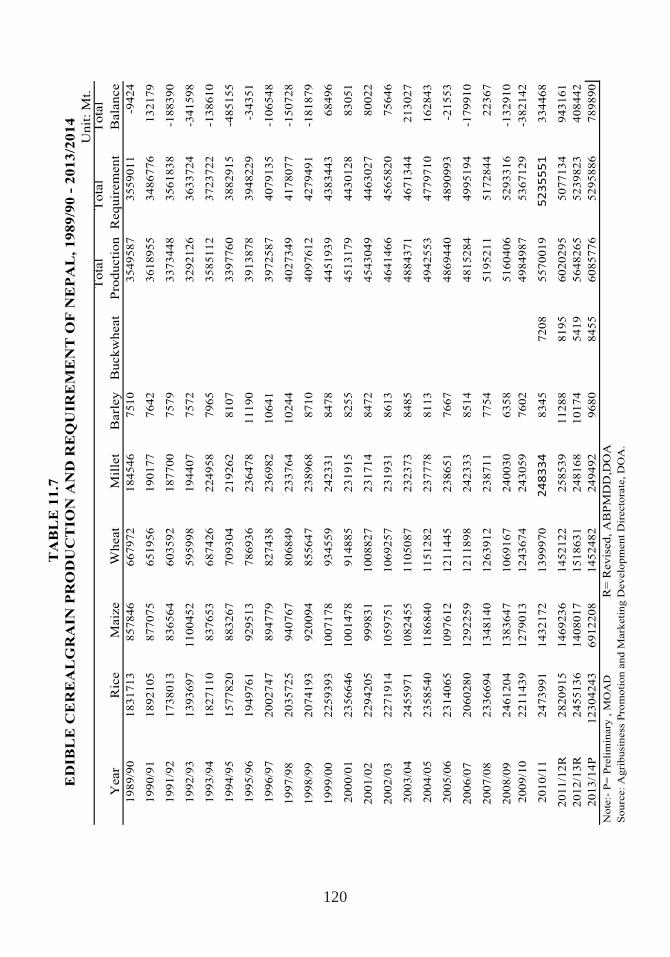
120
T
AB
LE
11.7
Un
it:
Mt.
To
tal
To
tal
To
tal
Year
Ric
eM
aiz
eW
heat
Mil
let
Barl
ey
Bu
ck
wh
eat
Pro
du
cti
on
Req
uir
em
en
tB
ala
nce
19
89
/90
18
31
71
38
57
84
66
67
97
21
84
54
67
51
03
54
95
87
35
59
01
1-9
42
4
19
90
/91
18
92
10
58
77
07
56
51
95
61
90
17
77
64
23
61
89
55
34
86
77
61
32
17
9
19
91
/92
17
38
01
38
36
56
46
03
59
21
87
70
07
57
93
37
34
48
35
61
83
8-1
88
39
0
19
92
/93
13
93
69
71
10
04
52
59
59
98
19
44
07
75
72
32
92
12
63
63
37
24
-34
15
98
19
93
/94
18
27
11
08
37
65
36
87
42
62
24
95
87
96
53
58
51
12
37
23
72
2-1
38
61
0
19
94
/95
15
77
82
08
83
26
77
09
30
42
19
26
28
10
73
39
77
60
38
82
91
5-4
85
15
5
19
95
/96
19
49
76
19
29
51
37
86
93
62
36
47
81
11
90
39
13
87
83
94
82
29
-34
35
1
19
96
/97
20
02
74
78
94
77
98
27
43
82
36
98
21
06
41
39
72
58
74
07
91
35
-10
65
48
19
97
/98
2
03
57
25
94
07
67
80
68
49
23
37
64
10
24
44
02
73
49
41
78
07
7-1
50
72
8
19
98
/99
2
07
41
93
92
00
94
85
56
47
23
89
68
87
10
40
97
61
24
27
94
91
-18
18
79
19
99
/00
2
25
93
93
10
07
17
89
34
55
92
42
33
18
47
84
45
19
39
43
83
44
36
84
96
20
00
/01
23
56
64
61
00
14
78
91
48
85
23
19
15
82
55
45
13
17
94
43
01
28
83
05
1
20
01
/02
2
29
42
05
99
98
31
10
08
82
72
31
71
48
47
24
54
30
49
44
63
02
78
00
22
20
02
/03
2
27
19
14
10
59
75
11
06
92
57
23
19
31
86
13
46
41
46
64
56
58
20
75
64
6
20
03
/04
24
55
97
11
08
24
55
11
05
08
72
32
37
38
48
54
88
43
71
46
71
34
42
13
02
7
20
04
/05
23
58
54
01
18
68
40
11
51
28
22
37
77
88
11
34
94
25
53
47
79
71
01
62
84
3
20
05
/06
23
14
06
51
09
76
12
12
11
44
52
38
65
17
66
74
86
94
40
48
90
99
3-2
15
53
20
06
/07
2
06
02
80
12
92
25
91
21
18
98
24
23
33
85
14
48
15
28
44
99
51
94
-17
99
10
20
07
/08
2
33
66
94
13
48
14
01
26
39
12
23
87
11
77
54
51
95
21
15
17
28
44
22
36
7
20
08
/09
2
46
12
04
13
83
64
71
06
91
67
24
00
30
63
58
51
60
40
65
29
33
16
-13
29
10
20
09
/10
22
11
43
91
27
90
13
12
43
67
42
43
05
97
60
24
98
49
87
53
67
12
9-3
82
14
2
20
10
/11
24
73
99
11
43
21
72
13
99
97
0248334
83
45
72
08
55
70
01
95235551
33
44
68
20
11
/12
R2
82
09
15
14
69
23
61
45
21
22
25
85
39
11
28
88
19
56
02
02
95
50
77
13
49
43
16
1
20
12
/13
R2
45
51
36
14
08
01
71
51
86
31
24
81
68
10
17
45
41
95
64
82
65
52
39
82
34
08
44
2
20
13
/14
P1
23
04
24
36
91
22
08
14
52
48
22
49
49
29
68
08
45
56
08
57
76
52
95
88
67
89
89
0
Note
:- P
= P
reli
min
ary
, M
OA
DR
= R
ev
ised
, A
BP
MD
D,D
OA
Sourc
e:
Agri
busi
ness
Pro
moti
on a
nd M
ark
eti
ng D
evelo
pm
ent
Dir
ecto
rate
, D
OA
.
ED
IBL
E C
ER
EA
LG
RA
IN P
RO
DU
CT
ION
AN
D R
EQ
UIR
EM
EN
T O
F N
EP
AL
, 1989/9
0 -
2013/2
014
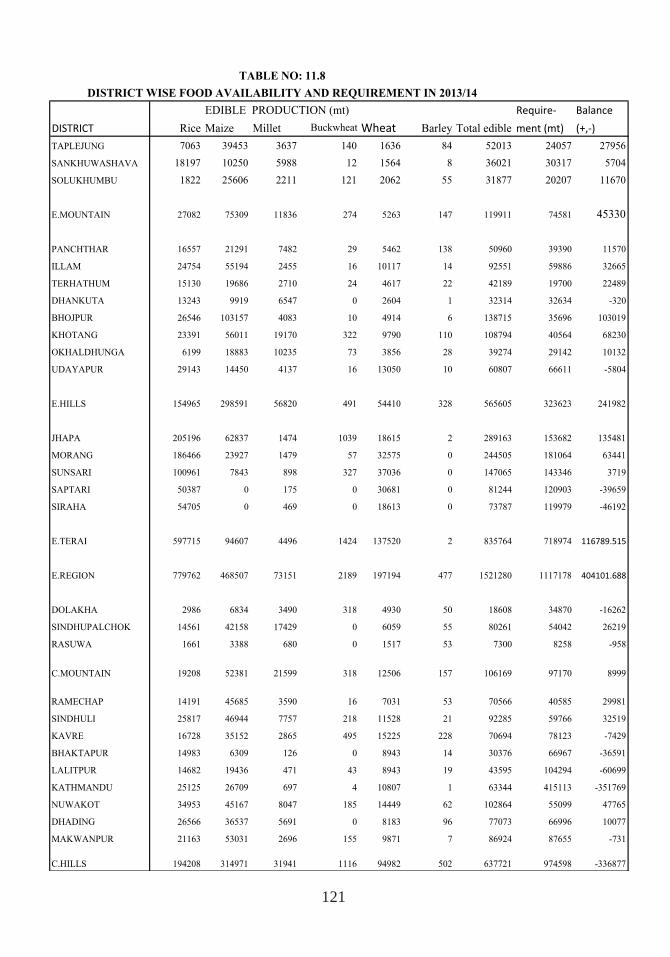
121
EDIBLE PRODUCTION (mt) Require Balance
DISTRICT Rice Maize Millet Buckwheat Wheat Barley Total edible ment (mt) (+, )
TAPLEJUNG 7063 39453 3637 140 1636 84 52013 24057 27956
SANKHUWASHAVA 18197 10250 5988 12 1564 8 36021 30317 5704
SOLUKHUMBU 1822 25606 2211 121 2062 55 31877 20207 11670
E.MOUNTAIN 27082 75309 11836 274 5263 147 119911 74581 45330
PANCHTHAR 16557 21291 7482 29 5462 138 50960 39390 11570
ILLAM 24754 55194 2455 16 10117 14 92551 59886 32665
TERHATHUM 15130 19686 2710 24 4617 22 42189 19700 22489
DHANKUTA 13243 9919 6547 0 2604 1 32314 32634 -320
BHOJPUR 26546 103157 4083 10 4914 6 138715 35696 103019
KHOTANG 23391 56011 19170 322 9790 110 108794 40564 68230
OKHALDHUNGA 6199 18883 10235 73 3856 28 39274 29142 10132
UDAYAPUR 29143 14450 4137 16 13050 10 60807 66611 -5804
E.HILLS 154965 298591 56820 491 54410 328 565605 323623 241982
JHAPA 205196 62837 1474 1039 18615 2 289163 153682 135481
MORANG 186466 23927 1479 57 32575 0 244505 181064 63441
SUNSARI 100961 7843 898 327 37036 0 147065 143346 3719
SAPTARI 50387 0 175 0 30681 0 81244 120903 -39659
SIRAHA 54705 0 469 0 18613 0 73787 119979 -46192
E.TERAI 597715 94607 4496 1424 137520 2 835764 718974 116789.515
E.REGION 779762 468507 73151 2189 197194 477 1521280 1117178 404101.688
DOLAKHA 2986 6834 3490 318 4930 50 18608 34870 -16262
SINDHUPALCHOK 14561 42158 17429 0 6059 55 80261 54042 26219
RASUWA 1661 3388 680 0 1517 53 7300 8258 -958
C.MOUNTAIN 19208 52381 21599 318 12506 157 106169 97170 8999
RAMECHAP 14191 45685 3590 16 7031 53 70566 40585 29981
SINDHULI 25817 46944 7757 218 11528 21 92285 59766 32519
KAVRE 16728 35152 2865 495 15225 228 70694 78123 -7429
BHAKTAPUR 14983 6309 126 0 8943 14 30376 66967 -36591
LALITPUR 14682 19436 471 43 8943 19 43595 104294 -60699
KATHMANDU 25125 26709 697 4 10807 1 63344 415113 -351769
NUWAKOT 34953 45167 8047 185 14449 62 102864 55099 47765
DHADING 26566 36537 5691 0 8183 96 77073 66996 10077
MAKWANPUR 21163 53031 2696 155 9871 7 86924 87655 -731
C.HILLS 194208 314971 31941 1116 94982 502 637721 974598 -336877
TABLE NO: 11.8
DISTRICT WISE FOOD AVAILABILITY AND REQUIREMENT IN 2013/14
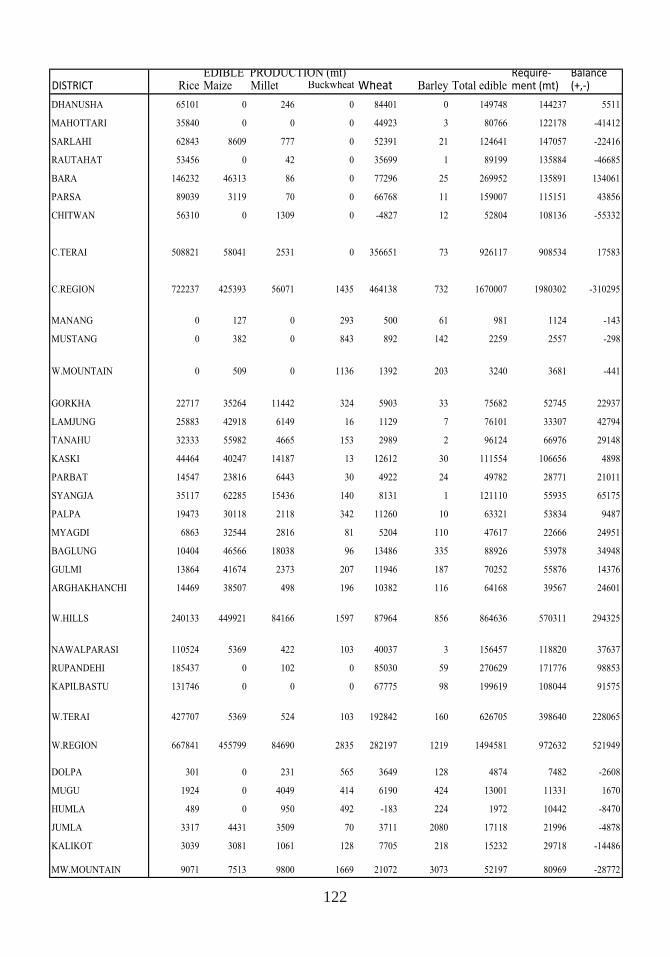
122
EDIBLE PRODUCTION (mt) Require BalanceDISTRICT Rice Maize Millet Buckwheat Wheat Barley Total edible ment (mt) (+, )
DHANUSHA 65101 0 246 0 84401 0 149748 144237 5511
MAHOTTARI 35840 0 0 0 44923 3 80766 122178 -41412
SARLAHI 62843 8609 777 0 52391 21 124641 147057 -22416
RAUTAHAT 53456 0 42 0 35699 1 89199 135884 -46685
BARA 146232 46313 86 0 77296 25 269952 135891 134061
PARSA 89039 3119 70 0 66768 11 159007 115151 43856
CHITWAN 56310 0 1309 0 -4827 12 52804 108136 -55332
C.TERAI 508821 58041 2531 0 356651 73 926117 908534 17583
C.REGION 722237 425393 56071 1435 464138 732 1670007 1980302 -310295
MANANG 0 127 0 293 500 61 981 1124 -143
MUSTANG 0 382 0 843 892 142 2259 2557 -298
W.MOUNTAIN 0 509 0 1136 1392 203 3240 3681 -441
GORKHA 22717 35264 11442 324 5903 33 75682 52745 22937
LAMJUNG 25883 42918 6149 16 1129 7 76101 33307 42794
TANAHU 32333 55982 4665 153 2989 2 96124 66976 29148
KASKI 44464 40247 14187 13 12612 30 111554 106656 4898
PARBAT 14547 23816 6443 30 4922 24 49782 28771 21011
SYANGJA 35117 62285 15436 140 8131 1 121110 55935 65175
PALPA 19473 30118 2118 342 11260 10 63321 53834 9487
MYAGDI 6863 32544 2816 81 5204 110 47617 22666 24951
BAGLUNG 10404 46566 18038 96 13486 335 88926 53978 34948
GULMI 13864 41674 2373 207 11946 187 70252 55876 14376
ARGHAKHANCHI 14469 38507 498 196 10382 116 64168 39567 24601
W.HILLS 240133 449921 84166 1597 87964 856 864636 570311 294325
NAWALPARASI 110524 5369 422 103 40037 3 156457 118820 37637
RUPANDEHI 185437 0 102 0 85030 59 270629 171776 98853
KAPILBASTU 131746 0 0 0 67775 98 199619 108044 91575
W.TERAI 427707 5369 524 103 192842 160 626705 398640 228065
W.REGION 667841 455799 84690 2835 282197 1219 1494581 972632 521949
DOLPA 301 0 231 565 3649 128 4874 7482 -2608
MUGU 1924 0 4049 414 6190 424 13001 11331 1670
HUMLA 489 0 950 492 -183 224 1972 10442 -8470
JUMLA 3317 4431 3509 70 3711 2080 17118 21996 -4878
KALIKOT 3039 3081 1061 128 7705 218 15232 29718 -14486
MW.MOUNTAIN 9071 7513 9800 1669 21072 3073 52197 80969 -28772
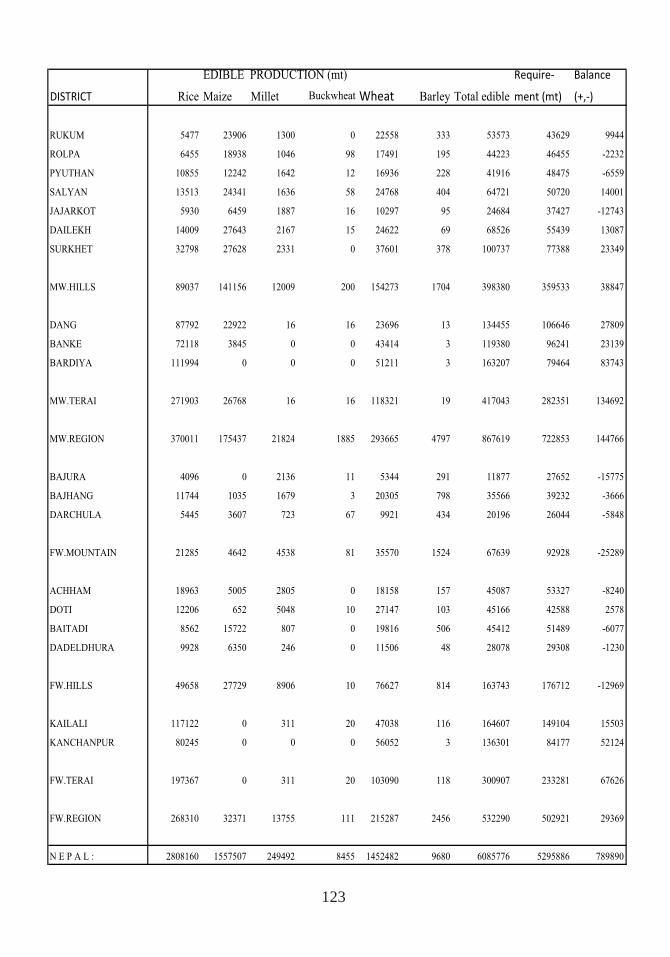
123
EDIBLE PRODUCTION (mt) Require Balance
DISTRICT Rice Maize Millet Buckwheat Wheat Barley Total edible ment (mt) (+, )
RUKUM 5477 23906 1300 0 22558 333 53573 43629 9944
ROLPA 6455 18938 1046 98 17491 195 44223 46455 -2232
PYUTHAN 10855 12242 1642 12 16936 228 41916 48475 -6559
SALYAN 13513 24341 1636 58 24768 404 64721 50720 14001
JAJARKOT 5930 6459 1887 16 10297 95 24684 37427 -12743
DAILEKH 14009 27643 2167 15 24622 69 68526 55439 13087
SURKHET 32798 27628 2331 0 37601 378 100737 77388 23349
MW.HILLS 89037 141156 12009 200 154273 1704 398380 359533 38847
DANG 87792 22922 16 16 23696 13 134455 106646 27809
BANKE 72118 3845 0 0 43414 3 119380 96241 23139
BARDIYA 111994 0 0 0 51211 3 163207 79464 83743
MW.TERAI 271903 26768 16 16 118321 19 417043 282351 134692
MW.REGION 370011 175437 21824 1885 293665 4797 867619 722853 144766
BAJURA 4096 0 2136 11 5344 291 11877 27652 -15775
BAJHANG 11744 1035 1679 3 20305 798 35566 39232 -3666
DARCHULA 5445 3607 723 67 9921 434 20196 26044 -5848
FW.MOUNTAIN 21285 4642 4538 81 35570 1524 67639 92928 -25289
ACHHAM 18963 5005 2805 0 18158 157 45087 53327 -8240
DOTI 12206 652 5048 10 27147 103 45166 42588 2578
BAITADI 8562 15722 807 0 19816 506 45412 51489 -6077
DADELDHURA 9928 6350 246 0 11506 48 28078 29308 -1230
FW.HILLS 49658 27729 8906 10 76627 814 163743 176712 -12969
KAILALI 117122 0 311 20 47038 116 164607 149104 15503
KANCHANPUR 80245 0 0 0 56052 3 136301 84177 52124
FW.TERAI 197367 0 311 20 103090 118 300907 233281 67626
FW.REGION 268310 32371 13755 111 215287 2456 532290 502921 29369
N E P A L : 2808160 1557507 249492 8455 1452482 9680 6085776 5295886 789890
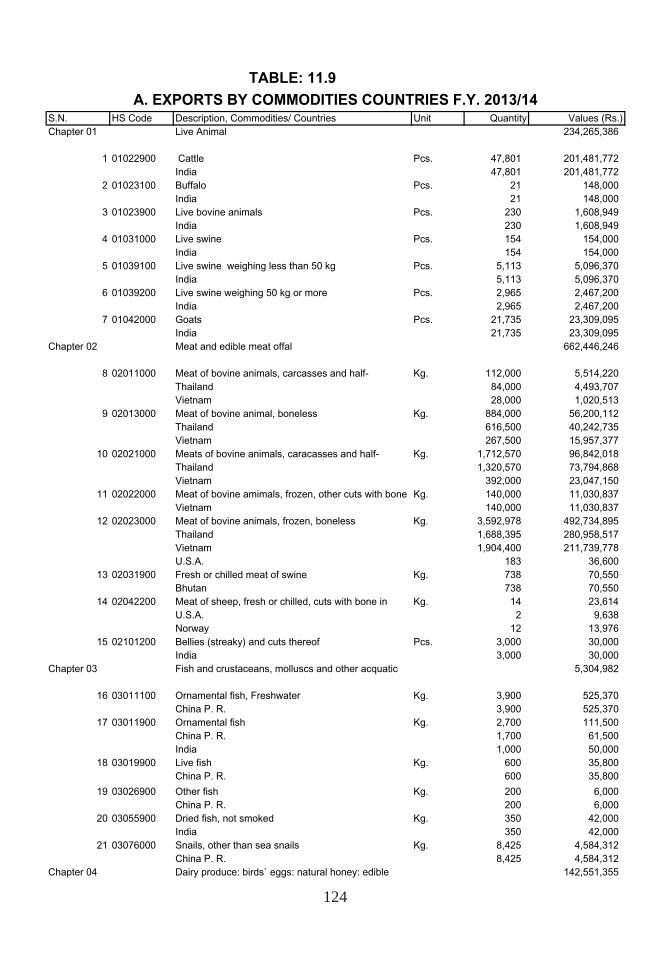
124
TABLE: 11.9
S.N. HS Code Description, Commodities/ Countries Unit Quantity Values (Rs.) Chapter 01 Live Animal 234,265,386
1 01022900 Cattle Pcs. 47,801 201,481,772 India 47,801 201,481,772
2 01023100 Buffalo Pcs. 21 148,000 India 21 148,000
3 01023900 Live bovine animals Pcs. 230 1,608,949 India 230 1,608,949
4 01031000 Live swine Pcs. 154 154,000 India 154 154,000
5 01039100 Live swine weighing less than 50 kg Pcs. 5,113 5,096,370 India 5,113 5,096,370
6 01039200 Live swine weighing 50 kg or more Pcs. 2,965 2,467,200 India 2,965 2,467,200
7 01042000 Goats Pcs. 21,735 23,309,095 India 21,735 23,309,095
Chapter 02 Meat and edible meat offal 662,446,246
8 02011000 Meat of bovine animals, carcasses and half- Kg. 112,000 5,514,220 Thailand 84,000 4,493,707 Vietnam 28,000 1,020,513
9 02013000 Meat of bovine animal, boneless Kg. 884,000 56,200,112 Thailand 616,500 40,242,735 Vietnam 267,500 15,957,377
10 02021000 Meats of bovine animals, caracasses and half- Kg. 1,712,570 96,842,018 Thailand 1,320,570 73,794,868 Vietnam 392,000 23,047,150
11 02022000 Meat of bovine amimals, frozen, other cuts with bone Kg. 140,000 11,030,837 Vietnam 140,000 11,030,837
12 02023000 Meat of bovine animals, frozen, boneless Kg. 3,592,978 492,734,895 Thailand 1,688,395 280,958,517 Vietnam 1,904,400 211,739,778 U.S.A. 183 36,600
13 02031900 Fresh or chilled meat of swine Kg. 738 70,550 Bhutan 738 70,550
14 02042200 Meat of sheep, fresh or chilled, cuts with bone in Kg. 14 23,614 U.S.A. 2 9,638 Norway 12 13,976
15 02101200 Bellies (streaky) and cuts thereof Pcs. 3,000 30,000 India 3,000 30,000
Chapter 03 Fish and crustaceans, molluscs and other acquatic 5,304,982
16 03011100 Ornamental fish, Freshwater Kg. 3,900 525,370 China P. R. 3,900 525,370
17 03011900 Ornamental fish Kg. 2,700 111,500 China P. R. 1,700 61,500 India 1,000 50,000
18 03019900 Live fish Kg. 600 35,800 China P. R. 600 35,800
19 03026900 Other fish Kg. 200 6,000 China P. R. 200 6,000
20 03055900 Dried fish, not smoked Kg. 350 42,000 India 350 42,000
21 03076000 Snails, other than sea snails Kg. 8,425 4,584,312 China P. R. 8,425 4,584,312
Chapter 04 Dairy produce: birds` eggs: natural honey: edible 142,551,355
A. EXPORTS BY COMMODITIES COUNTRIES F.Y. 2013/14
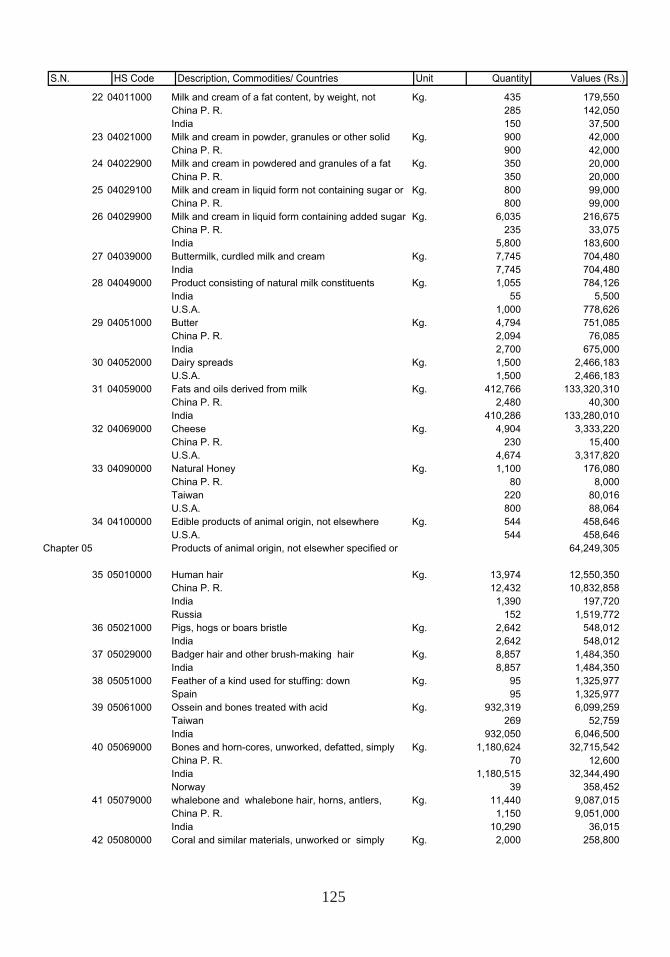
125
22 04011000 Milk and cream of a fat content, by weight, not Kg. 435 179,550 China P. R. 285 142,050 India 150 37,500
23 04021000 Milk and cream in powder, granules or other solid Kg. 900 42,000 China P. R. 900 42,000
24 04022900 Milk and cream in powdered and granules of a fat Kg. 350 20,000 China P. R. 350 20,000
25 04029100 Milk and cream in liquid form not containing sugar or Kg. 800 99,000 China P. R. 800 99,000
26 04029900 Milk and cream in liquid form containing added sugar Kg. 6,035 216,675 China P. R. 235 33,075 India 5,800 183,600
27 04039000 Buttermilk, curdled milk and cream Kg. 7,745 704,480 India 7,745 704,480
28 04049000 Product consisting of natural milk constituents Kg. 1,055 784,126 India 55 5,500 U.S.A. 1,000 778,626
29 04051000 Butter Kg. 4,794 751,085 China P. R. 2,094 76,085 India 2,700 675,000
30 04052000 Dairy spreads Kg. 1,500 2,466,183 U.S.A. 1,500 2,466,183
31 04059000 Fats and oils derived from milk Kg. 412,766 133,320,310 China P. R. 2,480 40,300 India 410,286 133,280,010
32 04069000 Cheese Kg. 4,904 3,333,220 China P. R. 230 15,400 U.S.A. 4,674 3,317,820
33 04090000 Natural Honey Kg. 1,100 176,080 China P. R. 80 8,000 Taiwan 220 80,016 U.S.A. 800 88,064
34 04100000 Edible products of animal origin, not elsewhere Kg. 544 458,646 U.S.A. 544 458,646
Chapter 05 Products of animal origin, not elsewher specified or 64,249,305
35 05010000 Human hair Kg. 13,974 12,550,350 China P. R. 12,432 10,832,858 India 1,390 197,720 Russia 152 1,519,772
36 05021000 Pigs, hogs or boars bristle Kg. 2,642 548,012 India 2,642 548,012
37 05029000 Badger hair and other brush-making hair Kg. 8,857 1,484,350 India 8,857 1,484,350
38 05051000 Feather of a kind used for stuffing: down Kg. 95 1,325,977 Spain 95 1,325,977
39 05061000 Ossein and bones treated with acid Kg. 932,319 6,099,259 Taiwan 269 52,759 India 932,050 6,046,500
40 05069000 Bones and horn-cores, unworked, defatted, simply Kg. 1,180,624 32,715,542 China P. R. 70 12,600 India 1,180,515 32,344,490 Norway 39 358,452
41 05079000 whalebone and whalebone hair, horns, antlers, Kg. 11,440 9,087,015 China P. R. 1,150 9,051,000 India 10,290 36,015
42 05080000 Coral and similar materials, unworked or simply Kg. 2,000 258,800
S.N. HS Code Description, Commodities/ Countries Unit Quantity Values (Rs.)
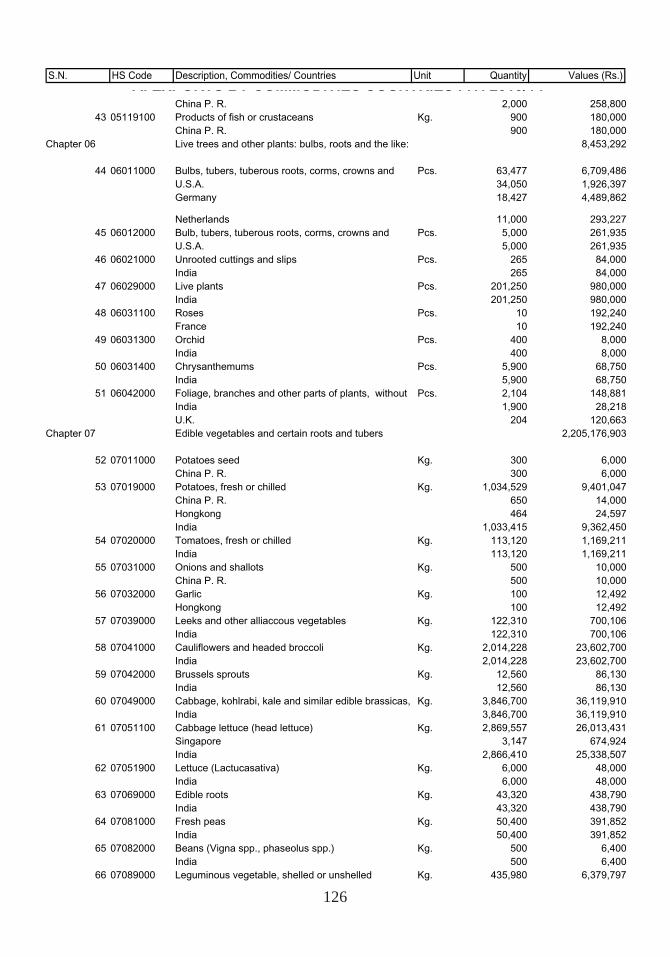
126
S.N. HS Code Description, Commodities/ Countries Unit Quantity Values (Rs.) A. EXPORTS BY COMMODITIES COUNTRIES F.Y. 2013/14
China P. R. 2,000 258,800 43 05119100 Products of fish or crustaceans Kg. 900 180,000
China P. R. 900 180,000 Chapter 06 Live trees and other plants: bulbs, roots and the like: 8,453,292
44 06011000 Bulbs, tubers, tuberous roots, corms, crowns and Pcs. 63,477 6,709,486 U.S.A. 34,050 1,926,397 Germany 18,427 4,489,862
Netherlands 11,000 293,227 45 06012000 Bulb, tubers, tuberous roots, corms, crowns and Pcs. 5,000 261,935
U.S.A. 5,000 261,935 46 06021000 Unrooted cuttings and slips Pcs. 265 84,000
India 265 84,000 47 06029000 Live plants Pcs. 201,250 980,000
India 201,250 980,000 48 06031100 Roses Pcs. 10 192,240
France 10 192,240 49 06031300 Orchid Pcs. 400 8,000
India 400 8,000 50 06031400 Chrysanthemums Pcs. 5,900 68,750
India 5,900 68,750 51 06042000 Foliage, branches and other parts of plants, without Pcs. 2,104 148,881
India 1,900 28,218 U.K. 204 120,663
Chapter 07 Edible vegetables and certain roots and tubers 2,205,176,903
52 07011000 Potatoes seed Kg. 300 6,000 China P. R. 300 6,000
53 07019000 Potatoes, fresh or chilled Kg. 1,034,529 9,401,047 China P. R. 650 14,000 Hongkong 464 24,597 India 1,033,415 9,362,450
54 07020000 Tomatoes, fresh or chilled Kg. 113,120 1,169,211 India 113,120 1,169,211
55 07031000 Onions and shallots Kg. 500 10,000 China P. R. 500 10,000
56 07032000 Garlic Kg. 100 12,492 Hongkong 100 12,492
57 07039000 Leeks and other alliaccous vegetables Kg. 122,310 700,106 India 122,310 700,106
58 07041000 Cauliflowers and headed broccoli Kg. 2,014,228 23,602,700 India 2,014,228 23,602,700
59 07042000 Brussels sprouts Kg. 12,560 86,130 India 12,560 86,130
60 07049000 Cabbage, kohlrabi, kale and similar edible brassicas, Kg. 3,846,700 36,119,910 India 3,846,700 36,119,910
61 07051100 Cabbage lettuce (head lettuce) Kg. 2,869,557 26,013,431 Singapore 3,147 674,924 India 2,866,410 25,338,507
62 07051900 Lettuce (Lactucasativa) Kg. 6,000 48,000 India 6,000 48,000
63 07069000 Edible roots Kg. 43,320 438,790 India 43,320 438,790
64 07081000 Fresh peas Kg. 50,400 391,852 India 50,400 391,852
65 07082000 Beans (Vigna spp., phaseolus spp.) Kg. 500 6,400 India 500 6,400
66 07089000 Leguminous vegetable, shelled or unshelled Kg. 435,980 6,379,797
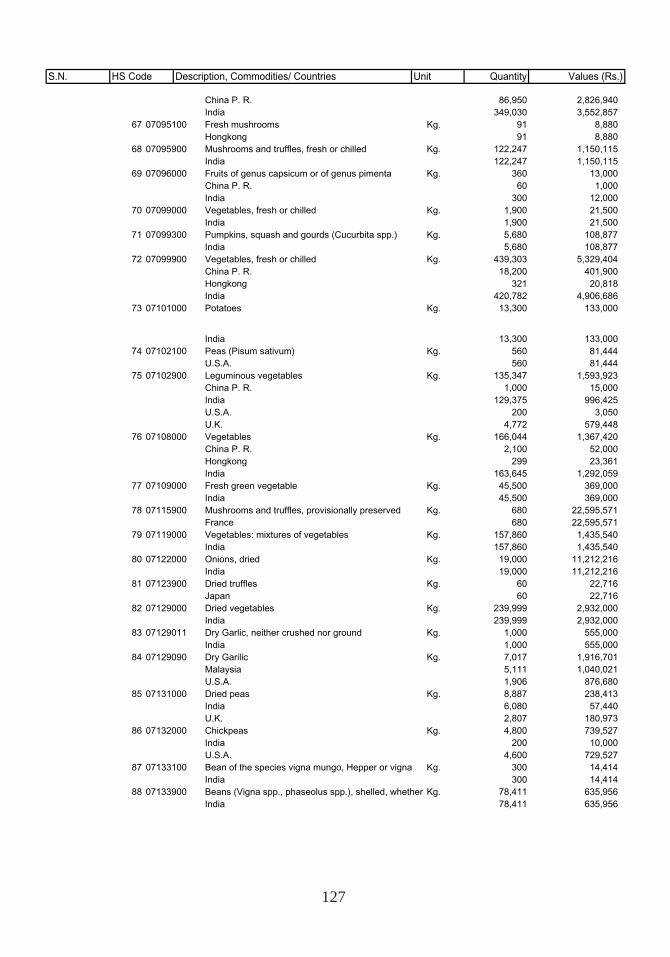
127
S.N. HS Code Description, Commodities/ Countries Unit Quantity Values (Rs.)
China P. R. 86,950 2,826,940 India 349,030 3,552,857
67 07095100 Fresh mushrooms Kg. 91 8,880 Hongkong 91 8,880
68 07095900 Mushrooms and truffles, fresh or chilled Kg. 122,247 1,150,115 India 122,247 1,150,115
69 07096000 Fruits of genus capsicum or of genus pimenta Kg. 360 13,000 China P. R. 60 1,000 India 300 12,000
70 07099000 Vegetables, fresh or chilled Kg. 1,900 21,500 India 1,900 21,500
71 07099300 Pumpkins, squash and gourds (Cucurbita spp.) Kg. 5,680 108,877 India 5,680 108,877
72 07099900 Vegetables, fresh or chilled Kg. 439,303 5,329,404 China P. R. 18,200 401,900 Hongkong 321 20,818 India 420,782 4,906,686
73 07101000 Potatoes Kg. 13,300 133,000
India 13,300 133,000 74 07102100 Peas (Pisum sativum) Kg. 560 81,444
U.S.A. 560 81,444 75 07102900 Leguminous vegetables Kg. 135,347 1,593,923
China P. R. 1,000 15,000 India 129,375 996,425 U.S.A. 200 3,050 U.K. 4,772 579,448
76 07108000 Vegetables Kg. 166,044 1,367,420 China P. R. 2,100 52,000 Hongkong 299 23,361 India 163,645 1,292,059
77 07109000 Fresh green vegetable Kg. 45,500 369,000 India 45,500 369,000
78 07115900 Mushrooms and truffles, provisionally preserved Kg. 680 22,595,571 France 680 22,595,571
79 07119000 Vegetables: mixtures of vegetables Kg. 157,860 1,435,540 India 157,860 1,435,540
80 07122000 Onions, dried Kg. 19,000 11,212,216 India 19,000 11,212,216
81 07123900 Dried truffles Kg. 60 22,716 Japan 60 22,716
82 07129000 Dried vegetables Kg. 239,999 2,932,000 India 239,999 2,932,000
83 07129011 Dry Garlic, neither crushed nor ground Kg. 1,000 555,000 India 1,000 555,000
84 07129090 Dry Garilic Kg. 7,017 1,916,701 Malaysia 5,111 1,040,021 U.S.A. 1,906 876,680
85 07131000 Dried peas Kg. 8,887 238,413 India 6,080 57,440 U.K. 2,807 180,973
86 07132000 Chickpeas Kg. 4,800 739,527 India 200 10,000 U.S.A. 4,600 729,527
87 07133100 Bean of the species vigna mungo, Hepper or vigna Kg. 300 14,414 India 300 14,414
88 07133900 Beans (Vigna spp., phaseolus spp.), shelled, whether Kg. 78,411 635,956 India 78,411 635,956
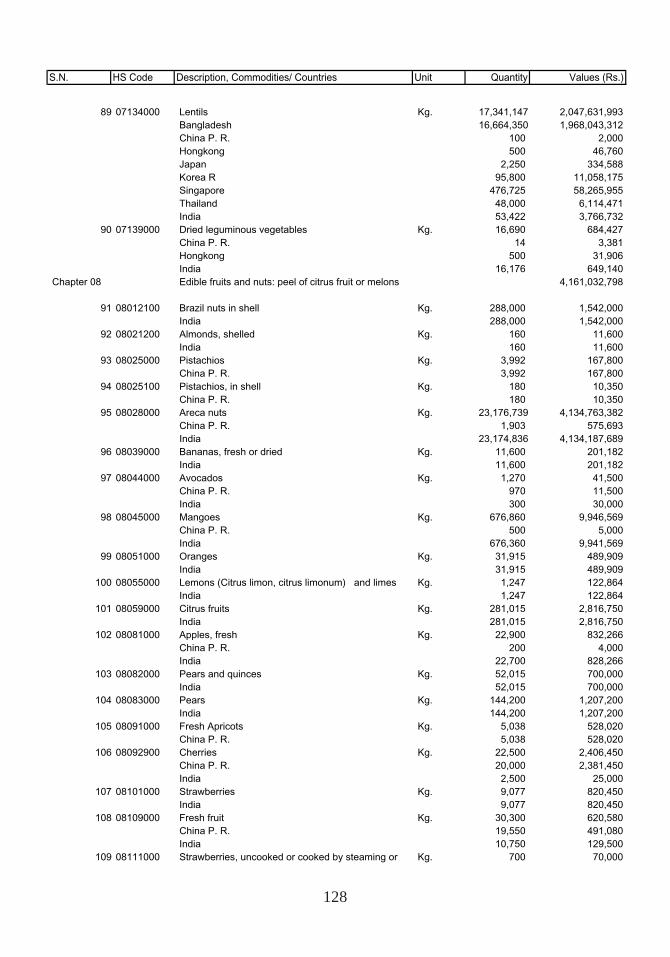
128
S.N. HS Code Description, Commodities/ Countries Unit Quantity Values (Rs.)
89 07134000 Lentils Kg. 17,341,147 2,047,631,993 Bangladesh 16,664,350 1,968,043,312 China P. R. 100 2,000 Hongkong 500 46,760 Japan 2,250 334,588 Korea R 95,800 11,058,175 Singapore 476,725 58,265,955 Thailand 48,000 6,114,471 India 53,422 3,766,732
90 07139000 Dried leguminous vegetables Kg. 16,690 684,427 China P. R. 14 3,381 Hongkong 500 31,906 India 16,176 649,140
Chapter 08 Edible fruits and nuts: peel of citrus fruit or melons 4,161,032,798
91 08012100 Brazil nuts in shell Kg. 288,000 1,542,000 India 288,000 1,542,000
92 08021200 Almonds, shelled Kg. 160 11,600 India 160 11,600
93 08025000 Pistachios Kg. 3,992 167,800 China P. R. 3,992 167,800
94 08025100 Pistachios, in shell Kg. 180 10,350 China P. R. 180 10,350
95 08028000 Areca nuts Kg. 23,176,739 4,134,763,382 China P. R. 1,903 575,693 India 23,174,836 4,134,187,689
96 08039000 Bananas, fresh or dried Kg. 11,600 201,182 India 11,600 201,182
97 08044000 Avocados Kg. 1,270 41,500 China P. R. 970 11,500 India 300 30,000
98 08045000 Mangoes Kg. 676,860 9,946,569 China P. R. 500 5,000 India 676,360 9,941,569
99 08051000 Oranges Kg. 31,915 489,909 India 31,915 489,909
100 08055000 Lemons (Citrus limon, citrus limonum) and limes Kg. 1,247 122,864 India 1,247 122,864
101 08059000 Citrus fruits Kg. 281,015 2,816,750 India 281,015 2,816,750
102 08081000 Apples, fresh Kg. 22,900 832,266 China P. R. 200 4,000 India 22,700 828,266
103 08082000 Pears and quinces Kg. 52,015 700,000 India 52,015 700,000
104 08083000 Pears Kg. 144,200 1,207,200 India 144,200 1,207,200
105 08091000 Fresh Apricots Kg. 5,038 528,020 China P. R. 5,038 528,020
106 08092900 Cherries Kg. 22,500 2,406,450 China P. R. 20,000 2,381,450 India 2,500 25,000
107 08101000 Strawberries Kg. 9,077 820,450 India 9,077 820,450
108 08109000 Fresh fruit Kg. 30,300 620,580 China P. R. 19,550 491,080 India 10,750 129,500
109 08111000 Strawberries, uncooked or cooked by steaming or Kg. 700 70,000
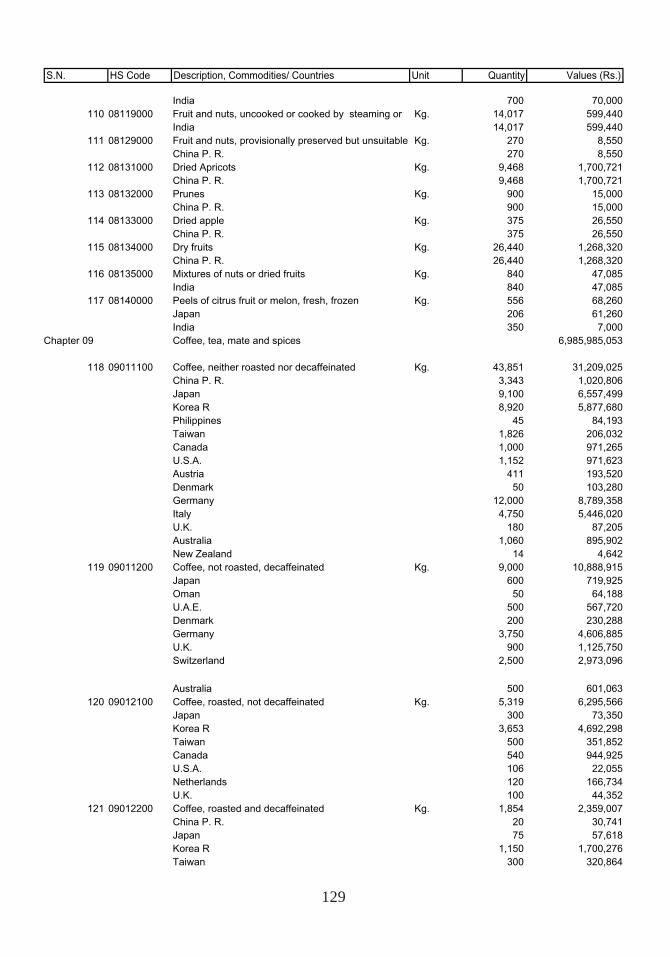
129
S.N. HS Code Description, Commodities/ Countries Unit Quantity Values (Rs.)
India 700 70,000 110 08119000 Fruit and nuts, uncooked or cooked by steaming or Kg. 14,017 599,440
India 14,017 599,440 111 08129000 Fruit and nuts, provisionally preserved but unsuitable Kg. 270 8,550
China P. R. 270 8,550 112 08131000 Dried Apricots Kg. 9,468 1,700,721
China P. R. 9,468 1,700,721 113 08132000 Prunes Kg. 900 15,000
China P. R. 900 15,000 114 08133000 Dried apple Kg. 375 26,550
China P. R. 375 26,550 115 08134000 Dry fruits Kg. 26,440 1,268,320
China P. R. 26,440 1,268,320 116 08135000 Mixtures of nuts or dried fruits Kg. 840 47,085
India 840 47,085 117 08140000 Peels of citrus fruit or melon, fresh, frozen Kg. 556 68,260
Japan 206 61,260 India 350 7,000
Chapter 09 Coffee, tea, mate and spices 6,985,985,053
118 09011100 Coffee, neither roasted nor decaffeinated Kg. 43,851 31,209,025 China P. R. 3,343 1,020,806 Japan 9,100 6,557,499 Korea R 8,920 5,877,680 Philippines 45 84,193 Taiwan 1,826 206,032 Canada 1,000 971,265 U.S.A. 1,152 971,623 Austria 411 193,520 Denmark 50 103,280 Germany 12,000 8,789,358 Italy 4,750 5,446,020 U.K. 180 87,205 Australia 1,060 895,902 New Zealand 14 4,642
119 09011200 Coffee, not roasted, decaffeinated Kg. 9,000 10,888,915 Japan 600 719,925 Oman 50 64,188 U.A.E. 500 567,720 Denmark 200 230,288 Germany 3,750 4,606,885 U.K. 900 1,125,750 Switzerland 2,500 2,973,096
Australia 500 601,063 120 09012100 Coffee, roasted, not decaffeinated Kg. 5,319 6,295,566
Japan 300 73,350 Korea R 3,653 4,692,298 Taiwan 500 351,852 Canada 540 944,925 U.S.A. 106 22,055 Netherlands 120 166,734 U.K. 100 44,352
121 09012200 Coffee, roasted and decaffeinated Kg. 1,854 2,359,007 China P. R. 20 30,741 Japan 75 57,618 Korea R 1,150 1,700,276 Taiwan 300 320,864
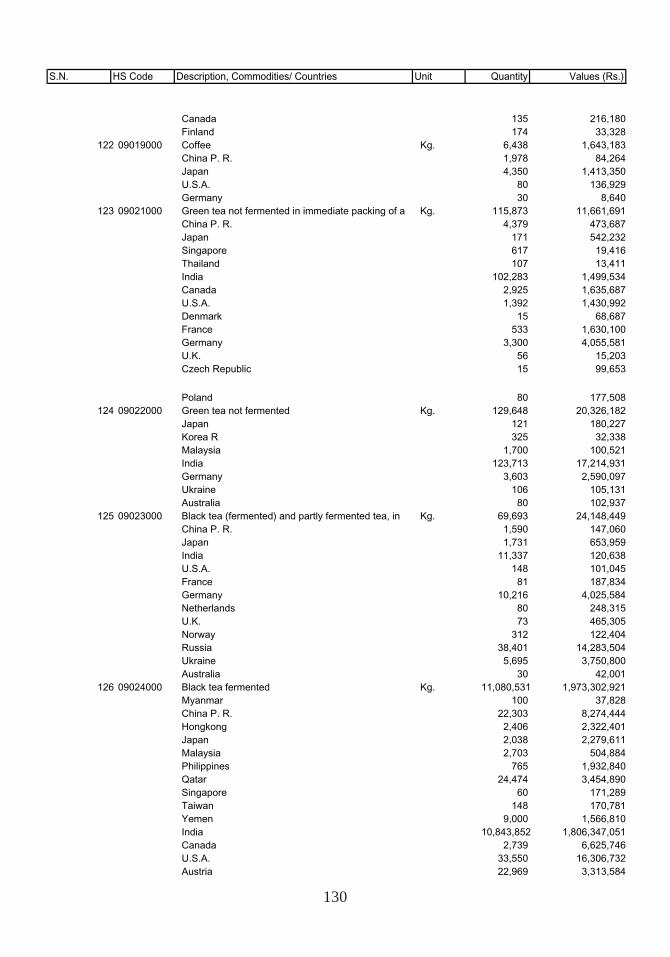
130
S.N. HS Code Description, Commodities/ Countries Unit Quantity Values (Rs.)
Canada 135 216,180 Finland 174 33,328
122 09019000 Coffee Kg. 6,438 1,643,183 China P. R. 1,978 84,264 Japan 4,350 1,413,350 U.S.A. 80 136,929 Germany 30 8,640
123 09021000 Green tea not fermented in immediate packing of a Kg. 115,873 11,661,691 China P. R. 4,379 473,687 Japan 171 542,232 Singapore 617 19,416 Thailand 107 13,411 India 102,283 1,499,534 Canada 2,925 1,635,687 U.S.A. 1,392 1,430,992 Denmark 15 68,687 France 533 1,630,100 Germany 3,300 4,055,581 U.K. 56 15,203 Czech Republic 15 99,653
Poland 80 177,508 124 09022000 Green tea not fermented Kg. 129,648 20,326,182
Japan 121 180,227 Korea R 325 32,338 Malaysia 1,700 100,521 India 123,713 17,214,931 Germany 3,603 2,590,097 Ukraine 106 105,131 Australia 80 102,937
125 09023000 Black tea (fermented) and partly fermented tea, in Kg. 69,693 24,148,449 China P. R. 1,590 147,060 Japan 1,731 653,959 India 11,337 120,638 U.S.A. 148 101,045 France 81 187,834 Germany 10,216 4,025,584 Netherlands 80 248,315 U.K. 73 465,305 Norway 312 122,404 Russia 38,401 14,283,504 Ukraine 5,695 3,750,800 Australia 30 42,001
126 09024000 Black tea fermented Kg. 11,080,531 1,973,302,921 Myanmar 100 37,828 China P. R. 22,303 8,274,444 Hongkong 2,406 2,322,401 Japan 2,038 2,279,611 Malaysia 2,703 504,884 Philippines 765 1,932,840 Qatar 24,474 3,454,890 Singapore 60 171,289 Taiwan 148 170,781 Yemen 9,000 1,566,810 India 10,843,852 1,806,347,051 Canada 2,739 6,625,746 U.S.A. 33,550 16,306,732 Austria 22,969 3,313,584
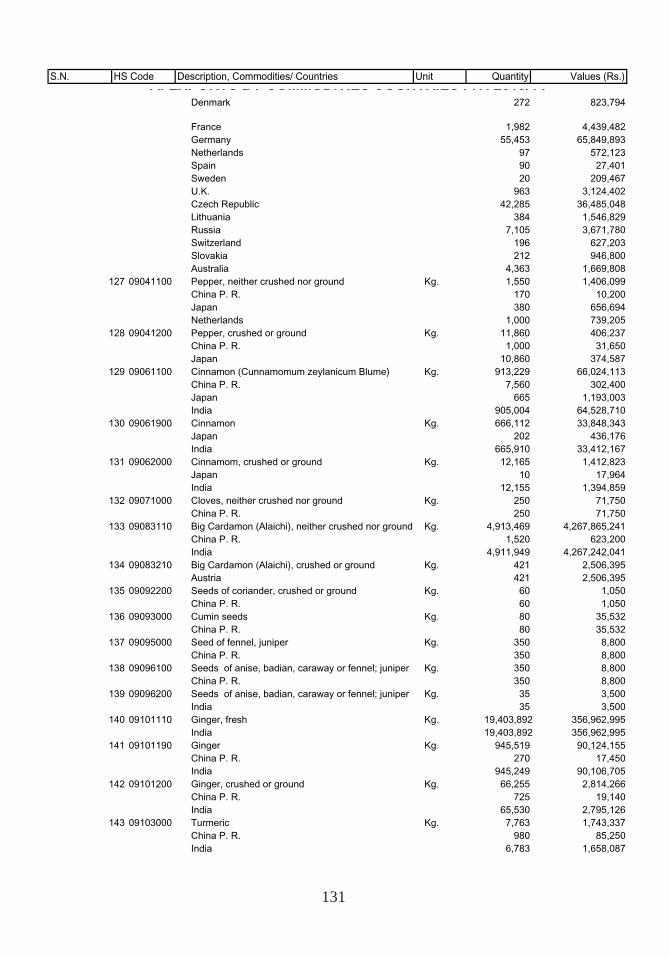
131
S.N. HS Code Description, Commodities/ Countries Unit Quantity Values (Rs.) A. EXPORTS BY COMMODITIES COUNTRIES F.Y. 2013/14
Denmark 272 823,794
France 1,982 4,439,482 Germany 55,453 65,849,893 Netherlands 97 572,123 Spain 90 27,401 Sweden 20 209,467 U.K. 963 3,124,402 Czech Republic 42,285 36,485,048 Lithuania 384 1,546,829 Russia 7,105 3,671,780 Switzerland 196 627,203 Slovakia 212 946,800 Australia 4,363 1,669,808
127 09041100 Pepper, neither crushed nor ground Kg. 1,550 1,406,099 China P. R. 170 10,200 Japan 380 656,694 Netherlands 1,000 739,205
128 09041200 Pepper, crushed or ground Kg. 11,860 406,237 China P. R. 1,000 31,650 Japan 10,860 374,587
129 09061100 Cinnamon (Cunnamomum zeylanicum Blume) Kg. 913,229 66,024,113 China P. R. 7,560 302,400 Japan 665 1,193,003 India 905,004 64,528,710
130 09061900 Cinnamon Kg. 666,112 33,848,343 Japan 202 436,176 India 665,910 33,412,167
131 09062000 Cinnamom, crushed or ground Kg. 12,165 1,412,823 Japan 10 17,964 India 12,155 1,394,859
132 09071000 Cloves, neither crushed nor ground Kg. 250 71,750 China P. R. 250 71,750
133 09083110 Big Cardamon (Alaichi), neither crushed nor ground Kg. 4,913,469 4,267,865,241 China P. R. 1,520 623,200 India 4,911,949 4,267,242,041
134 09083210 Big Cardamon (Alaichi), crushed or ground Kg. 421 2,506,395 Austria 421 2,506,395
135 09092200 Seeds of coriander, crushed or ground Kg. 60 1,050 China P. R. 60 1,050
136 09093000 Cumin seeds Kg. 80 35,532 China P. R. 80 35,532
137 09095000 Seed of fennel, juniper Kg. 350 8,800 China P. R. 350 8,800
138 09096100 Seeds of anise, badian, caraway or fennel; juniper Kg. 350 8,800 China P. R. 350 8,800
139 09096200 Seeds of anise, badian, caraway or fennel; juniper Kg. 35 3,500 India 35 3,500
140 09101110 Ginger, fresh Kg. 19,403,892 356,962,995 India 19,403,892 356,962,995
141 09101190 Ginger Kg. 945,519 90,124,155 China P. R. 270 17,450 India 945,249 90,106,705
142 09101200 Ginger, crushed or ground Kg. 66,255 2,814,266 China P. R. 725 19,140 India 65,530 2,795,126
143 09103000 Turmeric Kg. 7,763 1,743,337 China P. R. 980 85,250 India 6,783 1,658,087
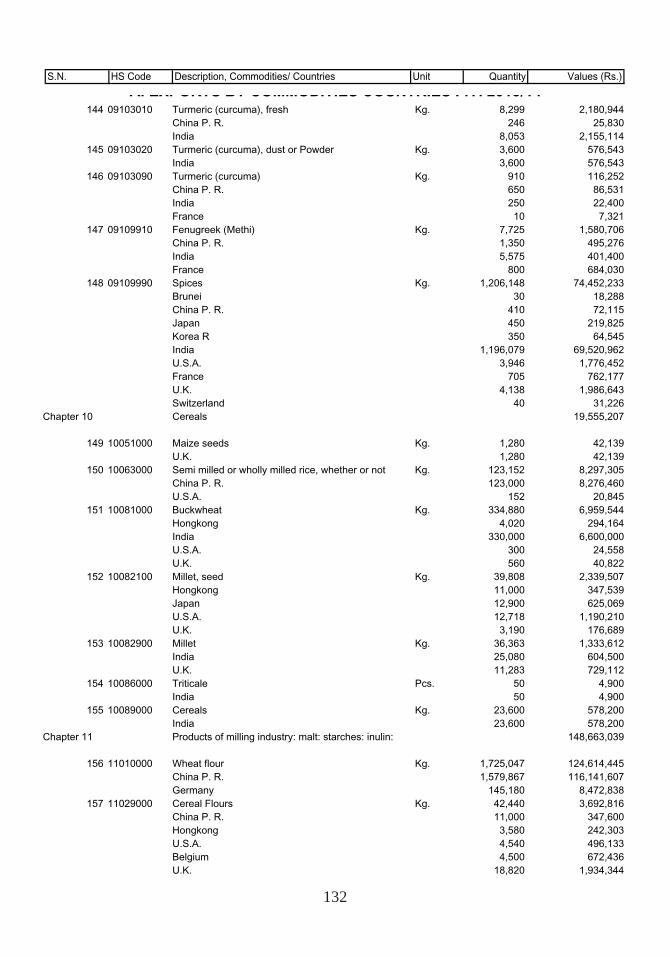
132
S.N. HS Code Description, Commodities/ Countries Unit Quantity Values (Rs.)
A. EXPORTS BY COMMODITIES COUNTRIES F.Y. 2013/14144 09103010 Turmeric (curcuma), fresh Kg. 8,299 2,180,944
China P. R. 246 25,830 India 8,053 2,155,114
145 09103020 Turmeric (curcuma), dust or Powder Kg. 3,600 576,543 India 3,600 576,543
146 09103090 Turmeric (curcuma) Kg. 910 116,252 China P. R. 650 86,531 India 250 22,400 France 10 7,321
147 09109910 Fenugreek (Methi) Kg. 7,725 1,580,706 China P. R. 1,350 495,276 India 5,575 401,400 France 800 684,030
148 09109990 Spices Kg. 1,206,148 74,452,233 Brunei 30 18,288 China P. R. 410 72,115 Japan 450 219,825 Korea R 350 64,545 India 1,196,079 69,520,962 U.S.A. 3,946 1,776,452 France 705 762,177 U.K. 4,138 1,986,643 Switzerland 40 31,226
Chapter 10 Cereals 19,555,207
149 10051000 Maize seeds Kg. 1,280 42,139 U.K. 1,280 42,139
150 10063000 Semi milled or wholly milled rice, whether or not Kg. 123,152 8,297,305 China P. R. 123,000 8,276,460 U.S.A. 152 20,845
151 10081000 Buckwheat Kg. 334,880 6,959,544 Hongkong 4,020 294,164 India 330,000 6,600,000 U.S.A. 300 24,558 U.K. 560 40,822
152 10082100 Millet, seed Kg. 39,808 2,339,507 Hongkong 11,000 347,539 Japan 12,900 625,069 U.S.A. 12,718 1,190,210 U.K. 3,190 176,689
153 10082900 Millet Kg. 36,363 1,333,612 India 25,080 604,500 U.K. 11,283 729,112
154 10086000 Triticale Pcs. 50 4,900 India 50 4,900
155 10089000 Cereals Kg. 23,600 578,200 India 23,600 578,200
Chapter 11 Products of milling industry: malt: starches: inulin: 148,663,039
156 11010000 Wheat flour Kg. 1,725,047 124,614,445 China P. R. 1,579,867 116,141,607 Germany 145,180 8,472,838
157 11029000 Cereal Flours Kg. 42,440 3,692,816 China P. R. 11,000 347,600 Hongkong 3,580 242,303 U.S.A. 4,540 496,133 Belgium 4,500 672,436 U.K. 18,820 1,934,344
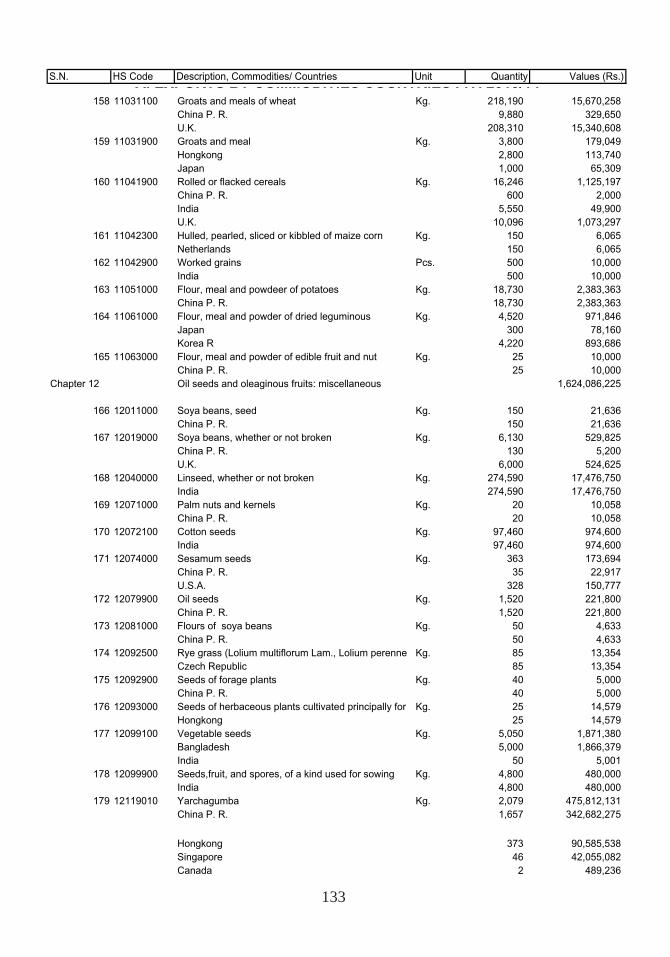
133
S.N. HS Code Description, Commodities/ Countries Unit Quantity Values (Rs.) A. EXPORTS BY COMMODITIES COUNTRIES F.Y. 2013/14158 11031100 Groats and meals of wheat Kg. 218,190 15,670,258
China P. R. 9,880 329,650 U.K. 208,310 15,340,608
159 11031900 Groats and meal Kg. 3,800 179,049 Hongkong 2,800 113,740 Japan 1,000 65,309
160 11041900 Rolled or flacked cereals Kg. 16,246 1,125,197 China P. R. 600 2,000 India 5,550 49,900 U.K. 10,096 1,073,297
161 11042300 Hulled, pearled, sliced or kibbled of maize corn Kg. 150 6,065 Netherlands 150 6,065
162 11042900 Worked grains Pcs. 500 10,000 India 500 10,000
163 11051000 Flour, meal and powdeer of potatoes Kg. 18,730 2,383,363 China P. R. 18,730 2,383,363
164 11061000 Flour, meal and powder of dried leguminous Kg. 4,520 971,846 Japan 300 78,160 Korea R 4,220 893,686
165 11063000 Flour, meal and powder of edible fruit and nut Kg. 25 10,000 China P. R. 25 10,000
Chapter 12 Oil seeds and oleaginous fruits: miscellaneous 1,624,086,225
166 12011000 Soya beans, seed Kg. 150 21,636 China P. R. 150 21,636
167 12019000 Soya beans, whether or not broken Kg. 6,130 529,825 China P. R. 130 5,200 U.K. 6,000 524,625
168 12040000 Linseed, whether or not broken Kg. 274,590 17,476,750 India 274,590 17,476,750
169 12071000 Palm nuts and kernels Kg. 20 10,058 China P. R. 20 10,058
170 12072100 Cotton seeds Kg. 97,460 974,600 India 97,460 974,600
171 12074000 Sesamum seeds Kg. 363 173,694 China P. R. 35 22,917 U.S.A. 328 150,777
172 12079900 Oil seeds Kg. 1,520 221,800 China P. R. 1,520 221,800
173 12081000 Flours of soya beans Kg. 50 4,633 China P. R. 50 4,633
174 12092500 Rye grass (Lolium multiflorum Lam., Lolium perenne Kg. 85 13,354 Czech Republic 85 13,354
175 12092900 Seeds of forage plants Kg. 40 5,000 China P. R. 40 5,000
176 12093000 Seeds of herbaceous plants cultivated principally for Kg. 25 14,579 Hongkong 25 14,579
177 12099100 Vegetable seeds Kg. 5,050 1,871,380 Bangladesh 5,000 1,866,379 India 50 5,001
178 12099900 Seeds,fruit, and spores, of a kind used for sowing Kg. 4,800 480,000 India 4,800 480,000
179 12119010 Yarchagumba Kg. 2,079 475,812,131 China P. R. 1,657 342,682,275
Hongkong 373 90,585,538 Singapore 46 42,055,082 Canada 2 489,236
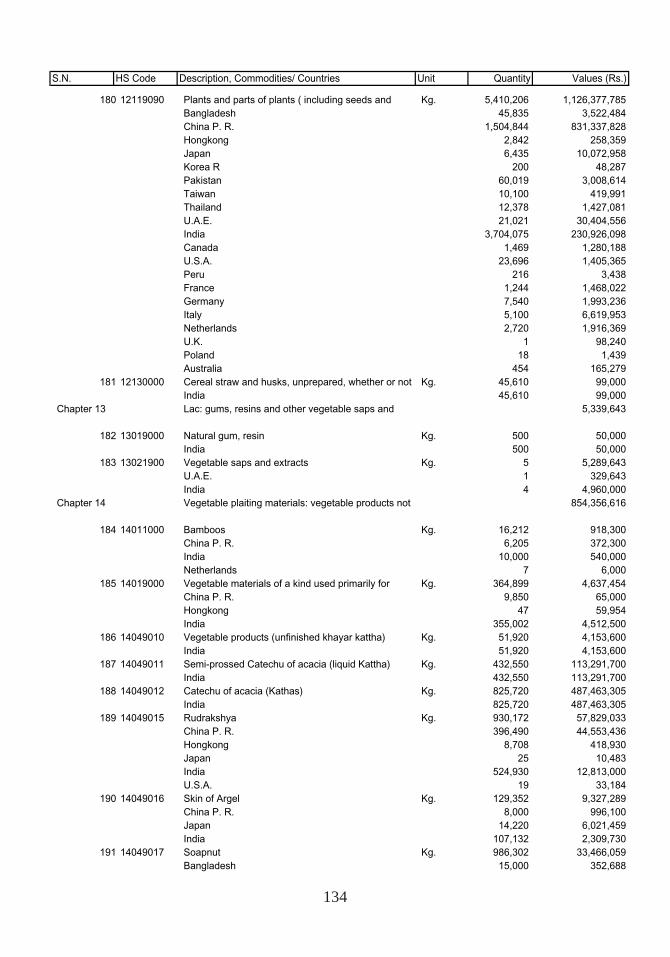
134
S.N. HS Code Description, Commodities/ Countries Unit Quantity Values (Rs.)
180 12119090 Plants and parts of plants ( including seeds and Kg. 5,410,206 1,126,377,785 Bangladesh 45,835 3,522,484 China P. R. 1,504,844 831,337,828 Hongkong 2,842 258,359 Japan 6,435 10,072,958 Korea R 200 48,287 Pakistan 60,019 3,008,614 Taiwan 10,100 419,991 Thailand 12,378 1,427,081 U.A.E. 21,021 30,404,556 India 3,704,075 230,926,098 Canada 1,469 1,280,188 U.S.A. 23,696 1,405,365 Peru 216 3,438 France 1,244 1,468,022 Germany 7,540 1,993,236 Italy 5,100 6,619,953 Netherlands 2,720 1,916,369 U.K. 1 98,240 Poland 18 1,439 Australia 454 165,279
181 12130000 Cereal straw and husks, unprepared, whether or not Kg. 45,610 99,000 India 45,610 99,000
Chapter 13 Lac: gums, resins and other vegetable saps and 5,339,643
182 13019000 Natural gum, resin Kg. 500 50,000 India 500 50,000
183 13021900 Vegetable saps and extracts Kg. 5 5,289,643 U.A.E. 1 329,643 India 4 4,960,000
Chapter 14 Vegetable plaiting materials: vegetable products not 854,356,616
184 14011000 Bamboos Kg. 16,212 918,300 China P. R. 6,205 372,300 India 10,000 540,000 Netherlands 7 6,000
185 14019000 Vegetable materials of a kind used primarily for Kg. 364,899 4,637,454 China P. R. 9,850 65,000 Hongkong 47 59,954 India 355,002 4,512,500
186 14049010 Vegetable products (unfinished khayar kattha) Kg. 51,920 4,153,600 India 51,920 4,153,600
187 14049011 Semi-prossed Catechu of acacia (liquid Kattha) Kg. 432,550 113,291,700 India 432,550 113,291,700
188 14049012 Catechu of acacia (Kathas) Kg. 825,720 487,463,305 India 825,720 487,463,305
189 14049015 Rudrakshya Kg. 930,172 57,829,033 China P. R. 396,490 44,553,436 Hongkong 8,708 418,930 Japan 25 10,483 India 524,930 12,813,000 U.S.A. 19 33,184
190 14049016 Skin of Argel Kg. 129,352 9,327,289 China P. R. 8,000 996,100 Japan 14,220 6,021,459 India 107,132 2,309,730
191 14049017 Soapnut Kg. 986,302 33,466,059 Bangladesh 15,000 352,688
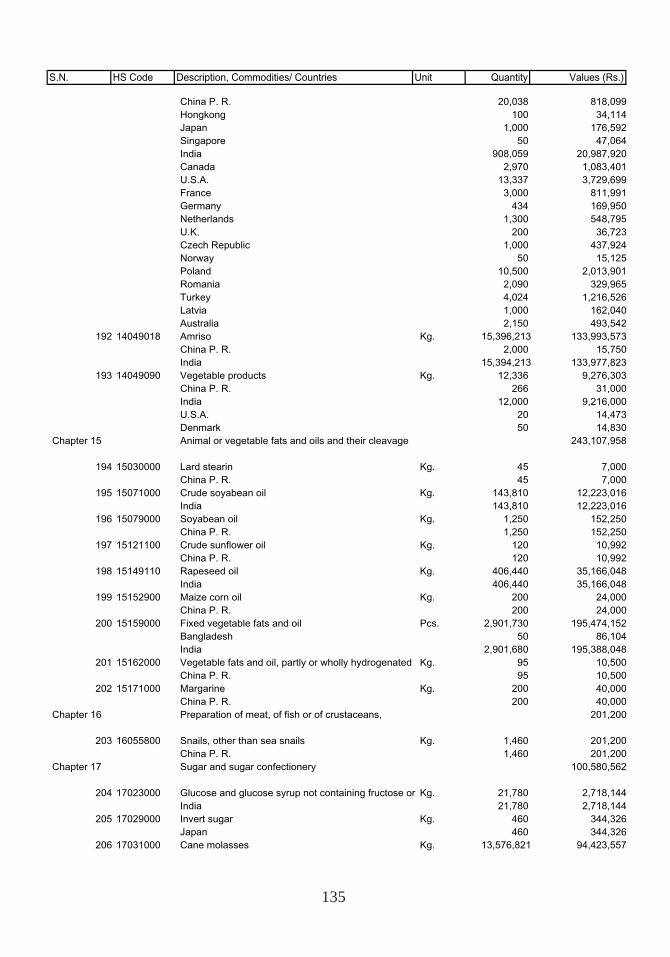
135
S.N. HS Code Description, Commodities/ Countries Unit Quantity Values (Rs.)
China P. R. 20,038 818,099 Hongkong 100 34,114 Japan 1,000 176,592 Singapore 50 47,064 India 908,059 20,987,920 Canada 2,970 1,083,401 U.S.A. 13,337 3,729,699 France 3,000 811,991 Germany 434 169,950 Netherlands 1,300 548,795 U.K. 200 36,723 Czech Republic 1,000 437,924 Norway 50 15,125 Poland 10,500 2,013,901 Romania 2,090 329,965 Turkey 4,024 1,216,526 Latvia 1,000 162,040 Australia 2,150 493,542
192 14049018 Amriso Kg. 15,396,213 133,993,573 China P. R. 2,000 15,750 India 15,394,213 133,977,823
193 14049090 Vegetable products Kg. 12,336 9,276,303 China P. R. 266 31,000 India 12,000 9,216,000 U.S.A. 20 14,473 Denmark 50 14,830
Chapter 15 Animal or vegetable fats and oils and their cleavage 243,107,958
194 15030000 Lard stearin Kg. 45 7,000 China P. R. 45 7,000
195 15071000 Crude soyabean oil Kg. 143,810 12,223,016 India 143,810 12,223,016
196 15079000 Soyabean oil Kg. 1,250 152,250 China P. R. 1,250 152,250
197 15121100 Crude sunflower oil Kg. 120 10,992 China P. R. 120 10,992
198 15149110 Rapeseed oil Kg. 406,440 35,166,048 India 406,440 35,166,048
199 15152900 Maize corn oil Kg. 200 24,000 China P. R. 200 24,000
200 15159000 Fixed vegetable fats and oil Pcs. 2,901,730 195,474,152 Bangladesh 50 86,104 India 2,901,680 195,388,048
201 15162000 Vegetable fats and oil, partly or wholly hydrogenated Kg. 95 10,500 China P. R. 95 10,500
202 15171000 Margarine Kg. 200 40,000 China P. R. 200 40,000
Chapter 16 Preparation of meat, of fish or of crustaceans, 201,200
203 16055800 Snails, other than sea snails Kg. 1,460 201,200 China P. R. 1,460 201,200
Chapter 17 Sugar and sugar confectionery 100,580,562
204 17023000 Glucose and glucose syrup not containing fructose or Kg. 21,780 2,718,144 India 21,780 2,718,144
205 17029000 Invert sugar Kg. 460 344,326 Japan 460 344,326
206 17031000 Cane molasses Kg. 13,576,821 94,423,557
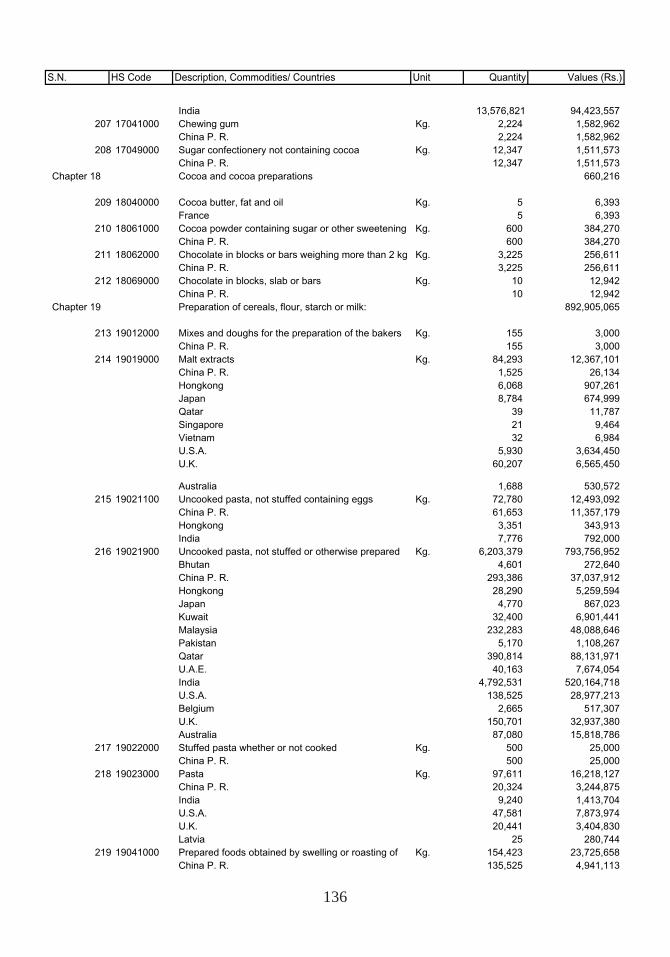
136
S.N. HS Code Description, Commodities/ Countries Unit Quantity Values (Rs.)
India 13,576,821 94,423,557 207 17041000 Chewing gum Kg. 2,224 1,582,962
China P. R. 2,224 1,582,962 208 17049000 Sugar confectionery not containing cocoa Kg. 12,347 1,511,573
China P. R. 12,347 1,511,573 Chapter 18 Cocoa and cocoa preparations 660,216
209 18040000 Cocoa butter, fat and oil Kg. 5 6,393 France 5 6,393
210 18061000 Cocoa powder containing sugar or other sweetening Kg. 600 384,270 China P. R. 600 384,270
211 18062000 Chocolate in blocks or bars weighing more than 2 kg Kg. 3,225 256,611 China P. R. 3,225 256,611
212 18069000 Chocolate in blocks, slab or bars Kg. 10 12,942 China P. R. 10 12,942
Chapter 19 Preparation of cereals, flour, starch or milk: 892,905,065
213 19012000 Mixes and doughs for the preparation of the bakers Kg. 155 3,000 China P. R. 155 3,000
214 19019000 Malt extracts Kg. 84,293 12,367,101 China P. R. 1,525 26,134 Hongkong 6,068 907,261 Japan 8,784 674,999 Qatar 39 11,787 Singapore 21 9,464 Vietnam 32 6,984 U.S.A. 5,930 3,634,450 U.K. 60,207 6,565,450
Australia 1,688 530,572 215 19021100 Uncooked pasta, not stuffed containing eggs Kg. 72,780 12,493,092
China P. R. 61,653 11,357,179 Hongkong 3,351 343,913 India 7,776 792,000
216 19021900 Uncooked pasta, not stuffed or otherwise prepared Kg. 6,203,379 793,756,952 Bhutan 4,601 272,640 China P. R. 293,386 37,037,912 Hongkong 28,290 5,259,594 Japan 4,770 867,023 Kuwait 32,400 6,901,441 Malaysia 232,283 48,088,646 Pakistan 5,170 1,108,267 Qatar 390,814 88,131,971 U.A.E. 40,163 7,674,054 India 4,792,531 520,164,718 U.S.A. 138,525 28,977,213 Belgium 2,665 517,307 U.K. 150,701 32,937,380 Australia 87,080 15,818,786
217 19022000 Stuffed pasta whether or not cooked Kg. 500 25,000 China P. R. 500 25,000
218 19023000 Pasta Kg. 97,611 16,218,127 China P. R. 20,324 3,244,875 India 9,240 1,413,704 U.S.A. 47,581 7,873,974 U.K. 20,441 3,404,830 Latvia 25 280,744
219 19041000 Prepared foods obtained by swelling or roasting of Kg. 154,423 23,725,658 China P. R. 135,525 4,941,113
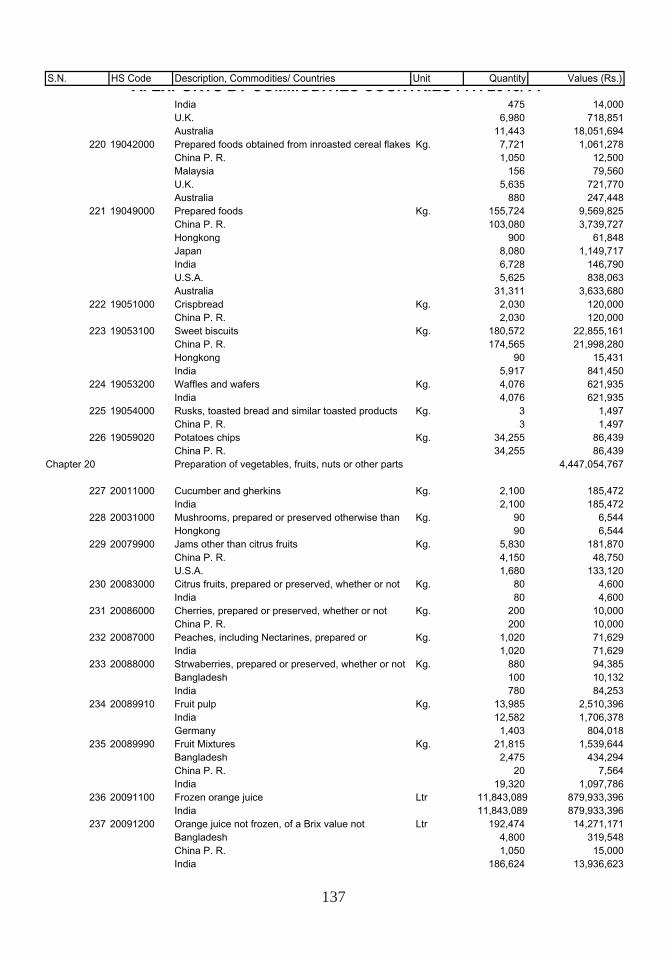
137
S.N. HS Code Description, Commodities/ Countries Unit Quantity Values (Rs.) A. EXPORTS BY COMMODITIES COUNTRIES F.Y. 2013/14
India 475 14,000 U.K. 6,980 718,851 Australia 11,443 18,051,694
220 19042000 Prepared foods obtained from inroasted cereal flakes Kg. 7,721 1,061,278 China P. R. 1,050 12,500 Malaysia 156 79,560 U.K. 5,635 721,770 Australia 880 247,448
221 19049000 Prepared foods Kg. 155,724 9,569,825 China P. R. 103,080 3,739,727 Hongkong 900 61,848 Japan 8,080 1,149,717 India 6,728 146,790 U.S.A. 5,625 838,063 Australia 31,311 3,633,680
222 19051000 Crispbread Kg. 2,030 120,000 China P. R. 2,030 120,000
223 19053100 Sweet biscuits Kg. 180,572 22,855,161 China P. R. 174,565 21,998,280 Hongkong 90 15,431 India 5,917 841,450
224 19053200 Waffles and wafers Kg. 4,076 621,935 India 4,076 621,935
225 19054000 Rusks, toasted bread and similar toasted products Kg. 3 1,497 China P. R. 3 1,497
226 19059020 Potatoes chips Kg. 34,255 86,439 China P. R. 34,255 86,439
Chapter 20 Preparation of vegetables, fruits, nuts or other parts 4,447,054,767
227 20011000 Cucumber and gherkins Kg. 2,100 185,472 India 2,100 185,472
228 20031000 Mushrooms, prepared or preserved otherwise than Kg. 90 6,544 Hongkong 90 6,544
229 20079900 Jams other than citrus fruits Kg. 5,830 181,870 China P. R. 4,150 48,750 U.S.A. 1,680 133,120
230 20083000 Citrus fruits, prepared or preserved, whether or not Kg. 80 4,600 India 80 4,600
231 20086000 Cherries, prepared or preserved, whether or not Kg. 200 10,000 China P. R. 200 10,000
232 20087000 Peaches, including Nectarines, prepared or Kg. 1,020 71,629 India 1,020 71,629
233 20088000 Strwaberries, prepared or preserved, whether or not Kg. 880 94,385 Bangladesh 100 10,132 India 780 84,253
234 20089910 Fruit pulp Kg. 13,985 2,510,396 India 12,582 1,706,378 Germany 1,403 804,018
235 20089990 Fruit Mixtures Kg. 21,815 1,539,644 Bangladesh 2,475 434,294 China P. R. 20 7,564 India 19,320 1,097,786
236 20091100 Frozen orange juice Ltr 11,843,089 879,933,396 India 11,843,089 879,933,396
237 20091200 Orange juice not frozen, of a Brix value not Ltr 192,474 14,271,171 Bangladesh 4,800 319,548 China P. R. 1,050 15,000 India 186,624 13,936,623
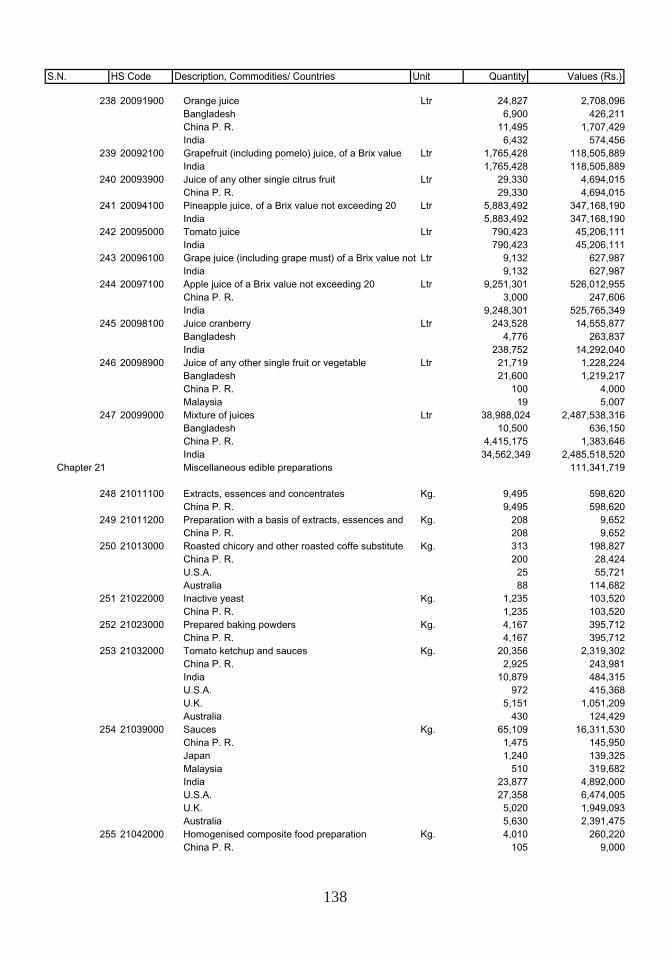
138
S.N. HS Code Description, Commodities/ Countries Unit Quantity Values (Rs.)
238 20091900 Orange juice Ltr 24,827 2,708,096 Bangladesh 6,900 426,211 China P. R. 11,495 1,707,429 India 6,432 574,456
239 20092100 Grapefruit (including pomelo) juice, of a Brix value Ltr 1,765,428 118,505,889 India 1,765,428 118,505,889
240 20093900 Juice of any other single citrus fruit Ltr 29,330 4,694,015 China P. R. 29,330 4,694,015
241 20094100 Pineapple juice, of a Brix value not exceeding 20 Ltr 5,883,492 347,168,190 India 5,883,492 347,168,190
242 20095000 Tomato juice Ltr 790,423 45,206,111 India 790,423 45,206,111
243 20096100 Grape juice (including grape must) of a Brix value not Ltr 9,132 627,987 India 9,132 627,987
244 20097100 Apple juice of a Brix value not exceeding 20 Ltr 9,251,301 526,012,955 China P. R. 3,000 247,606 India 9,248,301 525,765,349
245 20098100 Juice cranberry Ltr 243,528 14,555,877 Bangladesh 4,776 263,837 India 238,752 14,292,040
246 20098900 Juice of any other single fruit or vegetable Ltr 21,719 1,228,224 Bangladesh 21,600 1,219,217 China P. R. 100 4,000 Malaysia 19 5,007
247 20099000 Mixture of juices Ltr 38,988,024 2,487,538,316 Bangladesh 10,500 636,150 China P. R. 4,415,175 1,383,646 India 34,562,349 2,485,518,520
Chapter 21 Miscellaneous edible preparations 111,341,719
248 21011100 Extracts, essences and concentrates Kg. 9,495 598,620 China P. R. 9,495 598,620
249 21011200 Preparation with a basis of extracts, essences and Kg. 208 9,652 China P. R. 208 9,652
250 21013000 Roasted chicory and other roasted coffe substitute Kg. 313 198,827 China P. R. 200 28,424 U.S.A. 25 55,721 Australia 88 114,682
251 21022000 Inactive yeast Kg. 1,235 103,520 China P. R. 1,235 103,520
252 21023000 Prepared baking powders Kg. 4,167 395,712 China P. R. 4,167 395,712
253 21032000 Tomato ketchup and sauces Kg. 20,356 2,319,302 China P. R. 2,925 243,981 India 10,879 484,315 U.S.A. 972 415,368 U.K. 5,151 1,051,209 Australia 430 124,429
254 21039000 Sauces Kg. 65,109 16,311,530 China P. R. 1,475 145,950 Japan 1,240 139,325 Malaysia 510 319,682 India 23,877 4,892,000 U.S.A. 27,358 6,474,005 U.K. 5,020 1,949,093 Australia 5,630 2,391,475
255 21042000 Homogenised composite food preparation Kg. 4,010 260,220 China P. R. 105 9,000
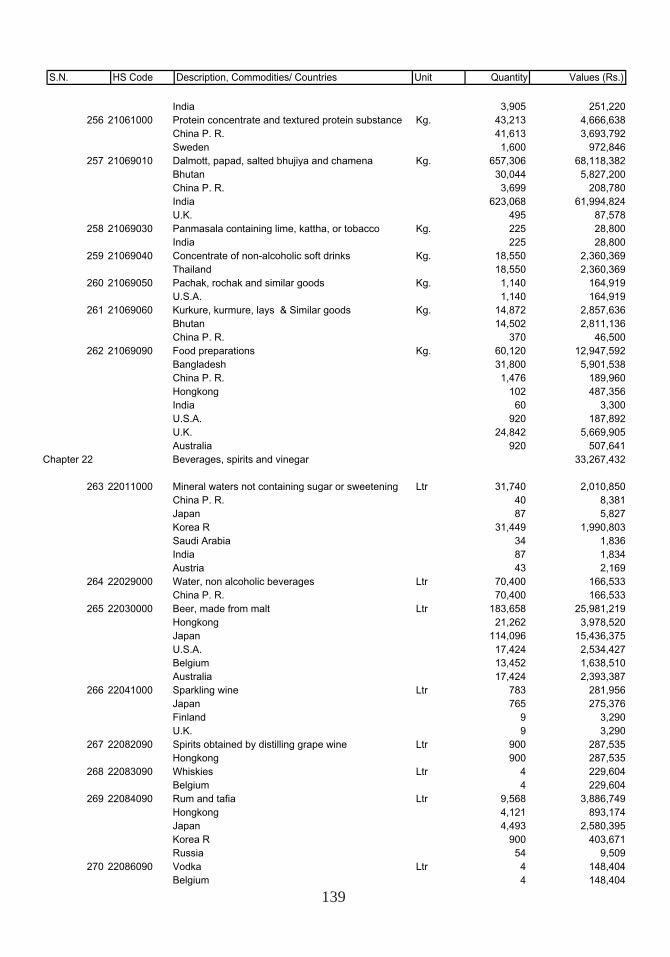
139
S.N. HS Code Description, Commodities/ Countries Unit Quantity Values (Rs.)
India 3,905 251,220 256 21061000 Protein concentrate and textured protein substance Kg. 43,213 4,666,638
China P. R. 41,613 3,693,792 Sweden 1,600 972,846
257 21069010 Dalmott, papad, salted bhujiya and chamena Kg. 657,306 68,118,382 Bhutan 30,044 5,827,200 China P. R. 3,699 208,780 India 623,068 61,994,824 U.K. 495 87,578
258 21069030 Panmasala containing lime, kattha, or tobacco Kg. 225 28,800 India 225 28,800
259 21069040 Concentrate of non-alcoholic soft drinks Kg. 18,550 2,360,369 Thailand 18,550 2,360,369
260 21069050 Pachak, rochak and similar goods Kg. 1,140 164,919 U.S.A. 1,140 164,919
261 21069060 Kurkure, kurmure, lays & Similar goods Kg. 14,872 2,857,636 Bhutan 14,502 2,811,136 China P. R. 370 46,500
262 21069090 Food preparations Kg. 60,120 12,947,592 Bangladesh 31,800 5,901,538 China P. R. 1,476 189,960 Hongkong 102 487,356 India 60 3,300 U.S.A. 920 187,892 U.K. 24,842 5,669,905 Australia 920 507,641
Chapter 22 Beverages, spirits and vinegar 33,267,432
263 22011000 Mineral waters not containing sugar or sweetening Ltr 31,740 2,010,850 China P. R. 40 8,381 Japan 87 5,827 Korea R 31,449 1,990,803 Saudi Arabia 34 1,836 India 87 1,834 Austria 43 2,169
264 22029000 Water, non alcoholic beverages Ltr 70,400 166,533 China P. R. 70,400 166,533
265 22030000 Beer, made from malt Ltr 183,658 25,981,219 Hongkong 21,262 3,978,520 Japan 114,096 15,436,375 U.S.A. 17,424 2,534,427 Belgium 13,452 1,638,510 Australia 17,424 2,393,387
266 22041000 Sparkling wine Ltr 783 281,956 Japan 765 275,376 Finland 9 3,290 U.K. 9 3,290
267 22082090 Spirits obtained by distilling grape wine Ltr 900 287,535 Hongkong 900 287,535
268 22083090 Whiskies Ltr 4 229,604 Belgium 4 229,604
269 22084090 Rum and tafia Ltr 9,568 3,886,749 Hongkong 4,121 893,174 Japan 4,493 2,580,395 Korea R 900 403,671 Russia 54 9,509
270 22086090 Vodka Ltr 4 148,404 Belgium 4 148,404
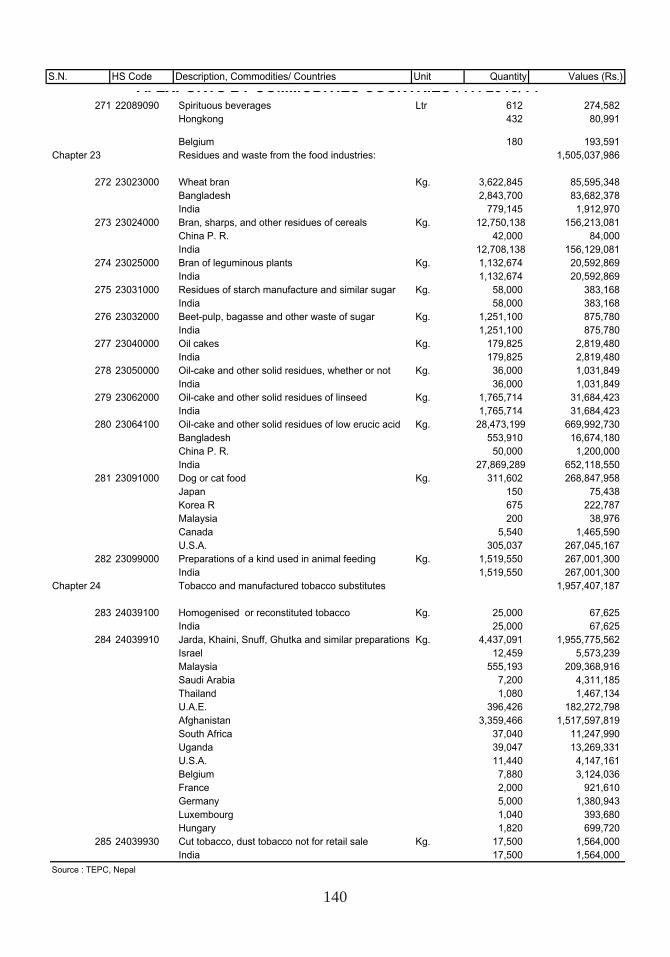
140
S.N. HS Code Description, Commodities/ Countries Unit Quantity Values (Rs.) A. EXPORTS BY COMMODITIES COUNTRIES F.Y. 2013/14
271 22089090 Spirituous beverages Ltr 612 274,582 Hongkong 432 80,991
Belgium 180 193,591 Chapter 23 Residues and waste from the food industries: 1,505,037,986
272 23023000 Wheat bran Kg. 3,622,845 85,595,348 Bangladesh 2,843,700 83,682,378 India 779,145 1,912,970
273 23024000 Bran, sharps, and other residues of cereals Kg. 12,750,138 156,213,081 China P. R. 42,000 84,000 India 12,708,138 156,129,081
274 23025000 Bran of leguminous plants Kg. 1,132,674 20,592,869 India 1,132,674 20,592,869
275 23031000 Residues of starch manufacture and similar sugar Kg. 58,000 383,168 India 58,000 383,168
276 23032000 Beet-pulp, bagasse and other waste of sugar Kg. 1,251,100 875,780 India 1,251,100 875,780
277 23040000 Oil cakes Kg. 179,825 2,819,480 India 179,825 2,819,480
278 23050000 Oil-cake and other solid residues, whether or not Kg. 36,000 1,031,849 India 36,000 1,031,849
279 23062000 Oil-cake and other solid residues of linseed Kg. 1,765,714 31,684,423 India 1,765,714 31,684,423
280 23064100 Oil-cake and other solid residues of low erucic acid Kg. 28,473,199 669,992,730 Bangladesh 553,910 16,674,180 China P. R. 50,000 1,200,000 India 27,869,289 652,118,550
281 23091000 Dog or cat food Kg. 311,602 268,847,958 Japan 150 75,438 Korea R 675 222,787 Malaysia 200 38,976 Canada 5,540 1,465,590 U.S.A. 305,037 267,045,167
282 23099000 Preparations of a kind used in animal feeding Kg. 1,519,550 267,001,300 India 1,519,550 267,001,300
Chapter 24 Tobacco and manufactured tobacco substitutes 1,957,407,187
283 24039100 Homogenised or reconstituted tobacco Kg. 25,000 67,625 India 25,000 67,625
284 24039910 Jarda, Khaini, Snuff, Ghutka and similar preparations Kg. 4,437,091 1,955,775,562 Israel 12,459 5,573,239 Malaysia 555,193 209,368,916 Saudi Arabia 7,200 4,311,185 Thailand 1,080 1,467,134 U.A.E. 396,426 182,272,798 Afghanistan 3,359,466 1,517,597,819 South Africa 37,040 11,247,990 Uganda 39,047 13,269,331 U.S.A. 11,440 4,147,161 Belgium 7,880 3,124,036 France 2,000 921,610 Germany 5,000 1,380,943 Luxembourg 1,040 393,680 Hungary 1,820 699,720
285 24039930 Cut tobacco, dust tobacco not for retail sale Kg. 17,500 1,564,000 India 17,500 1,564,000
Source : TEPC, Nepal
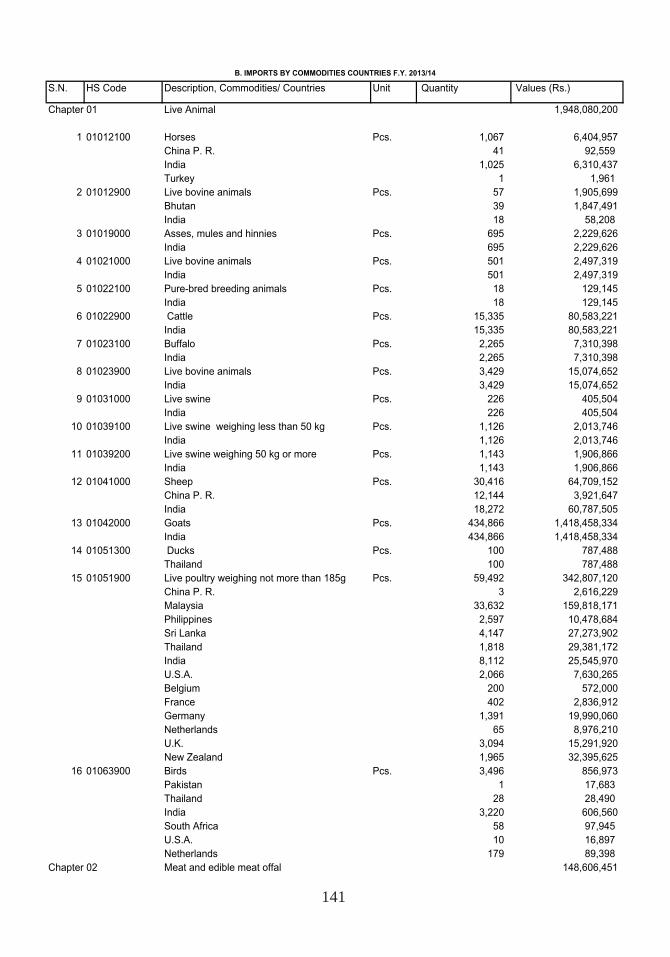
141
S.N. HS Code Description, Commodities/ Countries Unit Quantity Values (Rs.)
Chapter 01 Live Animal 1,948,080,200
1 01012100 Horses Pcs. 1,067 6,404,957 China P. R. 41 92,559 India 1,025 6,310,437 Turkey 1 1,961
2 01012900 Live bovine animals Pcs. 57 1,905,699 Bhutan 39 1,847,491 India 18 58,208
3 01019000 Asses, mules and hinnies Pcs. 695 2,229,626 India 695 2,229,626
4 01021000 Live bovine animals Pcs. 501 2,497,319 India 501 2,497,319
5 01022100 Pure-bred breeding animals Pcs. 18 129,145 India 18 129,145
6 01022900 Cattle Pcs. 15,335 80,583,221 India 15,335 80,583,221
7 01023100 Buffalo Pcs. 2,265 7,310,398 India 2,265 7,310,398
8 01023900 Live bovine animals Pcs. 3,429 15,074,652 India 3,429 15,074,652
9 01031000 Live swine Pcs. 226 405,504 India 226 405,504
10 01039100 Live swine weighing less than 50 kg Pcs. 1,126 2,013,746 India 1,126 2,013,746
11 01039200 Live swine weighing 50 kg or more Pcs. 1,143 1,906,866 India 1,143 1,906,866
12 01041000 Sheep Pcs. 30,416 64,709,152 China P. R. 12,144 3,921,647 India 18,272 60,787,505
13 01042000 Goats Pcs. 434,866 1,418,458,334 India 434,866 1,418,458,334
14 01051300 Ducks Pcs. 100 787,488 Thailand 100 787,488
15 01051900 Live poultry weighing not more than 185g Pcs. 59,492 342,807,120 China P. R. 3 2,616,229 Malaysia 33,632 159,818,171 Philippines 2,597 10,478,684 Sri Lanka 4,147 27,273,902 Thailand 1,818 29,381,172 India 8,112 25,545,970 U.S.A. 2,066 7,630,265 Belgium 200 572,000 France 402 2,836,912 Germany 1,391 19,990,060 Netherlands 65 8,976,210 U.K. 3,094 15,291,920 New Zealand 1,965 32,395,625
16 01063900 Birds Pcs. 3,496 856,973 Pakistan 1 17,683 Thailand 28 28,490 India 3,220 606,560 South Africa 58 97,945 U.S.A. 10 16,897 Netherlands 179 89,398
Chapter 02 Meat and edible meat offal 148,606,451
B. IMPORTS BY COMMODITIES COUNTRIES F.Y. 2013/14
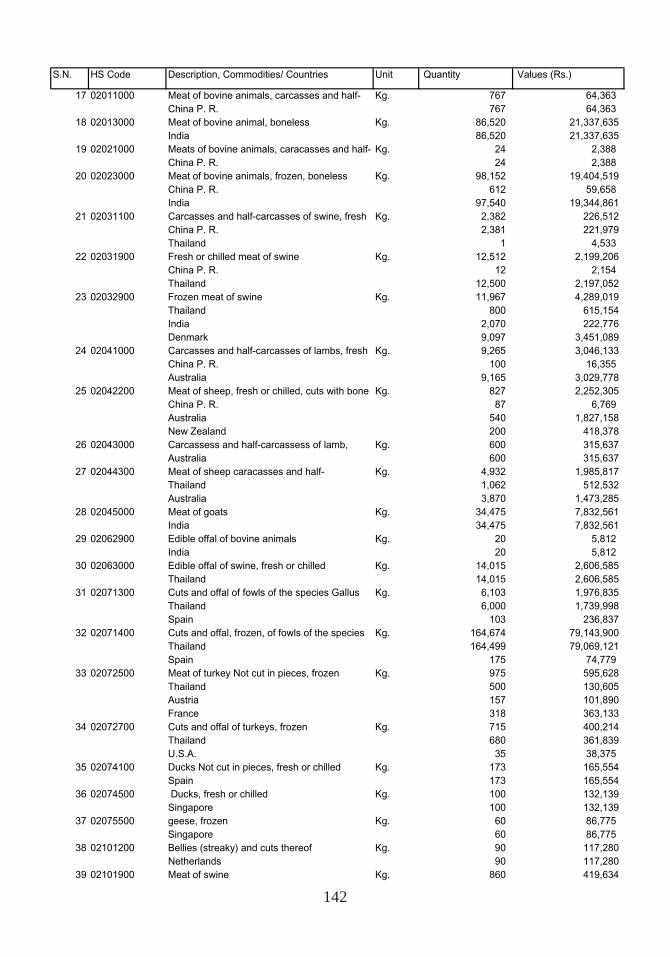
142
S.N. HS Code Description, Commodities/ Countries Unit Quantity Values (Rs.)
17 02011000 Meat of bovine animals, carcasses and half- Kg. 767 64,363 China P. R. 767 64,363
18 02013000 Meat of bovine animal, boneless Kg. 86,520 21,337,635 India 86,520 21,337,635
19 02021000 Meats of bovine animals, caracasses and half- Kg. 24 2,388 China P. R. 24 2,388
20 02023000 Meat of bovine animals, frozen, boneless Kg. 98,152 19,404,519 China P. R. 612 59,658 India 97,540 19,344,861
21 02031100 Carcasses and half-carcasses of swine, fresh Kg. 2,382 226,512 China P. R. 2,381 221,979 Thailand 1 4,533
22 02031900 Fresh or chilled meat of swine Kg. 12,512 2,199,206 China P. R. 12 2,154 Thailand 12,500 2,197,052
23 02032900 Frozen meat of swine Kg. 11,967 4,289,019 Thailand 800 615,154 India 2,070 222,776 Denmark 9,097 3,451,089
24 02041000 Carcasses and half-carcasses of lambs, fresh Kg. 9,265 3,046,133 China P. R. 100 16,355 Australia 9,165 3,029,778
25 02042200 Meat of sheep, fresh or chilled, cuts with bone Kg. 827 2,252,305 China P. R. 87 6,769 Australia 540 1,827,158 New Zealand 200 418,378
26 02043000 Carcassess and half-carcassess of lamb, Kg. 600 315,637 Australia 600 315,637
27 02044300 Meat of sheep caracasses and half- Kg. 4,932 1,985,817 Thailand 1,062 512,532 Australia 3,870 1,473,285
28 02045000 Meat of goats Kg. 34,475 7,832,561 India 34,475 7,832,561
29 02062900 Edible offal of bovine animals Kg. 20 5,812 India 20 5,812
30 02063000 Edible offal of swine, fresh or chilled Kg. 14,015 2,606,585 Thailand 14,015 2,606,585
31 02071300 Cuts and offal of fowls of the species Gallus Kg. 6,103 1,976,835 Thailand 6,000 1,739,998 Spain 103 236,837
32 02071400 Cuts and offal, frozen, of fowls of the species Kg. 164,674 79,143,900 Thailand 164,499 79,069,121 Spain 175 74,779
33 02072500 Meat of turkey Not cut in pieces, frozen Kg. 975 595,628 Thailand 500 130,605 Austria 157 101,890 France 318 363,133
34 02072700 Cuts and offal of turkeys, frozen Kg. 715 400,214 Thailand 680 361,839 U.S.A. 35 38,375
35 02074100 Ducks Not cut in pieces, fresh or chilled Kg. 173 165,554 Spain 173 165,554
36 02074500 Ducks, fresh or chilled Kg. 100 132,139 Singapore 100 132,139
37 02075500 geese, frozen Kg. 60 86,775 Singapore 60 86,775
38 02101200 Bellies (streaky) and cuts thereof Kg. 90 117,280 Netherlands 90 117,280
39 02101900 Meat of swine Kg. 860 419,634
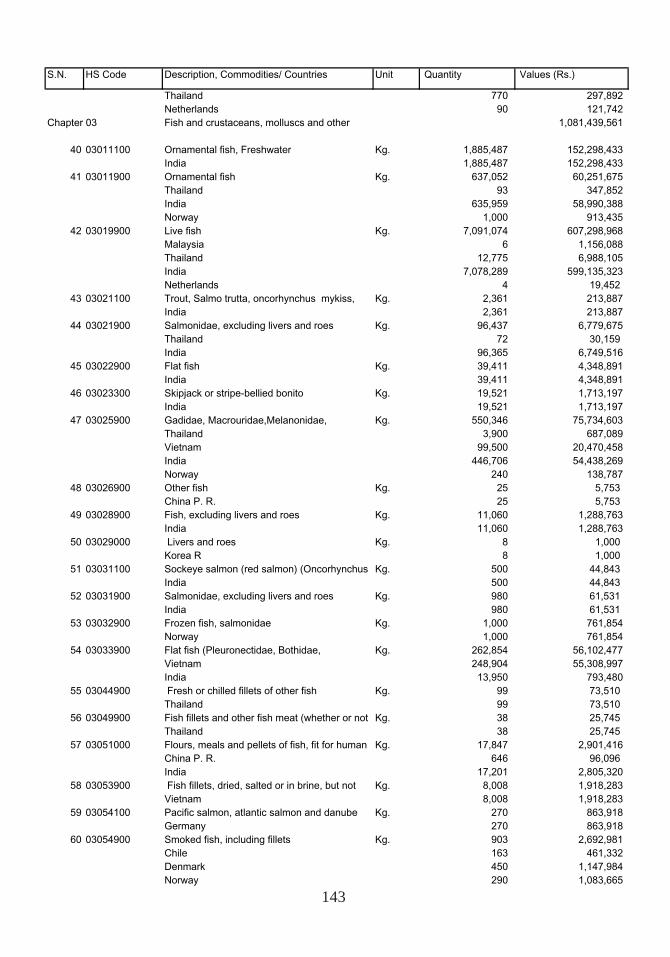
143
S.N. HS Code Description, Commodities/ Countries Unit Quantity Values (Rs.)
Thailand 770 297,892 Netherlands 90 121,742
Chapter 03 Fish and crustaceans, molluscs and other 1,081,439,561
40 03011100 Ornamental fish, Freshwater Kg. 1,885,487 152,298,433 India 1,885,487 152,298,433
41 03011900 Ornamental fish Kg. 637,052 60,251,675 Thailand 93 347,852 India 635,959 58,990,388 Norway 1,000 913,435
42 03019900 Live fish Kg. 7,091,074 607,298,968 Malaysia 6 1,156,088 Thailand 12,775 6,988,105 India 7,078,289 599,135,323 Netherlands 4 19,452
43 03021100 Trout, Salmo trutta, oncorhynchus mykiss, Kg. 2,361 213,887 India 2,361 213,887
44 03021900 Salmonidae, excluding livers and roes Kg. 96,437 6,779,675 Thailand 72 30,159 India 96,365 6,749,516
45 03022900 Flat fish Kg. 39,411 4,348,891 India 39,411 4,348,891
46 03023300 Skipjack or stripe-bellied bonito Kg. 19,521 1,713,197 India 19,521 1,713,197
47 03025900 Gadidae, Macrouridae,Melanonidae, Kg. 550,346 75,734,603 Thailand 3,900 687,089 Vietnam 99,500 20,470,458 India 446,706 54,438,269 Norway 240 138,787
48 03026900 Other fish Kg. 25 5,753 China P. R. 25 5,753
49 03028900 Fish, excluding livers and roes Kg. 11,060 1,288,763 India 11,060 1,288,763
50 03029000 Livers and roes Kg. 8 1,000 Korea R 8 1,000
51 03031100 Sockeye salmon (red salmon) (Oncorhynchus Kg. 500 44,843 India 500 44,843
52 03031900 Salmonidae, excluding livers and roes Kg. 980 61,531 India 980 61,531
53 03032900 Frozen fish, salmonidae Kg. 1,000 761,854 Norway 1,000 761,854
54 03033900 Flat fish (Pleuronectidae, Bothidae, Kg. 262,854 56,102,477 Vietnam 248,904 55,308,997 India 13,950 793,480
55 03044900 Fresh or chilled fillets of other fish Kg. 99 73,510 Thailand 99 73,510
56 03049900 Fish fillets and other fish meat (whether or not Kg. 38 25,745 Thailand 38 25,745
57 03051000 Flours, meals and pellets of fish, fit for human Kg. 17,847 2,901,416 China P. R. 646 96,096 India 17,201 2,805,320
58 03053900 Fish fillets, dried, salted or in brine, but not Kg. 8,008 1,918,283 Vietnam 8,008 1,918,283
59 03054100 Pacific salmon, atlantic salmon and danube Kg. 270 863,918 Germany 270 863,918
60 03054900 Smoked fish, including fillets Kg. 903 2,692,981 Chile 163 461,332 Denmark 450 1,147,984 Norway 290 1,083,665
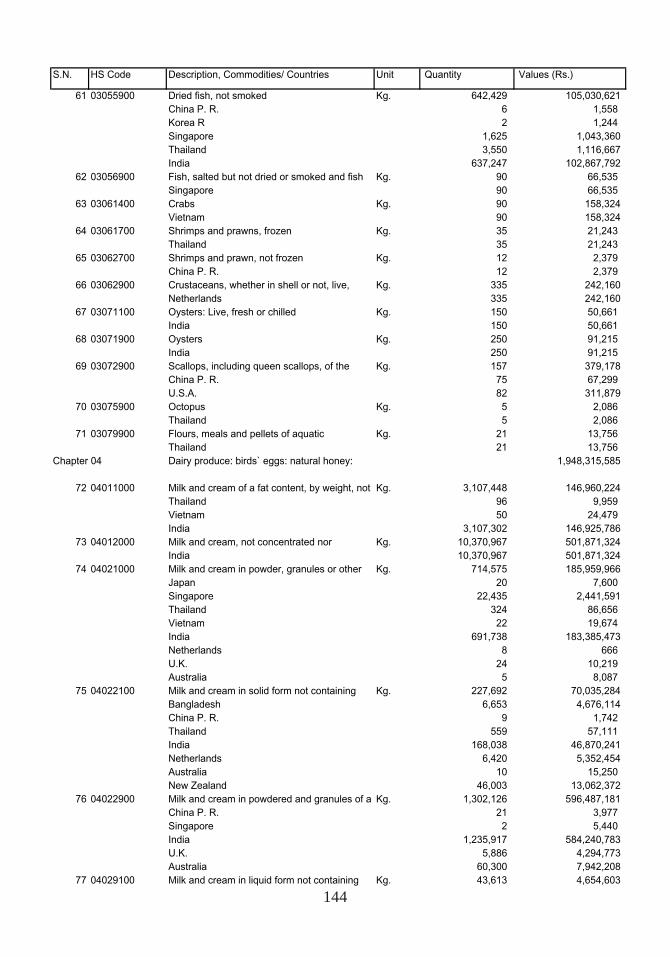
144
S.N. HS Code Description, Commodities/ Countries Unit Quantity Values (Rs.)
61 03055900 Dried fish, not smoked Kg. 642,429 105,030,621 China P. R. 6 1,558 Korea R 2 1,244 Singapore 1,625 1,043,360 Thailand 3,550 1,116,667 India 637,247 102,867,792
62 03056900 Fish, salted but not dried or smoked and fish Kg. 90 66,535 Singapore 90 66,535
63 03061400 Crabs Kg. 90 158,324 Vietnam 90 158,324
64 03061700 Shrimps and prawns, frozen Kg. 35 21,243 Thailand 35 21,243
65 03062700 Shrimps and prawn, not frozen Kg. 12 2,379 China P. R. 12 2,379
66 03062900 Crustaceans, whether in shell or not, live, Kg. 335 242,160 Netherlands 335 242,160
67 03071100 Oysters: Live, fresh or chilled Kg. 150 50,661 India 150 50,661
68 03071900 Oysters Kg. 250 91,215 India 250 91,215
69 03072900 Scallops, including queen scallops, of the Kg. 157 379,178 China P. R. 75 67,299 U.S.A. 82 311,879
70 03075900 Octopus Kg. 5 2,086 Thailand 5 2,086
71 03079900 Flours, meals and pellets of aquatic Kg. 21 13,756 Thailand 21 13,756
Chapter 04 Dairy produce: birds` eggs: natural honey: 1,948,315,585
72 04011000 Milk and cream of a fat content, by weight, not Kg. 3,107,448 146,960,224 Thailand 96 9,959 Vietnam 50 24,479 India 3,107,302 146,925,786
73 04012000 Milk and cream, not concentrated nor Kg. 10,370,967 501,871,324 India 10,370,967 501,871,324
74 04021000 Milk and cream in powder, granules or other Kg. 714,575 185,959,966 Japan 20 7,600 Singapore 22,435 2,441,591 Thailand 324 86,656 Vietnam 22 19,674 India 691,738 183,385,473 Netherlands 8 666 U.K. 24 10,219 Australia 5 8,087
75 04022100 Milk and cream in solid form not containing Kg. 227,692 70,035,284 Bangladesh 6,653 4,676,114 China P. R. 9 1,742 Thailand 559 57,111 India 168,038 46,870,241 Netherlands 6,420 5,352,454 Australia 10 15,250 New Zealand 46,003 13,062,372
76 04022900 Milk and cream in powdered and granules of a Kg. 1,302,126 596,487,181 China P. R. 21 3,977 Singapore 2 5,440 India 1,235,917 584,240,783 U.K. 5,886 4,294,773 Australia 60,300 7,942,208
77 04029100 Milk and cream in liquid form not containing Kg. 43,613 4,654,603
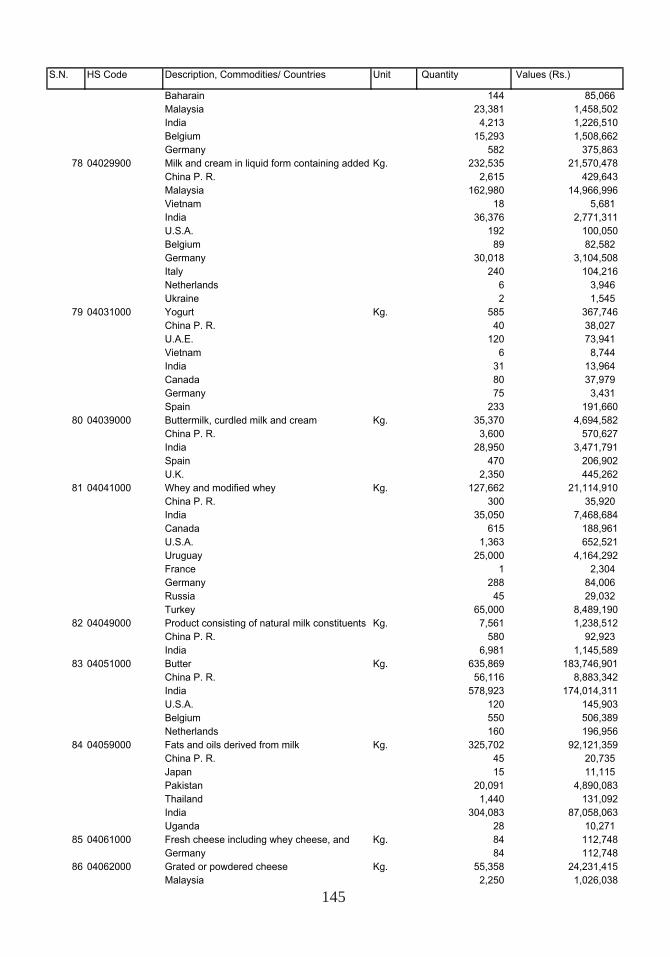
145
S.N. HS Code Description, Commodities/ Countries Unit Quantity Values (Rs.)
Baharain 144 85,066 Malaysia 23,381 1,458,502 India 4,213 1,226,510 Belgium 15,293 1,508,662 Germany 582 375,863
78 04029900 Milk and cream in liquid form containing added Kg. 232,535 21,570,478 China P. R. 2,615 429,643 Malaysia 162,980 14,966,996 Vietnam 18 5,681 India 36,376 2,771,311 U.S.A. 192 100,050 Belgium 89 82,582 Germany 30,018 3,104,508 Italy 240 104,216 Netherlands 6 3,946 Ukraine 2 1,545
79 04031000 Yogurt Kg. 585 367,746 China P. R. 40 38,027 U.A.E. 120 73,941 Vietnam 6 8,744 India 31 13,964 Canada 80 37,979 Germany 75 3,431 Spain 233 191,660
80 04039000 Buttermilk, curdled milk and cream Kg. 35,370 4,694,582 China P. R. 3,600 570,627 India 28,950 3,471,791 Spain 470 206,902 U.K. 2,350 445,262
81 04041000 Whey and modified whey Kg. 127,662 21,114,910 China P. R. 300 35,920 India 35,050 7,468,684 Canada 615 188,961 U.S.A. 1,363 652,521 Uruguay 25,000 4,164,292 France 1 2,304 Germany 288 84,006 Russia 45 29,032 Turkey 65,000 8,489,190
82 04049000 Product consisting of natural milk constituents Kg. 7,561 1,238,512 China P. R. 580 92,923 India 6,981 1,145,589
83 04051000 Butter Kg. 635,869 183,746,901 China P. R. 56,116 8,883,342 India 578,923 174,014,311 U.S.A. 120 145,903 Belgium 550 506,389 Netherlands 160 196,956
84 04059000 Fats and oils derived from milk Kg. 325,702 92,121,359 China P. R. 45 20,735 Japan 15 11,115 Pakistan 20,091 4,890,083 Thailand 1,440 131,092 India 304,083 87,058,063 Uganda 28 10,271
85 04061000 Fresh cheese including whey cheese, and Kg. 84 112,748 Germany 84 112,748
86 04062000 Grated or powdered cheese Kg. 55,358 24,231,415 Malaysia 2,250 1,026,038
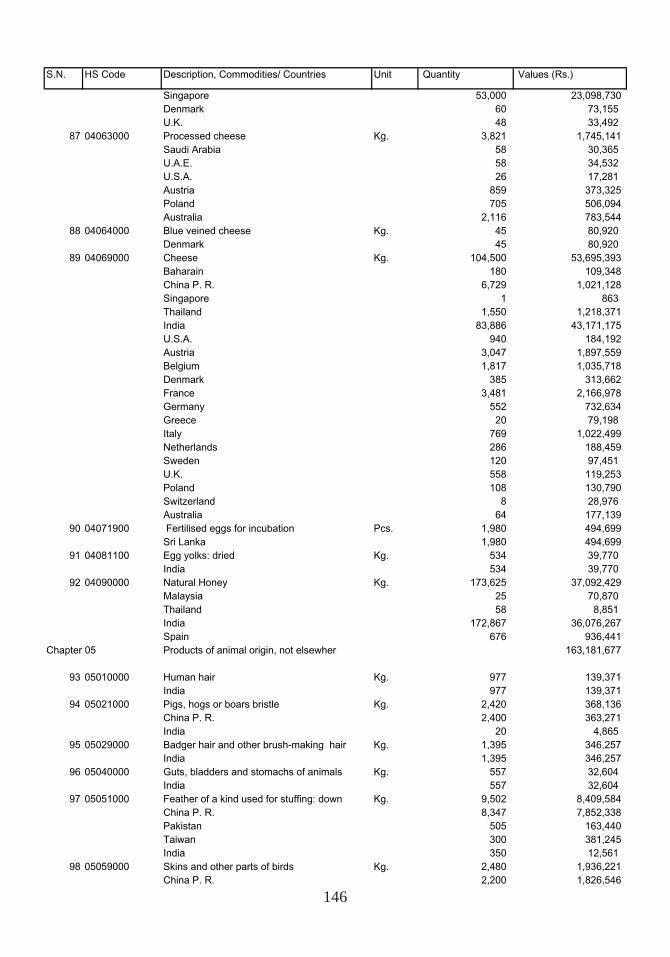
146
S.N. HS Code Description, Commodities/ Countries Unit Quantity Values (Rs.)
Singapore 53,000 23,098,730 Denmark 60 73,155 U.K. 48 33,492
87 04063000 Processed cheese Kg. 3,821 1,745,141 Saudi Arabia 58 30,365 U.A.E. 58 34,532 U.S.A. 26 17,281 Austria 859 373,325 Poland 705 506,094 Australia 2,116 783,544
88 04064000 Blue veined cheese Kg. 45 80,920 Denmark 45 80,920
89 04069000 Cheese Kg. 104,500 53,695,393 Baharain 180 109,348 China P. R. 6,729 1,021,128 Singapore 1 863 Thailand 1,550 1,218,371 India 83,886 43,171,175 U.S.A. 940 184,192 Austria 3,047 1,897,559 Belgium 1,817 1,035,718 Denmark 385 313,662 France 3,481 2,166,978 Germany 552 732,634 Greece 20 79,198 Italy 769 1,022,499 Netherlands 286 188,459 Sweden 120 97,451 U.K. 558 119,253 Poland 108 130,790 Switzerland 8 28,976 Australia 64 177,139
90 04071900 Fertilised eggs for incubation Pcs. 1,980 494,699 Sri Lanka 1,980 494,699
91 04081100 Egg yolks: dried Kg. 534 39,770 India 534 39,770
92 04090000 Natural Honey Kg. 173,625 37,092,429 Malaysia 25 70,870 Thailand 58 8,851 India 172,867 36,076,267 Spain 676 936,441
Chapter 05 Products of animal origin, not elsewher 163,181,677
93 05010000 Human hair Kg. 977 139,371 India 977 139,371
94 05021000 Pigs, hogs or boars bristle Kg. 2,420 368,136 China P. R. 2,400 363,271 India 20 4,865
95 05029000 Badger hair and other brush-making hair Kg. 1,395 346,257 India 1,395 346,257
96 05040000 Guts, bladders and stomachs of animals Kg. 557 32,604 India 557 32,604
97 05051000 Feather of a kind used for stuffing: down Kg. 9,502 8,409,584 China P. R. 8,347 7,852,338 Pakistan 505 163,440 Taiwan 300 381,245 India 350 12,561
98 05059000 Skins and other parts of birds Kg. 2,480 1,936,221 China P. R. 2,200 1,826,546
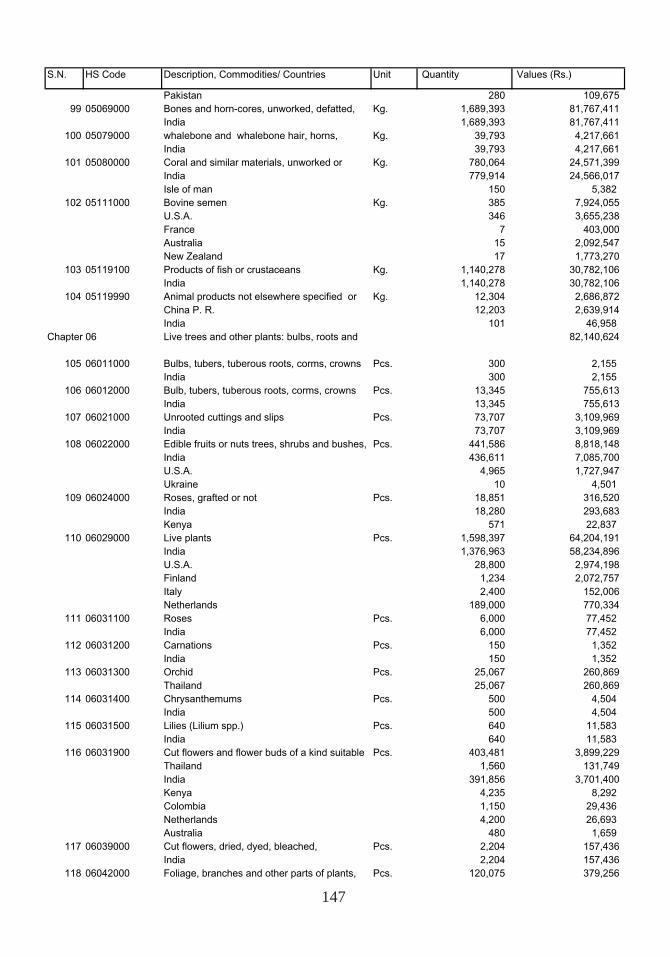
147
S.N. HS Code Description, Commodities/ Countries Unit Quantity Values (Rs.)
Pakistan 280 109,675 99 05069000 Bones and horn-cores, unworked, defatted, Kg. 1,689,393 81,767,411
India 1,689,393 81,767,411 100 05079000 whalebone and whalebone hair, horns, Kg. 39,793 4,217,661
India 39,793 4,217,661 101 05080000 Coral and similar materials, unworked or Kg. 780,064 24,571,399
India 779,914 24,566,017 Isle of man 150 5,382
102 05111000 Bovine semen Kg. 385 7,924,055 U.S.A. 346 3,655,238 France 7 403,000 Australia 15 2,092,547 New Zealand 17 1,773,270
103 05119100 Products of fish or crustaceans Kg. 1,140,278 30,782,106 India 1,140,278 30,782,106
104 05119990 Animal products not elsewhere specified or Kg. 12,304 2,686,872 China P. R. 12,203 2,639,914 India 101 46,958
Chapter 06 Live trees and other plants: bulbs, roots and 82,140,624
105 06011000 Bulbs, tubers, tuberous roots, corms, crowns Pcs. 300 2,155 India 300 2,155
106 06012000 Bulb, tubers, tuberous roots, corms, crowns Pcs. 13,345 755,613 India 13,345 755,613
107 06021000 Unrooted cuttings and slips Pcs. 73,707 3,109,969 India 73,707 3,109,969
108 06022000 Edible fruits or nuts trees, shrubs and bushes, Pcs. 441,586 8,818,148 India 436,611 7,085,700 U.S.A. 4,965 1,727,947 Ukraine 10 4,501
109 06024000 Roses, grafted or not Pcs. 18,851 316,520 India 18,280 293,683 Kenya 571 22,837
110 06029000 Live plants Pcs. 1,598,397 64,204,191 India 1,376,963 58,234,896 U.S.A. 28,800 2,974,198 Finland 1,234 2,072,757 Italy 2,400 152,006 Netherlands 189,000 770,334
111 06031100 Roses Pcs. 6,000 77,452 India 6,000 77,452
112 06031200 Carnations Pcs. 150 1,352 India 150 1,352
113 06031300 Orchid Pcs. 25,067 260,869 Thailand 25,067 260,869
114 06031400 Chrysanthemums Pcs. 500 4,504 India 500 4,504
115 06031500 Lilies (Lilium spp.) Pcs. 640 11,583 India 640 11,583
116 06031900 Cut flowers and flower buds of a kind suitable Pcs. 403,481 3,899,229 Thailand 1,560 131,749 India 391,856 3,701,400 Kenya 4,235 8,292 Colombia 1,150 29,436 Netherlands 4,200 26,693 Australia 480 1,659
117 06039000 Cut flowers, dried, dyed, bleached, Pcs. 2,204 157,436 India 2,204 157,436
118 06042000 Foliage, branches and other parts of plants, Pcs. 120,075 379,256
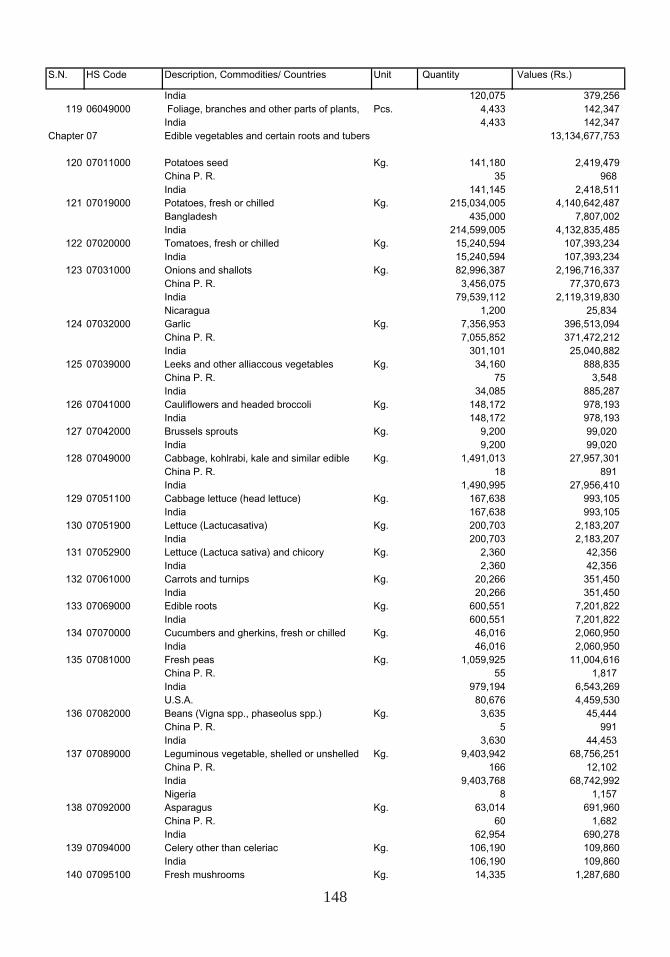
148
S.N. HS Code Description, Commodities/ Countries Unit Quantity Values (Rs.)
India 120,075 379,256 119 06049000 Foliage, branches and other parts of plants, Pcs. 4,433 142,347
India 4,433 142,347 Chapter 07 Edible vegetables and certain roots and tubers 13,134,677,753
120 07011000 Potatoes seed Kg. 141,180 2,419,479 China P. R. 35 968 India 141,145 2,418,511
121 07019000 Potatoes, fresh or chilled Kg. 215,034,005 4,140,642,487 Bangladesh 435,000 7,807,002 India 214,599,005 4,132,835,485
122 07020000 Tomatoes, fresh or chilled Kg. 15,240,594 107,393,234 India 15,240,594 107,393,234
123 07031000 Onions and shallots Kg. 82,996,387 2,196,716,337 China P. R. 3,456,075 77,370,673 India 79,539,112 2,119,319,830 Nicaragua 1,200 25,834
124 07032000 Garlic Kg. 7,356,953 396,513,094 China P. R. 7,055,852 371,472,212 India 301,101 25,040,882
125 07039000 Leeks and other alliaccous vegetables Kg. 34,160 888,835 China P. R. 75 3,548 India 34,085 885,287
126 07041000 Cauliflowers and headed broccoli Kg. 148,172 978,193 India 148,172 978,193
127 07042000 Brussels sprouts Kg. 9,200 99,020 India 9,200 99,020
128 07049000 Cabbage, kohlrabi, kale and similar edible Kg. 1,491,013 27,957,301 China P. R. 18 891 India 1,490,995 27,956,410
129 07051100 Cabbage lettuce (head lettuce) Kg. 167,638 993,105 India 167,638 993,105
130 07051900 Lettuce (Lactucasativa) Kg. 200,703 2,183,207 India 200,703 2,183,207
131 07052900 Lettuce (Lactuca sativa) and chicory Kg. 2,360 42,356 India 2,360 42,356
132 07061000 Carrots and turnips Kg. 20,266 351,450 India 20,266 351,450
133 07069000 Edible roots Kg. 600,551 7,201,822 India 600,551 7,201,822
134 07070000 Cucumbers and gherkins, fresh or chilled Kg. 46,016 2,060,950 India 46,016 2,060,950
135 07081000 Fresh peas Kg. 1,059,925 11,004,616 China P. R. 55 1,817 India 979,194 6,543,269 U.S.A. 80,676 4,459,530
136 07082000 Beans (Vigna spp., phaseolus spp.) Kg. 3,635 45,444 China P. R. 5 991 India 3,630 44,453
137 07089000 Leguminous vegetable, shelled or unshelled Kg. 9,403,942 68,756,251 China P. R. 166 12,102 India 9,403,768 68,742,992 Nigeria 8 1,157
138 07092000 Asparagus Kg. 63,014 691,960 China P. R. 60 1,682 India 62,954 690,278
139 07094000 Celery other than celeriac Kg. 106,190 109,860 India 106,190 109,860
140 07095100 Fresh mushrooms Kg. 14,335 1,287,680
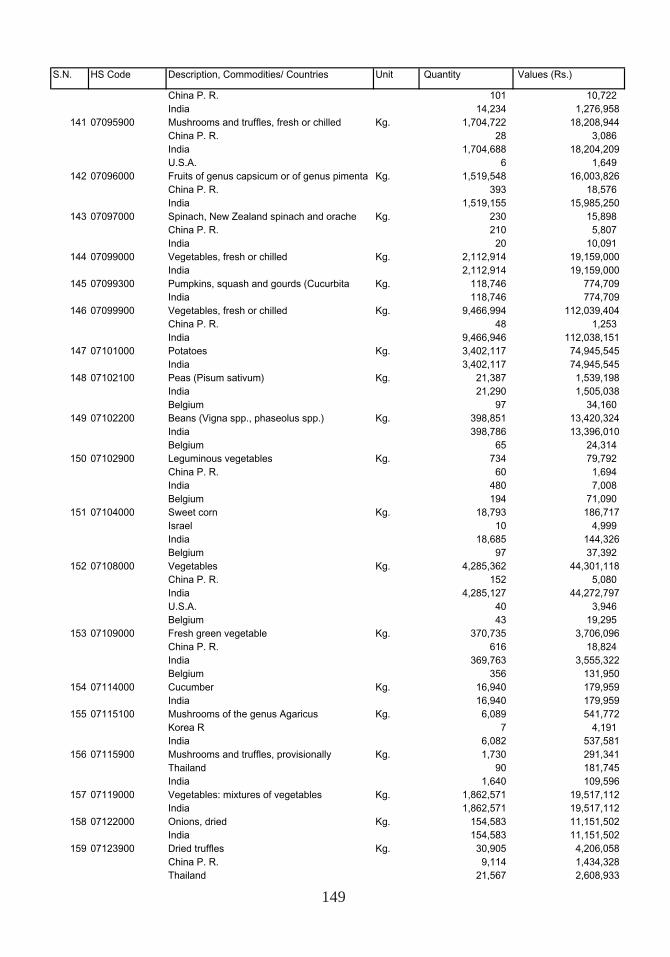
149
S.N. HS Code Description, Commodities/ Countries Unit Quantity Values (Rs.)
China P. R. 101 10,722 India 14,234 1,276,958
141 07095900 Mushrooms and truffles, fresh or chilled Kg. 1,704,722 18,208,944 China P. R. 28 3,086 India 1,704,688 18,204,209 U.S.A. 6 1,649
142 07096000 Fruits of genus capsicum or of genus pimenta Kg. 1,519,548 16,003,826 China P. R. 393 18,576 India 1,519,155 15,985,250
143 07097000 Spinach, New Zealand spinach and orache Kg. 230 15,898 China P. R. 210 5,807 India 20 10,091
144 07099000 Vegetables, fresh or chilled Kg. 2,112,914 19,159,000 India 2,112,914 19,159,000
145 07099300 Pumpkins, squash and gourds (Cucurbita Kg. 118,746 774,709 India 118,746 774,709
146 07099900 Vegetables, fresh or chilled Kg. 9,466,994 112,039,404 China P. R. 48 1,253 India 9,466,946 112,038,151
147 07101000 Potatoes Kg. 3,402,117 74,945,545 India 3,402,117 74,945,545
148 07102100 Peas (Pisum sativum) Kg. 21,387 1,539,198 India 21,290 1,505,038 Belgium 97 34,160
149 07102200 Beans (Vigna spp., phaseolus spp.) Kg. 398,851 13,420,324 India 398,786 13,396,010 Belgium 65 24,314
150 07102900 Leguminous vegetables Kg. 734 79,792 China P. R. 60 1,694 India 480 7,008 Belgium 194 71,090
151 07104000 Sweet corn Kg. 18,793 186,717 Israel 10 4,999 India 18,685 144,326 Belgium 97 37,392
152 07108000 Vegetables Kg. 4,285,362 44,301,118 China P. R. 152 5,080 India 4,285,127 44,272,797 U.S.A. 40 3,946 Belgium 43 19,295
153 07109000 Fresh green vegetable Kg. 370,735 3,706,096 China P. R. 616 18,824 India 369,763 3,555,322 Belgium 356 131,950
154 07114000 Cucumber Kg. 16,940 179,959 India 16,940 179,959
155 07115100 Mushrooms of the genus Agaricus Kg. 6,089 541,772 Korea R 7 4,191 India 6,082 537,581
156 07115900 Mushrooms and truffles, provisionally Kg. 1,730 291,341 Thailand 90 181,745 India 1,640 109,596
157 07119000 Vegetables: mixtures of vegetables Kg. 1,862,571 19,517,112 India 1,862,571 19,517,112
158 07122000 Onions, dried Kg. 154,583 11,151,502 India 154,583 11,151,502
159 07123900 Dried truffles Kg. 30,905 4,206,058 China P. R. 9,114 1,434,328 Thailand 21,567 2,608,933
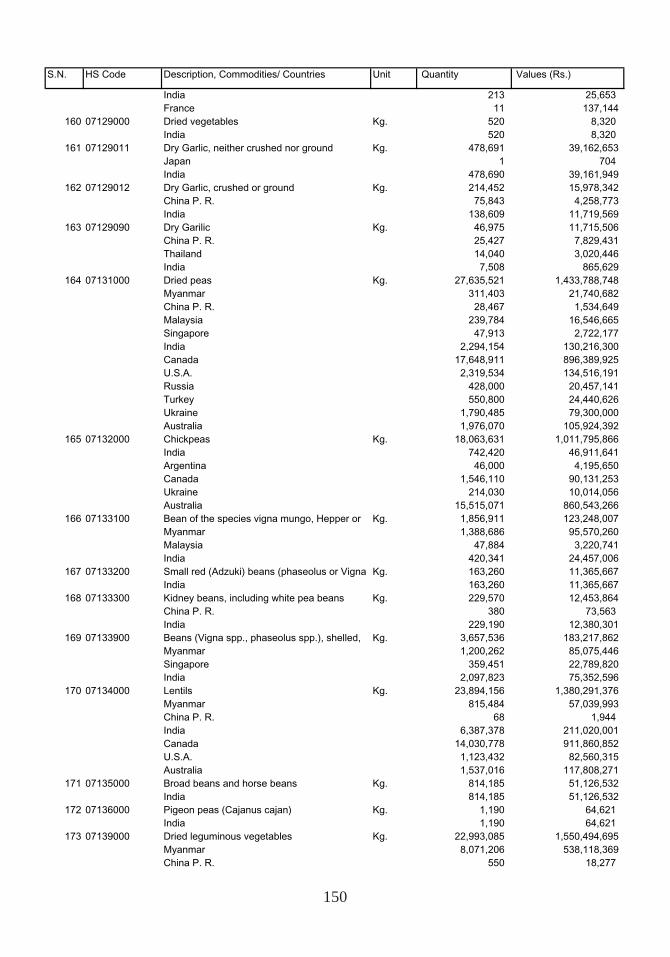
150
S.N. HS Code Description, Commodities/ Countries Unit Quantity Values (Rs.)
India 213 25,653 France 11 137,144
160 07129000 Dried vegetables Kg. 520 8,320 India 520 8,320
161 07129011 Dry Garlic, neither crushed nor ground Kg. 478,691 39,162,653 Japan 1 704 India 478,690 39,161,949
162 07129012 Dry Garlic, crushed or ground Kg. 214,452 15,978,342 China P. R. 75,843 4,258,773 India 138,609 11,719,569
163 07129090 Dry Garilic Kg. 46,975 11,715,506 China P. R. 25,427 7,829,431 Thailand 14,040 3,020,446 India 7,508 865,629
164 07131000 Dried peas Kg. 27,635,521 1,433,788,748 Myanmar 311,403 21,740,682 China P. R. 28,467 1,534,649 Malaysia 239,784 16,546,665 Singapore 47,913 2,722,177 India 2,294,154 130,216,300 Canada 17,648,911 896,389,925 U.S.A. 2,319,534 134,516,191 Russia 428,000 20,457,141 Turkey 550,800 24,440,626 Ukraine 1,790,485 79,300,000 Australia 1,976,070 105,924,392
165 07132000 Chickpeas Kg. 18,063,631 1,011,795,866 India 742,420 46,911,641 Argentina 46,000 4,195,650 Canada 1,546,110 90,131,253 Ukraine 214,030 10,014,056 Australia 15,515,071 860,543,266
166 07133100 Bean of the species vigna mungo, Hepper or Kg. 1,856,911 123,248,007 Myanmar 1,388,686 95,570,260 Malaysia 47,884 3,220,741 India 420,341 24,457,006
167 07133200 Small red (Adzuki) beans (phaseolus or Vigna Kg. 163,260 11,365,667 India 163,260 11,365,667
168 07133300 Kidney beans, including white pea beans Kg. 229,570 12,453,864 China P. R. 380 73,563 India 229,190 12,380,301
169 07133900 Beans (Vigna spp., phaseolus spp.), shelled, Kg. 3,657,536 183,217,862 Myanmar 1,200,262 85,075,446 Singapore 359,451 22,789,820 India 2,097,823 75,352,596
170 07134000 Lentils Kg. 23,894,156 1,380,291,376 Myanmar 815,484 57,039,993 China P. R. 68 1,944 India 6,387,378 211,020,001 Canada 14,030,778 911,860,852 U.S.A. 1,123,432 82,560,315 Australia 1,537,016 117,808,271
171 07135000 Broad beans and horse beans Kg. 814,185 51,126,532 India 814,185 51,126,532
172 07136000 Pigeon peas (Cajanus cajan) Kg. 1,190 64,621 India 1,190 64,621
173 07139000 Dried leguminous vegetables Kg. 22,993,085 1,550,494,695 Myanmar 8,071,206 538,118,369 China P. R. 550 18,277
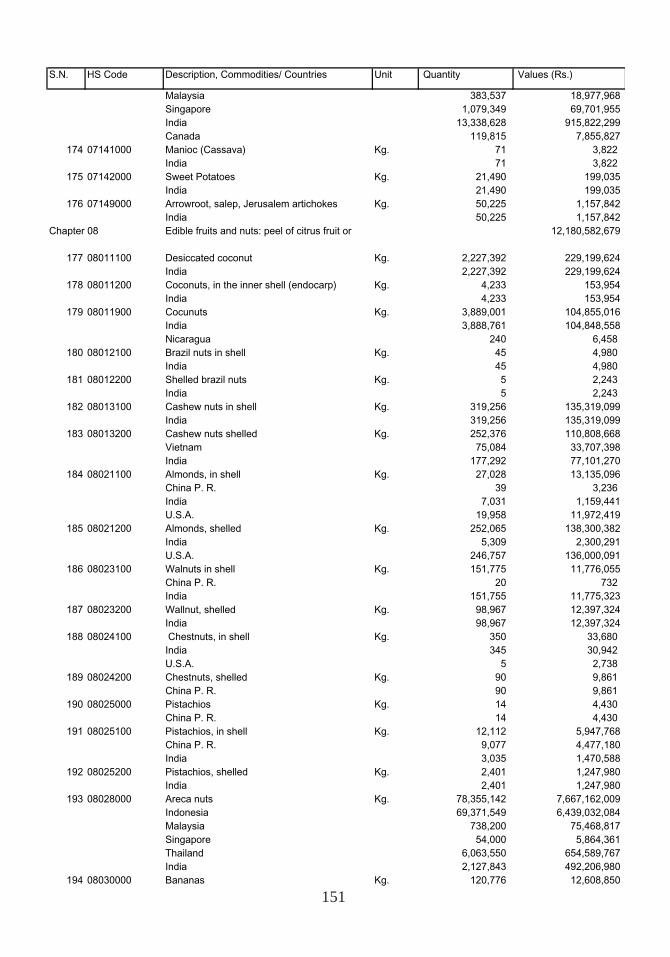
151
S.N. HS Code Description, Commodities/ Countries Unit Quantity Values (Rs.)
Malaysia 383,537 18,977,968 Singapore 1,079,349 69,701,955 India 13,338,628 915,822,299 Canada 119,815 7,855,827
174 07141000 Manioc (Cassava) Kg. 71 3,822 India 71 3,822
175 07142000 Sweet Potatoes Kg. 21,490 199,035 India 21,490 199,035
176 07149000 Arrowroot, salep, Jerusalem artichokes Kg. 50,225 1,157,842 India 50,225 1,157,842
Chapter 08 Edible fruits and nuts: peel of citrus fruit or 12,180,582,679
177 08011100 Desiccated coconut Kg. 2,227,392 229,199,624 India 2,227,392 229,199,624
178 08011200 Coconuts, in the inner shell (endocarp) Kg. 4,233 153,954 India 4,233 153,954
179 08011900 Cocunuts Kg. 3,889,001 104,855,016 India 3,888,761 104,848,558 Nicaragua 240 6,458
180 08012100 Brazil nuts in shell Kg. 45 4,980 India 45 4,980
181 08012200 Shelled brazil nuts Kg. 5 2,243 India 5 2,243
182 08013100 Cashew nuts in shell Kg. 319,256 135,319,099 India 319,256 135,319,099
183 08013200 Cashew nuts shelled Kg. 252,376 110,808,668 Vietnam 75,084 33,707,398 India 177,292 77,101,270
184 08021100 Almonds, in shell Kg. 27,028 13,135,096 China P. R. 39 3,236 India 7,031 1,159,441 U.S.A. 19,958 11,972,419
185 08021200 Almonds, shelled Kg. 252,065 138,300,382 India 5,309 2,300,291 U.S.A. 246,757 136,000,091
186 08023100 Walnuts in shell Kg. 151,775 11,776,055 China P. R. 20 732 India 151,755 11,775,323
187 08023200 Wallnut, shelled Kg. 98,967 12,397,324 India 98,967 12,397,324
188 08024100 Chestnuts, in shell Kg. 350 33,680 India 345 30,942 U.S.A. 5 2,738
189 08024200 Chestnuts, shelled Kg. 90 9,861 China P. R. 90 9,861
190 08025000 Pistachios Kg. 14 4,430 China P. R. 14 4,430
191 08025100 Pistachios, in shell Kg. 12,112 5,947,768 China P. R. 9,077 4,477,180 India 3,035 1,470,588
192 08025200 Pistachios, shelled Kg. 2,401 1,247,980 India 2,401 1,247,980
193 08028000 Areca nuts Kg. 78,355,142 7,667,162,009 Indonesia 69,371,549 6,439,032,084 Malaysia 738,200 75,468,817 Singapore 54,000 5,864,361 Thailand 6,063,550 654,589,767 India 2,127,843 492,206,980
194 08030000 Bananas Kg. 120,776 12,608,850
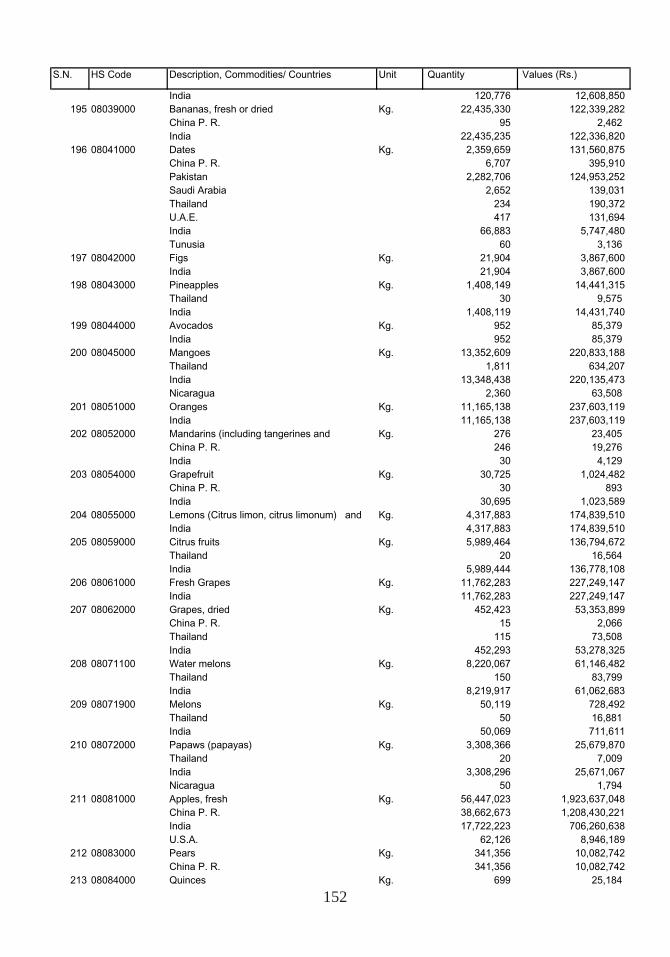
152
S.N. HS Code Description, Commodities/ Countries Unit Quantity Values (Rs.)
India 120,776 12,608,850 195 08039000 Bananas, fresh or dried Kg. 22,435,330 122,339,282
China P. R. 95 2,462 India 22,435,235 122,336,820
196 08041000 Dates Kg. 2,359,659 131,560,875 China P. R. 6,707 395,910 Pakistan 2,282,706 124,953,252 Saudi Arabia 2,652 139,031 Thailand 234 190,372 U.A.E. 417 131,694 India 66,883 5,747,480 Tunusia 60 3,136
197 08042000 Figs Kg. 21,904 3,867,600 India 21,904 3,867,600
198 08043000 Pineapples Kg. 1,408,149 14,441,315 Thailand 30 9,575 India 1,408,119 14,431,740
199 08044000 Avocados Kg. 952 85,379 India 952 85,379
200 08045000 Mangoes Kg. 13,352,609 220,833,188 Thailand 1,811 634,207 India 13,348,438 220,135,473 Nicaragua 2,360 63,508
201 08051000 Oranges Kg. 11,165,138 237,603,119 India 11,165,138 237,603,119
202 08052000 Mandarins (including tangerines and Kg. 276 23,405 China P. R. 246 19,276 India 30 4,129
203 08054000 Grapefruit Kg. 30,725 1,024,482 China P. R. 30 893 India 30,695 1,023,589
204 08055000 Lemons (Citrus limon, citrus limonum) and Kg. 4,317,883 174,839,510 India 4,317,883 174,839,510
205 08059000 Citrus fruits Kg. 5,989,464 136,794,672 Thailand 20 16,564 India 5,989,444 136,778,108
206 08061000 Fresh Grapes Kg. 11,762,283 227,249,147 India 11,762,283 227,249,147
207 08062000 Grapes, dried Kg. 452,423 53,353,899 China P. R. 15 2,066 Thailand 115 73,508 India 452,293 53,278,325
208 08071100 Water melons Kg. 8,220,067 61,146,482 Thailand 150 83,799 India 8,219,917 61,062,683
209 08071900 Melons Kg. 50,119 728,492 Thailand 50 16,881 India 50,069 711,611
210 08072000 Papaws (papayas) Kg. 3,308,366 25,679,870 Thailand 20 7,009 India 3,308,296 25,671,067 Nicaragua 50 1,794
211 08081000 Apples, fresh Kg. 56,447,023 1,923,637,048 China P. R. 38,662,673 1,208,430,221 India 17,722,223 706,260,638 U.S.A. 62,126 8,946,189
212 08083000 Pears Kg. 341,356 10,082,742 China P. R. 341,356 10,082,742
213 08084000 Quinces Kg. 699 25,184
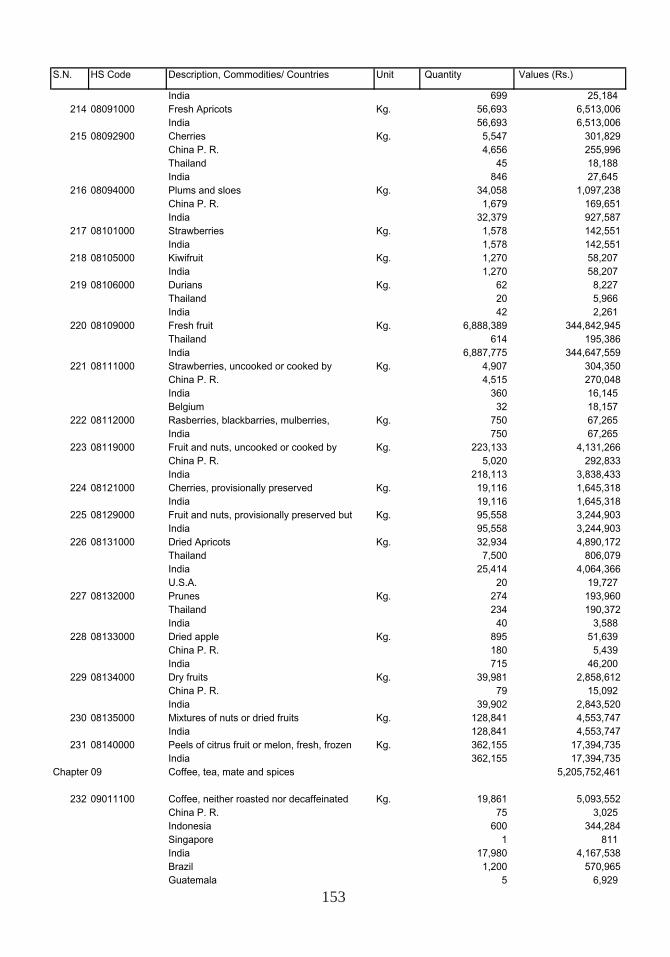
153
S.N. HS Code Description, Commodities/ Countries Unit Quantity Values (Rs.)
India 699 25,184 214 08091000 Fresh Apricots Kg. 56,693 6,513,006
India 56,693 6,513,006 215 08092900 Cherries Kg. 5,547 301,829
China P. R. 4,656 255,996 Thailand 45 18,188 India 846 27,645
216 08094000 Plums and sloes Kg. 34,058 1,097,238 China P. R. 1,679 169,651 India 32,379 927,587
217 08101000 Strawberries Kg. 1,578 142,551 India 1,578 142,551
218 08105000 Kiwifruit Kg. 1,270 58,207 India 1,270 58,207
219 08106000 Durians Kg. 62 8,227 Thailand 20 5,966 India 42 2,261
220 08109000 Fresh fruit Kg. 6,888,389 344,842,945 Thailand 614 195,386 India 6,887,775 344,647,559
221 08111000 Strawberries, uncooked or cooked by Kg. 4,907 304,350 China P. R. 4,515 270,048 India 360 16,145 Belgium 32 18,157
222 08112000 Rasberries, blackbarries, mulberries, Kg. 750 67,265 India 750 67,265
223 08119000 Fruit and nuts, uncooked or cooked by Kg. 223,133 4,131,266 China P. R. 5,020 292,833 India 218,113 3,838,433
224 08121000 Cherries, provisionally preserved Kg. 19,116 1,645,318 India 19,116 1,645,318
225 08129000 Fruit and nuts, provisionally preserved but Kg. 95,558 3,244,903 India 95,558 3,244,903
226 08131000 Dried Apricots Kg. 32,934 4,890,172 Thailand 7,500 806,079 India 25,414 4,064,366 U.S.A. 20 19,727
227 08132000 Prunes Kg. 274 193,960 Thailand 234 190,372 India 40 3,588
228 08133000 Dried apple Kg. 895 51,639 China P. R. 180 5,439 India 715 46,200
229 08134000 Dry fruits Kg. 39,981 2,858,612 China P. R. 79 15,092 India 39,902 2,843,520
230 08135000 Mixtures of nuts or dried fruits Kg. 128,841 4,553,747 India 128,841 4,553,747
231 08140000 Peels of citrus fruit or melon, fresh, frozen Kg. 362,155 17,394,735 India 362,155 17,394,735
Chapter 09 Coffee, tea, mate and spices 5,205,752,461
232 09011100 Coffee, neither roasted nor decaffeinated Kg. 19,861 5,093,552 China P. R. 75 3,025 Indonesia 600 344,284 Singapore 1 811 India 17,980 4,167,538 Brazil 1,200 570,965 Guatemala 5 6,929
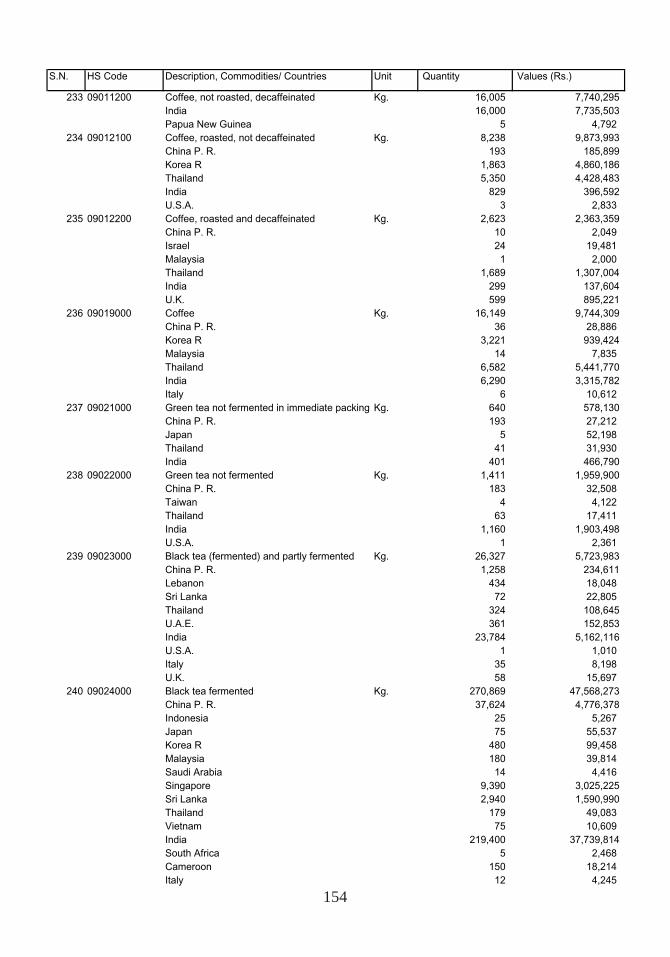
154
S.N. HS Code Description, Commodities/ Countries Unit Quantity Values (Rs.)
233 09011200 Coffee, not roasted, decaffeinated Kg. 16,005 7,740,295 India 16,000 7,735,503 Papua New Guinea 5 4,792
234 09012100 Coffee, roasted, not decaffeinated Kg. 8,238 9,873,993 China P. R. 193 185,899 Korea R 1,863 4,860,186 Thailand 5,350 4,428,483 India 829 396,592 U.S.A. 3 2,833
235 09012200 Coffee, roasted and decaffeinated Kg. 2,623 2,363,359 China P. R. 10 2,049 Israel 24 19,481 Malaysia 1 2,000 Thailand 1,689 1,307,004 India 299 137,604 U.K. 599 895,221
236 09019000 Coffee Kg. 16,149 9,744,309 China P. R. 36 28,886 Korea R 3,221 939,424 Malaysia 14 7,835 Thailand 6,582 5,441,770 India 6,290 3,315,782 Italy 6 10,612
237 09021000 Green tea not fermented in immediate packing Kg. 640 578,130 China P. R. 193 27,212 Japan 5 52,198 Thailand 41 31,930 India 401 466,790
238 09022000 Green tea not fermented Kg. 1,411 1,959,900 China P. R. 183 32,508 Taiwan 4 4,122 Thailand 63 17,411 India 1,160 1,903,498 U.S.A. 1 2,361
239 09023000 Black tea (fermented) and partly fermented Kg. 26,327 5,723,983 China P. R. 1,258 234,611 Lebanon 434 18,048 Sri Lanka 72 22,805 Thailand 324 108,645 U.A.E. 361 152,853 India 23,784 5,162,116 U.S.A. 1 1,010 Italy 35 8,198 U.K. 58 15,697
240 09024000 Black tea fermented Kg. 270,869 47,568,273 China P. R. 37,624 4,776,378 Indonesia 25 5,267 Japan 75 55,537 Korea R 480 99,458 Malaysia 180 39,814 Saudi Arabia 14 4,416 Singapore 9,390 3,025,225 Sri Lanka 2,940 1,590,990 Thailand 179 49,083 Vietnam 75 10,609 India 219,400 37,739,814 South Africa 5 2,468 Cameroon 150 18,214 Italy 12 4,245
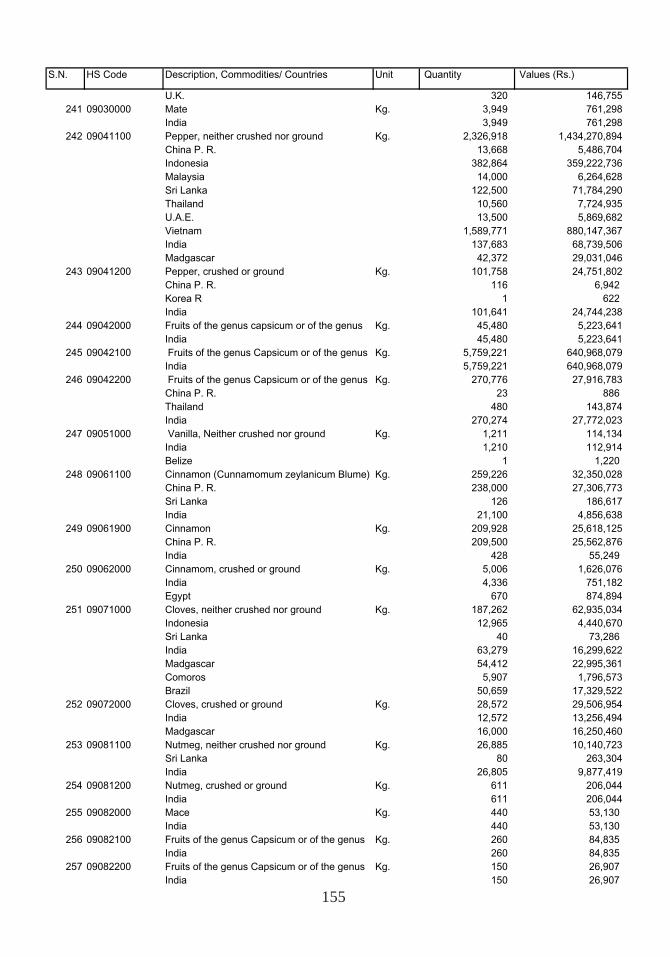
155
S.N. HS Code Description, Commodities/ Countries Unit Quantity Values (Rs.)
U.K. 320 146,755 241 09030000 Mate Kg. 3,949 761,298
India 3,949 761,298 242 09041100 Pepper, neither crushed nor ground Kg. 2,326,918 1,434,270,894
China P. R. 13,668 5,486,704 Indonesia 382,864 359,222,736 Malaysia 14,000 6,264,628 Sri Lanka 122,500 71,784,290 Thailand 10,560 7,724,935 U.A.E. 13,500 5,869,682 Vietnam 1,589,771 880,147,367 India 137,683 68,739,506 Madgascar 42,372 29,031,046
243 09041200 Pepper, crushed or ground Kg. 101,758 24,751,802 China P. R. 116 6,942 Korea R 1 622 India 101,641 24,744,238
244 09042000 Fruits of the genus capsicum or of the genus Kg. 45,480 5,223,641 India 45,480 5,223,641
245 09042100 Fruits of the genus Capsicum or of the genus Kg. 5,759,221 640,968,079 India 5,759,221 640,968,079
246 09042200 Fruits of the genus Capsicum or of the genus Kg. 270,776 27,916,783 China P. R. 23 886 Thailand 480 143,874 India 270,274 27,772,023
247 09051000 Vanilla, Neither crushed nor ground Kg. 1,211 114,134 India 1,210 112,914 Belize 1 1,220
248 09061100 Cinnamon (Cunnamomum zeylanicum Blume) Kg. 259,226 32,350,028 China P. R. 238,000 27,306,773 Sri Lanka 126 186,617 India 21,100 4,856,638
249 09061900 Cinnamon Kg. 209,928 25,618,125 China P. R. 209,500 25,562,876 India 428 55,249
250 09062000 Cinnamom, crushed or ground Kg. 5,006 1,626,076 India 4,336 751,182 Egypt 670 874,894
251 09071000 Cloves, neither crushed nor ground Kg. 187,262 62,935,034 Indonesia 12,965 4,440,670 Sri Lanka 40 73,286 India 63,279 16,299,622 Madgascar 54,412 22,995,361 Comoros 5,907 1,796,573 Brazil 50,659 17,329,522
252 09072000 Cloves, crushed or ground Kg. 28,572 29,506,954 India 12,572 13,256,494 Madgascar 16,000 16,250,460
253 09081100 Nutmeg, neither crushed nor ground Kg. 26,885 10,140,723 Sri Lanka 80 263,304 India 26,805 9,877,419
254 09081200 Nutmeg, crushed or ground Kg. 611 206,044 India 611 206,044
255 09082000 Mace Kg. 440 53,130 India 440 53,130
256 09082100 Fruits of the genus Capsicum or of the genus Kg. 260 84,835 India 260 84,835
257 09082200 Fruits of the genus Capsicum or of the genus Kg. 150 26,907 India 150 26,907
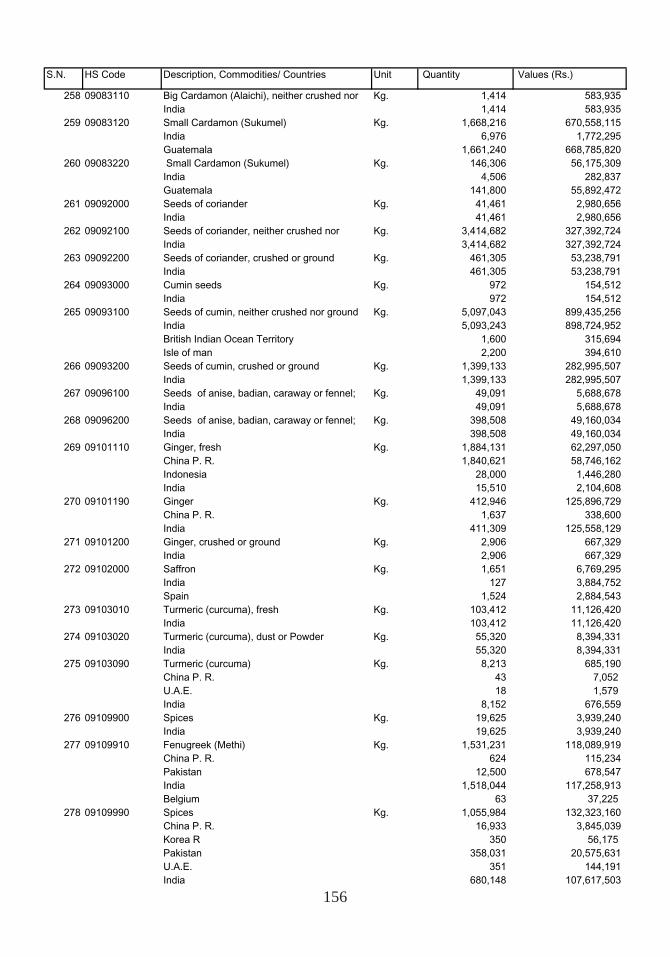
156
S.N. HS Code Description, Commodities/ Countries Unit Quantity Values (Rs.)
258 09083110 Big Cardamon (Alaichi), neither crushed nor Kg. 1,414 583,935 India 1,414 583,935
259 09083120 Small Cardamon (Sukumel) Kg. 1,668,216 670,558,115 India 6,976 1,772,295 Guatemala 1,661,240 668,785,820
260 09083220 Small Cardamon (Sukumel) Kg. 146,306 56,175,309 India 4,506 282,837 Guatemala 141,800 55,892,472
261 09092000 Seeds of coriander Kg. 41,461 2,980,656 India 41,461 2,980,656
262 09092100 Seeds of coriander, neither crushed nor Kg. 3,414,682 327,392,724 India 3,414,682 327,392,724
263 09092200 Seeds of coriander, crushed or ground Kg. 461,305 53,238,791 India 461,305 53,238,791
264 09093000 Cumin seeds Kg. 972 154,512 India 972 154,512
265 09093100 Seeds of cumin, neither crushed nor ground Kg. 5,097,043 899,435,256 India 5,093,243 898,724,952 British Indian Ocean Territory 1,600 315,694 Isle of man 2,200 394,610
266 09093200 Seeds of cumin, crushed or ground Kg. 1,399,133 282,995,507 India 1,399,133 282,995,507
267 09096100 Seeds of anise, badian, caraway or fennel; Kg. 49,091 5,688,678 India 49,091 5,688,678
268 09096200 Seeds of anise, badian, caraway or fennel; Kg. 398,508 49,160,034 India 398,508 49,160,034
269 09101110 Ginger, fresh Kg. 1,884,131 62,297,050 China P. R. 1,840,621 58,746,162 Indonesia 28,000 1,446,280 India 15,510 2,104,608
270 09101190 Ginger Kg. 412,946 125,896,729 China P. R. 1,637 338,600 India 411,309 125,558,129
271 09101200 Ginger, crushed or ground Kg. 2,906 667,329 India 2,906 667,329
272 09102000 Saffron Kg. 1,651 6,769,295 India 127 3,884,752 Spain 1,524 2,884,543
273 09103010 Turmeric (curcuma), fresh Kg. 103,412 11,126,420 India 103,412 11,126,420
274 09103020 Turmeric (curcuma), dust or Powder Kg. 55,320 8,394,331 India 55,320 8,394,331
275 09103090 Turmeric (curcuma) Kg. 8,213 685,190 China P. R. 43 7,052 U.A.E. 18 1,579 India 8,152 676,559
276 09109900 Spices Kg. 19,625 3,939,240 India 19,625 3,939,240
277 09109910 Fenugreek (Methi) Kg. 1,531,231 118,089,919 China P. R. 624 115,234 Pakistan 12,500 678,547 India 1,518,044 117,258,913 Belgium 63 37,225
278 09109990 Spices Kg. 1,055,984 132,323,160 China P. R. 16,933 3,845,039 Korea R 350 56,175 Pakistan 358,031 20,575,631 U.A.E. 351 144,191 India 680,148 107,617,503
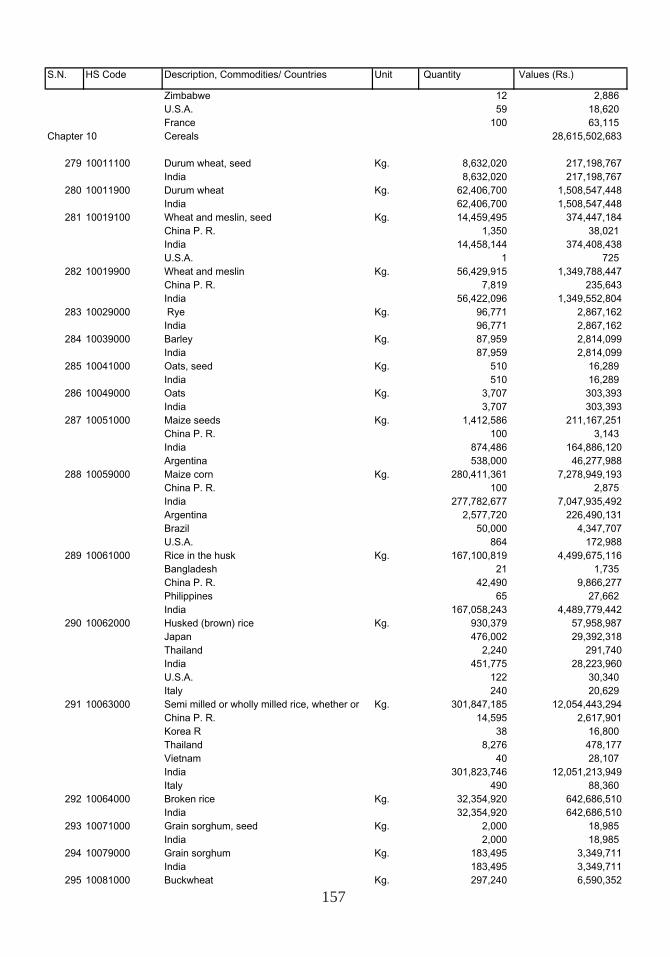
157
S.N. HS Code Description, Commodities/ Countries Unit Quantity Values (Rs.)
Zimbabwe 12 2,886 U.S.A. 59 18,620 France 100 63,115
Chapter 10 Cereals 28,615,502,683
279 10011100 Durum wheat, seed Kg. 8,632,020 217,198,767 India 8,632,020 217,198,767
280 10011900 Durum wheat Kg. 62,406,700 1,508,547,448 India 62,406,700 1,508,547,448
281 10019100 Wheat and meslin, seed Kg. 14,459,495 374,447,184 China P. R. 1,350 38,021 India 14,458,144 374,408,438 U.S.A. 1 725
282 10019900 Wheat and meslin Kg. 56,429,915 1,349,788,447 China P. R. 7,819 235,643 India 56,422,096 1,349,552,804
283 10029000 Rye Kg. 96,771 2,867,162 India 96,771 2,867,162
284 10039000 Barley Kg. 87,959 2,814,099 India 87,959 2,814,099
285 10041000 Oats, seed Kg. 510 16,289 India 510 16,289
286 10049000 Oats Kg. 3,707 303,393 India 3,707 303,393
287 10051000 Maize seeds Kg. 1,412,586 211,167,251 China P. R. 100 3,143 India 874,486 164,886,120 Argentina 538,000 46,277,988
288 10059000 Maize corn Kg. 280,411,361 7,278,949,193 China P. R. 100 2,875 India 277,782,677 7,047,935,492 Argentina 2,577,720 226,490,131 Brazil 50,000 4,347,707 U.S.A. 864 172,988
289 10061000 Rice in the husk Kg. 167,100,819 4,499,675,116 Bangladesh 21 1,735 China P. R. 42,490 9,866,277 Philippines 65 27,662 India 167,058,243 4,489,779,442
290 10062000 Husked (brown) rice Kg. 930,379 57,958,987 Japan 476,002 29,392,318 Thailand 2,240 291,740 India 451,775 28,223,960 U.S.A. 122 30,340 Italy 240 20,629
291 10063000 Semi milled or wholly milled rice, whether or Kg. 301,847,185 12,054,443,294 China P. R. 14,595 2,617,901 Korea R 38 16,800 Thailand 8,276 478,177 Vietnam 40 28,107 India 301,823,746 12,051,213,949 Italy 490 88,360
292 10064000 Broken rice Kg. 32,354,920 642,686,510 India 32,354,920 642,686,510
293 10071000 Grain sorghum, seed Kg. 2,000 18,985 India 2,000 18,985
294 10079000 Grain sorghum Kg. 183,495 3,349,711 India 183,495 3,349,711
295 10081000 Buckwheat Kg. 297,240 6,590,352
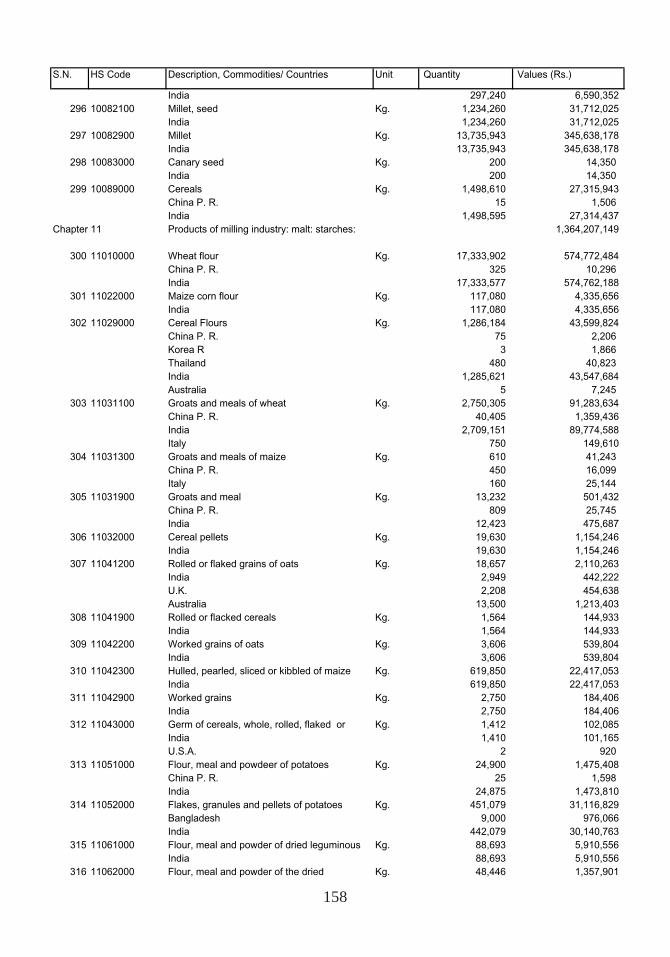
158
S.N. HS Code Description, Commodities/ Countries Unit Quantity Values (Rs.)
India 297,240 6,590,352 296 10082100 Millet, seed Kg. 1,234,260 31,712,025
India 1,234,260 31,712,025 297 10082900 Millet Kg. 13,735,943 345,638,178
India 13,735,943 345,638,178 298 10083000 Canary seed Kg. 200 14,350
India 200 14,350 299 10089000 Cereals Kg. 1,498,610 27,315,943
China P. R. 15 1,506 India 1,498,595 27,314,437
Chapter 11 Products of milling industry: malt: starches: 1,364,207,149
300 11010000 Wheat flour Kg. 17,333,902 574,772,484 China P. R. 325 10,296 India 17,333,577 574,762,188
301 11022000 Maize corn flour Kg. 117,080 4,335,656 India 117,080 4,335,656
302 11029000 Cereal Flours Kg. 1,286,184 43,599,824 China P. R. 75 2,206 Korea R 3 1,866 Thailand 480 40,823 India 1,285,621 43,547,684 Australia 5 7,245
303 11031100 Groats and meals of wheat Kg. 2,750,305 91,283,634 China P. R. 40,405 1,359,436 India 2,709,151 89,774,588 Italy 750 149,610
304 11031300 Groats and meals of maize Kg. 610 41,243 China P. R. 450 16,099 Italy 160 25,144
305 11031900 Groats and meal Kg. 13,232 501,432 China P. R. 809 25,745 India 12,423 475,687
306 11032000 Cereal pellets Kg. 19,630 1,154,246 India 19,630 1,154,246
307 11041200 Rolled or flaked grains of oats Kg. 18,657 2,110,263 India 2,949 442,222 U.K. 2,208 454,638 Australia 13,500 1,213,403
308 11041900 Rolled or flacked cereals Kg. 1,564 144,933 India 1,564 144,933
309 11042200 Worked grains of oats Kg. 3,606 539,804 India 3,606 539,804
310 11042300 Hulled, pearled, sliced or kibbled of maize Kg. 619,850 22,417,053 India 619,850 22,417,053
311 11042900 Worked grains Kg. 2,750 184,406 India 2,750 184,406
312 11043000 Germ of cereals, whole, rolled, flaked or Kg. 1,412 102,085 India 1,410 101,165 U.S.A. 2 920
313 11051000 Flour, meal and powdeer of potatoes Kg. 24,900 1,475,408 China P. R. 25 1,598 India 24,875 1,473,810
314 11052000 Flakes, granules and pellets of potatoes Kg. 451,079 31,116,829 Bangladesh 9,000 976,066 India 442,079 30,140,763
315 11061000 Flour, meal and powder of dried leguminous Kg. 88,693 5,910,556 India 88,693 5,910,556
316 11062000 Flour, meal and powder of the dried Kg. 48,446 1,357,901
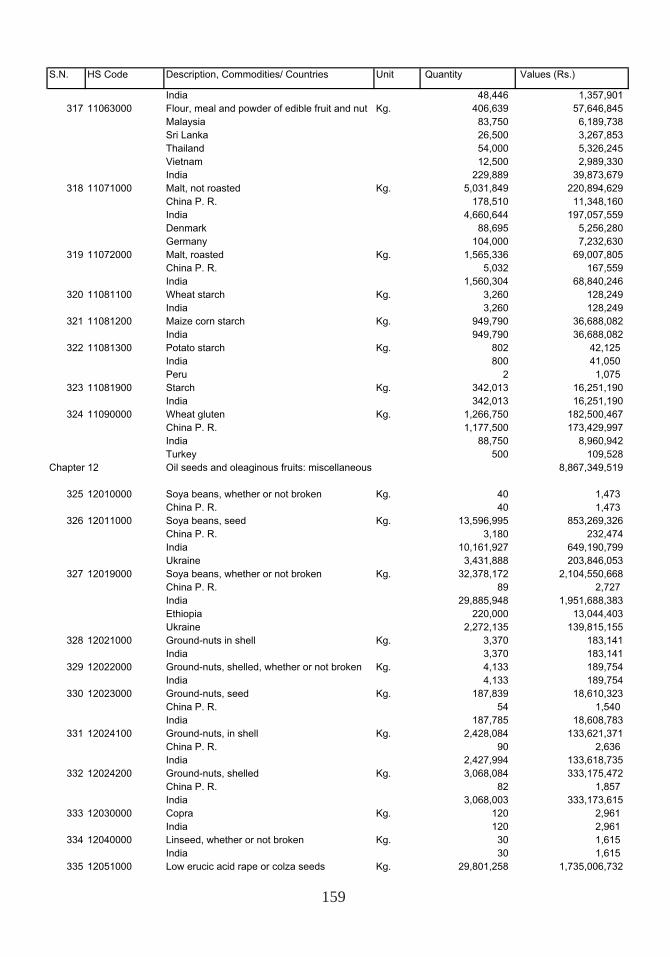
159
S.N. HS Code Description, Commodities/ Countries Unit Quantity Values (Rs.)
India 48,446 1,357,901 317 11063000 Flour, meal and powder of edible fruit and nut Kg. 406,639 57,646,845
Malaysia 83,750 6,189,738 Sri Lanka 26,500 3,267,853 Thailand 54,000 5,326,245 Vietnam 12,500 2,989,330 India 229,889 39,873,679
318 11071000 Malt, not roasted Kg. 5,031,849 220,894,629 China P. R. 178,510 11,348,160 India 4,660,644 197,057,559 Denmark 88,695 5,256,280 Germany 104,000 7,232,630
319 11072000 Malt, roasted Kg. 1,565,336 69,007,805 China P. R. 5,032 167,559 India 1,560,304 68,840,246
320 11081100 Wheat starch Kg. 3,260 128,249 India 3,260 128,249
321 11081200 Maize corn starch Kg. 949,790 36,688,082 India 949,790 36,688,082
322 11081300 Potato starch Kg. 802 42,125 India 800 41,050 Peru 2 1,075
323 11081900 Starch Kg. 342,013 16,251,190 India 342,013 16,251,190
324 11090000 Wheat gluten Kg. 1,266,750 182,500,467 China P. R. 1,177,500 173,429,997 India 88,750 8,960,942 Turkey 500 109,528
Chapter 12 Oil seeds and oleaginous fruits: miscellaneous 8,867,349,519
325 12010000 Soya beans, whether or not broken Kg. 40 1,473 China P. R. 40 1,473
326 12011000 Soya beans, seed Kg. 13,596,995 853,269,326 China P. R. 3,180 232,474 India 10,161,927 649,190,799 Ukraine 3,431,888 203,846,053
327 12019000 Soya beans, whether or not broken Kg. 32,378,172 2,104,550,668 China P. R. 89 2,727 India 29,885,948 1,951,688,383 Ethiopia 220,000 13,044,403 Ukraine 2,272,135 139,815,155
328 12021000 Ground-nuts in shell Kg. 3,370 183,141 India 3,370 183,141
329 12022000 Ground-nuts, shelled, whether or not broken Kg. 4,133 189,754 India 4,133 189,754
330 12023000 Ground-nuts, seed Kg. 187,839 18,610,323 China P. R. 54 1,540 India 187,785 18,608,783
331 12024100 Ground-nuts, in shell Kg. 2,428,084 133,621,371 China P. R. 90 2,636 India 2,427,994 133,618,735
332 12024200 Ground-nuts, shelled Kg. 3,068,084 333,175,472 China P. R. 82 1,857 India 3,068,003 333,173,615
333 12030000 Copra Kg. 120 2,961 India 120 2,961
334 12040000 Linseed, whether or not broken Kg. 30 1,615 India 30 1,615
335 12051000 Low erucic acid rape or colza seeds Kg. 29,801,258 1,735,006,732
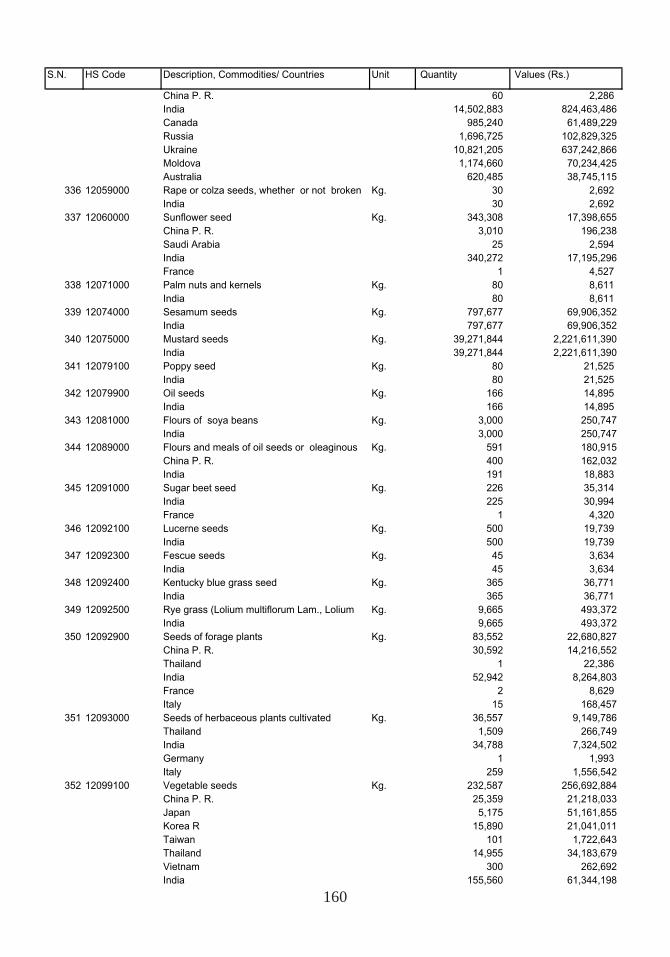
160
S.N. HS Code Description, Commodities/ Countries Unit Quantity Values (Rs.)
China P. R. 60 2,286 India 14,502,883 824,463,486 Canada 985,240 61,489,229 Russia 1,696,725 102,829,325 Ukraine 10,821,205 637,242,866 Moldova 1,174,660 70,234,425 Australia 620,485 38,745,115
336 12059000 Rape or colza seeds, whether or not broken Kg. 30 2,692 India 30 2,692
337 12060000 Sunflower seed Kg. 343,308 17,398,655 China P. R. 3,010 196,238 Saudi Arabia 25 2,594 India 340,272 17,195,296 France 1 4,527
338 12071000 Palm nuts and kernels Kg. 80 8,611 India 80 8,611
339 12074000 Sesamum seeds Kg. 797,677 69,906,352 India 797,677 69,906,352
340 12075000 Mustard seeds Kg. 39,271,844 2,221,611,390 India 39,271,844 2,221,611,390
341 12079100 Poppy seed Kg. 80 21,525 India 80 21,525
342 12079900 Oil seeds Kg. 166 14,895 India 166 14,895
343 12081000 Flours of soya beans Kg. 3,000 250,747 India 3,000 250,747
344 12089000 Flours and meals of oil seeds or oleaginous Kg. 591 180,915 China P. R. 400 162,032 India 191 18,883
345 12091000 Sugar beet seed Kg. 226 35,314 India 225 30,994 France 1 4,320
346 12092100 Lucerne seeds Kg. 500 19,739 India 500 19,739
347 12092300 Fescue seeds Kg. 45 3,634 India 45 3,634
348 12092400 Kentucky blue grass seed Kg. 365 36,771 India 365 36,771
349 12092500 Rye grass (Lolium multiflorum Lam., Lolium Kg. 9,665 493,372 India 9,665 493,372
350 12092900 Seeds of forage plants Kg. 83,552 22,680,827 China P. R. 30,592 14,216,552 Thailand 1 22,386 India 52,942 8,264,803 France 2 8,629 Italy 15 168,457
351 12093000 Seeds of herbaceous plants cultivated Kg. 36,557 9,149,786 Thailand 1,509 266,749 India 34,788 7,324,502 Germany 1 1,993 Italy 259 1,556,542
352 12099100 Vegetable seeds Kg. 232,587 256,692,884 China P. R. 25,359 21,218,033 Japan 5,175 51,161,855 Korea R 15,890 21,041,011 Taiwan 101 1,722,643 Thailand 14,955 34,183,679 Vietnam 300 262,692 India 155,560 61,344,198
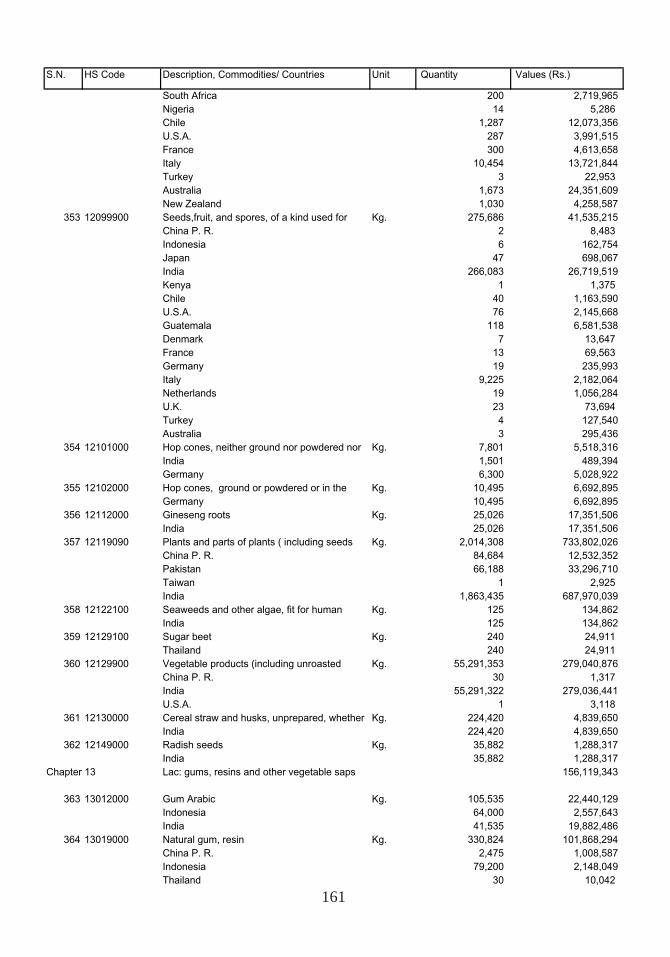
161
S.N. HS Code Description, Commodities/ Countries Unit Quantity Values (Rs.)
South Africa 200 2,719,965 Nigeria 14 5,286 Chile 1,287 12,073,356 U.S.A. 287 3,991,515 France 300 4,613,658 Italy 10,454 13,721,844 Turkey 3 22,953 Australia 1,673 24,351,609 New Zealand 1,030 4,258,587
353 12099900 Seeds,fruit, and spores, of a kind used for Kg. 275,686 41,535,215 China P. R. 2 8,483 Indonesia 6 162,754 Japan 47 698,067 India 266,083 26,719,519 Kenya 1 1,375 Chile 40 1,163,590 U.S.A. 76 2,145,668 Guatemala 118 6,581,538 Denmark 7 13,647 France 13 69,563 Germany 19 235,993 Italy 9,225 2,182,064 Netherlands 19 1,056,284 U.K. 23 73,694 Turkey 4 127,540 Australia 3 295,436
354 12101000 Hop cones, neither ground nor powdered nor Kg. 7,801 5,518,316 India 1,501 489,394 Germany 6,300 5,028,922
355 12102000 Hop cones, ground or powdered or in the Kg. 10,495 6,692,895 Germany 10,495 6,692,895
356 12112000 Gineseng roots Kg. 25,026 17,351,506 India 25,026 17,351,506
357 12119090 Plants and parts of plants ( including seeds Kg. 2,014,308 733,802,026 China P. R. 84,684 12,532,352 Pakistan 66,188 33,296,710 Taiwan 1 2,925 India 1,863,435 687,970,039
358 12122100 Seaweeds and other algae, fit for human Kg. 125 134,862 India 125 134,862
359 12129100 Sugar beet Kg. 240 24,911 Thailand 240 24,911
360 12129900 Vegetable products (including unroasted Kg. 55,291,353 279,040,876 China P. R. 30 1,317 India 55,291,322 279,036,441 U.S.A. 1 3,118
361 12130000 Cereal straw and husks, unprepared, whether Kg. 224,420 4,839,650 India 224,420 4,839,650
362 12149000 Radish seeds Kg. 35,882 1,288,317 India 35,882 1,288,317
Chapter 13 Lac: gums, resins and other vegetable saps 156,119,343
363 13012000 Gum Arabic Kg. 105,535 22,440,129 Indonesia 64,000 2,557,643 India 41,535 19,882,486
364 13019000 Natural gum, resin Kg. 330,824 101,868,294 China P. R. 2,475 1,008,587 Indonesia 79,200 2,148,049 Thailand 30 10,042
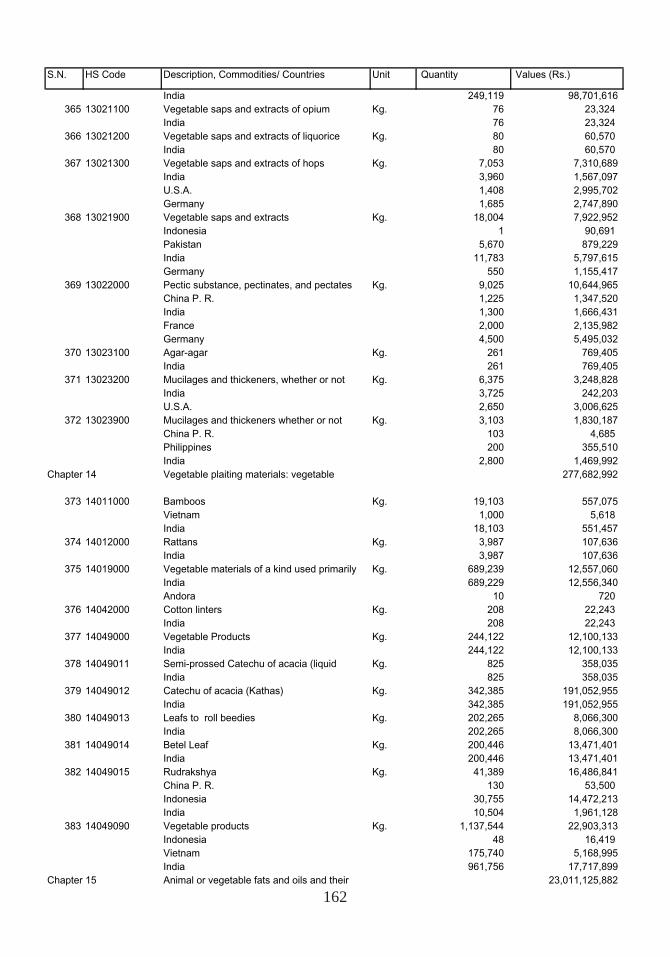
162
S.N. HS Code Description, Commodities/ Countries Unit Quantity Values (Rs.)
India 249,119 98,701,616 365 13021100 Vegetable saps and extracts of opium Kg. 76 23,324
India 76 23,324 366 13021200 Vegetable saps and extracts of liquorice Kg. 80 60,570
India 80 60,570 367 13021300 Vegetable saps and extracts of hops Kg. 7,053 7,310,689
India 3,960 1,567,097 U.S.A. 1,408 2,995,702 Germany 1,685 2,747,890
368 13021900 Vegetable saps and extracts Kg. 18,004 7,922,952 Indonesia 1 90,691 Pakistan 5,670 879,229 India 11,783 5,797,615 Germany 550 1,155,417
369 13022000 Pectic substance, pectinates, and pectates Kg. 9,025 10,644,965 China P. R. 1,225 1,347,520 India 1,300 1,666,431 France 2,000 2,135,982 Germany 4,500 5,495,032
370 13023100 Agar-agar Kg. 261 769,405 India 261 769,405
371 13023200 Mucilages and thickeners, whether or not Kg. 6,375 3,248,828 India 3,725 242,203 U.S.A. 2,650 3,006,625
372 13023900 Mucilages and thickeners whether or not Kg. 3,103 1,830,187 China P. R. 103 4,685 Philippines 200 355,510 India 2,800 1,469,992
Chapter 14 Vegetable plaiting materials: vegetable 277,682,992
373 14011000 Bamboos Kg. 19,103 557,075 Vietnam 1,000 5,618 India 18,103 551,457
374 14012000 Rattans Kg. 3,987 107,636 India 3,987 107,636
375 14019000 Vegetable materials of a kind used primarily Kg. 689,239 12,557,060 India 689,229 12,556,340 Andora 10 720
376 14042000 Cotton linters Kg. 208 22,243 India 208 22,243
377 14049000 Vegetable Products Kg. 244,122 12,100,133 India 244,122 12,100,133
378 14049011 Semi-prossed Catechu of acacia (liquid Kg. 825 358,035 India 825 358,035
379 14049012 Catechu of acacia (Kathas) Kg. 342,385 191,052,955 India 342,385 191,052,955
380 14049013 Leafs to roll beedies Kg. 202,265 8,066,300 India 202,265 8,066,300
381 14049014 Betel Leaf Kg. 200,446 13,471,401 India 200,446 13,471,401
382 14049015 Rudrakshya Kg. 41,389 16,486,841 China P. R. 130 53,500 Indonesia 30,755 14,472,213 India 10,504 1,961,128
383 14049090 Vegetable products Kg. 1,137,544 22,903,313 Indonesia 48 16,419 Vietnam 175,740 5,168,995 India 961,756 17,717,899
Chapter 15 Animal or vegetable fats and oils and their 23,011,125,882
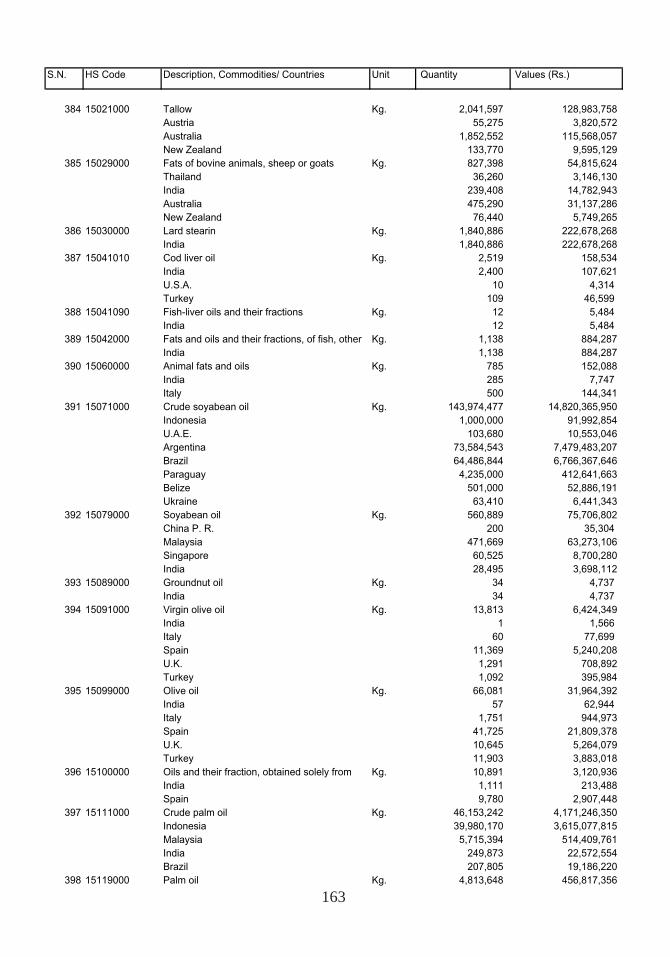
163
S.N. HS Code Description, Commodities/ Countries Unit Quantity Values (Rs.)
384 15021000 Tallow Kg. 2,041,597 128,983,758 Austria 55,275 3,820,572 Australia 1,852,552 115,568,057 New Zealand 133,770 9,595,129
385 15029000 Fats of bovine animals, sheep or goats Kg. 827,398 54,815,624 Thailand 36,260 3,146,130 India 239,408 14,782,943 Australia 475,290 31,137,286 New Zealand 76,440 5,749,265
386 15030000 Lard stearin Kg. 1,840,886 222,678,268 India 1,840,886 222,678,268
387 15041010 Cod liver oil Kg. 2,519 158,534 India 2,400 107,621 U.S.A. 10 4,314 Turkey 109 46,599
388 15041090 Fish-liver oils and their fractions Kg. 12 5,484 India 12 5,484
389 15042000 Fats and oils and their fractions, of fish, other Kg. 1,138 884,287 India 1,138 884,287
390 15060000 Animal fats and oils Kg. 785 152,088 India 285 7,747 Italy 500 144,341
391 15071000 Crude soyabean oil Kg. 143,974,477 14,820,365,950 Indonesia 1,000,000 91,992,854 U.A.E. 103,680 10,553,046 Argentina 73,584,543 7,479,483,207 Brazil 64,486,844 6,766,367,646 Paraguay 4,235,000 412,641,663 Belize 501,000 52,886,191 Ukraine 63,410 6,441,343
392 15079000 Soyabean oil Kg. 560,889 75,706,802 China P. R. 200 35,304 Malaysia 471,669 63,273,106 Singapore 60,525 8,700,280 India 28,495 3,698,112
393 15089000 Groundnut oil Kg. 34 4,737 India 34 4,737
394 15091000 Virgin olive oil Kg. 13,813 6,424,349 India 1 1,566 Italy 60 77,699 Spain 11,369 5,240,208 U.K. 1,291 708,892 Turkey 1,092 395,984
395 15099000 Olive oil Kg. 66,081 31,964,392 India 57 62,944 Italy 1,751 944,973 Spain 41,725 21,809,378 U.K. 10,645 5,264,079 Turkey 11,903 3,883,018
396 15100000 Oils and their fraction, obtained solely from Kg. 10,891 3,120,936 India 1,111 213,488 Spain 9,780 2,907,448
397 15111000 Crude palm oil Kg. 46,153,242 4,171,246,350 Indonesia 39,980,170 3,615,077,815 Malaysia 5,715,394 514,409,761 India 249,873 22,572,554 Brazil 207,805 19,186,220
398 15119000 Palm oil Kg. 4,813,648 456,817,356
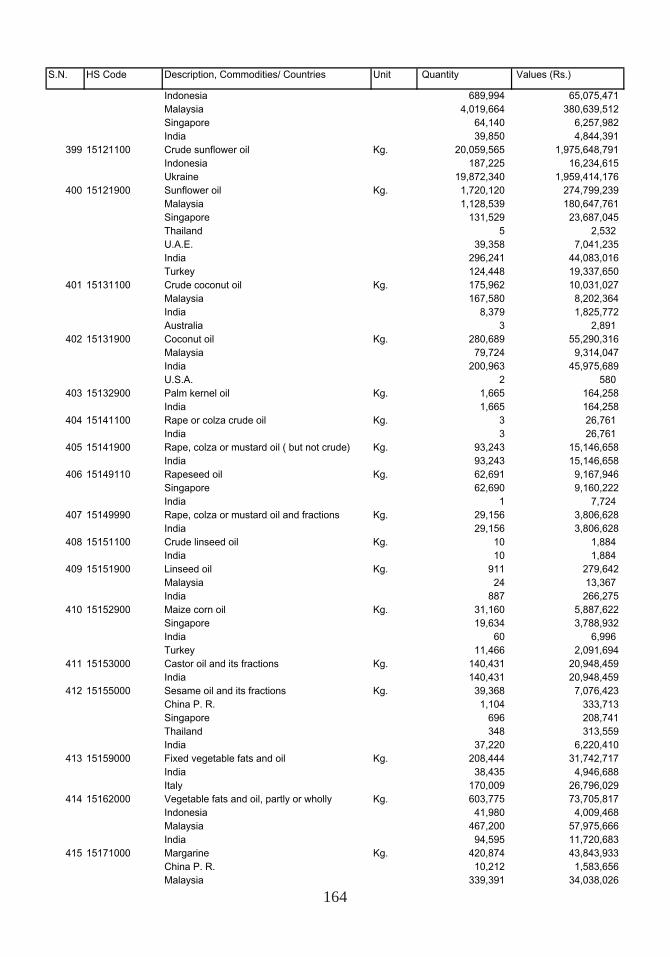
164
S.N. HS Code Description, Commodities/ Countries Unit Quantity Values (Rs.)
Indonesia 689,994 65,075,471 Malaysia 4,019,664 380,639,512 Singapore 64,140 6,257,982 India 39,850 4,844,391
399 15121100 Crude sunflower oil Kg. 20,059,565 1,975,648,791 Indonesia 187,225 16,234,615 Ukraine 19,872,340 1,959,414,176
400 15121900 Sunflower oil Kg. 1,720,120 274,799,239 Malaysia 1,128,539 180,647,761 Singapore 131,529 23,687,045 Thailand 5 2,532 U.A.E. 39,358 7,041,235 India 296,241 44,083,016 Turkey 124,448 19,337,650
401 15131100 Crude coconut oil Kg. 175,962 10,031,027 Malaysia 167,580 8,202,364 India 8,379 1,825,772 Australia 3 2,891
402 15131900 Coconut oil Kg. 280,689 55,290,316 Malaysia 79,724 9,314,047 India 200,963 45,975,689 U.S.A. 2 580
403 15132900 Palm kernel oil Kg. 1,665 164,258 India 1,665 164,258
404 15141100 Rape or colza crude oil Kg. 3 26,761 India 3 26,761
405 15141900 Rape, colza or mustard oil ( but not crude) Kg. 93,243 15,146,658 India 93,243 15,146,658
406 15149110 Rapeseed oil Kg. 62,691 9,167,946 Singapore 62,690 9,160,222 India 1 7,724
407 15149990 Rape, colza or mustard oil and fractions Kg. 29,156 3,806,628 India 29,156 3,806,628
408 15151100 Crude linseed oil Kg. 10 1,884 India 10 1,884
409 15151900 Linseed oil Kg. 911 279,642 Malaysia 24 13,367 India 887 266,275
410 15152900 Maize corn oil Kg. 31,160 5,887,622 Singapore 19,634 3,788,932 India 60 6,996 Turkey 11,466 2,091,694
411 15153000 Castor oil and its fractions Kg. 140,431 20,948,459 India 140,431 20,948,459
412 15155000 Sesame oil and its fractions Kg. 39,368 7,076,423 China P. R. 1,104 333,713 Singapore 696 208,741 Thailand 348 313,559 India 37,220 6,220,410
413 15159000 Fixed vegetable fats and oil Kg. 208,444 31,742,717 India 38,435 4,946,688 Italy 170,009 26,796,029
414 15162000 Vegetable fats and oil, partly or wholly Kg. 603,775 73,705,817 Indonesia 41,980 4,009,468 Malaysia 467,200 57,975,666 India 94,595 11,720,683
415 15171000 Margarine Kg. 420,874 43,843,933 China P. R. 10,212 1,583,656 Malaysia 339,391 34,038,026
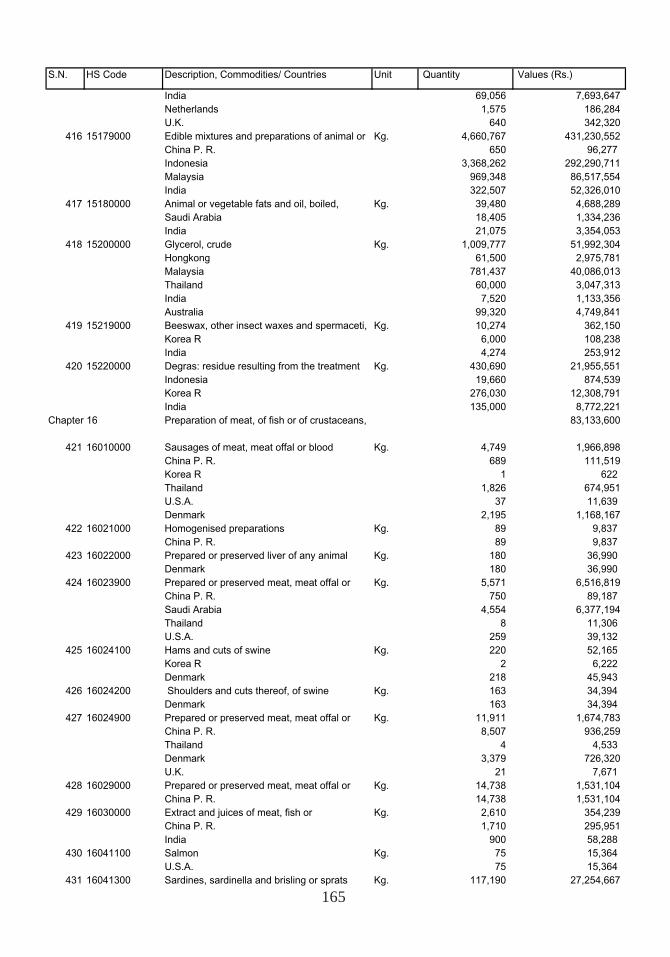
165
S.N. HS Code Description, Commodities/ Countries Unit Quantity Values (Rs.)
India 69,056 7,693,647 Netherlands 1,575 186,284 U.K. 640 342,320
416 15179000 Edible mixtures and preparations of animal or Kg. 4,660,767 431,230,552 China P. R. 650 96,277 Indonesia 3,368,262 292,290,711 Malaysia 969,348 86,517,554 India 322,507 52,326,010
417 15180000 Animal or vegetable fats and oil, boiled, Kg. 39,480 4,688,289 Saudi Arabia 18,405 1,334,236 India 21,075 3,354,053
418 15200000 Glycerol, crude Kg. 1,009,777 51,992,304 Hongkong 61,500 2,975,781 Malaysia 781,437 40,086,013 Thailand 60,000 3,047,313 India 7,520 1,133,356 Australia 99,320 4,749,841
419 15219000 Beeswax, other insect waxes and spermaceti, Kg. 10,274 362,150 Korea R 6,000 108,238 India 4,274 253,912
420 15220000 Degras: residue resulting from the treatment Kg. 430,690 21,955,551 Indonesia 19,660 874,539 Korea R 276,030 12,308,791 India 135,000 8,772,221
Chapter 16 Preparation of meat, of fish or of crustaceans, 83,133,600
421 16010000 Sausages of meat, meat offal or blood Kg. 4,749 1,966,898 China P. R. 689 111,519 Korea R 1 622 Thailand 1,826 674,951 U.S.A. 37 11,639 Denmark 2,195 1,168,167
422 16021000 Homogenised preparations Kg. 89 9,837 China P. R. 89 9,837
423 16022000 Prepared or preserved liver of any animal Kg. 180 36,990 Denmark 180 36,990
424 16023900 Prepared or preserved meat, meat offal or Kg. 5,571 6,516,819 China P. R. 750 89,187 Saudi Arabia 4,554 6,377,194 Thailand 8 11,306 U.S.A. 259 39,132
425 16024100 Hams and cuts of swine Kg. 220 52,165 Korea R 2 6,222 Denmark 218 45,943
426 16024200 Shoulders and cuts thereof, of swine Kg. 163 34,394 Denmark 163 34,394
427 16024900 Prepared or preserved meat, meat offal or Kg. 11,911 1,674,783 China P. R. 8,507 936,259 Thailand 4 4,533 Denmark 3,379 726,320 U.K. 21 7,671
428 16029000 Prepared or preserved meat, meat offal or Kg. 14,738 1,531,104 China P. R. 14,738 1,531,104
429 16030000 Extract and juices of meat, fish or Kg. 2,610 354,239 China P. R. 1,710 295,951 India 900 58,288
430 16041100 Salmon Kg. 75 15,364 U.S.A. 75 15,364
431 16041300 Sardines, sardinella and brisling or sprats Kg. 117,190 27,254,667
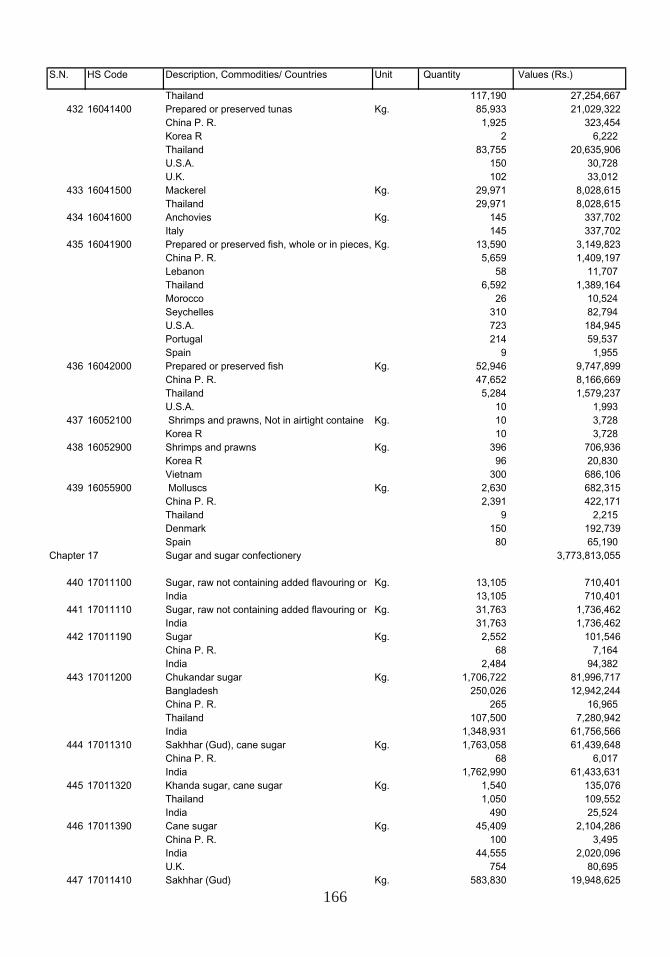
166
S.N. HS Code Description, Commodities/ Countries Unit Quantity Values (Rs.)
Thailand 117,190 27,254,667 432 16041400 Prepared or preserved tunas Kg. 85,933 21,029,322
China P. R. 1,925 323,454 Korea R 2 6,222 Thailand 83,755 20,635,906 U.S.A. 150 30,728 U.K. 102 33,012
433 16041500 Mackerel Kg. 29,971 8,028,615 Thailand 29,971 8,028,615
434 16041600 Anchovies Kg. 145 337,702 Italy 145 337,702
435 16041900 Prepared or preserved fish, whole or in pieces, Kg. 13,590 3,149,823 China P. R. 5,659 1,409,197 Lebanon 58 11,707 Thailand 6,592 1,389,164 Morocco 26 10,524 Seychelles 310 82,794 U.S.A. 723 184,945 Portugal 214 59,537 Spain 9 1,955
436 16042000 Prepared or preserved fish Kg. 52,946 9,747,899 China P. R. 47,652 8,166,669 Thailand 5,284 1,579,237 U.S.A. 10 1,993
437 16052100 Shrimps and prawns, Not in airtight containe Kg. 10 3,728 Korea R 10 3,728
438 16052900 Shrimps and prawns Kg. 396 706,936 Korea R 96 20,830 Vietnam 300 686,106
439 16055900 Molluscs Kg. 2,630 682,315 China P. R. 2,391 422,171 Thailand 9 2,215 Denmark 150 192,739 Spain 80 65,190
Chapter 17 Sugar and sugar confectionery 3,773,813,055
440 17011100 Sugar, raw not containing added flavouring or Kg. 13,105 710,401 India 13,105 710,401
441 17011110 Sugar, raw not containing added flavouring or Kg. 31,763 1,736,462 India 31,763 1,736,462
442 17011190 Sugar Kg. 2,552 101,546 China P. R. 68 7,164 India 2,484 94,382
443 17011200 Chukandar sugar Kg. 1,706,722 81,996,717 Bangladesh 250,026 12,942,244 China P. R. 265 16,965 Thailand 107,500 7,280,942 India 1,348,931 61,756,566
444 17011310 Sakhhar (Gud), cane sugar Kg. 1,763,058 61,439,648 China P. R. 68 6,017 India 1,762,990 61,433,631
445 17011320 Khanda sugar, cane sugar Kg. 1,540 135,076 Thailand 1,050 109,552 India 490 25,524
446 17011390 Cane sugar Kg. 45,409 2,104,286 China P. R. 100 3,495 India 44,555 2,020,096 U.K. 754 80,695
447 17011410 Sakhhar (Gud) Kg. 583,830 19,948,625
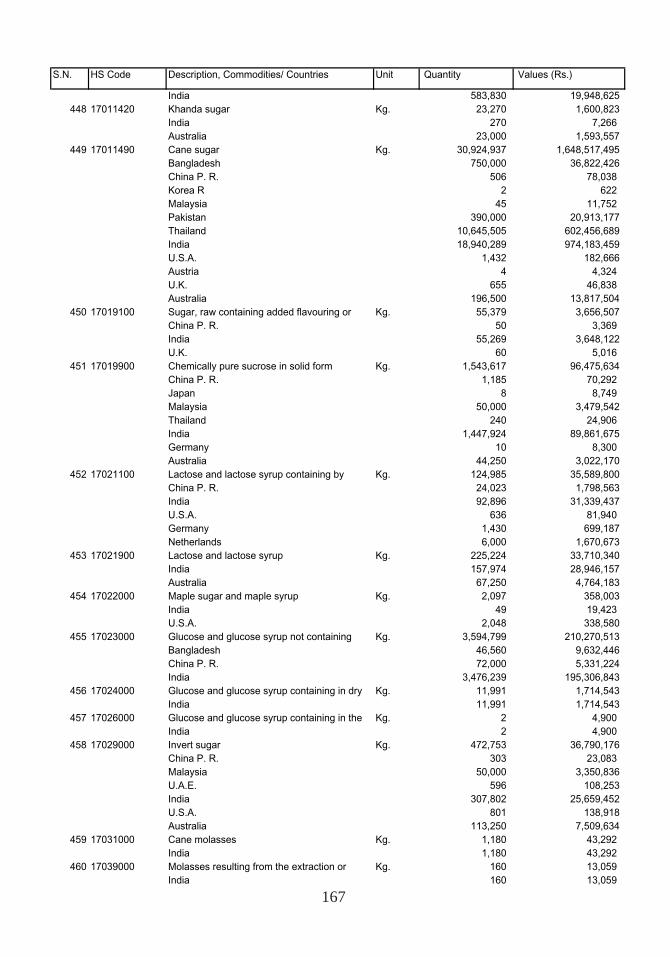
167
S.N. HS Code Description, Commodities/ Countries Unit Quantity Values (Rs.)
India 583,830 19,948,625 448 17011420 Khanda sugar Kg. 23,270 1,600,823
India 270 7,266 Australia 23,000 1,593,557
449 17011490 Cane sugar Kg. 30,924,937 1,648,517,495 Bangladesh 750,000 36,822,426 China P. R. 506 78,038 Korea R 2 622 Malaysia 45 11,752 Pakistan 390,000 20,913,177 Thailand 10,645,505 602,456,689 India 18,940,289 974,183,459 U.S.A. 1,432 182,666 Austria 4 4,324 U.K. 655 46,838 Australia 196,500 13,817,504
450 17019100 Sugar, raw containing added flavouring or Kg. 55,379 3,656,507 China P. R. 50 3,369 India 55,269 3,648,122 U.K. 60 5,016
451 17019900 Chemically pure sucrose in solid form Kg. 1,543,617 96,475,634 China P. R. 1,185 70,292 Japan 8 8,749 Malaysia 50,000 3,479,542 Thailand 240 24,906 India 1,447,924 89,861,675 Germany 10 8,300 Australia 44,250 3,022,170
452 17021100 Lactose and lactose syrup containing by Kg. 124,985 35,589,800 China P. R. 24,023 1,798,563 India 92,896 31,339,437 U.S.A. 636 81,940 Germany 1,430 699,187 Netherlands 6,000 1,670,673
453 17021900 Lactose and lactose syrup Kg. 225,224 33,710,340 India 157,974 28,946,157 Australia 67,250 4,764,183
454 17022000 Maple sugar and maple syrup Kg. 2,097 358,003 India 49 19,423 U.S.A. 2,048 338,580
455 17023000 Glucose and glucose syrup not containing Kg. 3,594,799 210,270,513 Bangladesh 46,560 9,632,446 China P. R. 72,000 5,331,224 India 3,476,239 195,306,843
456 17024000 Glucose and glucose syrup containing in dry Kg. 11,991 1,714,543 India 11,991 1,714,543
457 17026000 Glucose and glucose syrup containing in the Kg. 2 4,900 India 2 4,900
458 17029000 Invert sugar Kg. 472,753 36,790,176 China P. R. 303 23,083 Malaysia 50,000 3,350,836 U.A.E. 596 108,253 India 307,802 25,659,452 U.S.A. 801 138,918 Australia 113,250 7,509,634
459 17031000 Cane molasses Kg. 1,180 43,292 India 1,180 43,292
460 17039000 Molasses resulting from the extraction or Kg. 160 13,059 India 160 13,059
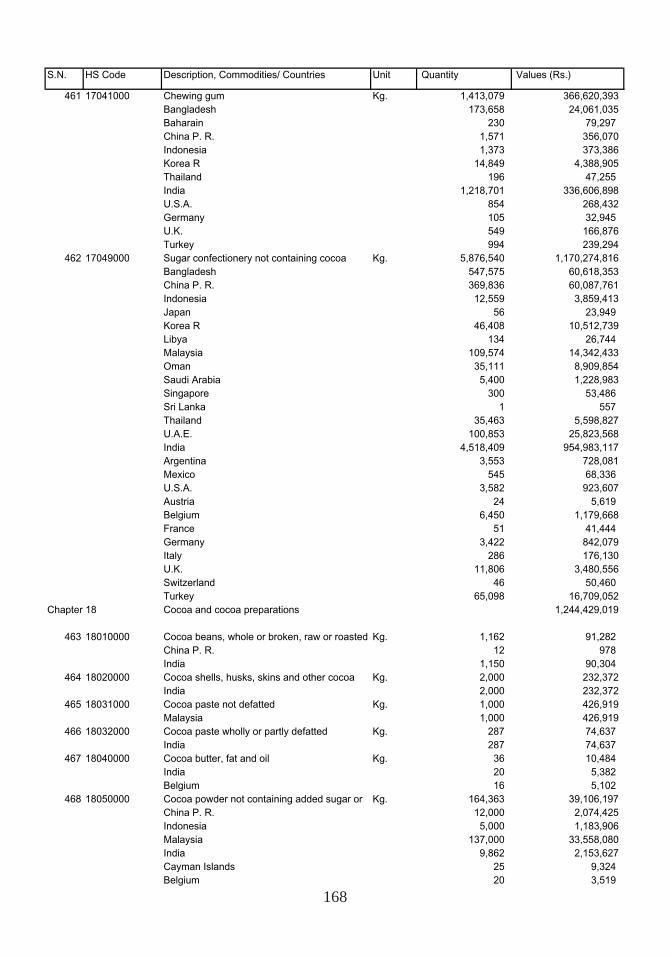
168
S.N. HS Code Description, Commodities/ Countries Unit Quantity Values (Rs.)
461 17041000 Chewing gum Kg. 1,413,079 366,620,393 Bangladesh 173,658 24,061,035 Baharain 230 79,297 China P. R. 1,571 356,070 Indonesia 1,373 373,386 Korea R 14,849 4,388,905 Thailand 196 47,255 India 1,218,701 336,606,898 U.S.A. 854 268,432 Germany 105 32,945 U.K. 549 166,876 Turkey 994 239,294
462 17049000 Sugar confectionery not containing cocoa Kg. 5,876,540 1,170,274,816 Bangladesh 547,575 60,618,353 China P. R. 369,836 60,087,761 Indonesia 12,559 3,859,413 Japan 56 23,949 Korea R 46,408 10,512,739 Libya 134 26,744 Malaysia 109,574 14,342,433 Oman 35,111 8,909,854 Saudi Arabia 5,400 1,228,983 Singapore 300 53,486 Sri Lanka 1 557 Thailand 35,463 5,598,827 U.A.E. 100,853 25,823,568 India 4,518,409 954,983,117 Argentina 3,553 728,081 Mexico 545 68,336 U.S.A. 3,582 923,607 Austria 24 5,619 Belgium 6,450 1,179,668 France 51 41,444 Germany 3,422 842,079 Italy 286 176,130 U.K. 11,806 3,480,556 Switzerland 46 50,460 Turkey 65,098 16,709,052
Chapter 18 Cocoa and cocoa preparations 1,244,429,019
463 18010000 Cocoa beans, whole or broken, raw or roasted Kg. 1,162 91,282 China P. R. 12 978 India 1,150 90,304
464 18020000 Cocoa shells, husks, skins and other cocoa Kg. 2,000 232,372 India 2,000 232,372
465 18031000 Cocoa paste not defatted Kg. 1,000 426,919 Malaysia 1,000 426,919
466 18032000 Cocoa paste wholly or partly defatted Kg. 287 74,637 India 287 74,637
467 18040000 Cocoa butter, fat and oil Kg. 36 10,484 India 20 5,382 Belgium 16 5,102
468 18050000 Cocoa powder not containing added sugar or Kg. 164,363 39,106,197 China P. R. 12,000 2,074,425 Indonesia 5,000 1,183,906 Malaysia 137,000 33,558,080 India 9,862 2,153,627 Cayman Islands 25 9,324 Belgium 20 3,519
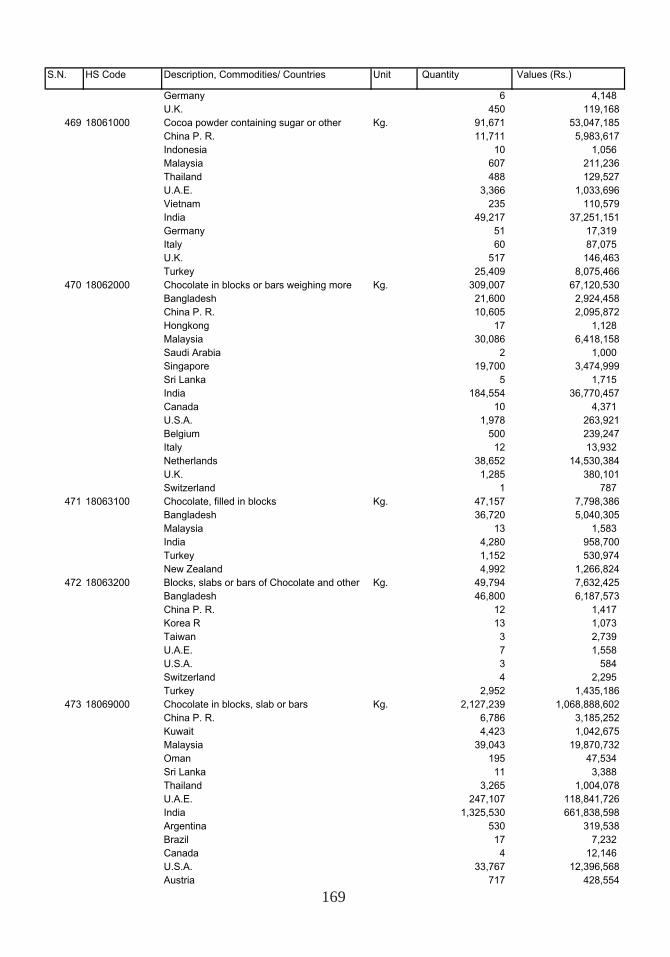
169
S.N. HS Code Description, Commodities/ Countries Unit Quantity Values (Rs.)
Germany 6 4,148 U.K. 450 119,168
469 18061000 Cocoa powder containing sugar or other Kg. 91,671 53,047,185 China P. R. 11,711 5,983,617 Indonesia 10 1,056 Malaysia 607 211,236 Thailand 488 129,527 U.A.E. 3,366 1,033,696 Vietnam 235 110,579 India 49,217 37,251,151 Germany 51 17,319 Italy 60 87,075 U.K. 517 146,463 Turkey 25,409 8,075,466
470 18062000 Chocolate in blocks or bars weighing more Kg. 309,007 67,120,530 Bangladesh 21,600 2,924,458 China P. R. 10,605 2,095,872 Hongkong 17 1,128 Malaysia 30,086 6,418,158 Saudi Arabia 2 1,000 Singapore 19,700 3,474,999 Sri Lanka 5 1,715 India 184,554 36,770,457 Canada 10 4,371 U.S.A. 1,978 263,921 Belgium 500 239,247 Italy 12 13,932 Netherlands 38,652 14,530,384 U.K. 1,285 380,101 Switzerland 1 787
471 18063100 Chocolate, filled in blocks Kg. 47,157 7,798,386 Bangladesh 36,720 5,040,305 Malaysia 13 1,583 India 4,280 958,700 Turkey 1,152 530,974 New Zealand 4,992 1,266,824
472 18063200 Blocks, slabs or bars of Chocolate and other Kg. 49,794 7,632,425 Bangladesh 46,800 6,187,573 China P. R. 12 1,417 Korea R 13 1,073 Taiwan 3 2,739 U.A.E. 7 1,558 U.S.A. 3 584 Switzerland 4 2,295 Turkey 2,952 1,435,186
473 18069000 Chocolate in blocks, slab or bars Kg. 2,127,239 1,068,888,602 China P. R. 6,786 3,185,252 Kuwait 4,423 1,042,675 Malaysia 39,043 19,870,732 Oman 195 47,534 Sri Lanka 11 3,388 Thailand 3,265 1,004,078 U.A.E. 247,107 118,841,726 India 1,325,530 661,838,598 Argentina 530 319,538 Brazil 17 7,232 Canada 4 12,146 U.S.A. 33,767 12,396,568 Austria 717 428,554
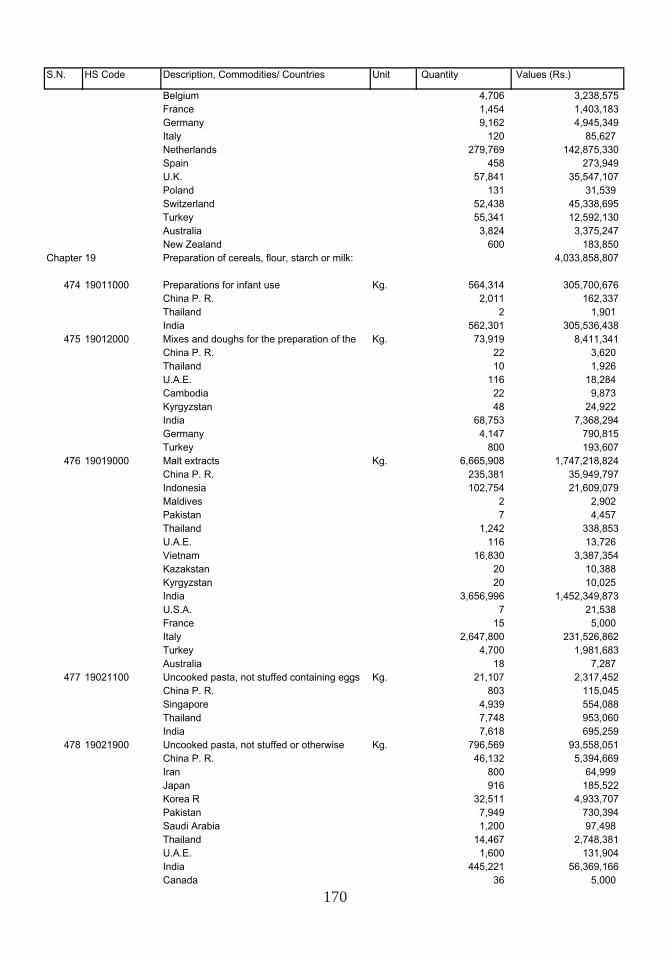
170
S.N. HS Code Description, Commodities/ Countries Unit Quantity Values (Rs.)
Belgium 4,706 3,238,575 France 1,454 1,403,183 Germany 9,162 4,945,349 Italy 120 85,627 Netherlands 279,769 142,875,330 Spain 458 273,949 U.K. 57,841 35,547,107 Poland 131 31,539 Switzerland 52,438 45,338,695 Turkey 55,341 12,592,130 Australia 3,824 3,375,247 New Zealand 600 183,850
Chapter 19 Preparation of cereals, flour, starch or milk: 4,033,858,807
474 19011000 Preparations for infant use Kg. 564,314 305,700,676 China P. R. 2,011 162,337 Thailand 2 1,901 India 562,301 305,536,438
475 19012000 Mixes and doughs for the preparation of the Kg. 73,919 8,411,341 China P. R. 22 3,620 Thailand 10 1,926 U.A.E. 116 18,284 Cambodia 22 9,873 Kyrgyzstan 48 24,922 India 68,753 7,368,294 Germany 4,147 790,815 Turkey 800 193,607
476 19019000 Malt extracts Kg. 6,665,908 1,747,218,824 China P. R. 235,381 35,949,797 Indonesia 102,754 21,609,079 Maldives 2 2,902 Pakistan 7 4,457 Thailand 1,242 338,853 U.A.E. 116 13,726 Vietnam 16,830 3,387,354 Kazakstan 20 10,388 Kyrgyzstan 20 10,025 India 3,656,996 1,452,349,873 U.S.A. 7 21,538 France 15 5,000 Italy 2,647,800 231,526,862 Turkey 4,700 1,981,683 Australia 18 7,287
477 19021100 Uncooked pasta, not stuffed containing eggs Kg. 21,107 2,317,452 China P. R. 803 115,045 Singapore 4,939 554,088 Thailand 7,748 953,060 India 7,618 695,259
478 19021900 Uncooked pasta, not stuffed or otherwise Kg. 796,569 93,558,051 China P. R. 46,132 5,394,669 Iran 800 64,999 Japan 916 185,522 Korea R 32,511 4,933,707 Pakistan 7,949 730,394 Saudi Arabia 1,200 97,498 Thailand 14,467 2,748,381 U.A.E. 1,600 131,904 India 445,221 56,369,166 Canada 36 5,000
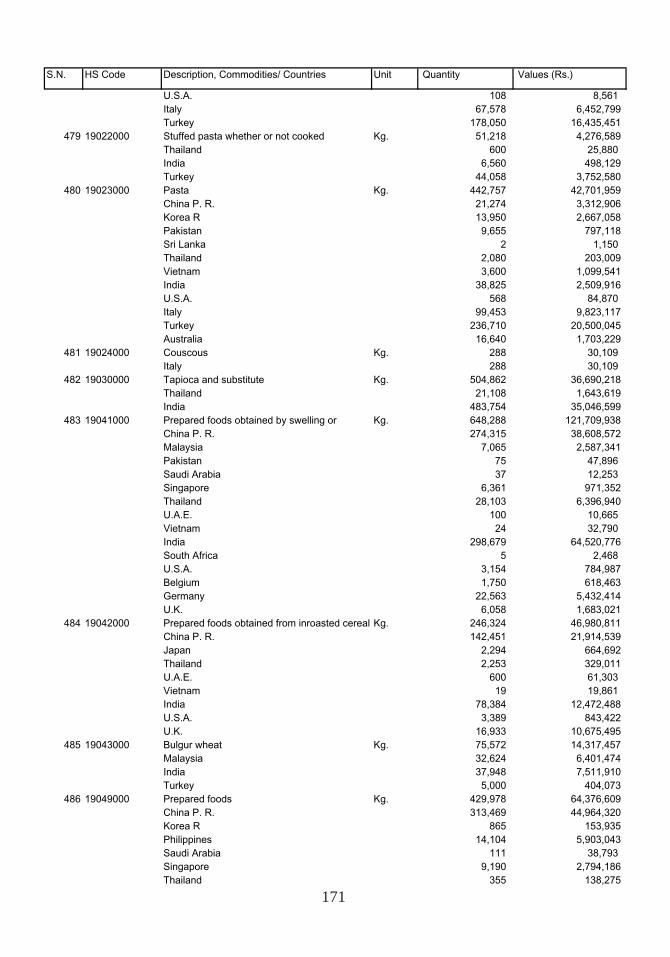
171
S.N. HS Code Description, Commodities/ Countries Unit Quantity Values (Rs.)
U.S.A. 108 8,561 Italy 67,578 6,452,799 Turkey 178,050 16,435,451
479 19022000 Stuffed pasta whether or not cooked Kg. 51,218 4,276,589 Thailand 600 25,880 India 6,560 498,129 Turkey 44,058 3,752,580
480 19023000 Pasta Kg. 442,757 42,701,959 China P. R. 21,274 3,312,906 Korea R 13,950 2,667,058 Pakistan 9,655 797,118 Sri Lanka 2 1,150 Thailand 2,080 203,009 Vietnam 3,600 1,099,541 India 38,825 2,509,916 U.S.A. 568 84,870 Italy 99,453 9,823,117 Turkey 236,710 20,500,045 Australia 16,640 1,703,229
481 19024000 Couscous Kg. 288 30,109 Italy 288 30,109
482 19030000 Tapioca and substitute Kg. 504,862 36,690,218 Thailand 21,108 1,643,619 India 483,754 35,046,599
483 19041000 Prepared foods obtained by swelling or Kg. 648,288 121,709,938 China P. R. 274,315 38,608,572 Malaysia 7,065 2,587,341 Pakistan 75 47,896 Saudi Arabia 37 12,253 Singapore 6,361 971,352 Thailand 28,103 6,396,940 U.A.E. 100 10,665 Vietnam 24 32,790 India 298,679 64,520,776 South Africa 5 2,468 U.S.A. 3,154 784,987 Belgium 1,750 618,463 Germany 22,563 5,432,414 U.K. 6,058 1,683,021
484 19042000 Prepared foods obtained from inroasted cereal Kg. 246,324 46,980,811 China P. R. 142,451 21,914,539 Japan 2,294 664,692 Thailand 2,253 329,011 U.A.E. 600 61,303 Vietnam 19 19,861 India 78,384 12,472,488 U.S.A. 3,389 843,422 U.K. 16,933 10,675,495
485 19043000 Bulgur wheat Kg. 75,572 14,317,457 Malaysia 32,624 6,401,474 India 37,948 7,511,910 Turkey 5,000 404,073
486 19049000 Prepared foods Kg. 429,978 64,376,609 China P. R. 313,469 44,964,320 Korea R 865 153,935 Philippines 14,104 5,903,043 Saudi Arabia 111 38,793 Singapore 9,190 2,794,186 Thailand 355 138,275
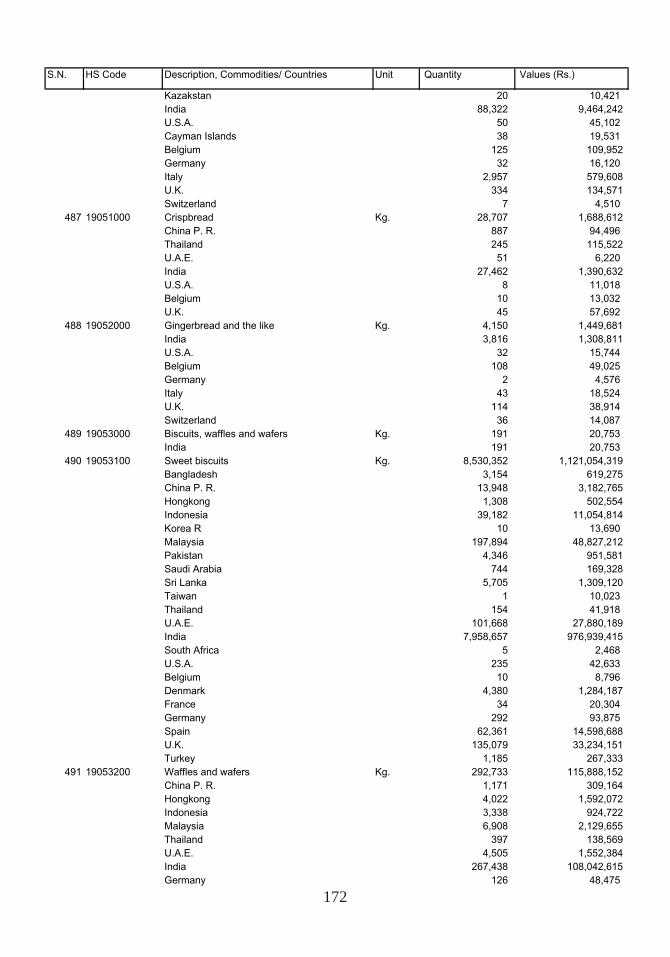
172
S.N. HS Code Description, Commodities/ Countries Unit Quantity Values (Rs.)
Kazakstan 20 10,421 India 88,322 9,464,242 U.S.A. 50 45,102 Cayman Islands 38 19,531 Belgium 125 109,952 Germany 32 16,120 Italy 2,957 579,608 U.K. 334 134,571 Switzerland 7 4,510
487 19051000 Crispbread Kg. 28,707 1,688,612 China P. R. 887 94,496 Thailand 245 115,522 U.A.E. 51 6,220 India 27,462 1,390,632 U.S.A. 8 11,018 Belgium 10 13,032 U.K. 45 57,692
488 19052000 Gingerbread and the like Kg. 4,150 1,449,681 India 3,816 1,308,811 U.S.A. 32 15,744 Belgium 108 49,025 Germany 2 4,576 Italy 43 18,524 U.K. 114 38,914 Switzerland 36 14,087
489 19053000 Biscuits, waffles and wafers Kg. 191 20,753 India 191 20,753
490 19053100 Sweet biscuits Kg. 8,530,352 1,121,054,319 Bangladesh 3,154 619,275 China P. R. 13,948 3,182,765 Hongkong 1,308 502,554 Indonesia 39,182 11,054,814 Korea R 10 13,690 Malaysia 197,894 48,827,212 Pakistan 4,346 951,581 Saudi Arabia 744 169,328 Sri Lanka 5,705 1,309,120 Taiwan 1 10,023 Thailand 154 41,918 U.A.E. 101,668 27,880,189 India 7,958,657 976,939,415 South Africa 5 2,468 U.S.A. 235 42,633 Belgium 10 8,796 Denmark 4,380 1,284,187 France 34 20,304 Germany 292 93,875 Spain 62,361 14,598,688 U.K. 135,079 33,234,151 Turkey 1,185 267,333
491 19053200 Waffles and wafers Kg. 292,733 115,888,152 China P. R. 1,171 309,164 Hongkong 4,022 1,592,072 Indonesia 3,338 924,722 Malaysia 6,908 2,129,655 Thailand 397 138,569 U.A.E. 4,505 1,552,384 India 267,438 108,042,615 Germany 126 48,475
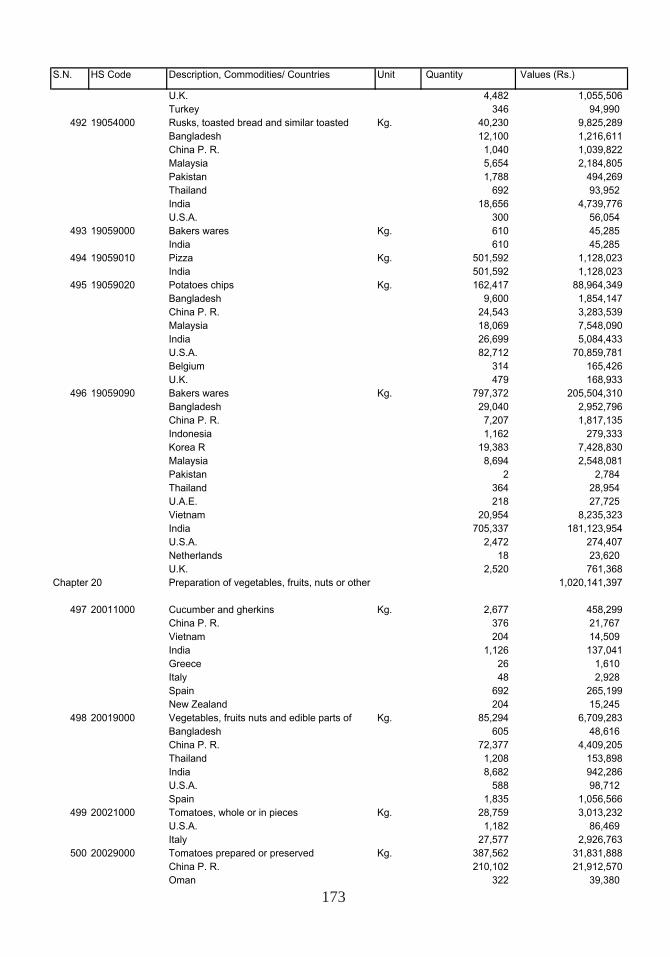
173
S.N. HS Code Description, Commodities/ Countries Unit Quantity Values (Rs.)
U.K. 4,482 1,055,506 Turkey 346 94,990
492 19054000 Rusks, toasted bread and similar toasted Kg. 40,230 9,825,289 Bangladesh 12,100 1,216,611 China P. R. 1,040 1,039,822 Malaysia 5,654 2,184,805 Pakistan 1,788 494,269 Thailand 692 93,952 India 18,656 4,739,776 U.S.A. 300 56,054
493 19059000 Bakers wares Kg. 610 45,285 India 610 45,285
494 19059010 Pizza Kg. 501,592 1,128,023 India 501,592 1,128,023
495 19059020 Potatoes chips Kg. 162,417 88,964,349 Bangladesh 9,600 1,854,147 China P. R. 24,543 3,283,539 Malaysia 18,069 7,548,090 India 26,699 5,084,433 U.S.A. 82,712 70,859,781 Belgium 314 165,426 U.K. 479 168,933
496 19059090 Bakers wares Kg. 797,372 205,504,310 Bangladesh 29,040 2,952,796 China P. R. 7,207 1,817,135 Indonesia 1,162 279,333 Korea R 19,383 7,428,830 Malaysia 8,694 2,548,081 Pakistan 2 2,784 Thailand 364 28,954 U.A.E. 218 27,725 Vietnam 20,954 8,235,323 India 705,337 181,123,954 U.S.A. 2,472 274,407 Netherlands 18 23,620 U.K. 2,520 761,368
Chapter 20 Preparation of vegetables, fruits, nuts or other 1,020,141,397
497 20011000 Cucumber and gherkins Kg. 2,677 458,299 China P. R. 376 21,767 Vietnam 204 14,509 India 1,126 137,041 Greece 26 1,610 Italy 48 2,928 Spain 692 265,199 New Zealand 204 15,245
498 20019000 Vegetables, fruits nuts and edible parts of Kg. 85,294 6,709,283 Bangladesh 605 48,616 China P. R. 72,377 4,409,205 Thailand 1,208 153,898 India 8,682 942,286 U.S.A. 588 98,712 Spain 1,835 1,056,566
499 20021000 Tomatoes, whole or in pieces Kg. 28,759 3,013,232 U.S.A. 1,182 86,469 Italy 27,577 2,926,763
500 20029000 Tomatoes prepared or preserved Kg. 387,562 31,831,888 China P. R. 210,102 21,912,570 Oman 322 39,380
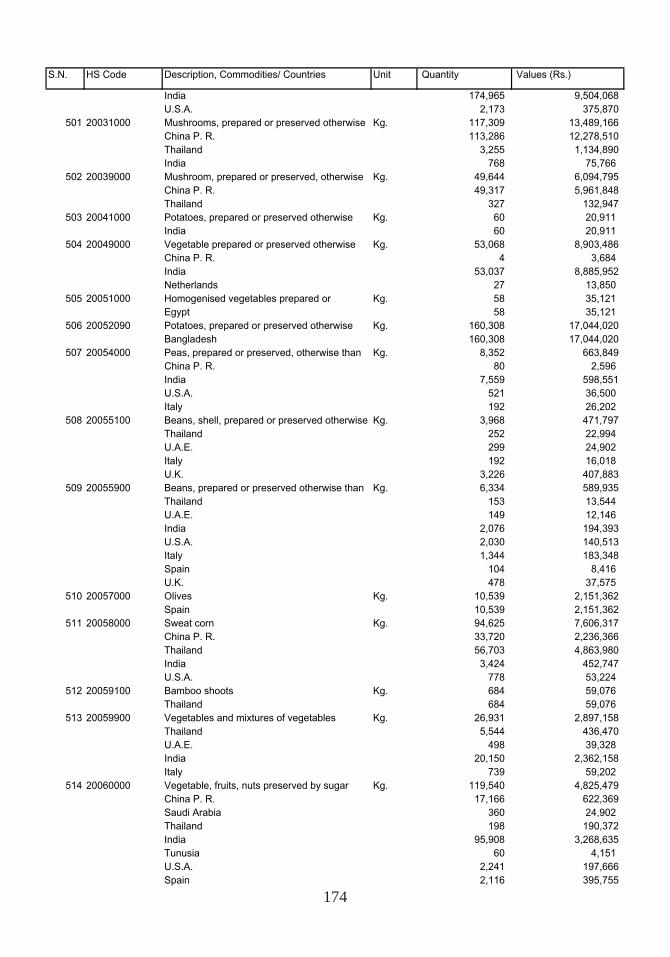
174
S.N. HS Code Description, Commodities/ Countries Unit Quantity Values (Rs.)
India 174,965 9,504,068 U.S.A. 2,173 375,870
501 20031000 Mushrooms, prepared or preserved otherwise Kg. 117,309 13,489,166 China P. R. 113,286 12,278,510 Thailand 3,255 1,134,890 India 768 75,766
502 20039000 Mushroom, prepared or preserved, otherwise Kg. 49,644 6,094,795 China P. R. 49,317 5,961,848 Thailand 327 132,947
503 20041000 Potatoes, prepared or preserved otherwise Kg. 60 20,911 India 60 20,911
504 20049000 Vegetable prepared or preserved otherwise Kg. 53,068 8,903,486 China P. R. 4 3,684 India 53,037 8,885,952 Netherlands 27 13,850
505 20051000 Homogenised vegetables prepared or Kg. 58 35,121 Egypt 58 35,121
506 20052090 Potatoes, prepared or preserved otherwise Kg. 160,308 17,044,020 Bangladesh 160,308 17,044,020
507 20054000 Peas, prepared or preserved, otherwise than Kg. 8,352 663,849 China P. R. 80 2,596 India 7,559 598,551 U.S.A. 521 36,500 Italy 192 26,202
508 20055100 Beans, shell, prepared or preserved otherwise Kg. 3,968 471,797 Thailand 252 22,994 U.A.E. 299 24,902 Italy 192 16,018 U.K. 3,226 407,883
509 20055900 Beans, prepared or preserved otherwise than Kg. 6,334 589,935 Thailand 153 13,544 U.A.E. 149 12,146 India 2,076 194,393 U.S.A. 2,030 140,513 Italy 1,344 183,348 Spain 104 8,416 U.K. 478 37,575
510 20057000 Olives Kg. 10,539 2,151,362 Spain 10,539 2,151,362
511 20058000 Sweat corn Kg. 94,625 7,606,317 China P. R. 33,720 2,236,366 Thailand 56,703 4,863,980 India 3,424 452,747 U.S.A. 778 53,224
512 20059100 Bamboo shoots Kg. 684 59,076 Thailand 684 59,076
513 20059900 Vegetables and mixtures of vegetables Kg. 26,931 2,897,158 Thailand 5,544 436,470 U.A.E. 498 39,328 India 20,150 2,362,158 Italy 739 59,202
514 20060000 Vegetable, fruits, nuts preserved by sugar Kg. 119,540 4,825,479 China P. R. 17,166 622,369 Saudi Arabia 360 24,902 Thailand 198 190,372 India 95,908 3,268,635 Tunusia 60 4,151 U.S.A. 2,241 197,666 Spain 2,116 395,755
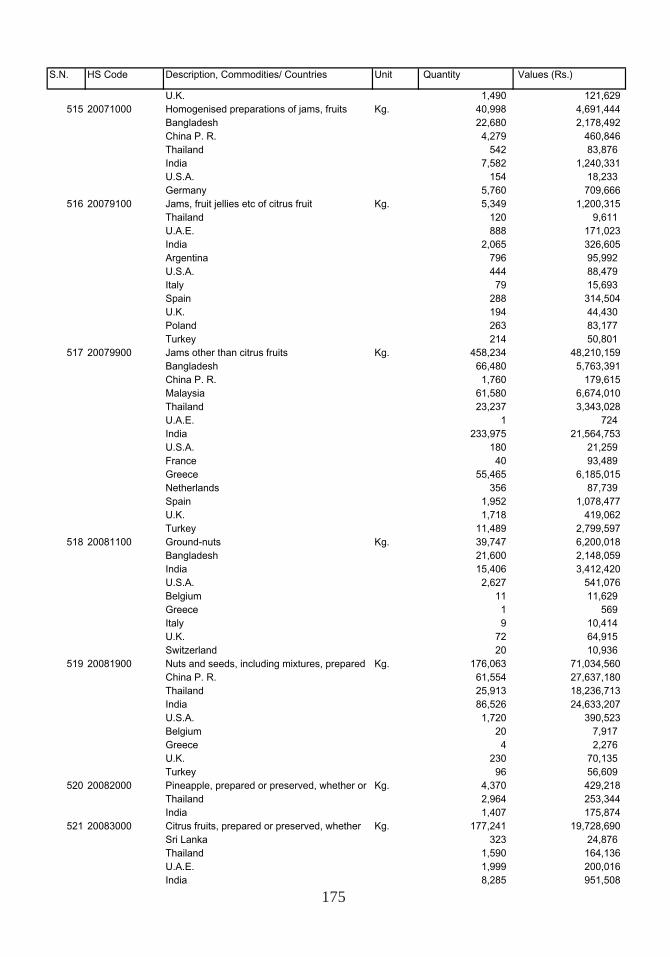
175
S.N. HS Code Description, Commodities/ Countries Unit Quantity Values (Rs.)
U.K. 1,490 121,629 515 20071000 Homogenised preparations of jams, fruits Kg. 40,998 4,691,444
Bangladesh 22,680 2,178,492 China P. R. 4,279 460,846 Thailand 542 83,876 India 7,582 1,240,331 U.S.A. 154 18,233 Germany 5,760 709,666
516 20079100 Jams, fruit jellies etc of citrus fruit Kg. 5,349 1,200,315 Thailand 120 9,611 U.A.E. 888 171,023 India 2,065 326,605 Argentina 796 95,992 U.S.A. 444 88,479 Italy 79 15,693 Spain 288 314,504 U.K. 194 44,430 Poland 263 83,177 Turkey 214 50,801
517 20079900 Jams other than citrus fruits Kg. 458,234 48,210,159 Bangladesh 66,480 5,763,391 China P. R. 1,760 179,615 Malaysia 61,580 6,674,010 Thailand 23,237 3,343,028 U.A.E. 1 724 India 233,975 21,564,753 U.S.A. 180 21,259 France 40 93,489 Greece 55,465 6,185,015 Netherlands 356 87,739 Spain 1,952 1,078,477 U.K. 1,718 419,062 Turkey 11,489 2,799,597
518 20081100 Ground-nuts Kg. 39,747 6,200,018 Bangladesh 21,600 2,148,059 India 15,406 3,412,420 U.S.A. 2,627 541,076 Belgium 11 11,629 Greece 1 569 Italy 9 10,414 U.K. 72 64,915 Switzerland 20 10,936
519 20081900 Nuts and seeds, including mixtures, prepared Kg. 176,063 71,034,560 China P. R. 61,554 27,637,180 Thailand 25,913 18,236,713 India 86,526 24,633,207 U.S.A. 1,720 390,523 Belgium 20 7,917 Greece 4 2,276 U.K. 230 70,135 Turkey 96 56,609
520 20082000 Pineapple, prepared or preserved, whether or Kg. 4,370 429,218 Thailand 2,964 253,344 India 1,407 175,874
521 20083000 Citrus fruits, prepared or preserved, whether Kg. 177,241 19,728,690 Sri Lanka 323 24,876 Thailand 1,590 164,136 U.A.E. 1,999 200,016 India 8,285 951,508
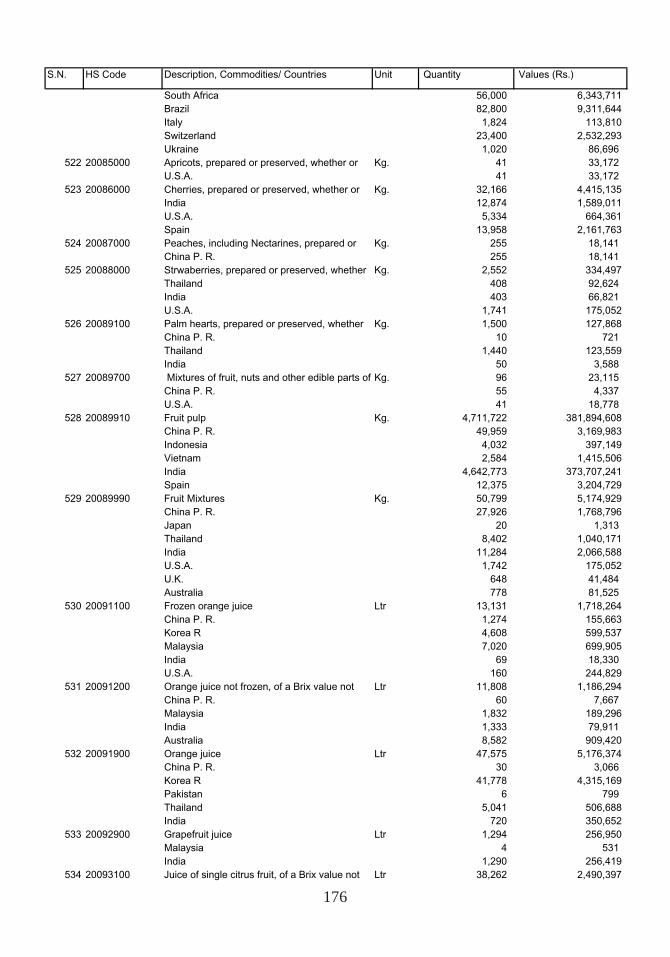
176
S.N. HS Code Description, Commodities/ Countries Unit Quantity Values (Rs.)
South Africa 56,000 6,343,711 Brazil 82,800 9,311,644 Italy 1,824 113,810 Switzerland 23,400 2,532,293 Ukraine 1,020 86,696
522 20085000 Apricots, prepared or preserved, whether or Kg. 41 33,172 U.S.A. 41 33,172
523 20086000 Cherries, prepared or preserved, whether or Kg. 32,166 4,415,135 India 12,874 1,589,011 U.S.A. 5,334 664,361 Spain 13,958 2,161,763
524 20087000 Peaches, including Nectarines, prepared or Kg. 255 18,141 China P. R. 255 18,141
525 20088000 Strwaberries, prepared or preserved, whether Kg. 2,552 334,497 Thailand 408 92,624 India 403 66,821 U.S.A. 1,741 175,052
526 20089100 Palm hearts, prepared or preserved, whether Kg. 1,500 127,868 China P. R. 10 721 Thailand 1,440 123,559 India 50 3,588
527 20089700 Mixtures of fruit, nuts and other edible parts of Kg. 96 23,115 China P. R. 55 4,337 U.S.A. 41 18,778
528 20089910 Fruit pulp Kg. 4,711,722 381,894,608 China P. R. 49,959 3,169,983 Indonesia 4,032 397,149 Vietnam 2,584 1,415,506 India 4,642,773 373,707,241 Spain 12,375 3,204,729
529 20089990 Fruit Mixtures Kg. 50,799 5,174,929 China P. R. 27,926 1,768,796 Japan 20 1,313 Thailand 8,402 1,040,171 India 11,284 2,066,588 U.S.A. 1,742 175,052 U.K. 648 41,484 Australia 778 81,525
530 20091100 Frozen orange juice Ltr 13,131 1,718,264 China P. R. 1,274 155,663 Korea R 4,608 599,537 Malaysia 7,020 699,905 India 69 18,330 U.S.A. 160 244,829
531 20091200 Orange juice not frozen, of a Brix value not Ltr 11,808 1,186,294 China P. R. 60 7,667 Malaysia 1,832 189,296 India 1,333 79,911 Australia 8,582 909,420
532 20091900 Orange juice Ltr 47,575 5,176,374 China P. R. 30 3,066 Korea R 41,778 4,315,169 Pakistan 6 799 Thailand 5,041 506,688 India 720 350,652
533 20092900 Grapefruit juice Ltr 1,294 256,950 Malaysia 4 531 India 1,290 256,419
534 20093100 Juice of single citrus fruit, of a Brix value not Ltr 38,262 2,490,397
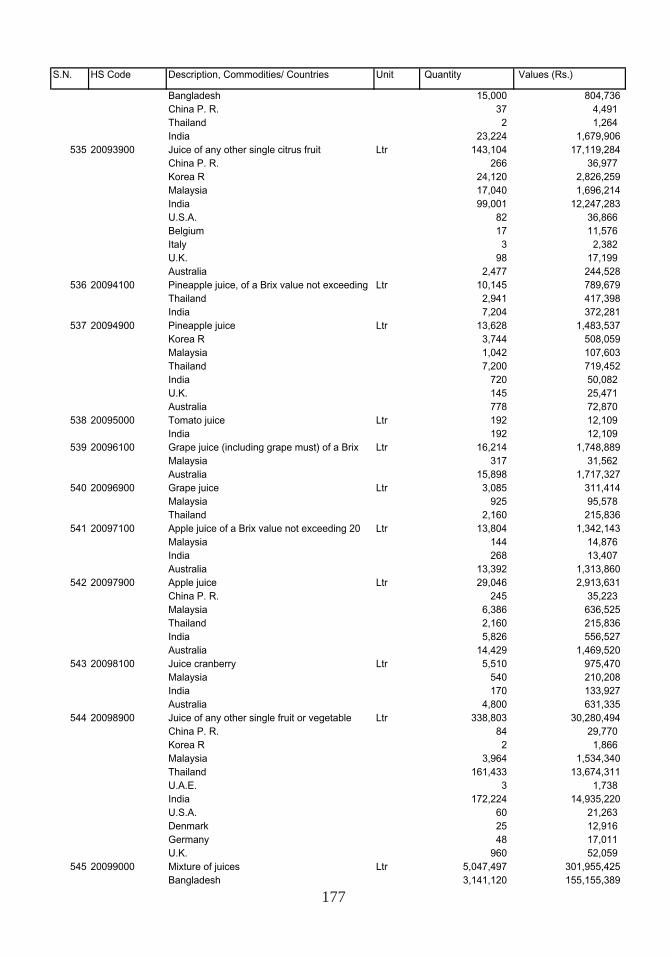
177
S.N. HS Code Description, Commodities/ Countries Unit Quantity Values (Rs.)
Bangladesh 15,000 804,736 China P. R. 37 4,491 Thailand 2 1,264 India 23,224 1,679,906
535 20093900 Juice of any other single citrus fruit Ltr 143,104 17,119,284 China P. R. 266 36,977 Korea R 24,120 2,826,259 Malaysia 17,040 1,696,214 India 99,001 12,247,283 U.S.A. 82 36,866 Belgium 17 11,576 Italy 3 2,382 U.K. 98 17,199 Australia 2,477 244,528
536 20094100 Pineapple juice, of a Brix value not exceeding Ltr 10,145 789,679 Thailand 2,941 417,398 India 7,204 372,281
537 20094900 Pineapple juice Ltr 13,628 1,483,537 Korea R 3,744 508,059 Malaysia 1,042 107,603 Thailand 7,200 719,452 India 720 50,082 U.K. 145 25,471 Australia 778 72,870
538 20095000 Tomato juice Ltr 192 12,109 India 192 12,109
539 20096100 Grape juice (including grape must) of a Brix Ltr 16,214 1,748,889 Malaysia 317 31,562 Australia 15,898 1,717,327
540 20096900 Grape juice Ltr 3,085 311,414 Malaysia 925 95,578 Thailand 2,160 215,836
541 20097100 Apple juice of a Brix value not exceeding 20 Ltr 13,804 1,342,143 Malaysia 144 14,876 India 268 13,407 Australia 13,392 1,313,860
542 20097900 Apple juice Ltr 29,046 2,913,631 China P. R. 245 35,223 Malaysia 6,386 636,525 Thailand 2,160 215,836 India 5,826 556,527 Australia 14,429 1,469,520
543 20098100 Juice cranberry Ltr 5,510 975,470 Malaysia 540 210,208 India 170 133,927 Australia 4,800 631,335
544 20098900 Juice of any other single fruit or vegetable Ltr 338,803 30,280,494 China P. R. 84 29,770 Korea R 2 1,866 Malaysia 3,964 1,534,340 Thailand 161,433 13,674,311 U.A.E. 3 1,738 India 172,224 14,935,220 U.S.A. 60 21,263 Denmark 25 12,916 Germany 48 17,011 U.K. 960 52,059
545 20099000 Mixture of juices Ltr 5,047,497 301,955,425 Bangladesh 3,141,120 155,155,389
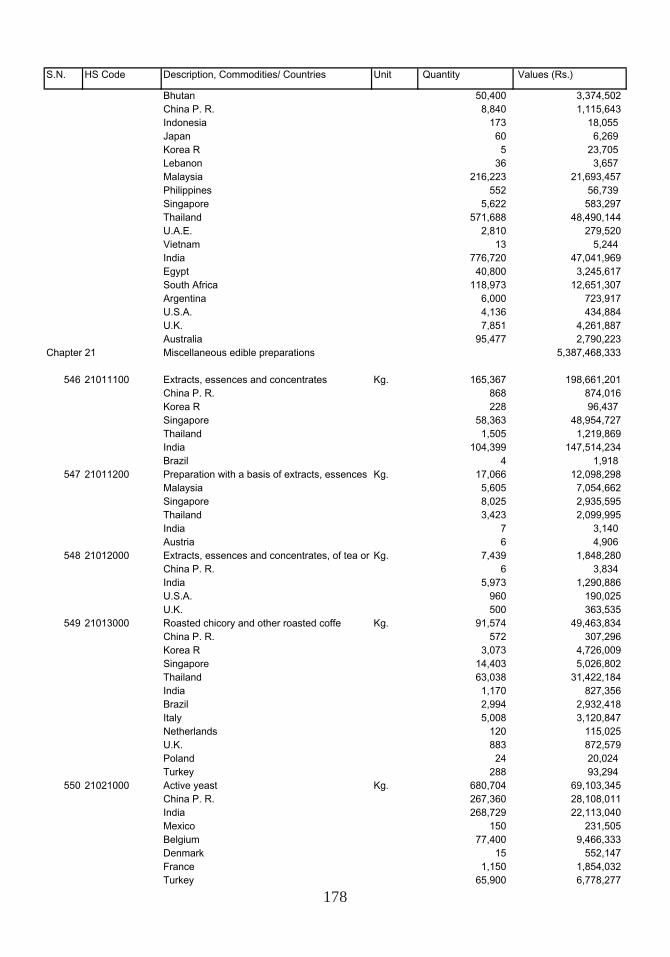
178
S.N. HS Code Description, Commodities/ Countries Unit Quantity Values (Rs.)
Bhutan 50,400 3,374,502 China P. R. 8,840 1,115,643 Indonesia 173 18,055 Japan 60 6,269 Korea R 5 23,705 Lebanon 36 3,657 Malaysia 216,223 21,693,457 Philippines 552 56,739 Singapore 5,622 583,297 Thailand 571,688 48,490,144 U.A.E. 2,810 279,520 Vietnam 13 5,244 India 776,720 47,041,969 Egypt 40,800 3,245,617 South Africa 118,973 12,651,307 Argentina 6,000 723,917 U.S.A. 4,136 434,884 U.K. 7,851 4,261,887 Australia 95,477 2,790,223
Chapter 21 Miscellaneous edible preparations 5,387,468,333
546 21011100 Extracts, essences and concentrates Kg. 165,367 198,661,201 China P. R. 868 874,016 Korea R 228 96,437 Singapore 58,363 48,954,727 Thailand 1,505 1,219,869 India 104,399 147,514,234 Brazil 4 1,918
547 21011200 Preparation with a basis of extracts, essences Kg. 17,066 12,098,298 Malaysia 5,605 7,054,662 Singapore 8,025 2,935,595 Thailand 3,423 2,099,995 India 7 3,140 Austria 6 4,906
548 21012000 Extracts, essences and concentrates, of tea or Kg. 7,439 1,848,280 China P. R. 6 3,834 India 5,973 1,290,886 U.S.A. 960 190,025 U.K. 500 363,535
549 21013000 Roasted chicory and other roasted coffe Kg. 91,574 49,463,834 China P. R. 572 307,296 Korea R 3,073 4,726,009 Singapore 14,403 5,026,802 Thailand 63,038 31,422,184 India 1,170 827,356 Brazil 2,994 2,932,418 Italy 5,008 3,120,847 Netherlands 120 115,025 U.K. 883 872,579 Poland 24 20,024 Turkey 288 93,294
550 21021000 Active yeast Kg. 680,704 69,103,345 China P. R. 267,360 28,108,011 India 268,729 22,113,040 Mexico 150 231,505 Belgium 77,400 9,466,333 Denmark 15 552,147 France 1,150 1,854,032 Turkey 65,900 6,778,277
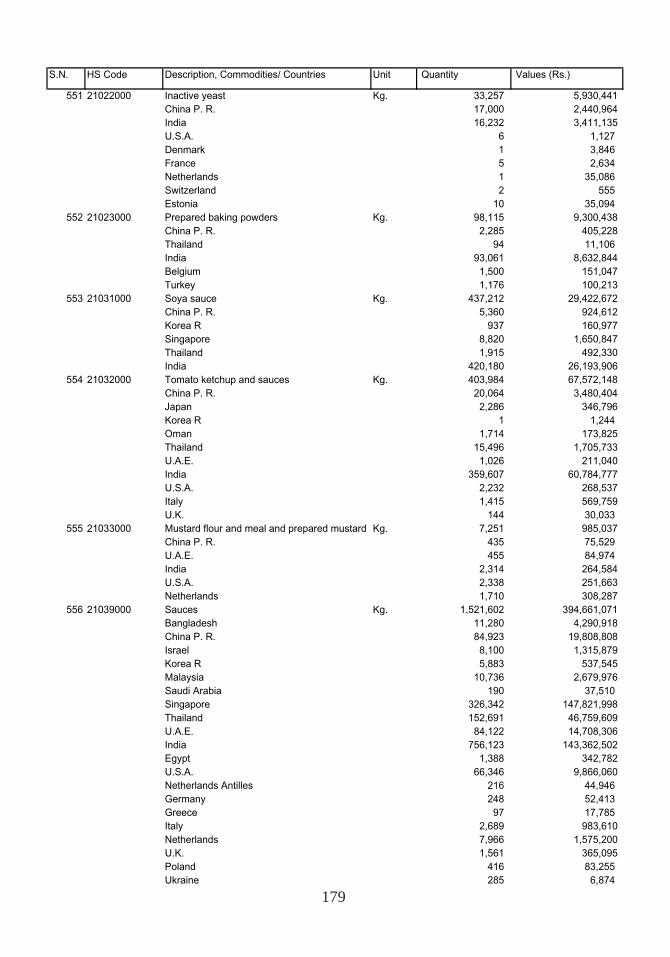
179
S.N. HS Code Description, Commodities/ Countries Unit Quantity Values (Rs.)
551 21022000 Inactive yeast Kg. 33,257 5,930,441 China P. R. 17,000 2,440,964 India 16,232 3,411,135 U.S.A. 6 1,127 Denmark 1 3,846 France 5 2,634 Netherlands 1 35,086 Switzerland 2 555 Estonia 10 35,094
552 21023000 Prepared baking powders Kg. 98,115 9,300,438 China P. R. 2,285 405,228 Thailand 94 11,106 India 93,061 8,632,844 Belgium 1,500 151,047 Turkey 1,176 100,213
553 21031000 Soya sauce Kg. 437,212 29,422,672 China P. R. 5,360 924,612 Korea R 937 160,977 Singapore 8,820 1,650,847 Thailand 1,915 492,330 India 420,180 26,193,906
554 21032000 Tomato ketchup and sauces Kg. 403,984 67,572,148 China P. R. 20,064 3,480,404 Japan 2,286 346,796 Korea R 1 1,244 Oman 1,714 173,825 Thailand 15,496 1,705,733 U.A.E. 1,026 211,040 India 359,607 60,784,777 U.S.A. 2,232 268,537 Italy 1,415 569,759 U.K. 144 30,033
555 21033000 Mustard flour and meal and prepared mustard Kg. 7,251 985,037 China P. R. 435 75,529 U.A.E. 455 84,974 India 2,314 264,584 U.S.A. 2,338 251,663 Netherlands 1,710 308,287
556 21039000 Sauces Kg. 1,521,602 394,661,071 Bangladesh 11,280 4,290,918 China P. R. 84,923 19,808,808 Israel 8,100 1,315,879 Korea R 5,883 537,545 Malaysia 10,736 2,679,976 Saudi Arabia 190 37,510 Singapore 326,342 147,821,998 Thailand 152,691 46,759,609 U.A.E. 84,122 14,708,306 India 756,123 143,362,502 Egypt 1,388 342,782 U.S.A. 66,346 9,866,060 Netherlands Antilles 216 44,946 Germany 248 52,413 Greece 97 17,785 Italy 2,689 983,610 Netherlands 7,966 1,575,200 U.K. 1,561 365,095 Poland 416 83,255 Ukraine 285 6,874
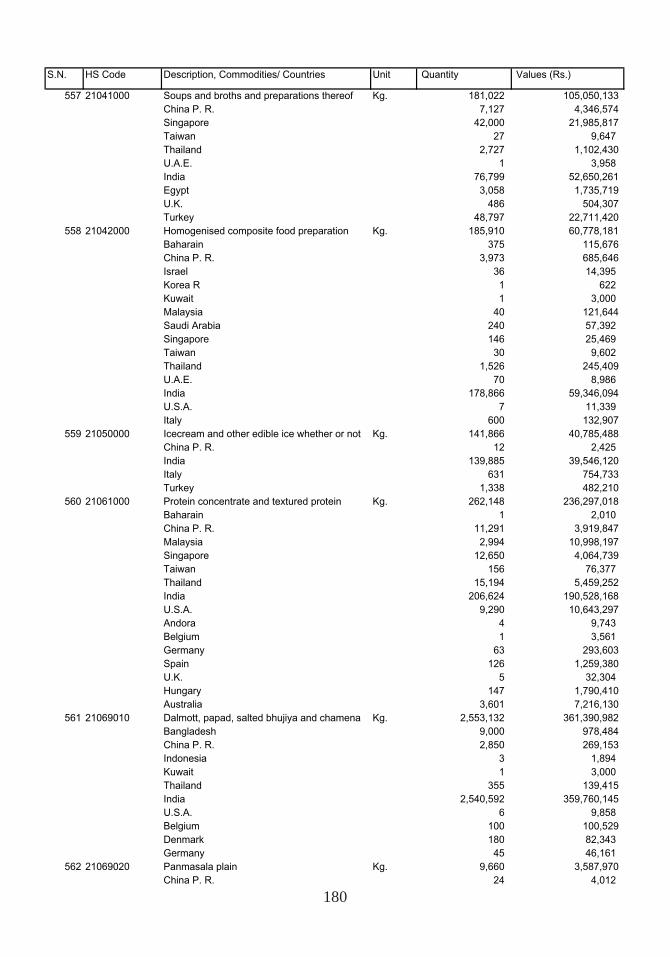
180
S.N. HS Code Description, Commodities/ Countries Unit Quantity Values (Rs.)
557 21041000 Soups and broths and preparations thereof Kg. 181,022 105,050,133 China P. R. 7,127 4,346,574 Singapore 42,000 21,985,817 Taiwan 27 9,647 Thailand 2,727 1,102,430 U.A.E. 1 3,958 India 76,799 52,650,261 Egypt 3,058 1,735,719 U.K. 486 504,307 Turkey 48,797 22,711,420
558 21042000 Homogenised composite food preparation Kg. 185,910 60,778,181 Baharain 375 115,676 China P. R. 3,973 685,646 Israel 36 14,395 Korea R 1 622 Kuwait 1 3,000 Malaysia 40 121,644 Saudi Arabia 240 57,392 Singapore 146 25,469 Taiwan 30 9,602 Thailand 1,526 245,409 U.A.E. 70 8,986 India 178,866 59,346,094 U.S.A. 7 11,339 Italy 600 132,907
559 21050000 Icecream and other edible ice whether or not Kg. 141,866 40,785,488 China P. R. 12 2,425 India 139,885 39,546,120 Italy 631 754,733 Turkey 1,338 482,210
560 21061000 Protein concentrate and textured protein Kg. 262,148 236,297,018 Baharain 1 2,010 China P. R. 11,291 3,919,847 Malaysia 2,994 10,998,197 Singapore 12,650 4,064,739 Taiwan 156 76,377 Thailand 15,194 5,459,252 India 206,624 190,528,168 U.S.A. 9,290 10,643,297 Andora 4 9,743 Belgium 1 3,561 Germany 63 293,603 Spain 126 1,259,380 U.K. 5 32,304 Hungary 147 1,790,410 Australia 3,601 7,216,130
561 21069010 Dalmott, papad, salted bhujiya and chamena Kg. 2,553,132 361,390,982 Bangladesh 9,000 978,484 China P. R. 2,850 269,153 Indonesia 3 1,894 Kuwait 1 3,000 Thailand 355 139,415 India 2,540,592 359,760,145 U.S.A. 6 9,858 Belgium 100 100,529 Denmark 180 82,343 Germany 45 46,161
562 21069020 Panmasala plain Kg. 9,660 3,587,970 China P. R. 24 4,012
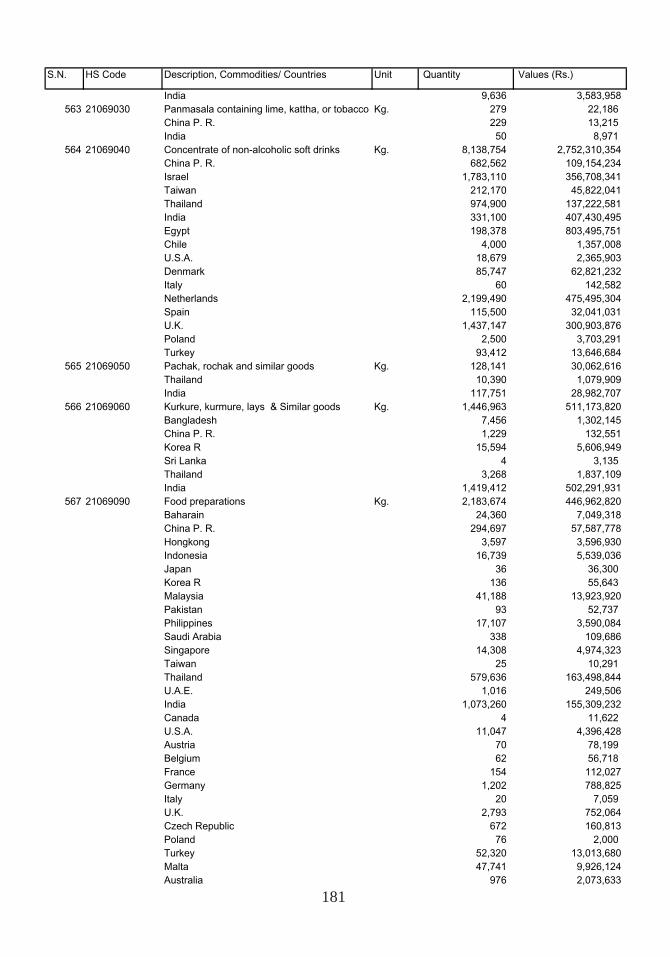
181
S.N. HS Code Description, Commodities/ Countries Unit Quantity Values (Rs.)
India 9,636 3,583,958 563 21069030 Panmasala containing lime, kattha, or tobacco Kg. 279 22,186
China P. R. 229 13,215 India 50 8,971
564 21069040 Concentrate of non-alcoholic soft drinks Kg. 8,138,754 2,752,310,354 China P. R. 682,562 109,154,234 Israel 1,783,110 356,708,341 Taiwan 212,170 45,822,041 Thailand 974,900 137,222,581 India 331,100 407,430,495 Egypt 198,378 803,495,751 Chile 4,000 1,357,008 U.S.A. 18,679 2,365,903 Denmark 85,747 62,821,232 Italy 60 142,582 Netherlands 2,199,490 475,495,304 Spain 115,500 32,041,031 U.K. 1,437,147 300,903,876 Poland 2,500 3,703,291 Turkey 93,412 13,646,684
565 21069050 Pachak, rochak and similar goods Kg. 128,141 30,062,616 Thailand 10,390 1,079,909 India 117,751 28,982,707
566 21069060 Kurkure, kurmure, lays & Similar goods Kg. 1,446,963 511,173,820 Bangladesh 7,456 1,302,145 China P. R. 1,229 132,551 Korea R 15,594 5,606,949 Sri Lanka 4 3,135 Thailand 3,268 1,837,109 India 1,419,412 502,291,931
567 21069090 Food preparations Kg. 2,183,674 446,962,820 Baharain 24,360 7,049,318 China P. R. 294,697 57,587,778 Hongkong 3,597 3,596,930 Indonesia 16,739 5,539,036 Japan 36 36,300 Korea R 136 55,643 Malaysia 41,188 13,923,920 Pakistan 93 52,737 Philippines 17,107 3,590,084 Saudi Arabia 338 109,686 Singapore 14,308 4,974,323 Taiwan 25 10,291 Thailand 579,636 163,498,844 U.A.E. 1,016 249,506 India 1,073,260 155,309,232 Canada 4 11,622 U.S.A. 11,047 4,396,428 Austria 70 78,199 Belgium 62 56,718 France 154 112,027 Germany 1,202 788,825 Italy 20 7,059 U.K. 2,793 752,064 Czech Republic 672 160,813 Poland 76 2,000 Turkey 52,320 13,013,680 Malta 47,741 9,926,124 Australia 976 2,073,633
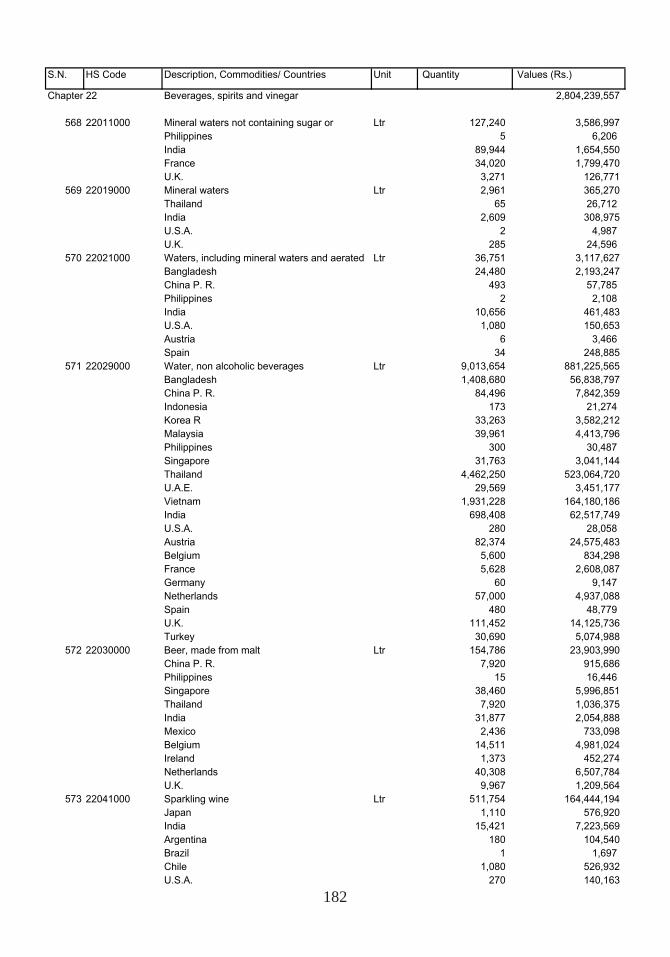
182
S.N. HS Code Description, Commodities/ Countries Unit Quantity Values (Rs.)
Chapter 22 Beverages, spirits and vinegar 2,804,239,557
568 22011000 Mineral waters not containing sugar or Ltr 127,240 3,586,997 Philippines 5 6,206 India 89,944 1,654,550 France 34,020 1,799,470 U.K. 3,271 126,771
569 22019000 Mineral waters Ltr 2,961 365,270 Thailand 65 26,712 India 2,609 308,975 U.S.A. 2 4,987 U.K. 285 24,596
570 22021000 Waters, including mineral waters and aerated Ltr 36,751 3,117,627 Bangladesh 24,480 2,193,247 China P. R. 493 57,785 Philippines 2 2,108 India 10,656 461,483 U.S.A. 1,080 150,653 Austria 6 3,466 Spain 34 248,885
571 22029000 Water, non alcoholic beverages Ltr 9,013,654 881,225,565 Bangladesh 1,408,680 56,838,797 China P. R. 84,496 7,842,359 Indonesia 173 21,274 Korea R 33,263 3,582,212 Malaysia 39,961 4,413,796 Philippines 300 30,487 Singapore 31,763 3,041,144 Thailand 4,462,250 523,064,720 U.A.E. 29,569 3,451,177 Vietnam 1,931,228 164,180,186 India 698,408 62,517,749 U.S.A. 280 28,058 Austria 82,374 24,575,483 Belgium 5,600 834,298 France 5,628 2,608,087 Germany 60 9,147 Netherlands 57,000 4,937,088 Spain 480 48,779 U.K. 111,452 14,125,736 Turkey 30,690 5,074,988
572 22030000 Beer, made from malt Ltr 154,786 23,903,990 China P. R. 7,920 915,686 Philippines 15 16,446 Singapore 38,460 5,996,851 Thailand 7,920 1,036,375 India 31,877 2,054,888 Mexico 2,436 733,098 Belgium 14,511 4,981,024 Ireland 1,373 452,274 Netherlands 40,308 6,507,784 U.K. 9,967 1,209,564
573 22041000 Sparkling wine Ltr 511,754 164,444,194 Japan 1,110 576,920 India 15,421 7,223,569 Argentina 180 104,540 Brazil 1 1,697 Chile 1,080 526,932 U.S.A. 270 140,163
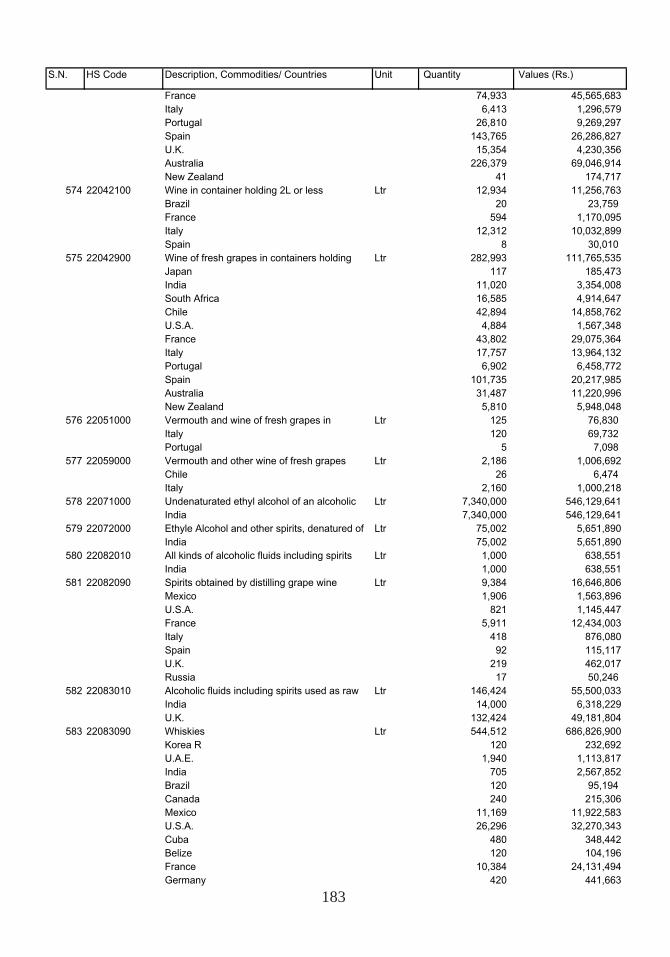
183
S.N. HS Code Description, Commodities/ Countries Unit Quantity Values (Rs.)
France 74,933 45,565,683 Italy 6,413 1,296,579 Portugal 26,810 9,269,297 Spain 143,765 26,286,827 U.K. 15,354 4,230,356 Australia 226,379 69,046,914 New Zealand 41 174,717
574 22042100 Wine in container holding 2L or less Ltr 12,934 11,256,763 Brazil 20 23,759 France 594 1,170,095 Italy 12,312 10,032,899 Spain 8 30,010
575 22042900 Wine of fresh grapes in containers holding Ltr 282,993 111,765,535 Japan 117 185,473 India 11,020 3,354,008 South Africa 16,585 4,914,647 Chile 42,894 14,858,762 U.S.A. 4,884 1,567,348 France 43,802 29,075,364 Italy 17,757 13,964,132 Portugal 6,902 6,458,772 Spain 101,735 20,217,985 Australia 31,487 11,220,996 New Zealand 5,810 5,948,048
576 22051000 Vermouth and wine of fresh grapes in Ltr 125 76,830 Italy 120 69,732 Portugal 5 7,098
577 22059000 Vermouth and other wine of fresh grapes Ltr 2,186 1,006,692 Chile 26 6,474 Italy 2,160 1,000,218
578 22071000 Undenaturated ethyl alcohol of an alcoholic Ltr 7,340,000 546,129,641 India 7,340,000 546,129,641
579 22072000 Ethyle Alcohol and other spirits, denatured of Ltr 75,002 5,651,890 India 75,002 5,651,890
580 22082010 All kinds of alcoholic fluids including spirits Ltr 1,000 638,551 India 1,000 638,551
581 22082090 Spirits obtained by distilling grape wine Ltr 9,384 16,646,806 Mexico 1,906 1,563,896 U.S.A. 821 1,145,447 France 5,911 12,434,003 Italy 418 876,080 Spain 92 115,117 U.K. 219 462,017 Russia 17 50,246
582 22083010 Alcoholic fluids including spirits used as raw Ltr 146,424 55,500,033 India 14,000 6,318,229 U.K. 132,424 49,181,804
583 22083090 Whiskies Ltr 544,512 686,826,900 Korea R 120 232,692 U.A.E. 1,940 1,113,817 India 705 2,567,852 Brazil 120 95,194 Canada 240 215,306 Mexico 11,169 11,922,583 U.S.A. 26,296 32,270,343 Cuba 480 348,442 Belize 120 104,196 France 10,384 24,131,494 Germany 420 441,663
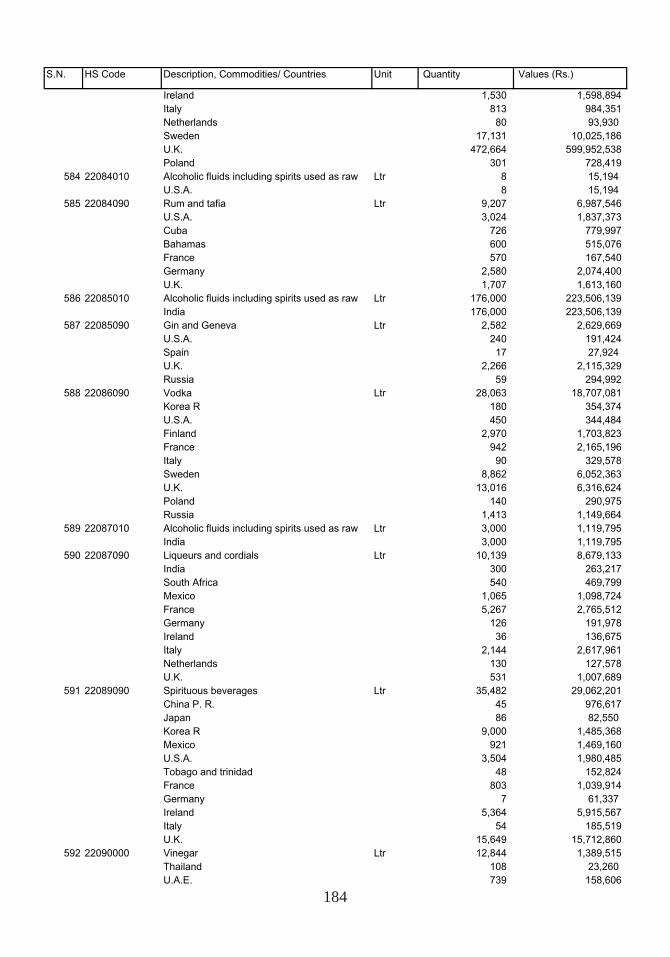
184
S.N. HS Code Description, Commodities/ Countries Unit Quantity Values (Rs.)
Ireland 1,530 1,598,894 Italy 813 984,351 Netherlands 80 93,930 Sweden 17,131 10,025,186 U.K. 472,664 599,952,538 Poland 301 728,419
584 22084010 Alcoholic fluids including spirits used as raw Ltr 8 15,194 U.S.A. 8 15,194
585 22084090 Rum and tafia Ltr 9,207 6,987,546 U.S.A. 3,024 1,837,373 Cuba 726 779,997 Bahamas 600 515,076 France 570 167,540 Germany 2,580 2,074,400 U.K. 1,707 1,613,160
586 22085010 Alcoholic fluids including spirits used as raw Ltr 176,000 223,506,139 India 176,000 223,506,139
587 22085090 Gin and Geneva Ltr 2,582 2,629,669 U.S.A. 240 191,424 Spain 17 27,924 U.K. 2,266 2,115,329 Russia 59 294,992
588 22086090 Vodka Ltr 28,063 18,707,081 Korea R 180 354,374 U.S.A. 450 344,484 Finland 2,970 1,703,823 France 942 2,165,196 Italy 90 329,578 Sweden 8,862 6,052,363 U.K. 13,016 6,316,624 Poland 140 290,975 Russia 1,413 1,149,664
589 22087010 Alcoholic fluids including spirits used as raw Ltr 3,000 1,119,795 India 3,000 1,119,795
590 22087090 Liqueurs and cordials Ltr 10,139 8,679,133 India 300 263,217 South Africa 540 469,799 Mexico 1,065 1,098,724 France 5,267 2,765,512 Germany 126 191,978 Ireland 36 136,675 Italy 2,144 2,617,961 Netherlands 130 127,578 U.K. 531 1,007,689
591 22089090 Spirituous beverages Ltr 35,482 29,062,201 China P. R. 45 976,617 Japan 86 82,550 Korea R 9,000 1,485,368 Mexico 921 1,469,160 U.S.A. 3,504 1,980,485 Tobago and trinidad 48 152,824 France 803 1,039,914 Germany 7 61,337 Ireland 5,364 5,915,567 Italy 54 185,519 U.K. 15,649 15,712,860
592 22090000 Vinegar Ltr 12,844 1,389,515 Thailand 108 23,260 U.A.E. 739 158,606
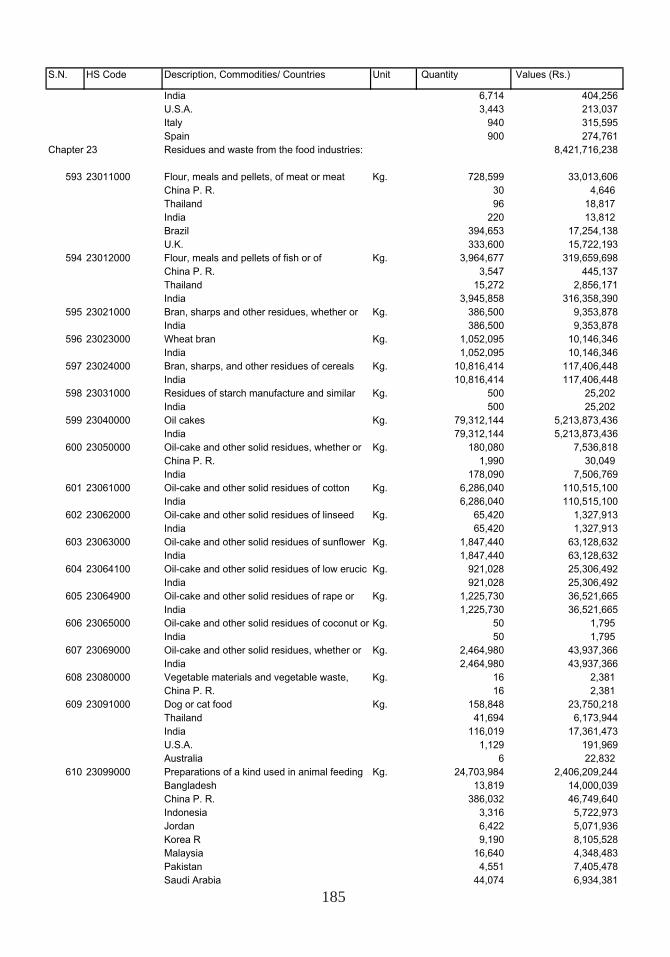
185
S.N. HS Code Description, Commodities/ Countries Unit Quantity Values (Rs.)
India 6,714 404,256 U.S.A. 3,443 213,037 Italy 940 315,595 Spain 900 274,761
Chapter 23 Residues and waste from the food industries: 8,421,716,238
593 23011000 Flour, meals and pellets, of meat or meat Kg. 728,599 33,013,606 China P. R. 30 4,646 Thailand 96 18,817 India 220 13,812 Brazil 394,653 17,254,138 U.K. 333,600 15,722,193
594 23012000 Flour, meals and pellets of fish or of Kg. 3,964,677 319,659,698 China P. R. 3,547 445,137 Thailand 15,272 2,856,171 India 3,945,858 316,358,390
595 23021000 Bran, sharps and other residues, whether or Kg. 386,500 9,353,878 India 386,500 9,353,878
596 23023000 Wheat bran Kg. 1,052,095 10,146,346 India 1,052,095 10,146,346
597 23024000 Bran, sharps, and other residues of cereals Kg. 10,816,414 117,406,448 India 10,816,414 117,406,448
598 23031000 Residues of starch manufacture and similar Kg. 500 25,202 India 500 25,202
599 23040000 Oil cakes Kg. 79,312,144 5,213,873,436 India 79,312,144 5,213,873,436
600 23050000 Oil-cake and other solid residues, whether or Kg. 180,080 7,536,818 China P. R. 1,990 30,049 India 178,090 7,506,769
601 23061000 Oil-cake and other solid residues of cotton Kg. 6,286,040 110,515,100 India 6,286,040 110,515,100
602 23062000 Oil-cake and other solid residues of linseed Kg. 65,420 1,327,913 India 65,420 1,327,913
603 23063000 Oil-cake and other solid residues of sunflower Kg. 1,847,440 63,128,632 India 1,847,440 63,128,632
604 23064100 Oil-cake and other solid residues of low erucic Kg. 921,028 25,306,492 India 921,028 25,306,492
605 23064900 Oil-cake and other solid residues of rape or Kg. 1,225,730 36,521,665 India 1,225,730 36,521,665
606 23065000 Oil-cake and other solid residues of coconut or Kg. 50 1,795 India 50 1,795
607 23069000 Oil-cake and other solid residues, whether or Kg. 2,464,980 43,937,366 India 2,464,980 43,937,366
608 23080000 Vegetable materials and vegetable waste, Kg. 16 2,381 China P. R. 16 2,381
609 23091000 Dog or cat food Kg. 158,848 23,750,218 Thailand 41,694 6,173,944 India 116,019 17,361,473 U.S.A. 1,129 191,969 Australia 6 22,832
610 23099000 Preparations of a kind used in animal feeding Kg. 24,703,984 2,406,209,244 Bangladesh 13,819 14,000,039 China P. R. 386,032 46,749,640 Indonesia 3,316 5,722,973 Jordan 6,422 5,071,936 Korea R 9,190 8,105,528 Malaysia 16,640 4,348,483 Pakistan 4,551 7,405,478 Saudi Arabia 44,074 6,934,381
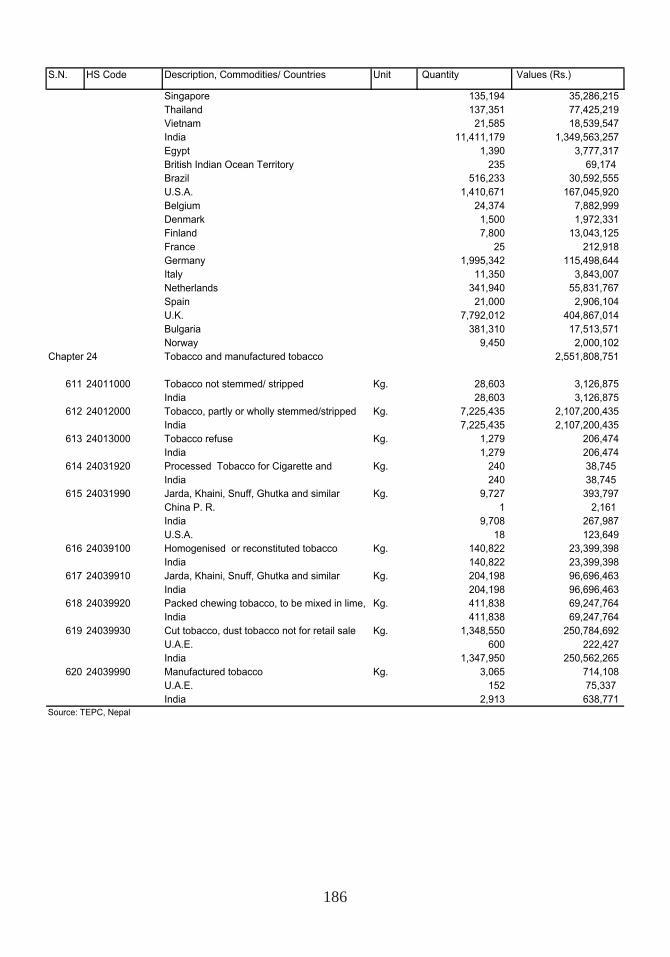
186
S.N. HS Code Description, Commodities/ Countries Unit Quantity Values (Rs.)
Singapore 135,194 35,286,215 Thailand 137,351 77,425,219 Vietnam 21,585 18,539,547 India 11,411,179 1,349,563,257 Egypt 1,390 3,777,317 British Indian Ocean Territory 235 69,174 Brazil 516,233 30,592,555 U.S.A. 1,410,671 167,045,920 Belgium 24,374 7,882,999 Denmark 1,500 1,972,331 Finland 7,800 13,043,125 France 25 212,918 Germany 1,995,342 115,498,644 Italy 11,350 3,843,007 Netherlands 341,940 55,831,767 Spain 21,000 2,906,104 U.K. 7,792,012 404,867,014 Bulgaria 381,310 17,513,571 Norway 9,450 2,000,102
Chapter 24 Tobacco and manufactured tobacco 2,551,808,751
611 24011000 Tobacco not stemmed/ stripped Kg. 28,603 3,126,875 India 28,603 3,126,875
612 24012000 Tobacco, partly or wholly stemmed/stripped Kg. 7,225,435 2,107,200,435 India 7,225,435 2,107,200,435
613 24013000 Tobacco refuse Kg. 1,279 206,474 India 1,279 206,474
614 24031920 Processed Tobacco for Cigarette and Kg. 240 38,745 India 240 38,745
615 24031990 Jarda, Khaini, Snuff, Ghutka and similar Kg. 9,727 393,797 China P. R. 1 2,161 India 9,708 267,987 U.S.A. 18 123,649
616 24039100 Homogenised or reconstituted tobacco Kg. 140,822 23,399,398 India 140,822 23,399,398
617 24039910 Jarda, Khaini, Snuff, Ghutka and similar Kg. 204,198 96,696,463 India 204,198 96,696,463
618 24039920 Packed chewing tobacco, to be mixed in lime, Kg. 411,838 69,247,764 India 411,838 69,247,764
619 24039930 Cut tobacco, dust tobacco not for retail sale Kg. 1,348,550 250,784,692 U.A.E. 600 222,427 India 1,347,950 250,562,265
620 24039990 Manufactured tobacco Kg. 3,065 714,108 U.A.E. 152 75,337 India 2,913 638,771
Source: TEPC, Nepal
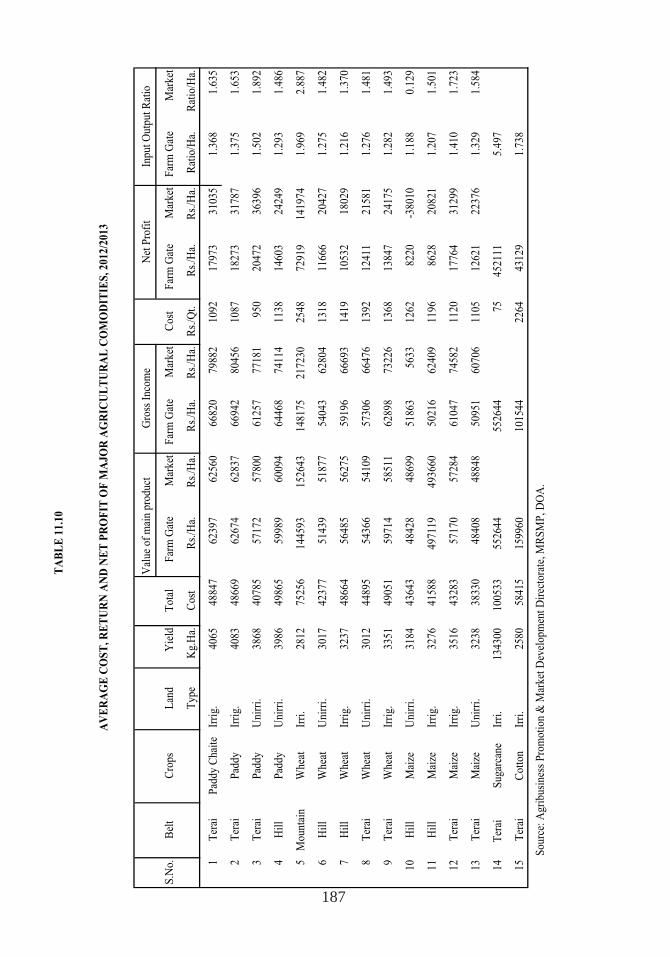
187
TA
BL
E 1
1.1
0
Val
ue o
f m
ain
prod
uct
S.N
o.B
elt
Cro
psL
and
Yie
ldT
otal
Far
m G
ate
Mar
ket
Far
m G
ate
Mar
ket
Cos
tF
arm
Gat
eM
arke
tF
arm
Gat
eM
arke
t
Typ
eK
g.H
a.C
ost
Rs.
/Ha.
Rs.
/Ha.
Rs.
/Ha.
Rs.
/Ha.
Rs.
/Qt.
Rs.
/Ha.
Rs.
/Ha.
Rat
io/H
a.R
atio
/Ha.
1T
erai
Pad
dy C
hait
eIr
rig.
4065
4884
762
397
6256
066
820
7988
210
9217
973
3103
51.
368
1.63
5
2T
erai
Pad
dyIr
rig.
4083
4866
962
674
6283
766
942
8045
610
8718
273
3178
71.
375
1.65
3
3T
erai
Pad
dyU
nirr
i.38
6840
785
5717
257
800
6125
777
181
950
2047
236
396
1.50
21.
892
4H
ill
Pad
dyU
nirr
i.39
8649
865
5998
960
094
6446
874
114
1138
1460
324
249
1.29
31.
486
5M
ount
ain
Whe
atIr
ri.
2812
7525
614
4593
1526
4314
8175
2172
3025
4872
919
1419
741.
969
2.88
7
6H
ill
Whe
atU
nirr
i.30
1742
377
5143
951
877
5404
362
804
1318
1166
620
427
1.27
51.
482
7H
ill
Whe
atIr
rig.
3237
4866
456
485
5627
559
196
6669
314
1910
532
1802
91.
216
1.37
0
8T
erai
Whe
atU
nirr
i.30
1244
895
5436
654
109
5730
666
476
1392
1241
121
581
1.27
61.
481
9T
erai
Whe
atIr
rig.
3351
4905
159
714
5851
162
898
7322
613
6813
847
2417
51.
282
1.49
3
10H
ill
Mai
zeU
nirr
i.31
8443
643
4842
848
699
5186
356
3312
6282
20-3
8010
1.18
80.
129
11H
ill
Mai
zeIr
rig.
3276
4158
849
7119
4936
6050
216
6240
911
9686
2820
821
1.20
71.
501
12T
erai
Mai
zeIr
rig.
3516
4328
357
170
5728
461
047
7458
211
2017
764
3129
91.
410
1.72
3
13T
erai
Mai
zeU
nirr
i.32
3838
330
4840
848
848
5095
160
706
1105
1262
122
376
1.32
91.
584
14T
erai
S
ugar
cane
Irri
.13
4300
1005
3355
2644
5526
4475
4521
115.
497
15T
erai
Cot
ton
Irri
.25
8058
415
1599
6010
1544
2264
4312
91.
738
Sou
rce:
Agr
ibus
ines
s P
rom
otio
n &
Mar
ket
Dev
elop
men
t D
irec
tora
te, M
RS
MP
, DO
A.
Gro
ss I
ncom
eN
et P
rofi
tIn
put
Out
put
Rat
io
AV
ER
AG
E C
OS
T,
RE
TU
RN
AN
D N
ET
PR
OF
IT O
F M
AJ
OR
AG
RIC
UL
TU
RA
L C
OM
OD
ITIE
S,
20
12
/20
13
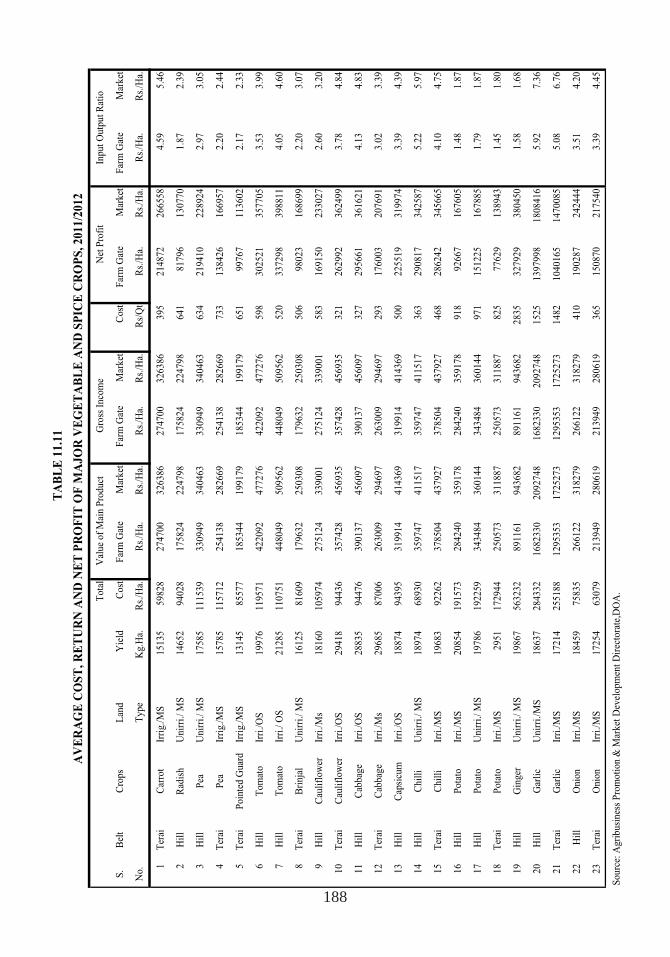
188
Tota
l
S.
Bel
tC
rops
Lan
dY
ield
Cost
Far
m G
ate
Mar
ket
Far
m G
ate
Mar
ket
Cost
Far
m G
ate
Mar
ket
Far
m G
ate
Mar
ket
No.
Type
Kg.H
a.R
s./H
a.R
s./H
a.R
s./H
a.R
s./H
a.R
s./H
a.R
s/Q
tR
s./H
a.R
s./H
a.R
s./H
a.R
s./H
a.
1T
erai
Car
rot
Irri
g./
MS
15135
59828
274700
326386
274700
326386
395
214872
266558
4.5
95.4
6
2H
ill
Rad
ish
Unir
ri./
MS
14652
94028
175824
224798
175824
224798
641
81796
130770
1.8
72.3
9
3H
ill
Pea
Unir
ri./
MS
17585
111539
330949
340463
330949
340463
634
219410
228924
2.9
73.0
5
4T
erai
Pea
Irri
g./
MS
15785
115712
254138
282669
254138
282669
733
138426
166957
2.2
02.4
4
5T
erai
Poin
ted G
uar
dIr
rig./
MS
13145
85577
185344
199179
185344
199179
651
99767
113602
2.1
72.3
3
6H
ill
Tom
ato
Irri
./O
S19976
119571
422092
477276
422092
477276
598
302521
357705
3.5
33.9
9
7H
ill
Tom
ato
Irri
./ O
S21285
110751
448049
509562
448049
509562
520
337298
398811
4.0
54.6
0
8T
erai
Bri
nja
lU
nir
ri./
MS
16125
81609
179632
250308
179632
250308
506
98023
168699
2.2
03.0
7
9H
ill
Cau
lifl
ow
erIr
ri./
Ms
18160
105974
275124
339001
275124
339001
583
169150
233027
2.6
03.2
0
10
Ter
aiC
auli
flow
erIr
ri./
OS
29418
94436
357428
456935
357428
456935
321
262992
362499
3.7
84.8
4
11
Hil
lC
abbag
eIr
ri./
OS
28835
94476
390137
456097
390137
456097
327
295661
361621
4.1
34.8
3
12
Ter
aiC
abbag
eIr
ri./
Ms
29685
87006
263009
294697
263009
294697
293
176003
207691
3.0
23.3
9
13
Hil
lC
apsi
cum
Irri
./O
S18874
94395
319914
414369
319914
414369
500
225519
319974
3.3
94.3
9
14
Hil
lC
hil
liU
nir
ri./
MS
18974
68930
359747
411517
359747
411517
363
290817
342587
5.2
25.9
7
15
Ter
aiC
hil
liIr
ri./
MS
19683
92262
378504
437927
378504
437927
468
286242
345665
4.1
04.7
5
16
Hil
lP
ota
toIr
ri./
MS
20854
191573
284240
359178
284240
359178
918
92667
167605
1.4
81.8
7
17
Hil
lP
ota
toU
nir
ri./
MS
19786
192259
343484
360144
343484
360144
971
151225
167885
1.7
91.8
7
18
Ter
aiP
ota
toIr
ri./
MS
2951
172944
250573
311887
250573
311887
825
77629
138943
1.4
51.8
0
19
Hil
lG
inger
Unir
ri./
MS
19867
563232
891161
943682
891161
943682
2835
327929
380450
1.5
81.6
8
20
Hil
lG
arli
cU
nir
ri./
MS
18637
284332
1682330
2092748
1682330
2092748
1525
1397998
1808416
5.9
27.3
6
21
Ter
aiG
arli
cIr
ri./
MS
17214
255188
1295353
1725273
1295353
1725273
1482
1040165
1470085
5.0
86.7
6
22
H
ill
Onio
nIr
ri./
MS
18459
75835
266122
318279
266122
318279
410
190287
242444
3.5
14.2
0
23
Ter
aiO
nio
nIr
ri./
MS
17254
63079
213949
280619
213949
280619
365
150870
217540
3.3
94.4
5
Sourc
e: A
gri
busi
nes
s P
rom
oti
on &
Mar
ket
Dev
elopm
ent
Dir
ecto
rate
,DO
A.
Val
ue
of
Mai
n P
roduct
Gro
ss I
nco
me
Net
Pro
fit
Input
Outp
ut
Rat
io
TA
BL
E 1
1.1
1
AV
ER
AG
E C
OS
T, R
ET
UR
N A
ND
NE
T P
RO
FIT
OF
MA
JO
R V
EG
ET
AB
LE
AN
D S
PIC
E C
RO
PS
, 2011/2
012
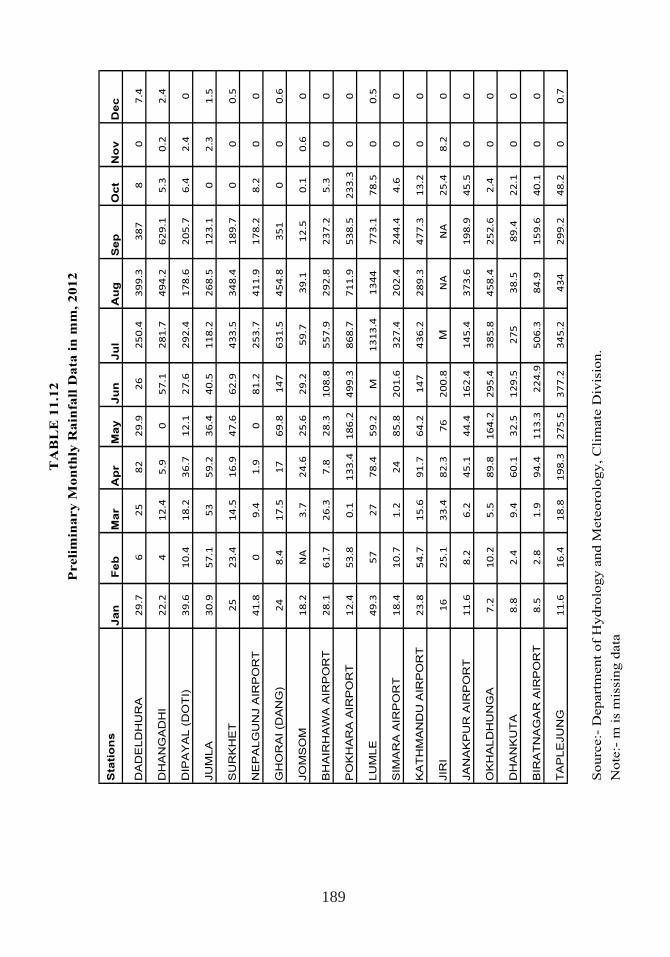
189
Sta
tio
ns
Jan
F
eb
Mar
Ap
rM
ay
Ju
nJu
lA
ug
Sep
Oct
No
vD
ec
DA
DE
LD
HU
RA
29.7
625
82
29.9
26
250.4
399.3
387
80
7.4
DH
AN
GA
DH
I22.2
412.4
5.9
057.1
281.7
494.2
629.1
5.3
0.2
2.4
DIP
AY
AL (
DO
TI)
39.6
10.4
18.2
36.7
12.1
27.6
292.4
178.6
205.7
6.4
2.4
0
JUM
LA
30.9
57.1
53
59.2
36.4
40.5
118.2
268.5
123.1
02.3
1.5
SU
RK
HE
T25
23.4
14.5
16.9
47.6
62.9
433.5
348.4
189.7
00
0.5
NE
PA
LG
UN
J A
IRP
OR
T41.8
09.4
1.9
081.2
253.7
411.9
178.2
8.2
00
GH
OR
AI (D
AN
G)
24
8.4
17.5
17
69.8
147
631.5
454.8
351
00
0.6
JOM
SO
M18.2
NA
3.7
24.6
25.6
29.2
59.7
39.1
12.5
0.1
0.6
0
BH
AIR
HA
WA
AIR
PO
RT
28.1
61.7
26.3
7.8
28.3
108.8
557.9
292.8
237.2
5.3
00
PO
KH
AR
A A
IRP
OR
T12.4
53.8
0.1
133.4
186.2
499.3
868.7
711.9
538.5
233.3
00
LU
MLE
49.3
57
27
78.4
59.2
M1313.4
1344
773.1
78.5
00.5
SIM
AR
A A
IRP
OR
T18.4
10.7
1.2
24
85.8
201.6
327.4
202.4
244.4
4.6
00
KA
TH
MA
ND
U A
IRP
OR
T23.8
54.7
15.6
91.7
64.2
147
436.2
289.3
477.3
13.2
00
JIR
I16
25.1
33.4
82.3
76
200.8
MNA
NA
25.4
8.2
0
JAN
AK
PU
R A
IRP
OR
T11.6
8.2
6.2
45.1
44.4
162.4
145.4
373.6
198.9
45.5
00
OK
HA
LD
HU
NG
A7.2
10.2
5.5
89.8
164.2
295.4
385.8
458.4
252.6
2.4
00
DH
AN
KU
TA
8.8
2.4
9.4
60.1
32.5
129.5
275
38.5
89.4
22.1
00
BIR
AT
NA
GA
R A
IRP
OR
T8.5
2.8
1.9
94.4
113.3
224.9
506.3
84.9
159.6
40.1
00
TA
PLE
JUN
G11.6
16.4
18.8
198.3
275.5
377.2
345.2
434
299.2
48.2
00.7
Sourc
e:-
Depart
ment
of
Hydro
logy a
nd M
ete
oro
logy, C
lim
ate
Div
isio
n.
Note
:- m
is
mis
sing d
ata
TA
BL
E 1
1.1
2
Preli
min
ary M
on
thly
Rain
fall
Data
in
mm
, 2012
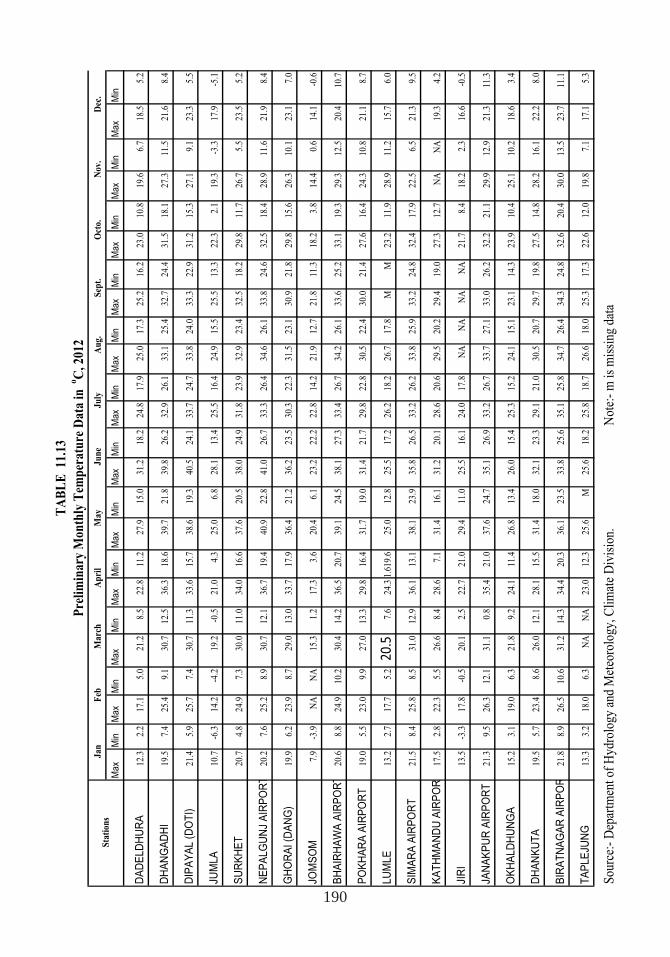
190
Max
Min
Max
Min
Max
Min
Max
Min
Max
Min
Max
Min
Max
Min
Max
Min
Max
Min
Max
Min
Max
Min
Max
Min
DAD
ELD
HU
RA
12.3
2.2
17.1
5.0
21.2
8.5
22.8
11.2
27.9
15.0
31.2
18.2
24.8
17.9
25.0
17.3
25.2
16.2
23.0
10.8
19.6
6.7
18.5
5.2
DH
ANG
ADH
I19
.57.
425
.49.
130
.712
.536
.318
.639
.721
.839
.826
.232
.926
.133
.125
.432
.724
.431
.518
.127
.311
.521
.68.
4
DIP
AYAL
(DO
TI)
21.4
5.9
25.7
7.4
30.7
11.3
33.6
15.7
38.6
19.3
40.5
24.1
33.7
24.7
33.8
24.0
33.3
22.9
31.2
15.3
27.1
9.1
23.3
5.5
JUM
LA10
.7-6
.314
.2-4
.219
.2-0
.521
.04.
325
.06.
828
.113
.425
.516
.424
.915
.525
.513
.322
.32.
119
.3-3
.317
.9-5
.1
SUR
KHET
20.7
4.8
24.9
7.3
30.0
11.0
34.0
16.6
37.6
20.5
38.0
24.9
31.8
23.9
32.9
23.4
32.5
18.2
29.8
11.7
26.7
5.5
23.5
5.2
NEP
ALG
UN
J AI
RPO
RT
20.2
7.6
25.2
8.9
30.7
12.1
36.7
19.4
40.9
22.8
41.0
26.7
33.3
26.4
34.6
26.1
33.8
24.6
32.5
18.4
28.9
11.6
21.9
8.4
GH
OR
AI (D
ANG
)19
.96.
223
.98.
729
.013
.033
.717
.936
.421
.236
.223
.530
.322
.331
.523
.130
.921
.829
.815
.626
.310
.123
.17.
0
JOM
SOM
7.9
-3.9
NA
NA
15.3
1.2
17.3
3.6
20.4
6.1
23.2
22.2
22.8
14.2
21.9
12.7
21.8
11.3
18.2
3.8
14.4
0.6
14.1
-0.6
BHAI
RH
AWA
AIR
POR
T20
.68.
824
.910
.230
.414
.236
.520
.739
.124
.538
.127
.333
.426
.734
.226
.133
.625
.233
.119
.329
.312
.520
.410
.7
POKH
ARA
AIR
POR
T19
.05.
523
.09.
927
.013
.329
.816
.431
.719
.031
.421
.729
.822
.830
.522
.430
.021
.427
.616
.424
.310
.821
.18.
7
LUM
LE13
.22.
717
.75.
220
.57.
624
.31.
619.
625
.012
.825
.517
.226
.218
.226
.717
.8M
M23
.211
.928
.911
.215
.76.
0
SIM
ARA
AIR
POR
T21
.58.
425
.88.
531
.012
.936
.113
.138
.123
.935
.826
.533
.226
.233
.825
.933
.224
.832
.417
.922
.56.
521
.39.
5
KATH
MAN
DU
AIR
POR
17.5
2.8
22.3
5.5
26.6
8.4
28.6
7.1
31.4
16.1
31.2
20.1
28.6
20.6
29.5
20.2
29.4
19.0
27.3
12.7
NA
NA
19.3
4.2
JIR
I13
.5-3
.317
.8-0
.520
.12.
522
.721
.029
.411
.025
.516
.124
.017
.8N
AN
AN
AN
A21
.78.
418
.22.
316
.6-0
.5
JAN
AKPU
R A
IRPO
RT
21.3
9.5
26.3
12.1
31.1
0.8
35.4
21.0
37.6
24.7
35.1
26.9
33.2
26.7
33.7
27.1
33.0
26.2
32.2
21.1
29.9
12.9
21.3
11.3
OKH
ALD
HU
NG
A15
.23.
119
.06.
321
.89.
224
.111
.426
.813
.426
.015
.425
.315
.224
.115
.123
.114
.323
.910
.425
.110
.218
.63.
4
DH
ANKU
TA19
.55.
723
.48.
626
.012
.128
.115
.531
.418
.032
.123
.329
.121
.030
.520
.729
.719
.827
.514
.828
.216
.122
.28.
0
BIR
ATN
AGAR
AIR
POR
21.8
8.9
26.5
10.6
31.2
14.3
34.4
20.3
36.1
23.5
33.8
25.6
35.1
25.8
34.7
26.4
34.3
24.8
32.6
20.4
30.0
13.5
23.7
11.1
TAPL
EJU
NG
13.3
3.2
18.0
6.3
NA
NA
23.0
12.3
25.6
M25
.618
.225
.818
.726
.618
.025
.317
.322
.612
.019
.87.
117
.15.
3
Sou
rce:
- D
epar
tmen
t of
Hyd
rolo
gy a
nd M
eteo
rolo
gy, C
lim
ate
Div
isio
n.N
ote:
- m
is
mis
sing
dat
a
TA
BL
E 1
1.13
Pre
lim
inar
y M
onth
ly T
emp
erat
ure
Dat
a in
oC
, 201
2
Oct
o.N
ov.
Dec
.M
ayJu
ne
July
Au
g.S
ept.
Sta
tion
sJa
nF
ebM
arch
Ap
ril
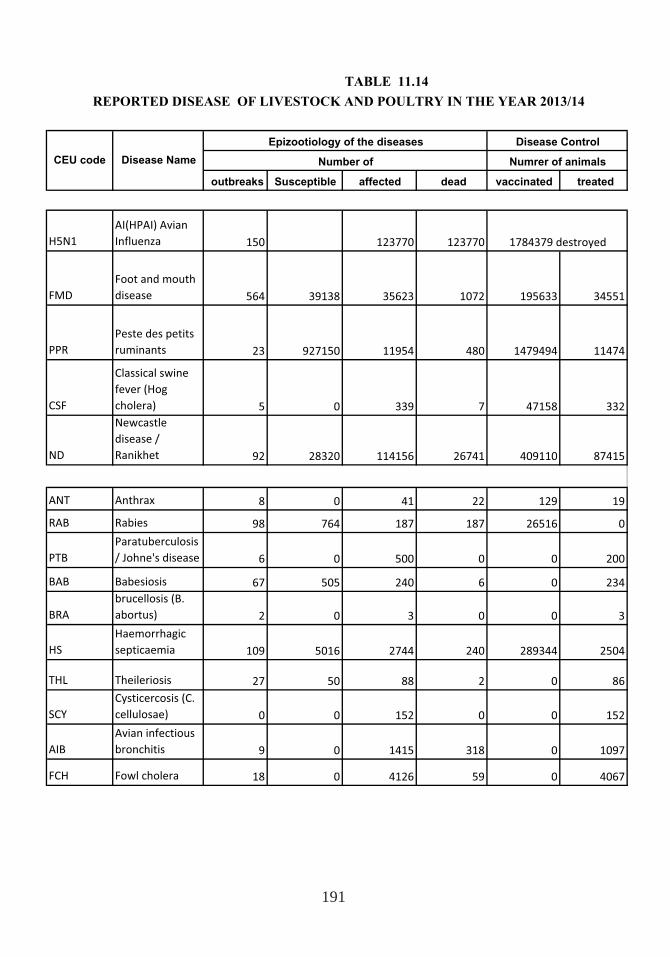
191
TABLE 11.14
outbreaks Susceptible affected dead vaccinated treated
H5N1
AI(HPAI) Avian
Influenza 150 123770 123770
FMD
Foot and mouth
disease 564 39138 35623 1072 195633 34551
PPR
Peste des petits
ruminants 23 927150 11954 480 1479494 11474
CSF
Classical swine
fever (Hog
cholera) 5 0 339 7 47158 332
ND
Newcastle
disease /
Ranikhet 92 28320 114156 26741 409110 87415
ANT Anthrax 8 0 41 22 129 19
RAB Rabies 98 764 187 187 26516 0
PTB
Paratuberculosis
/ Johne's disease 6 0 500 0 0 200
BAB Babesiosis 67 505 240 6 0 234
BRA
brucellosis (B.
abortus) 2 0 3 0 0 3
HS
Haemorrhagic
septicaemia 109 5016 2744 240 289344 2504
THL Theileriosis 27 50 88 2 0 86
SCY
Cysticercosis (C.
cellulosae) 0 0 152 0 0 152
AIB
Avian infectious
bronchitis 9 0 1415 318 0 1097
FCH Fowl cholera 18 0 4126 59 0 4067
REPORTED DISEASE OF LIVESTOCK AND POULTRY IN THE YEAR 2013/14
1784379 destroyed
CEU code Disease Name
Epizootiology of the diseases Disease Control
Number of Numrer of animals
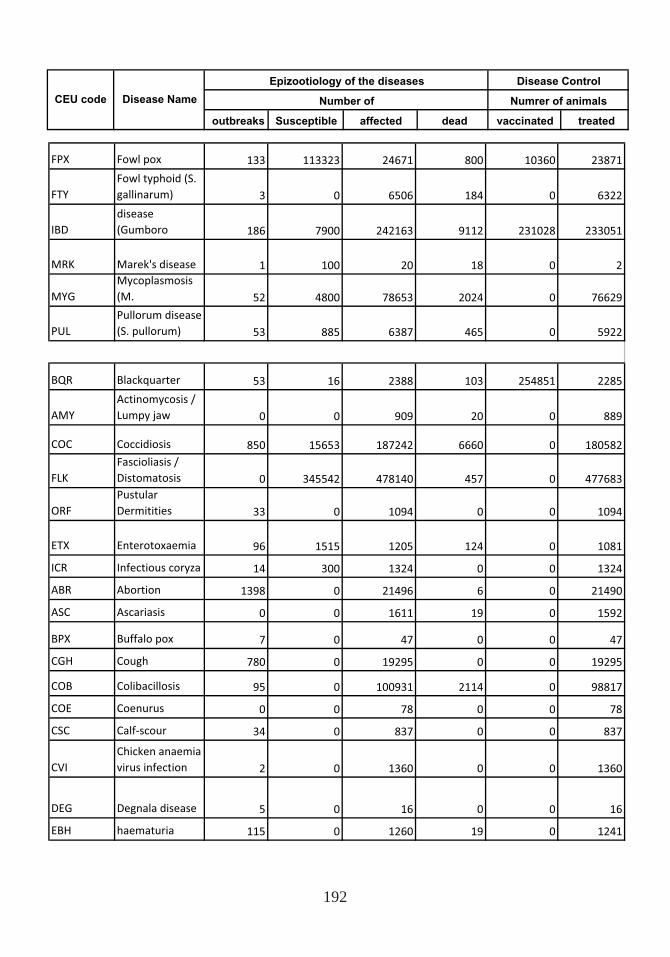
192
FPX Fowl pox 133 113323 24671 800 10360 23871
FTY
Fowl typhoid (S.
gallinarum) 3 0 6506 184 0 6322
IBD
disease
(Gumboro 186 7900 242163 9112 231028 233051
MRK Marek's disease 1 100 20 18 0 2
MYG
Mycoplasmosis
(M. 52 4800 78653 2024 0 76629
PUL
Pullorum disease
(S. pullorum) 53 885 6387 465 0 5922
BQR Blackquarter 53 16 2388 103 254851 2285
AMY
Actinomycosis /
Lumpy jaw 0 0 909 20 0 889
COC Coccidiosis 850 15653 187242 6660 0 180582
FLK
Fascioliasis /
Distomatosis 0 345542 478140 457 0 477683
ORF
Pustular
Dermitities 33 0 1094 0 0 1094
ETX Enterotoxaemia 96 1515 1205 124 0 1081
ICR Infectious coryza 14 300 1324 0 0 1324
ABR Abortion 1398 0 21496 6 0 21490
ASC Ascariasis 0 0 1611 19 0 1592
BPX Buffalo pox 7 0 47 0 0 47
CGH Cough 780 0 19295 0 0 19295
COB Colibacillosis 95 0 100931 2114 0 98817
COE Coenurus 0 0 78 0 0 78
CSC Calf scour 34 0 837 0 0 837
CVI
Chicken anaemia
virus infection 2 0 1360 0 0 1360
DEG Degnala disease 5 0 16 0 0 16
EBH haematuria 115 0 1260 19 0 1241
outbreaks Susceptible affected dead vaccinated treated
CEU code Disease Name
Epizootiology of the diseases Disease Control
Number of Numrer of animals
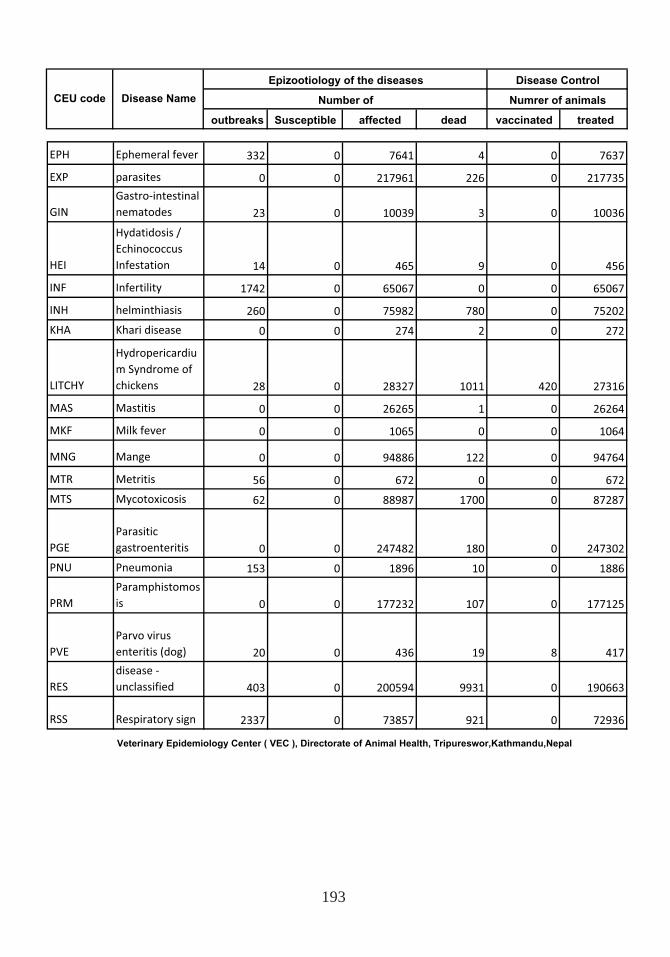
193
EPH Ephemeral fever 332 0 7641 4 0 7637
EXP parasites 0 0 217961 226 0 217735
GIN
Gastro intestinal
nematodes 23 0 10039 3 0 10036
HEI
Hydatidosis /
Echinococcus
Infestation 14 0 465 9 0 456
INF Infertility 1742 0 65067 0 0 65067
INH helminthiasis 260 0 75982 780 0 75202
KHA Khari disease 0 0 274 2 0 272
LITCHY
Hydropericardiu
m Syndrome of
chickens 28 0 28327 1011 420 27316
MAS Mastitis 0 0 26265 1 0 26264
MKF Milk fever 0 0 1065 0 0 1064
MNG Mange 0 0 94886 122 0 94764
MTR Metritis 56 0 672 0 0 672
MTS Mycotoxicosis 62 0 88987 1700 0 87287
PGE
Parasitic
gastroenteritis 0 0 247482 180 0 247302
PNU Pneumonia 153 0 1896 10 0 1886
PRM
Paramphistomos
is 0 0 177232 107 0 177125
PVE
Parvo virus
enteritis (dog) 20 0 436 19 8 417
RES
disease
unclassified 403 0 200594 9931 0 190663
RSS Respiratory sign 2337 0 73857 921 0 72936
Veterinary Epidemiology Center ( VEC ), Directorate of Animal Health, Tripureswor,Kathmandu,Nepal
outbreaks Susceptible affected dead vaccinated treated
CEU code Disease Name
Epizootiology of the diseases Disease Control
Number of Numrer of animals
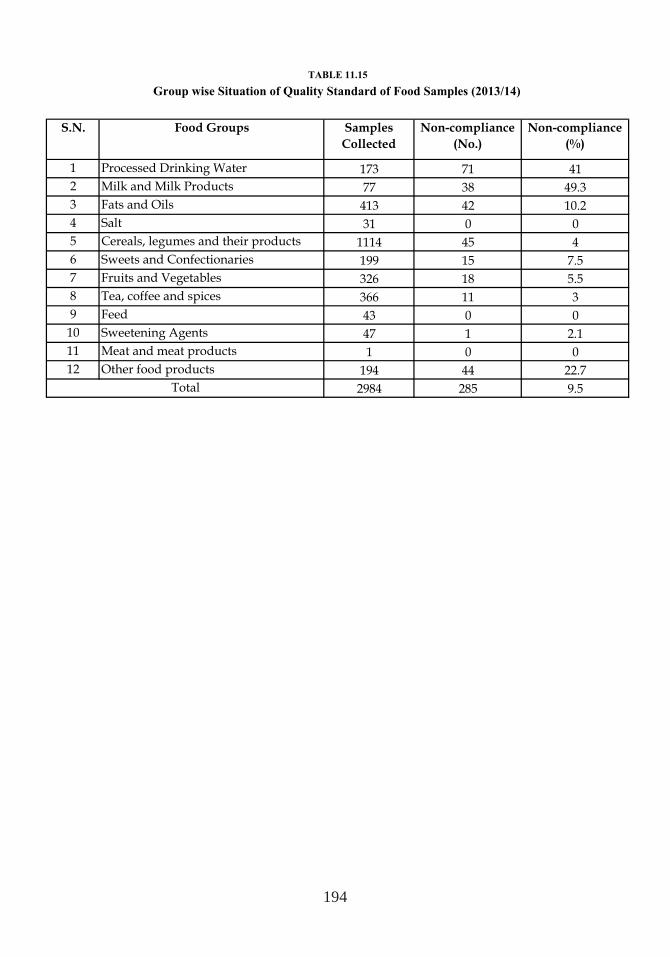
194
S.N. Food Groups Samples
Collected
Non-compliance
(No.)
Non-compliance
(%)
1 Processed Drinking Water 173 71 41
2 Milk and Milk Products 77 38 49.3
3 Fats and Oils 413 42 10.2
4 Salt 31 0 0
5 Cereals, legumes and their products 1114 45 4
6 Sweets and Confectionaries 199 15 7.5
7 Fruits and Vegetables 326 18 5.5
8 Tea, coffee and spices 366 11 3
9 Feed 43 0 0
10 Sweetening Agents 47 1 2.1
11 Meat and meat products 1 0 0
12 Other food products 194 44 22.7
2984 285 9.5Total
TABLE 11.15
Group wise Situation of Quality Standard of Food Samples (2013/14)
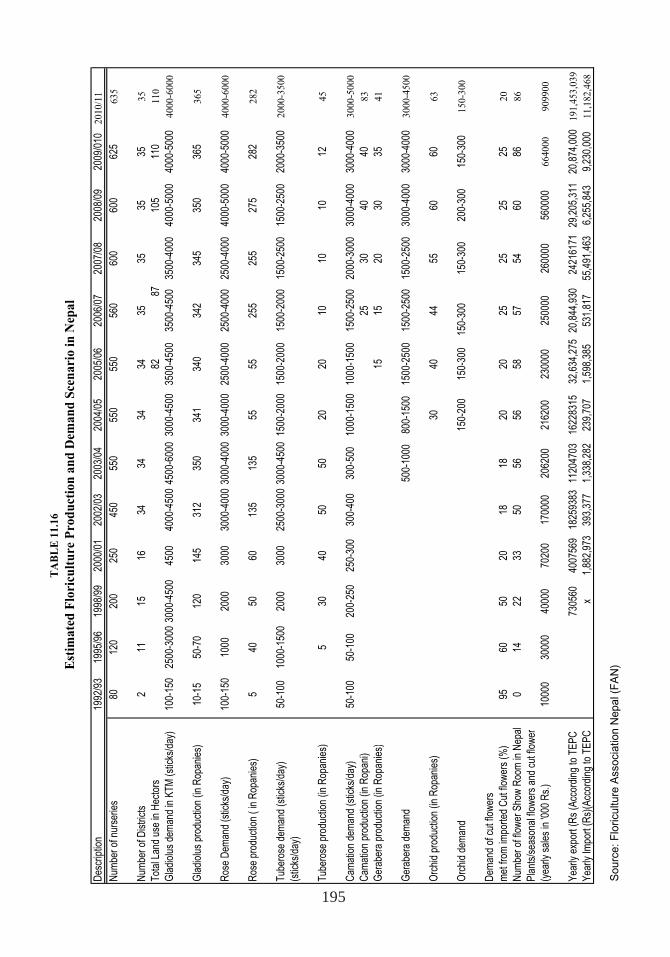
195
TA
BL
E 1
1.1
6
Est
ima
ted
Flo
ricu
ltu
re P
rod
uct
ion
an
d D
ema
nd
Sce
na
rio
in
Nep
al
Des
crip
tion
1992
/93
1995
/96
1998
/99
2000
/01
2002
/03
2003
/04
2004
/05
2005
/06
2006
/07
2007
/08
2008
/09
2009
/010
20
10
/11
Num
ber
of n
urse
ries
8012
020
025
045
055
055
055
056
060
060
062
56
35
Num
ber
of D
istr
icts
211
1516
3434
3434
3535
3535
35
Tot
al L
and
use
in H
ecto
rs
8287
105
110
11
0
Gla
diol
us d
eman
d in
KT
M (
stic
ks/d
ay)
100-
150
2500
-300
030
00-4
500
4500
4000
-450
045
00-6
000
3000
-450
035
00-4
500
3500
-450
035
00-4
000
4000
-500
040
00-5
000
40
00
-60
00
Gla
diol
us p
rodu
ctio
n (in
Rop
anie
s)10
-15
50-7
012
014
531
235
034
134
034
234
535
036
53
65
Ros
e D
eman
d (s
ticks
/day
)10
0-15
010
0020
0030
0030
00-4
000
3000
-400
030
00-4
000
2500
-400
025
00-4
000
2500
-400
040
00-5
000
4000
-500
04
00
0-6
00
0
Ros
e pr
oduc
tion
( in
Rop
anie
s)5
4050
6013
513
555
5525
525
527
528
22
82
Tub
eros
e de
man
d (s
ticks
/day
)50
-100
1000
-150
020
0030
0025
00-3
000
3000
-450
015
00-2
000
1500
-200
015
00-2
000
1500
-250
015
00-2
500
2000
-350
02
00
0-3
50
0
(stic
ks/d
ay)
Tub
eros
e pr
oduc
tion
(in R
opan
ies )
530
4050
5020
2010
1010
124
5
Cam
atio
n de
man
d (s
ticks
/day
)50
-100
50-1
0020
0-25
025
0-30
030
0-40
030
0-50
010
00-1
500
1000
-150
015
00-2
500
2000
-300
030
00-4
000
3000
-400
03
00
0-5
00
0
Cam
atio
n pr
oduc
tion
(in R
opan
i)25
3040
408
3
Ger
aber
a pr
oduc
tion
(in R
opan
ies)
1515
2030
354
1
Ger
aber
a de
man
d50
0-10
0080
0-15
0015
00-2
500
1500
-250
015
00-2
500
3000
-400
030
00-4
000
30
00
-45
00
Orc
hid
prod
uctio
n (in
Rop
anie
s)30
4044
5560
606
3
Orc
hid
dem
and
150-
200
150-
300
150-
300
150-
300
200-
300
150-
300
15
0-3
00
Dem
and
of c
ut fl
ower
s
met
from
impo
rted
Cut
flow
ers
(%)
9560
5020
1818
2020
2525
2525
20
Num
ber
of fl
ower
Sho
w R
oom
in N
epal
014
2233
5056
5658
5754
6086
86
Pla
nts/
seas
onal
flow
ers
and
cut f
low
er
(yea
rly s
ales
in '0
00 R
s.)
1000
030
000
4000
070
200
1700
0020
6200
2162
0023
0000
2500
0026
0000
5600
006
64
00
09
09
90
0
Yea
rly e
xpor
t (R
s (A
ccor
ding
to T
EP
C
7305
6040
0756
918
2593
8311
2047
0316
2283
1532
,634
,275
20,8
44,9
3024
2161
7129
,205
,311
20,8
74,0
001
91
,45
3,0
39
Yea
rly Im
port
(R
s)(A
ccor
ding
to T
EP
C
x1,
882,
973
393,
377
1,33
8,28
223
9,70
71,
598,
385
531,
817
55,4
91,4
636,
255,
843
9,23
0,00
01
1,1
82
,46
8
Sou
rce:
Flo
ricul
ture
Ass
ocia
tion
Nep
al (F
AN
)
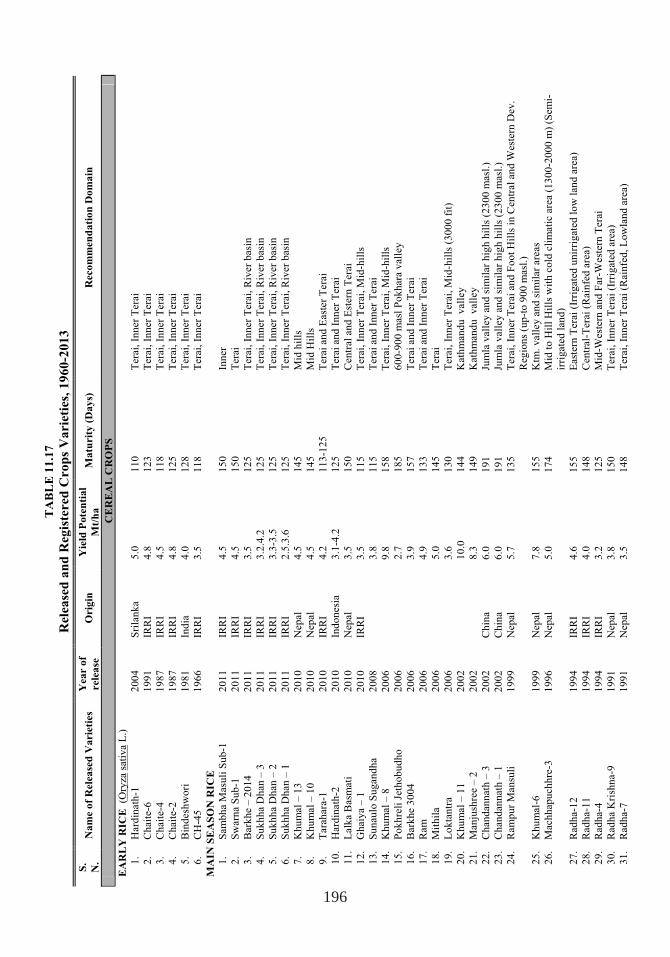
196
TA
BL
E 1
1.1
7
Rele
ase
d a
nd
Reg
iste
red
Cro
ps
Va
rie
ties,
19
60
-20
13
S.
N.
Na
me o
f R
ele
ase
d V
arie
ties
Yea
r o
f
rele
ase
O
rig
in
Yie
ld P
ote
nti
al
Mt/
ha
M
atu
rit
y (
Da
ys)
R
eco
mm
en
da
tio
n D
om
ain
CE
RE
AL
CR
OP
S
EA
RL
Y R
ICE
(O
ryza
sati
va L
.)
1.
Hard
inath
-1
20
04
S
rila
nk
a
5.0
1
10
T
erai
, In
ner
Ter
ai
2.
Ch
ait
e-6
1
99
1
IRR
I 4
.8
12
3
Ter
ai, In
ner
Ter
ai
3.
Ch
ait
e-4
1
98
7
IRR
I 4
.5
11
8
Ter
ai, In
ner
Ter
ai
4.
Ch
ait
e-2
1
98
7
IRR
I 4
.8
12
5
Ter
ai, In
ner
Ter
ai
5.
Bin
desh
wo
ri
19
81
In
dia
4
.0
12
8
Tera
i, I
nner
Ter
ai
6.
CH
-45
1
96
6
IRR
I 3
.5
11
8
Tera
i, I
nn
er
Tera
i
MA
IN S
EA
SO
N R
ICE
1.
Sam
bh
a M
asu
li S
ub
-1
20
11
IR
RI
4.5
1
50
In
ner
2.
Sw
arn
a S
ub
-1
20
11
IR
RI
4.5
1
50
T
era
i
3.
Bark
he –
20
14
2
01
1
IRR
I 3
.5
12
5
Ter
ai,
In
ner
Tera
i, R
iver
basi
n
4.
Su
kh
ha D
han
– 3
2
01
1
IRR
I 3
.2.4
.2
12
5
Tera
i, I
nn
er
Tera
i, R
iver
basi
n
5.
Su
kh
ha D
han
– 2
2
01
1
IRR
I 3
.3-3
.5
12
5
Tera
i, I
nn
er
Tera
i, R
iver
basi
n
6.
Su
kh
ha D
han
– 1
2
01
1
IRR
I 2
.5.3
.6
12
5
Tera
i, I
nn
er
Tera
i, R
iver
basi
n
7.
Kh
um
al
– 1
3
20
10
N
ep
al
4.5
1
45
M
id h
ills
8.
Kh
um
al
– 1
0
20
10
N
ep
al
4.5
1
45
M
id H
ills
9.
Tara
hara
-1
20
10
IR
RI
4.2
1
13
-12
5
Tera
i an
d E
ast
er
Tera
i
10
.H
ard
inath
-2
20
10
In
do
nesi
a
3.1
-4.2
1
25
T
era
i an
d I
nn
er
Tera
i
11
.L
alk
a B
asm
ati
2
01
0
Nep
al
3.5
1
50
C
en
tral
an
d E
stern
Tera
i
12
.G
haiy
a –
1
20
10
IR
RI
3.5
1
15
T
era
i, I
nn
er
Tera
i, M
id-h
ills
13
.S
un
au
lo S
ug
an
dh
a
20
08
3.8
1
15
T
era
i an
d I
nn
er
Tera
i
14
.K
hu
mal
– 8
2
00
6
9
.8
15
8
Tera
i, I
nn
er
Tera
i, M
id-h
ills
15
.P
ok
hre
li J
eth
ob
ud
ho
2
00
6
2
.7
18
5
60
0-9
00
mas
l P
ok
hara
vall
ey
16
.B
ark
he 3
00
4
20
06
3.9
1
57
T
era
i an
d I
nn
er
Tera
i
17
.R
am
2
00
6
4
.9
13
3
Tera
i an
d I
nn
er
Tera
i
18
.M
ith
ila
20
06
5.0
1
45
T
era
i
19
.L
ok
tan
tra
20
06
3.6
1
30
T
era
i, I
nn
er
Tera
i, M
id-h
ills
(3
00
0 f
it)
20
.K
hu
mal
– 1
1
20
02
10
.0
14
4
Kath
man
du
v
all
ey
21
.M
an
jush
ree –
2
20
02
8.3
1
49
K
ath
man
du
v
all
ey
22
.C
han
dan
nath
– 3
2
00
2
Ch
ina
6.0
1
91
Ju
mla
vall
ey a
nd
sim
ilar
hig
h h
ills
(2
30
0 m
asl.
)
23
.C
han
dan
nath
– 1
2
00
2
Ch
ina
6.0
1
91
Ju
mla
vall
ey a
nd
sim
ilar
hig
h h
ills
(2
30
0 m
asl.
)
24
.R
am
pu
r M
an
suli
1
99
9
Nep
al
5.7
1
35
T
era
i, I
nn
er
Tera
i an
d F
oo
t H
ills
in
Cen
tral
an
d W
este
rn D
ev
.
Reg
ion
s (u
p-t
o 9
00
mas
l.)
25
.K
hu
mal-
6
19
99
N
ep
al
7.8
1
55
K
tm. v
all
ey a
nd
sim
ilar
are
as
26
.M
ach
hap
uch
hre
-3
19
96
N
ep
al
5.0
1
74
M
id t
o H
ill
Hil
ls w
ith
co
ld c
lim
ati
c a
rea (
13
00
-20
00
m)
(Sem
i-
irri
gate
d l
an
d)
27
.R
ad
ha-1
2
19
94
IR
RI
4.6
1
55
E
ast
ern
Tera
i (I
rrig
ate
d u
nir
rig
ate
d l
ow
lan
d a
rea)
28
.R
ad
ha-1
1
19
94
IR
RI
4.0
1
48
C
en
tral-
Tera
i (R
ain
fed
are
a)
29
.R
ad
ha-4
1
99
4
IRR
I 3
.2
12
5
Mid
-Wes
tern
an
d F
ar-
West
ern
Tera
i
30
.R
ad
ha K
rish
na-9
1
99
1
Nep
al
3.8
1
50
T
era
i, I
nn
er
Tera
i (I
rrig
ate
d a
rea)
31
.R
ad
ha-7
1
99
1
Nep
al
3.5
1
48
T
era
i, I
nn
er
Tera
i (R
ain
fed
, L
ow
lan
d a
rea)
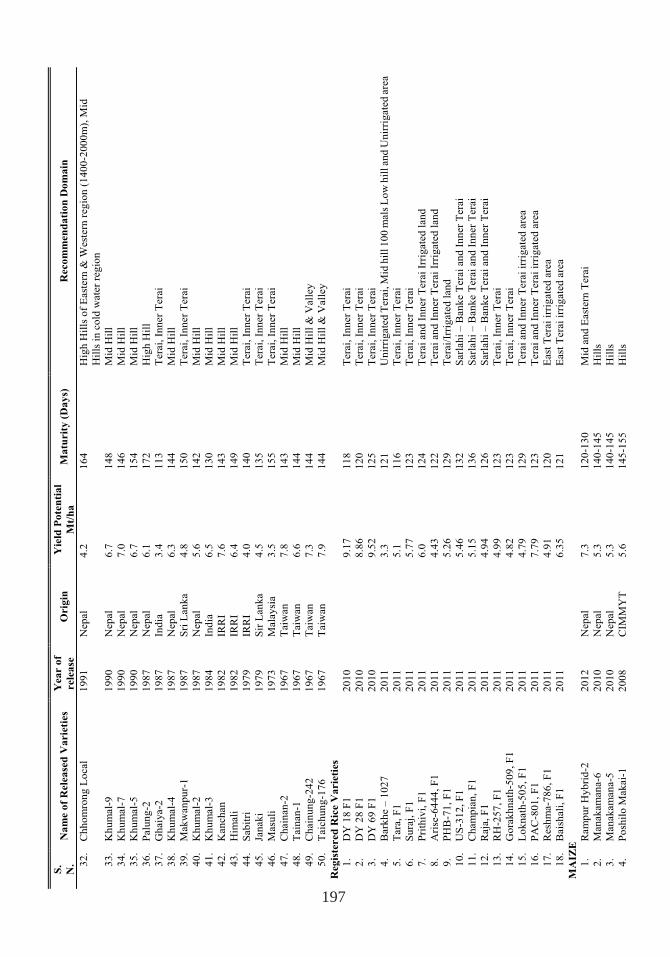
197
S.
N.
Na
me o
f R
ele
ase
d V
arie
ties
Yea
r o
f
rele
ase
O
rig
in
Yie
ld P
ote
nti
al
Mt/
ha
M
atu
rit
y (
Da
ys)
R
eco
mm
en
da
tio
n D
om
ain
32
.C
hh
om
ron
g L
ocal
19
91
N
ep
al
4.2
1
64
H
igh
Hil
ls o
f E
ast
ern
& W
est
ern
reg
ion
(1
40
0-2
00
0m
), M
id
Hil
ls i
n c
old
wate
r re
gio
n
33
.K
hu
mal-
9
19
90
N
ep
al
6.7
1
48
M
id H
ill
34
.K
hu
mal-
7
19
90
N
ep
al
7.0
1
46
M
id H
ill
35
.K
hu
mal-
5
19
90
N
ep
al
6.7
1
54
M
id H
ill
36
.P
alu
ng
-2
19
87
N
ep
al
6.1
1
72
H
igh
Hil
l
37
.G
haiy
a-2
1
98
7
Ind
ia
3.4
1
13
T
era
i, I
nner
Tera
i
38
.K
hu
mal-
4
19
87
N
ep
al
6.3
1
44
M
id H
ill
39
.M
ak
wan
pu
r-1
1
98
7
Sri
Lan
ka
4.8
1
50
T
era
i, I
nn
er
Tera
i
40
.K
hu
mal-
2
19
87
N
ep
al
5.6
1
42
M
id H
ill
41
.K
hu
mal-
3
19
84
In
dia
6
.5
13
0
Mid
Hil
l
42
.K
an
ch
an
1
98
2
IRR
I 7
.6
14
3
Mid
Hil
l
43
.H
imali
1
98
2
IRR
I 6
.4
14
9
Mid
Hil
l
44
.S
ab
itri
1
97
9
IRR
I 4
.0
14
0
Tera
i, I
nner
Tera
i
45
.Ja
nak
i 1
97
9
Sir
Lan
ka
4.5
1
35
T
era
i, I
nner
Tera
i
46
.M
asu
li
19
73
M
ala
ysi
a
3.5
1
55
T
era
i, I
nner
Tera
i
47
.C
hain
an
-2
19
67
T
aiw
an
7
.8
14
3
Mid
Hil
l
48
.T
ain
an
-1
19
67
T
aiw
an
6
.6
14
4
Mid
Hil
l
49
.C
hain
un
g-2
42
1
96
7
Taiw
an
7
.3
14
4
Mid
Hil
l &
Vall
ey
50
.T
aic
hu
ng
-17
6
19
67
T
aiw
an
7
.9
14
4
Mid
Hil
l &
Vall
ey
Reg
iste
red
Ric
e V
arie
ties
1.
DY
18
F1
20
10
9.1
7
11
8
Tera
i, I
nn
er
Tera
i
2.
DY
28
F1
20
10
8.8
6
12
0
Tera
i, I
nn
er
Tera
i
3.
DY
69
F1
20
10
9.5
2
12
5
Tera
i, I
nn
er
Tera
i
4.
Bark
he –
10
27
2
01
1
3
.3
12
1
Un
irri
gate
d T
era
i, M
id h
ill 1
00
mals
Lo
w h
ill an
d U
nir
rig
ate
d a
rea
5.
Tara
, F
1
20
11
5.1
1
16
T
era
i, I
nn
er
Tera
i
6.
Su
raj,
F1
2
01
1
5
.77
1
23
T
era
i, I
nn
er
Tera
i
7.
Pri
thiv
i, F
1
20
11
6.0
1
24
T
era
i an
d I
nn
er
Tera
i Ir
rig
ate
d l
an
d
8.
Ari
se-6
44
4, F
1
20
11
4.4
3
12
2
Tera
i an
d I
nn
er
Tera
i Ir
rig
ate
d l
an
d
9.
PH
B-7
1, F
1
20
11
5.2
6
12
9
Tera
i/Ir
rig
ate
d l
an
d
10
.U
S-3
12
, F
1
20
11
5.4
6
13
2
Sarl
ah
i –
Ban
ke T
era
i an
d I
nn
er
Tera
i
11
.C
ham
pia
n, F
1
20
11
5.1
5
13
6
Sarl
ah
i –
Ban
ke T
era
i an
d I
nn
er
Tera
i
12
.R
aja
, F
1
20
11
4.9
4
12
6
Sarl
ah
i –
Ban
ke T
era
i an
d I
nn
er
Tera
i
13
.R
H-2
57
, F
1
20
11
4.9
9
12
3
Tera
i, I
nn
er
Tera
i
14
.G
ora
kh
nath
-50
9,
F1
2
01
1
4
.82
1
23
T
era
i, I
nn
er
Tera
i
15
.L
ok
nath
-50
5,
F1
2
01
1
4
.79
1
29
T
era
i an
d I
nn
er
Tera
i ir
rig
ate
d a
rea
16
.P
AC
-80
1, F
1
20
11
7.7
9
12
3
Tera
i an
d I
nn
er
Tera
i ir
rig
ate
d a
rea
17
.R
esh
ma-7
86
, F
1
20
11
4.9
1
12
0
East
Tera
i ir
rig
ate
d a
rea
18
.B
ais
hali
, F
1
20
11
6.3
5
12
1
East
Tera
i ir
rig
ate
d a
rea
MA
IZE
1.
Ram
pu
r H
yb
rid
-2
20
12
N
ep
al
7.3
1
20
-13
0
Mid
an
d E
ast
ern
Tera
i
2.
Man
ak
am
an
a-6
2
01
0
Nep
al
5.3
1
40
-14
5
Hil
ls
3.
Man
ak
am
an
a-5
2
01
0
Nep
al
5.3
1
40
-14
5
Hil
ls
4.
Po
shil
o M
ak
ai-
1
20
08
C
IMM
YT
5
.6
14
5-1
55
H
ills
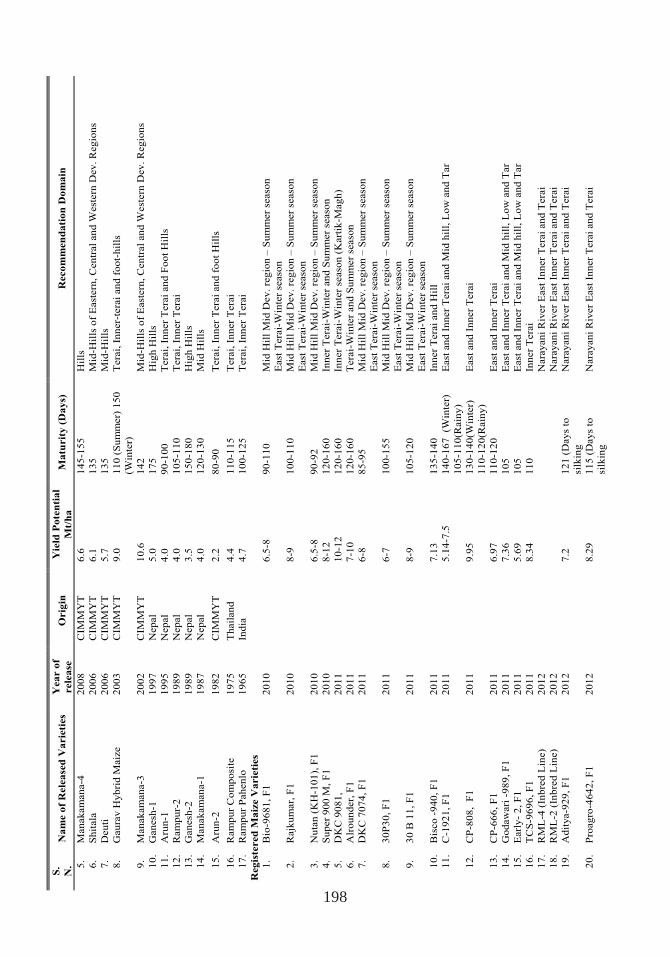
198
S.
N.
Na
me o
f R
ele
ase
d V
arie
ties
Yea
r o
f
rele
ase
O
rig
in
Yie
ld P
ote
nti
al
Mt/
ha
M
atu
rit
y (
Da
ys)
R
eco
mm
en
da
tio
n D
om
ain
5.
Man
ak
am
an
a-4
2
00
8
CIM
MY
T
6.6
1
45
-15
5
Hil
ls
6.
Sh
itala
2
00
6
CIM
MY
T
6.1
1
35
M
id-H
ills
of
East
ern
, C
en
tral
an
d W
est
ern
Dev
. R
eg
ion
s
7.
Deu
ti
20
06
C
IMM
YT
5
.7
13
5
Mid
-Hil
ls
8.
Gau
rav
Hyb
rid
Maiz
e
20
03
C
IMM
YT
9
.0
11
0 (
Su
mm
er)
15
0
(Win
ter)
Tera
i, I
nn
er-
tera
i an
d f
oo
t-h
ills
9.
Man
ak
am
an
a-3
2
00
2
CIM
MY
T
10
.6
14
2
Mid
-Hil
ls o
f E
ast
ern
, C
en
tral
an
d W
est
ern
Dev
. R
eg
ion
s
10
.G
an
esh
-1
19
97
N
ep
al
5.0
1
75
H
igh
Hil
ls
11
.A
run
-1
19
95
N
ep
al
4.0
9
0-1
00
T
era
i, I
nn
er
Tera
i an
d F
oo
t H
ills
12
.R
am
pu
r-2
1
98
9
Nep
al
4.0
1
05
-11
0
Tera
i, I
nner
Tera
i
13
.G
an
esh
-2
19
89
N
ep
al
3.5
1
50
-18
0
Hig
h H
ills
14
.M
an
ak
am
an
a-1
1
98
7
Nep
al
4.0
1
20
-13
0
Mid
Hil
ls
15
.A
run
-2
19
82
C
IMM
YT
2
.2
80
-90
T
era
i, I
nn
er
Tera
i an
d f
oo
t H
ills
16
.R
am
pu
r C
om
po
site
1
97
5
Th
ail
an
d
4.4
1
10
-11
5
Tera
i, I
nn
er
Tera
i
17
.R
am
pu
r P
ah
en
lo
19
65
In
dia
4
.7
10
0-1
25
T
era
i, I
nn
er
Tera
i
Reg
iste
red
Ma
ize V
arie
ties
1.
Bio
-96
81
, F
1
20
10
6.5
-8
90
-11
0
Mid
Hil
l M
id D
ev
. re
gio
n –
Su
mm
er
seaso
n
East
Tera
i-W
inte
r se
aso
n
2.
Rajk
um
ar,
F1
2
01
0
8
-9
10
0-1
10
M
id H
ill
Mid
Dev
. re
gio
n –
Su
mm
er
seaso
n
East
Tera
i-W
inte
r se
aso
n
3.
Nu
tan
(K
H-1
01
), F
1
20
10
6.5
-8
90
-92
M
id H
ill
Mid
Dev
. re
gio
n –
Su
mm
er
seaso
n
4.
Su
per
90
0 M
, F
1
20
10
8-1
2
12
0-1
60
In
ner
Tera
i-W
inte
r an
d S
um
mer
seaso
n
5.
DK
C 9
08
1,
20
11
10
-12
1
20
-16
0
Inn
er
Tera
i-W
inte
r se
aso
n (
Kart
ik-M
ag
h)
6.
Alr
ou
nd
er,
F1
2
01
1
7
-10
1
20
-16
0
Tera
i-W
inte
r an
d S
um
mer
seaso
n
7.
DK
C 7
07
4,
F1
2
01
1
6
-8
85
-95
M
id H
ill
Mid
Dev
. re
gio
n –
Su
mm
er
seaso
n
East
Tera
i-W
inte
r se
aso
n
8.
30
P3
0,
F1
2
01
1
6
-7
10
0-1
55
M
id H
ill
Mid
Dev
. re
gio
n –
Su
mm
er
seaso
n
East
Tera
i-W
inte
r se
aso
n
9.
30
B 1
1, F
1
20
11
8-9
1
05
-12
0
Mid
Hil
l M
id D
ev
. re
gio
n –
Su
mm
er
seaso
n
East
Tera
i-W
inte
r se
aso
n
10
.B
isco
-9
40
, F
1
20
11
7.1
3
13
5-1
40
In
ner
Tera
i an
d H
ill
11
.C
-19
21
, F
1
20
11
5.1
4-7
.5
14
0-1
67
(W
inte
r)
10
5-1
10
(Rain
y)
East
an
d I
nn
er
Tera
i an
d M
id h
ill,
Lo
w a
nd
Tar
12
.C
P-8
08
, F
1
20
11
9.9
5
13
0-1
40
(Win
ter)
11
0-1
20
(Rain
y)
East
an
d I
nn
er
Tera
i
13
.C
P-6
66
, F
1
20
11
6.9
7
11
0-1
20
E
ast
an
d I
nn
er
Tera
i
14
.G
od
aw
ari
-9
89
, F
1
20
11
7.3
6
10
5
East
an
d I
nn
er
Tera
i an
d M
id h
ill,
Lo
w a
nd
Tar
15
.E
arl
y-
2, F
1
20
11
5.6
9
10
5
East
an
d I
nn
er
Tera
i an
d M
id h
ill,
Lo
w a
nd
Tar
16
.T
CS
-96
96
, F
1
20
11
8.3
4
11
0
Inn
er
Tera
i
17
.R
ML
-4 (
Inb
red
Lin
e)
20
12
Nara
yan
i R
iver
East
In
ner
Tera
i an
d T
era
i
18
.R
ML
-2 (
Inb
red
Lin
e)
20
12
Nara
yan
i R
iver
East
In
ner
Tera
i an
d T
era
i
19
.A
dit
ya-9
29
, F
1
20
12
7.2
1
21
(D
ays
to
silk
ing
Nara
yan
i R
iver
East
In
ner
Tera
i an
d T
era
i
20
.P
roag
ro-4
64
2,
F1
2
01
2
8
.29
1
15
(D
ays
to
silk
ing
Nara
yan
i R
iver
East
In
ner
Tera
i an
d T
era
i
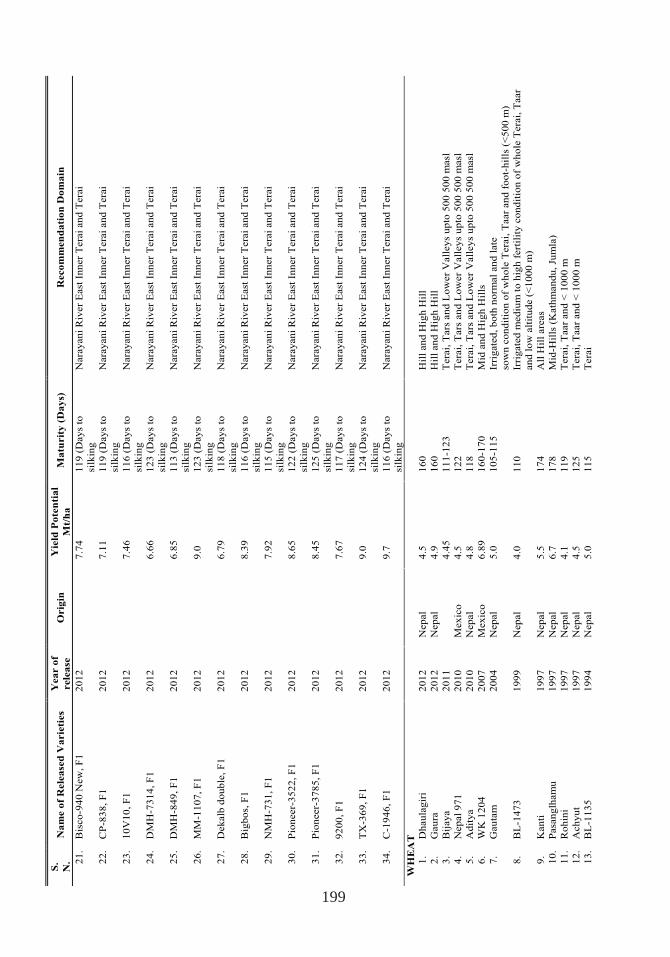
199
S.
N.
Na
me o
f R
ele
ase
d V
arie
ties
Yea
r o
f
rele
ase
O
rig
in
Yie
ld P
ote
nti
al
Mt/
ha
M
atu
rit
y (
Da
ys)
R
eco
mm
en
da
tio
n D
om
ain
21
.B
isco
-94
0 N
ew
, F
1
20
12
7.7
4
11
9 (
Days
to
silk
ing
Nara
yan
i R
iver
East
In
ner
Tera
i an
d T
era
i
22
.C
P-8
38
, F
1
20
12
7.1
1
11
9 (
Days
to
silk
ing
Nara
yan
i R
iver
East
In
ner
Tera
i an
d T
era
i
23
.1
0V
10
, F
1
20
12
7.4
6
11
6 (
Days
to
silk
ing
Nara
yan
i R
iver
East
In
ner
Tera
i an
d T
era
i
24
.D
MH
-73
14
, F
1
20
12
6.6
6
12
3 (
Days
to
silk
ing
Nara
yan
i R
iver
East
In
ner
Tera
i an
d T
era
i
25
.D
MH
-84
9, F
1
20
12
6.8
5
11
3 (
Days
to
silk
ing
Nara
yan
i R
iver
East
In
ner
Tera
i an
d T
era
i
26
.M
M-1
10
7, F
1
20
12
9.0
1
23
(D
ays
to
silk
ing
Nara
yan
i R
iver
East
In
ner
Tera
i an
d T
era
i
27
.D
ek
alb
do
ub
le, F
1
20
12
6.7
9
11
8 (
Days
to
silk
ing
Nara
yan
i R
iver
East
In
ner
Tera
i an
d T
era
i
28
.B
igb
os,
F1
2
01
2
8
.39
1
16
(D
ays
to
silk
ing
Nara
yan
i R
iver
East
In
ner
Tera
i an
d T
era
i
29
.N
MH
-73
1, F
1
20
12
7.9
2
11
5 (
Days
to
silk
ing
Nara
yan
i R
iver
East
In
ner
Tera
i an
d T
era
i
30
.P
ion
eer-
35
22
, F
1
20
12
8.6
5
12
2 (
Days
to
silk
ing
Nara
yan
i R
iver
East
In
ner
Tera
i an
d T
era
i
31
.P
ion
eer-
37
85
, F
1
20
12
8.4
5
12
5 (
Days
to
silk
ing
Nara
yan
i R
iver
East
In
ner
Tera
i an
d T
era
i
32
.9
20
0, F
1
20
12
7.6
7
11
7 (
Days
to
silk
ing
Nara
yan
i R
iver
East
In
ner
Tera
i an
d T
era
i
33
.T
X-3
69
, F
1
20
12
9.0
1
24
(D
ays
to
silk
ing
Nara
yan
i R
iver
East
In
ner
Tera
i an
d T
era
i
34
.C
-19
46
, F
1
20
12
9.7
1
16
(D
ays
to
silk
ing
Nara
yan
i R
iver
East
In
ner
Tera
i an
d T
era
i
WH
EA
T
1.
Dh
au
lag
iri
20
12
N
ep
al
4.5
1
60
H
ill
an
d H
igh
Hil
l
2.
Gau
ra
20
12
N
ep
al
4.9
1
60
H
ill
an
d H
igh
Hil
l
3.
Bij
aya
20
11
4.4
5
11
1-1
23
T
era
i, T
ars
an
d L
ow
er
Vall
eys
up
to 5
00
50
0 m
asl
4.
Nep
al
97
1
20
10
M
ex
ico
4
.5
12
2
Tera
i, T
ars
an
d L
ow
er
Vall
eys
up
to 5
00
50
0 m
asl
5.
Ad
itya
20
10
N
ep
al
4.8
1
18
T
era
i, T
ars
an
d L
ow
er
Vall
eys
up
to 5
00
50
0 m
asl
6.
WK
12
04
2
00
7
Mex
ico
6
.89
1
60
-17
0
Mid
an
d H
igh
Hil
ls
7.
Gau
tam
2
00
4
Nep
al
5.0
1
05
-11
5
Irri
gate
d, b
oth
no
rmal
an
d l
ate
sow
n c
on
dit
ion
of
wh
ole
Tera
i, T
aar
an
d f
oo
t-h
ills
(<
50
0 m
)
8.
BL
-14
73
1
99
9
Nep
al
4.0
1
10
Ir
rig
ate
d m
ed
ium
to
hig
h f
ert
ilit
y c
on
dit
ion
of
wh
ole
Tera
i, T
aar
an
d l
ow
alt
itu
de (
<1
00
0 m
)
9.
Kan
ti
19
97
N
ep
al
5.5
1
74
A
ll H
ill
are
as
10
.P
asa
ng
lham
u
19
97
N
ep
al
6.7
1
78
M
id-H
ills
(K
ath
man
du
, Ju
mla
)
11
.R
oh
ini
19
97
N
ep
al
4.1
1
19
T
era
i, T
aar
an
d <
10
00
m
12
.A
ch
yu
t 1
99
7
Nep
al
4.5
1
25
T
era
i, T
aar
an
d <
10
00
m
13
.B
L-1
13
5
19
94
N
ep
al
5.0
1
15
T
era
i
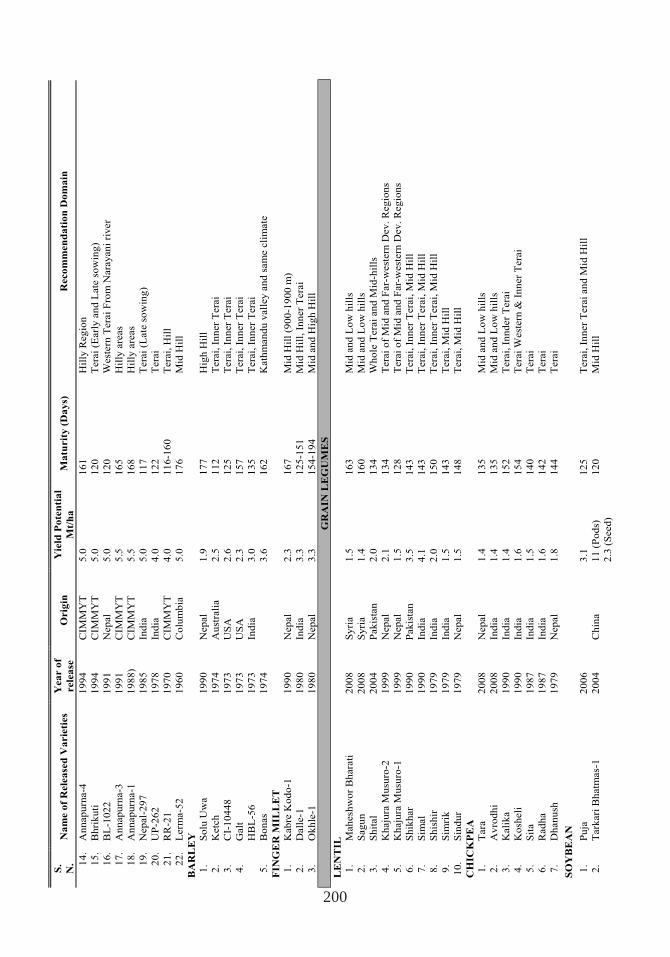
200
S.
N.
Na
me o
f R
ele
ase
d V
arie
ties
Yea
r o
f
rele
ase
O
rig
in
Yie
ld P
ote
nti
al
Mt/
ha
M
atu
rit
y (
Da
ys)
R
eco
mm
en
da
tio
n D
om
ain
14
.A
nn
ap
urn
a-4
1
99
4
CIM
MY
T
5.0
1
61
H
illy
Reg
ion
15
.B
hri
ku
ti
19
94
C
IMM
YT
5
.0
12
0
Tera
i (E
arl
y a
nd
Late
so
win
g)
16
.B
L-1
02
2
19
91
N
ep
al
5.0
1
20
W
est
ern
Tera
i F
rom
Nara
yan
i ri
ver
17
.A
nn
ap
urn
a-3
1
99
1
CIM
MY
T
5.5
1
65
H
illy
are
as
18
.A
nn
ap
urn
a-1
1
98
8)
CIM
MY
T
5.5
1
68
H
illy
are
as
19
.N
ep
al-
29
7
19
85
In
dia
5
.0
11
7
Tera
i (L
ate
so
win
g)
20
.U
P-2
62
1
97
8
Ind
ia
4.0
1
22
T
era
i
21
.R
R-2
1
19
70
C
IMM
YT
4
.0
11
6-1
60
T
era
i, H
ill
22
.L
erm
a-5
2
19
60
C
olu
mb
ia
5.0
1
76
M
id H
ill
BA
RL
EY
1.
So
lu U
wa
19
90
N
ep
al
1.9
1
77
H
igh
Hil
l
2.
Ketc
h
19
74
A
ust
rali
a
2.5
1
12
T
era
i, I
nner
Tera
i
3.
CI-
10
44
8
19
73
U
SA
2
.6
12
5
Tera
i, I
nner
Tera
i
4.
Galt
1
97
3
US
A
2.3
1
57
T
era
i, I
nn
er
Tera
i
H
BL
-56
1
97
3
Ind
ia
3.0
1
35
T
era
i, I
nner
Tera
i
5.
Bo
nas
19
74
3.6
1
62
K
ath
man
du
vall
ey a
nd
sam
e c
lim
ate
FIN
GE
R M
ILL
ET
1.
Kab
re K
od
o-1
1
99
0
Nep
al
2.3
1
67
M
id H
ill
(90
0-1
90
0 m
)
2.
Dall
e-1
1
98
0
Ind
ia
3.3
1
25
-15
1
Mid
Hil
l, I
nn
er
Tera
i
3.
Ok
hle
-1
19
80
N
ep
al
3.3
1
54
-19
4
Mid
an
d H
igh
Hil
l
GR
AIN
LE
GU
ME
S
LE
NT
IL
1.
Mah
esh
wo
r B
hara
ti
20
08
S
yri
a
1.5
1
63
M
id a
nd
Lo
w h
ills
2.
Sag
un
2
00
8
Syri
a
1.4
1
60
M
id a
nd
Lo
w h
ills
3.
Sh
ital
20
04
P
ak
ista
n
2.0
1
34
W
ho
le T
era
i an
d M
id-h
ills
4.
Kh
aju
ra M
usu
ro-2
1
99
9
Nep
al
2.1
1
34
T
era
i o
f M
id a
nd
Far-
west
ern
Dev
. R
eg
ion
s
5.
Kh
aju
ra M
usu
ro-1
1
99
9
Nep
al
1.5
1
28
T
era
i o
f M
id a
nd
Far-
west
ern
Dev
. R
eg
ion
s
6.
Sh
ikh
ar
19
90
P
ak
ista
n
3.5
1
43
T
era
i, I
nn
er
Tera
i, M
id H
ill
7.
Sim
al
19
90
In
dia
4
.1
14
3
Tera
i, I
nn
er
Tera
i, M
id H
ill
8.
Sh
ish
ir
19
79
In
dia
2
.0
15
0
Tera
i, I
nn
er
Tera
i, M
id H
ill
9.
Sim
rik
1
97
9
Ind
ia
1.5
1
43
T
era
i, M
id H
ill
10
. S
ind
ur
19
79
N
ep
al
1.5
1
48
T
era
i, M
id H
ill
CH
ICK
PE
A
1.
Tara
2
00
8
Nep
al
1.4
1
35
M
id a
nd
Lo
w h
ills
2.
Av
rod
hi
20
08
In
dia
1
.4
13
5
Mid
an
d L
ow
hil
ls
3.
Kali
ka
19
90
In
dia
1
.4
15
2
Tera
i, I
nn
der
Tera
i
4.
Ko
sheli
1
99
0
Ind
ia
1.6
1
54
T
era
i W
est
ern
& I
nn
er
Tera
i
5.
Sit
a
19
87
In
dia
1
.5
14
0
Tera
i
6.
Rad
ha
19
87
In
dia
1
.6
14
2
Tera
i
7.
Dh
an
ush
1
97
9
Nep
al
1.8
1
44
T
era
i
SO
YB
EA
N
1.
Pu
ja
20
06
3.1
1
25
T
era
i, I
nn
er
Tera
i an
d M
id H
ill
2.
Tark
ari
Bh
atm
as-
1
20
04
C
hin
a
11
(P
od
s)
2.3
(S
eed
)
12
0
Mid
Hil
l
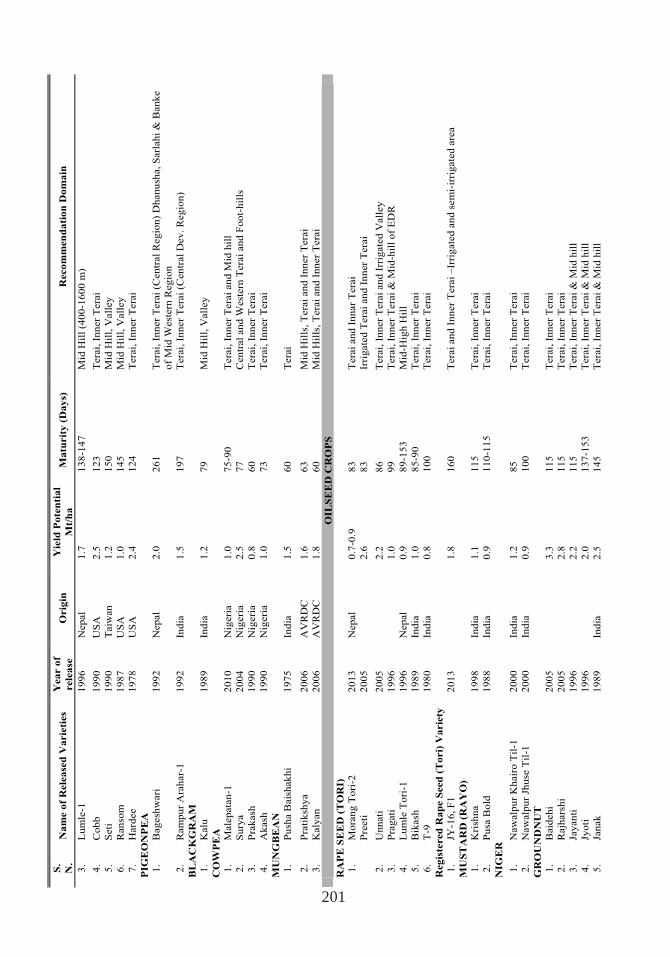
201
S.
N.
Na
me o
f R
ele
ase
d V
arie
ties
Yea
r o
f
rele
ase
O
rig
in
Yie
ld P
ote
nti
al
Mt/
ha
M
atu
rit
y (
Da
ys)
R
eco
mm
en
da
tio
n D
om
ain
3.
Lu
mle
-1
19
96
N
ep
al
1.7
1
38
-14
7
Mid
Hil
l (4
00
-16
00
m)
4.
Co
bb
1
99
0
US
A
2.5
1
23
T
era
i, I
nner
Tera
i
5.
Seti
1
99
0
Taiw
an
1
.2
15
0
Mid
Hil
l, V
all
ey
6.
Ran
som
1
98
7
US
A
1.0
1
45
M
id H
ill,
Vall
ey
7.
Hard
ee
19
78
U
SA
2
.4
12
4
Tera
i, I
nner
Tera
i
PIG
EO
NP
EA
1.
Bag
esh
wari
1
99
2
Nep
al
2.0
2
61
T
era
i, I
nn
er
Tera
i (C
en
tral
Reg
ion
) D
han
ush
a, S
arl
ah
i &
Ban
ke
of
Mid
West
ern
Reg
ion
2.
Ram
pu
r A
rah
ar-
1
19
92
In
dia
1
.5
19
7
Tera
i, I
nner
Tera
i (C
en
tral
Dev
. R
eg
ion
)
BL
AC
KG
RA
M
1.
Kalu
1
98
9
Ind
ia
1.2
7
9
Mid
Hil
l, V
all
ey
CO
WP
EA
1.
Male
pata
n-1
2
01
0
Nig
eri
a
1.0
7
5-9
0
Tera
i, I
nn
er
Tera
i an
d M
id h
ill
2.
Su
rya
20
04
N
igeri
a
2.5
7
7
Cen
tral
an
d W
est
ern
Tera
i an
d F
oo
t-h
ills
3.
Pra
kash
1
99
0
Nig
eri
a
0.8
6
0
Tera
i, I
nner
Tera
i
4.
Ak
ash
1
99
0
Nig
eri
a
1.0
7
3
Tera
i, I
nner
Tera
i
MU
NG
BE
AN
1.
Pu
sha B
ais
hak
hi
19
75
In
dia
1
.5
60
T
era
i
2.
Pra
tik
shy
a
20
06
A
VR
DC
1
.6
63
M
id H
ills
, T
era
i an
d I
nn
er
Tera
i
3.
Kaly
an
2
00
6
AV
RD
C
1.8
6
0
Mid
Hil
ls, T
era
i an
d I
nn
er
Tera
i
OIL
SE
ED
CR
OP
S
RA
PE
SE
ED
(T
OR
I)
1.
Mo
ran
g T
ori
-2
20
13
N
ep
al
0.7
-0.9
8
3
Tera
i an
d I
nn
ar
Tera
i
P
reeti
2
00
5
2
.6
83
Ir
rig
ate
d T
era
i an
d I
nn
er
Tera
i
2.
Un
nati
2
00
5
2
.2
86
T
era
i, I
nn
er
Tera
i an
d I
rrig
ate
d V
all
ey
3.
Pra
gati
1
99
6
1
.0
99
T
era
i, I
nn
er
Tera
i &
Mid
-hil
l o
f E
DR
4.
Lu
mle
To
ri-1
1
99
6
Nep
al
0.9
8
9-1
53
M
id-H
igh
Hil
l
5.
Bik
ash
1
98
9
Ind
ia
1.0
8
5-9
0
Tera
i, I
nner
Tera
i
6.
T-9
1
98
0
Ind
ia
0.8
1
00
T
era
i, I
nner
Tera
i
Regis
tered
Rap
e S
eed
(T
ori)
Varie
ty
1.
JY-1
6, F
1
20
13
1.8
1
60
T
era
i an
d I
nn
er
Tera
i –
Irri
gate
d a
nd
sem
i-ir
rig
ate
d a
rea
MU
ST
AR
D (
RA
YO
)
1.
Kri
shn
a
19
98
In
dia
1
.1
11
5
Tera
i, I
nner
Tera
i
2.
Pu
sa B
old
1
98
8
Ind
ia
0.9
1
10
-11
5
Tera
i, I
nner
Tera
i
NIG
ER
1.
Naw
alp
ur
Kh
air
o T
il-1
2
00
0
Ind
ia
1.2
8
5
Tera
i, I
nn
er
Tera
i
2.
Naw
alp
ur
Jhu
se T
il-1
2
00
0
Ind
ia
0.9
1
00
T
era
i, I
nn
er
Tera
i
GR
OU
ND
NU
T
1.
Baid
eh
i 2
00
5
3
.3
11
5
Tera
i, I
nn
er
Tera
i
2.
Rajh
ars
hi
20
05
2.8
1
15
T
era
i, I
nner
Tera
i
3.
Jay
an
ti
19
96
2.2
1
15
T
era
i, I
nn
er
Tera
i &
Mid
hil
l
4.
Jyo
ti
19
96
2.0
1
37
-15
3
Tera
i, I
nn
er
Tera
i &
Mid
hil
l
5.
Jan
ak
1
98
9
Ind
ia
2.5
1
45
T
era
i, I
nn
er
Tera
i &
Mid
hil
l
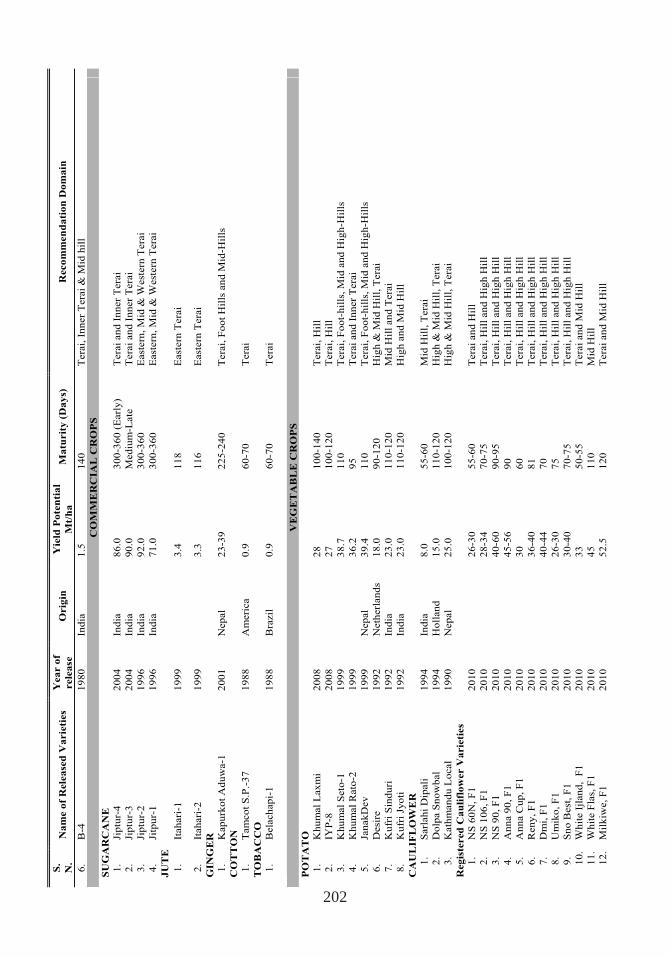
202
S.
N.
Na
me o
f R
ele
ase
d V
arie
ties
Yea
r o
f
rele
ase
O
rig
in
Yie
ld P
ote
nti
al
Mt/
ha
M
atu
rit
y (
Da
ys)
R
eco
mm
en
da
tio
n D
om
ain
6.
B-4
1
98
0
Ind
ia
1.5
1
40
T
era
i, I
nn
er
Tera
i &
Mid
hil
l
CO
MM
ER
CIA
L C
RO
PS
SU
GA
RC
AN
E
1.
Jip
tur-
4
20
04
In
dia
8
6.0
3
00
-36
0 (
Earl
y)
Tera
i an
d I
nn
er
Tera
i
2.
Jip
tur-
3
20
04
In
dia
9
0.0
M
ed
ium
-Late
T
era
i an
d I
nn
er
Tera
i
3.
Jip
tur-
2
19
96
In
dia
9
2.0
3
00
-36
0
East
ern
, M
id &
West
ern
Tera
i
4.
Jitp
ur-
1
19
96
In
dia
7
1.0
3
00
-36
0
East
ern
, M
id &
West
ern
Tera
i
JU
TE
1.
Itah
ari
-1
19
99
3.4
1
18
E
ast
ern
Tera
i
2.
Itah
ari
-2
19
99
3.3
1
16
E
ast
ern
Tera
i
GIN
GE
R
1.
Kap
urk
ot
Ad
uw
a-1
2
00
1
Nep
al
23
-39
2
25
-24
0
Tera
i, F
oo
t H
ills
an
d M
id-H
ills
CO
TT
ON
1.
Tam
co
t S
.P.-
37
1
98
8
Am
eri
ca
0.9
6
0-7
0
Tera
i
TO
BA
CC
O
1.
Bela
ch
ap
i-1
1
98
8
Bra
zil
0
.9
60
-70
T
era
i
VE
GE
TA
BL
E C
RO
PS
PO
TA
TO
1.
Kh
um
al
Lax
mi
20
08
28
1
00
-14
0
Tera
i, H
ill
2.
IYP
-8
20
08
27
1
00
-12
0
Tera
i, H
ill
3.
Kh
um
al
Seto
-1
19
99
38
.7
11
0
Tera
i, F
oo
t-h
ills
, M
id a
nd
Hig
h-H
ills
4.
Kh
um
al
Rato
-2
19
99
36
.2
95
T
era
i an
d I
nn
er
Tera
i
5.
Jan
ak
Dev
1
99
9
Nep
al
39
.4
11
0
Tera
i, F
oo
t-h
ills
, M
id a
nd
Hig
h-H
ills
6.
Desi
re
19
92
N
eth
erl
an
ds
18
.0
90
-12
0
Hig
h &
Mid
Hil
l, T
era
i
7.
Ku
fri
Sin
du
ri
19
92
In
dia
2
3.0
1
10
-12
0
Mid
Hil
l an
d T
era
i
8.
Ku
fri
Jyo
ti
19
92
In
dia
2
3.0
1
10
-12
0
Hig
h a
nd
Mid
Hil
l
CA
UL
IFL
OW
ER
1.
Sarl
ah
i D
ipali
1
99
4
Ind
ia
8.0
5
5-6
0
Mid
Hil
l, T
era
i
2.
Do
lpa S
no
wb
al
19
94
H
oll
an
d
15
.0
11
0-1
20
H
igh
& M
id H
ill,
Tera
i
3.
Kath
man
du
Lo
cal
19
90
N
ep
al
25
.0
10
0-1
20
H
igh
& M
id H
ill,
Tera
i
Reg
iste
red
Ca
uli
flo
wer V
arie
ties
1.
NS
60
N, F
1
20
10
26
-30
5
5-6
0
Tera
i an
d H
ill
2.
NS
10
6,
F1
2
01
0
2
8-3
4
70
-75
T
era
i, H
ill
an
d H
igh
Hil
l 3
.N
S 9
0, F
1
20
10
40
-60
9
0-9
5
Tera
i, H
ill
an
d H
igh
Hil
l 4
.A
nn
a 9
0,
F1
2
01
0
4
5-5
6
90
T
era
i, H
ill
an
d H
igh
Hil
l 5
.A
nn
a C
up
, F
1
20
10
30
6
0
Tera
i, H
ill
an
d H
igh
Hil
l 6
.R
en
y, F
1
20
10
36
-40
8
1
Tera
i, H
ill
an
d H
igh
Hil
l 7
.D
mi,
F1
2
01
0
4
0-4
4
70
T
era
i, H
ill
an
d H
igh
Hil
l 8
.U
mik
o, F
1
20
10
26
-30
7
5
Tera
i, H
ill
an
d H
igh
Hil
l 9
.S
no
Best
, F
1
20
10
30
-40
7
0-7
5
Tera
i, H
ill
an
d H
igh
Hil
l 1
0.
Wh
ite I
jlan
d, F
1
20
10
33
5
0-5
5
Tera
i an
d M
id H
ill
11
.W
hit
e F
las,
F1
2
01
0
4
5
11
0
Mid
Hil
l 1
2.
Mil
kiw
e, F
1
20
10
52
.5
12
0
Tera
i an
d M
id H
ill
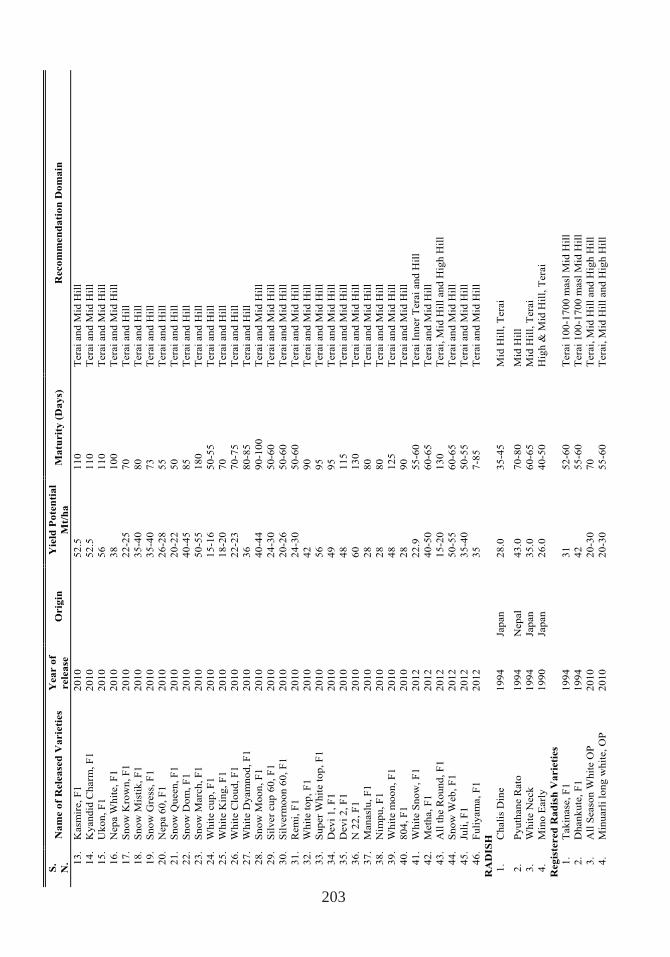
203
S.
N.
Na
me o
f R
ele
ase
d V
arie
ties
Yea
r o
f
rele
ase
O
rig
in
Yie
ld P
ote
nti
al
Mt/
ha
M
atu
rit
y (
Da
ys)
R
eco
mm
en
da
tio
n D
om
ain
13
.K
asm
ire, F
1
20
10
52
.5
11
0
Tera
i an
d M
id H
ill
14
.K
yan
did
Ch
arm
, F
1
20
10
52
.5
11
0
Tera
i an
d M
id H
ill
15
.U
ko
n,
F1
2
01
0
5
6
11
0
Tera
i an
d M
id H
ill
16
.N
ep
a W
hit
e, F
1
20
10
38
1
00
T
era
i an
d M
id H
ill
17
.S
no
w K
row
n, F
1
20
10
22
-25
7
0
Tera
i an
d H
ill
18
.S
no
w M
isti
k, F
1
20
10
35
-40
8
0
Tera
i an
d H
ill
19
.S
no
w G
ress
, F
1
20
10
35
-40
7
3
Tera
i an
d H
ill
20
.N
ep
a 6
0, F
1
20
10
26
-28
5
5
Tera
i an
d H
ill
21
.S
no
w Q
ueen
, F
1
20
10
20
-22
5
0
Tera
i an
d H
ill
22
.S
no
w D
om
, F
1
20
10
40
-45
8
5
Tera
i an
d H
ill
23
.S
no
w M
arc
h, F
1
20
10
50
-55
1
80
T
era
i an
d H
ill
24
.W
hit
e c
up
, F
1
20
10
15
-16
5
0-5
5
Tera
i an
d H
ill
25
.W
hit
e K
ing
, F
1
20
10
18
-20
7
0
Tera
i an
d H
ill
26
.W
hit
e C
lou
d, F
1
20
10
22
-23
7
0-7
5
Tera
i an
d H
ill
27
.W
hit
e D
yam
no
d, F
1
20
10
36
8
0-8
5
Tera
i an
d H
ill
28
.S
no
w M
oo
n,
F1
2
01
0
4
0-4
4
90
-10
0
Tera
i an
d M
id H
ill
29
.S
ilv
er
cu
p 6
0, F
1
20
10
24
-30
5
0-6
0
Tera
i an
d M
id H
ill
30
.S
ilv
erm
oo
n 6
0, F
1
20
10
20
-26
5
0-6
0
Tera
i an
d M
id H
ill
31
.R
em
i, F
1
20
10
24
-30
5
0-6
0
Tera
i an
d M
id H
ill
32
.W
hit
e t
op
, F
1
20
10
42
9
0
Tera
i an
d M
id H
ill
33
.S
up
er
Wh
ite t
op
, F
1
20
10
56
9
5
Tera
i an
d M
id H
ill
34
.D
ev
i 1
, F
1
20
10
49
9
5
Tera
i an
d M
id H
ill
35
.D
ev
i 2
, F
1
20
10
48
1
15
T
era
i an
d M
id H
ill
36
.N
22
, F
1
20
10
60
1
30
T
era
i an
d M
id H
ill
37
.M
an
asl
u, F
1
20
10
28
8
0
Tera
i an
d M
id H
ill
38
.N
imp
u,
F1
2
01
0
2
8
80
T
era
i an
d M
id H
ill
39
.W
hit
e m
oo
n,
F1
2
01
0
4
8
12
5
Tera
i an
d M
id H
ill
40
.8
04
, F
1
20
10
28
9
0
Tera
i an
d M
id H
ill
41
.W
hit
e S
no
w, F
1
20
12
22
.9
55
-60
T
era
i In
ner
Tera
i an
d H
ill
42
.M
eth
a, F
1
20
12
40
-50
6
0-6
5
Tera
i an
d M
id H
ill
43
.A
ll t
he R
ou
nd
, F
1
20
12
15
-20
1
30
T
era
i, M
id H
ill
an
d H
igh
Hil
l 4
4.
Sn
ow
Web
, F
1
20
12
50
-55
6
0-6
5
Tera
i an
d M
id H
ill
45
.Ju
li, F
1
20
12
35
-40
5
0-5
5
Tera
i an
d M
id H
ill
46
.F
uli
yam
a, F
1
20
12
35
7
-85
T
era
i an
d M
id H
ill
RA
DIS
H
1.
Ch
ali
s D
ine
19
94
Ja
pan
2
8.0
3
5-4
5
Mid
Hil
l, T
era
i
2.
Pyu
than
e R
ato
1
99
4
Nep
al
43
.0
70
-80
M
id H
ill
3.
Wh
ite N
eck
1
99
4
Jap
an
3
5.0
6
0-6
5
Mid
Hil
l, T
era
i
4.
Min
o E
arl
y
19
90
Ja
pan
2
6.0
4
0-5
0
Hig
h &
Mid
Hil
l, T
era
i
Reg
iste
red
Ra
dis
h V
arie
ties
1.
Tak
inase
, F
1
19
94
31
5
2-6
0
Tera
i 1
00
-17
00
masl
Mid
Hil
l
2.
Dh
an
ku
te, F
1
19
94
42
5
5-6
0
Tera
i 1
00
-17
00
masl
Mid
Hil
l
3.
All
Seaso
n W
hit
e O
P
20
10
20
-30
7
0
Tera
i, M
id H
ill
an
d H
igh
Hil
l 4
.M
inu
arl
i lo
ng
wh
ite, O
P
20
10
20
-30
5
5-6
0
Tera
i, M
id H
ill
an
d H
igh
Hil
l
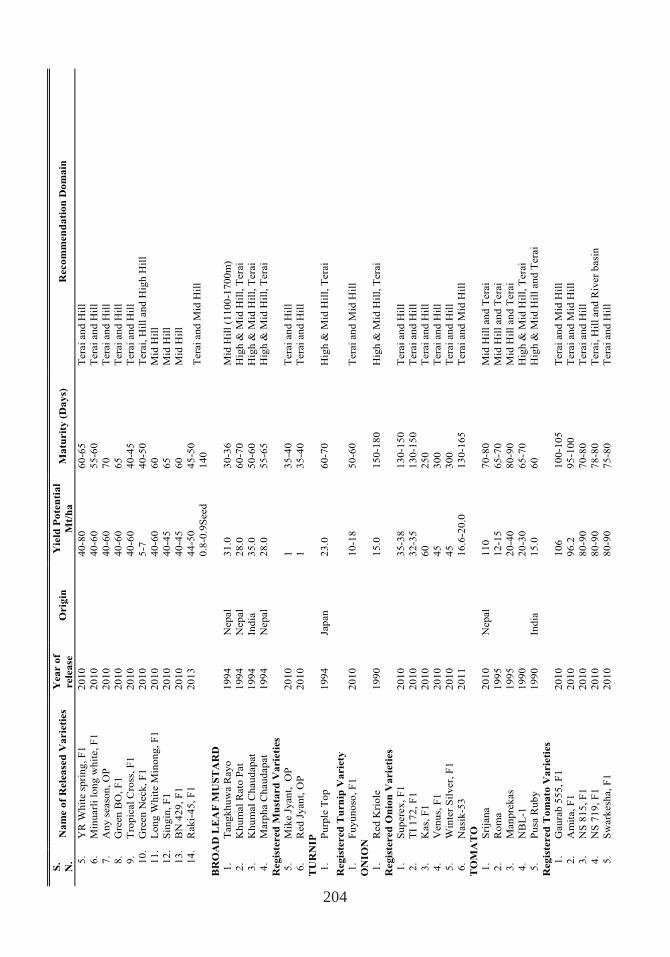
204
S.
N.
Na
me o
f R
ele
ase
d V
arie
ties
Yea
r o
f
rele
ase
O
rig
in
Yie
ld P
ote
nti
al
Mt/
ha
M
atu
rit
y (
Da
ys)
R
eco
mm
en
da
tio
n D
om
ain
5.
YR
Wh
ite s
pri
ng
, F
1
20
10
40
-80
6
0-6
5
Tera
i an
d H
ill
6.
Min
uarl
i lo
ng
wh
ite, F
1
20
10
40
-60
5
5-6
0
Tera
i an
d H
ill
7.
An
y s
easo
n, O
P
20
10
40
-60
7
0
Tera
i an
d H
ill
8.
Gre
en
BO
, F
1
20
10
40
-60
6
5
Tera
i an
d H
ill
9.
Tro
pic
al
Cro
ss, F
1
20
10
40
-60
4
0-4
5
Tera
i an
d H
ill
10
.G
reen
Neck
, F
1
20
10
5-7
4
0-5
0
Tera
i, H
ill
an
d H
igh
Hil
l 1
1.
Lo
ng
Wh
ite M
ino
ng
, F
1
20
10
40
-60
6
0
Mid
Hil
l 1
2.
Sin
gin
, F
1
20
10
40
-45
6
5
Mid
Hil
l 1
3.
BN
42
9,
F1
2
01
0
4
0-4
5
60
M
id H
ill
14
.R
ak
i-4
5, F
1
20
13
44
-50
0.8
-0.9
Seed
45
-50
14
0
Tera
i an
d M
id H
ill
BR
OA
D L
EA
F M
US
TA
RD
1.
Tan
gk
hu
wa R
ayo
1
99
4
Nep
al
31
.0
30
-36
M
id H
ill
(11
00
-17
00
m)
2.
Kh
um
al
Rato
Pat
19
94
N
ep
al
28
.0
60
-70
H
igh
& M
id H
ill,
Tera
i
3.
Kh
um
al
Ch
au
dap
at
19
94
In
dia
3
5.0
5
0-6
0
Hig
h &
Mid
Hil
l, T
era
i
4.
Marp
ha C
hau
dap
at
19
94
N
ep
al
28
.0
55
-65
H
igh
& M
id H
ill,
Tera
i
Reg
iste
red
Mu
sta
rd
Va
rie
ties
5.
Mik
e J
yant,
O
P
20
10
1
35
-40
T
era
i an
d H
ill
6.
Red
Jyan
t, O
P
20
10
1
35
-40
T
era
i an
d H
ill
TU
RN
IP
1.
Pu
rple
To
p
19
94
Ja
pan
2
3.0
6
0-7
0
Hig
h &
Mid
Hil
l, T
era
i
Reg
iste
red
Tu
rn
ip V
arie
ty
1.
Fu
yu
no
so,
F1
2
01
0
1
0-1
8
50
-60
T
era
i an
d M
id H
ill
ON
ION
1.
Red
Kri
ole
1
99
0
1
5.0
1
50
-18
0
Hig
h &
Mid
Hil
l, T
era
i
Reg
iste
red
On
ion
Va
rie
ties
1.
Su
pere
x, F
1
20
10
35
-38
1
30
-15
0
Tera
i an
d H
ill
2.
TI
17
2, F
1
20
10
32
-35
1
30
-15
0
Tera
i an
d H
ill
3.
Kas,
F1
2
01
0
6
0
25
0
Tera
i an
d H
ill
4.
Ven
us,
F1
2
01
0
4
5
30
0
Tera
i an
d H
ill
5.
Win
ter
Sil
ver,
F1
2
01
0
4
5
30
0
Tera
i an
d H
ill
6.
Nasi
k-5
3
20
11
16
.6-2
0.0
1
30
-16
5
Tera
i an
d M
id H
ill
TO
MA
TO
1.
Sri
jan
a
20
10
N
ep
al
11
0
70
-80
M
id H
ill
an
d T
era
i
2.
Ro
ma
19
95
12
-15
6
5-7
0
Mid
Hil
l an
d T
era
i
3.
Man
pre
kas
19
95
20
-40
8
0-9
0
Mid
Hil
l an
d T
era
i
4.
NB
L-1
1
99
0
2
0-3
0
65
-70
H
igh
& M
id H
ill,
Tera
i
5.
Pu
sa R
ub
y
19
90
In
dia
1
5.0
6
0
Hig
h &
Mid
Hil
l an
d T
era
i
Reg
iste
red
To
ma
to V
arie
ties
1.
Gau
rab
55
5, F
1
20
10
10
6
10
0-1
05
T
era
i an
d M
id H
ill
2.
Am
ita, F
1
20
10
96
.2
95
-10
0
Tera
i an
d M
id H
ill
3.
NS
81
5,
F1
2
01
0
8
0-9
0
70
-80
T
era
i an
d H
ill
4.
NS
71
9,
F1
2
01
0
8
0-9
0
78
-80
T
era
i, H
ill
an
d R
iver
basi
n
5.
Sw
ark
esh
a, F
1
20
10
80
-90
7
5-8
0
Tera
i an
d H
ill
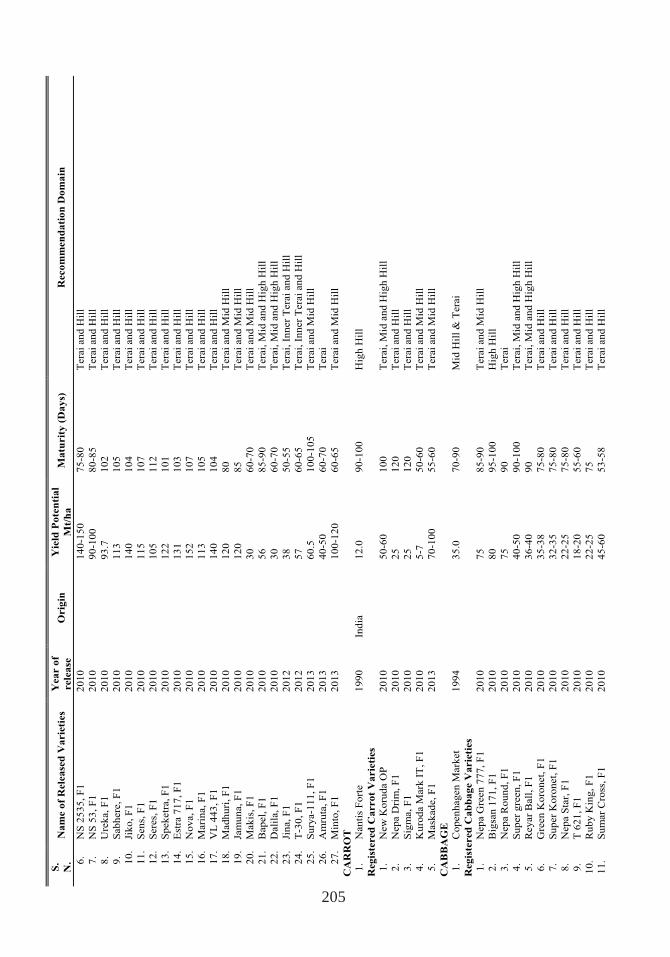
205
S.
N.
Na
me o
f R
ele
ase
d V
arie
ties
Yea
r o
f
rele
ase
O
rig
in
Yie
ld P
ote
nti
al
Mt/
ha
M
atu
rit
y (
Da
ys)
R
eco
mm
en
da
tio
n D
om
ain
6.
NS
25
35
, F
1
20
10
14
0-1
50
7
5-8
0
Tera
i an
d H
ill
7.
NS
53
, F
1
20
10
90
-10
0
80
-85
T
era
i an
d H
ill
8.
Ure
ka, F
1
20
10
93
.7
10
2
Tera
i an
d H
ill
9.
Sab
here
, F
1
20
10
11
3
10
5
Tera
i an
d H
ill
10
.Ji
ko
, F
1
20
10
14
0
10
4
Tera
i an
d H
ill
11
.S
en
s, F
1
20
10
11
5
10
7
Tera
i an
d H
ill
12
.S
ere
s, F
1
20
10
10
5
11
2
Tera
i an
d H
ill
13
.S
pek
etr
a, F
1
20
10
12
2
10
1
Tera
i an
d H
ill
14
.E
stra
71
7, F
1
20
10
13
1
10
3
Tera
i an
d H
ill
15
.N
ov
a, F
1
20
10
15
2
10
7
Tera
i an
d H
ill
16
.M
ari
na, F
1
20
10
11
3
10
5
Tera
i an
d H
ill
17
.V
L 4
43
, F
1
20
10
14
0
10
4
Tera
i an
d H
ill
18
.M
ad
hu
ri, F
1
20
10
12
0
80
T
era
i an
d M
id H
ill
19
.Ja
mu
na, F
1
20
10
12
0
85
T
era
i an
d M
id H
ill
20
.M
ak
is, F
1
20
10
30
6
0-7
0
Tera
i an
d M
id H
ill
21
.B
ap
el,
F1
2
01
0
5
6
85
-90
T
era
i, M
id a
nd
Hig
h H
ill
22
.D
ali
la, F
1
20
10
30
6
0-7
0
Tera
i, M
id a
nd
Hig
h H
ill
23
.Ji
na, F
1
20
12
38
5
0-5
5
Tera
i, I
nn
er
Tera
i an
d H
ill
24
.T
-30
, F
1
20
12
57
6
0-6
5
Tera
i, I
nn
er
Tera
i an
d H
ill
25
.S
ury
a-1
11
, F
1
20
13
60
.5
10
0-1
05
T
era
i an
d M
id H
ill
26
.A
mru
ta, F
1
20
13
40
-50
6
0-7
0
Tera
i
27
.M
into
, F
1
20
13
10
0-1
20
6
0-6
5
Tera
i an
d M
id H
ill
CA
RR
OT
1.
Nan
tis
Fo
rte
19
90
In
dia
1
2.0
9
0-1
00
H
igh
Hil
l
Reg
iste
red
Ca
rro
t V
arie
ties
1.
New
Ko
rud
a O
P
20
10
50
-60
1
00
T
era
i, M
id a
nd
Hig
h H
ill
2.
Nep
a D
rim
, F
1
20
10
25
1
20
T
era
i an
d H
ill
3.
Sig
ma, F
1
20
10
25
1
20
T
era
i an
d H
ill
4.
Ku
rod
a M
ark
IT
, F
1
20
10
5-7
5
0-6
0
Tera
i an
d M
id H
ill
5.
Mask
ad
e, F
1
20
13
7
0-1
00
5
5-6
0
Tera
i an
d M
id H
ill
CA
BB
AG
E
1.
Co
pen
hag
en
Mark
et
19
94
35
.0
70
-90
M
id H
ill
& T
era
i
Reg
iste
red
Ca
bb
ag
e V
arie
ties
1.
Nep
a G
reen
77
7, F
1
20
10
75
8
5-9
0
Tera
i an
d M
id H
ill
2.
Big
san
17
1,
F1
2
01
0
8
0
95
-10
0
Hig
h H
ill
3.
Nep
a R
ou
nd
, F
1
20
10
75
9
0
Tera
i 4
. S
up
er
gre
en
, F
1
20
10
40
-50
9
0-1
00
T
era
i, M
id a
nd
Hig
h H
ill
5.
Reyar
Ball
, F
1
20
10
36
-40
9
0
Tera
i, M
id a
nd
Hig
h H
ill
6.
Gre
en
Ko
ron
et,
F1
2
01
0
3
5-3
8
75
-80
T
era
i an
d H
ill
7.
Su
per
Ko
ron
et,
F1
2
01
0
3
2-3
5
75
-80
T
era
i an
d H
ill
8.
Nep
a S
tar,
F1
2
01
0
2
2-2
5
75
-80
T
era
i an
d H
ill
9.
T 6
21
, F
1
20
10
18
-20
5
5-6
0
Tera
i an
d H
ill
10
. R
ub
y K
ing
, F
1
20
10
22
-25
7
5
Tera
i an
d H
ill
11
. S
um
ar
Cro
ss, F
1
20
10
45
-60
5
3-5
8
Tera
i an
d H
ill
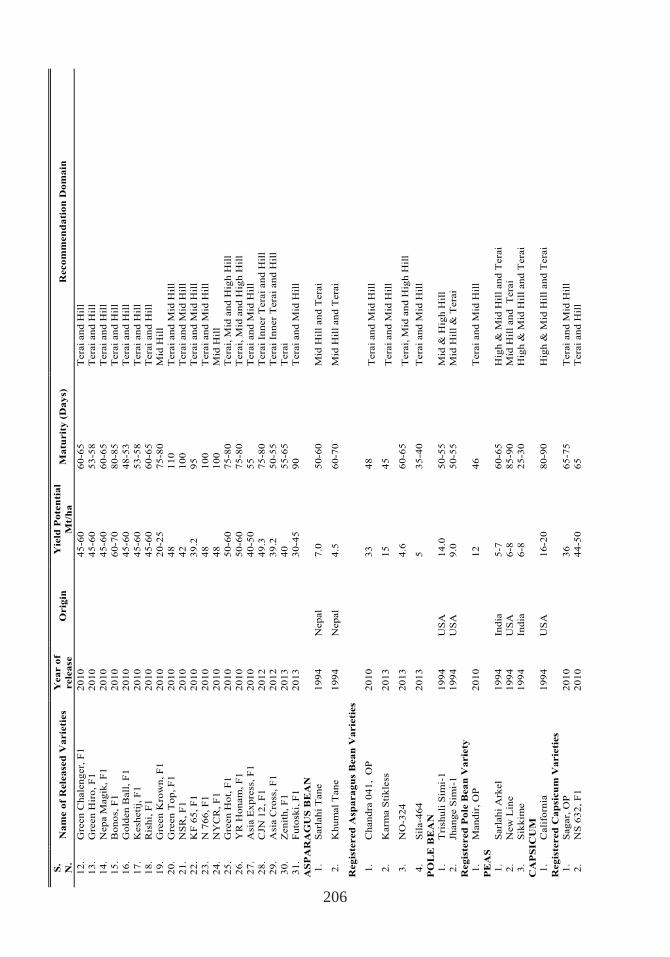
206
S.
N.
Na
me o
f R
ele
ase
d V
arie
ties
Yea
r o
f
rele
ase
Orig
in
Yie
ld P
ote
nti
al
Mt/
ha
M
atu
rit
y (
Da
ys)
R
eco
mm
en
da
tio
n D
om
ain
12
. G
reen
Ch
ale
ng
er,
F1
2
01
0
4
5-6
0
60
-65
T
era
i an
d H
ill
13
. G
reen
Hir
o, F
1
20
10
45
-60
5
3-5
8
Tera
i an
d H
ill
14
. N
ep
a M
ag
ik, F
1
20
10
45
-60
6
0-6
5
Tera
i an
d H
ill
15
. B
on
os,
F1
2
01
0
6
0-7
0
80
-85
T
era
i an
d H
ill
16
. G
old
en
Ball
, F
1
20
10
45
-60
4
8-5
3
Tera
i an
d H
ill
17
. K
esh
eti
j, F
1
20
10
45
-60
5
3-5
8
Tera
i an
d H
ill
18
. R
ish
i, F
1
20
10
45
-60
6
0-6
5
Tera
i an
d H
ill
19
. G
reen
Kro
wn
, F
1
20
10
20
-25
7
5-8
0
Mid
Hil
l
20
. G
reen
To
p, F
1
20
10
48
1
10
T
era
i an
d M
id H
ill
21
. N
SR
, F
1
20
10
42
1
00
T
era
i an
d M
id H
ill
22
. K
F 6
5, F
1
20
10
39
.2
95
T
era
i an
d M
id H
ill
23
. N
76
6, F
1
20
10
48
1
00
T
era
i an
d M
id H
ill
24
. N
YC
R, F
1
20
10
48
1
00
M
id H
ill
25
. G
reen
Ho
t, F
1
20
10
50
-60
7
5-8
0
Tera
i, M
id a
nd
Hig
h H
ill
26
. Y
R H
on
am
, F
1
20
10
50
-60
7
5-8
0
Tera
i, M
id a
nd
Hig
h H
ill
27
. A
sia E
xp
ress
, F
1
20
10
40
-50
5
5
Tera
i an
d M
id H
ill
28
. C
JN 1
2, F
1
20
12
4
9.3
7
5-8
0
Tera
i In
ner
Tera
i an
d H
ill
29
. A
sia C
ross
, F
1
20
12
3
9.2
5
0-5
5
Tera
i In
ner
Tera
i an
d H
ill
30
. Z
en
ith
, F
1
20
13
4
0
55
-65
T
era
i 3
1.
Fu
tosk
i, F
1
20
13
3
0-4
5
90
T
era
i an
d M
id H
ill
AS
PA
RA
GU
S B
EA
N
1.
Sarl
ah
i T
an
e
19
94
N
ep
al
7.0
5
0-6
0
Mid
Hil
l an
d T
era
i
2.
Kh
um
al
Tan
e
19
94
N
ep
al
4.5
6
0-7
0
Mid
Hil
l an
d T
era
i
Reg
iste
red
Asp
ara
gu
s B
ea
n V
arie
ties
1.
Ch
an
dra
04
1, O
P
20
10
33
4
8
Tera
i an
d M
id H
ill
2.
Karm
a S
tik
less
2
01
3
1
5
45
T
era
i an
d M
id H
ill
3.
NO
-32
4
20
13
4
.6
60
-65
T
era
i, M
id a
nd
Hig
h H
ill
4.
Sil
a-4
64
2
01
3
5
3
5-4
0
Tera
i an
d M
id H
ill
PO
LE
BE
AN
1.
Tri
shu
li S
imi-
1
19
94
U
SA
1
4.0
5
0-5
5
Mid
& H
igh
Hil
l
2.
Jhan
ge S
imi-
1
19
94
U
SA
9
.0
50
-55
M
id H
ill
& T
era
i
Reg
iste
red
Po
le B
ea
n V
arie
ty
1.
Man
dir
, O
P
20
10
1
2
46
T
era
i an
d M
id H
ill
PE
AS
1.
Sarl
ah
i A
rkel
19
94
In
dia
5
-7
60
-65
H
igh
& M
id H
ill
an
d T
era
i
2.
New
Lin
e
19
94
U
SA
6
-8
85
-90
M
id H
ill
an
d T
era
i
3.
Sik
kim
e
19
94
In
dia
6
-8
25
-30
H
igh
& M
id H
ill
an
d T
era
i
CA
PS
ICU
M
1.
Cali
forn
ia
19
94
U
SA
1
6-2
0
80
-90
H
igh
& M
id H
ill
an
d T
era
i
Reg
iste
red
Ca
psi
cu
m V
arie
ties
1.
Sag
ar,
OP
20
10
3
6
65
-75
T
era
i an
d M
id H
ill
2.
NS
63
2, F
1
20
10
4
4-5
0
65
T
era
i an
d H
ill
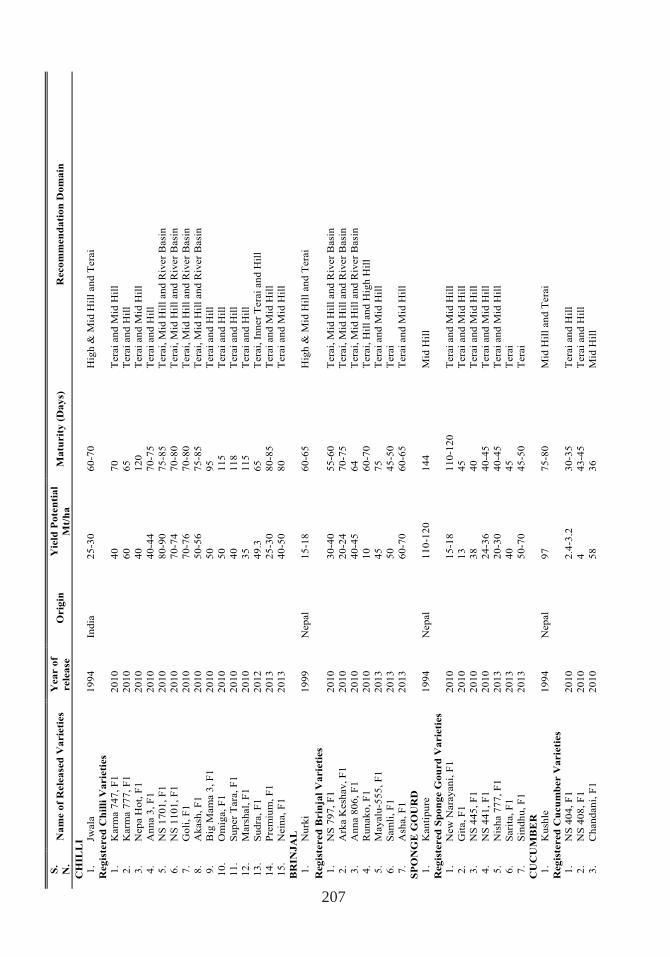
207
S.
N.
Na
me o
f R
ele
ase
d V
arie
ties
Yea
r o
f
rele
ase
O
rig
in
Yie
ld P
ote
nti
al
Mt/
ha
M
atu
rit
y (
Da
ys)
R
eco
mm
en
da
tio
n D
om
ain
CH
ILL
I
1.
Jwala
1
99
4
Ind
ia
25
-30
6
0-7
0
Hig
h &
Mid
Hil
l an
d T
era
i
Reg
iste
red
Ch
illi
Va
rie
ties
1.
Karm
a 7
47
, F
1
20
10
4
0
70
T
era
i an
d M
id H
ill
2.
Karm
a 7
77
, F
1
20
10
6
0
65
T
era
i an
d H
ill
3.
Nep
a H
ot,
F1
2
01
0
4
0
12
0
Tera
i an
d M
id H
ill
4.
An
na 3
, F
1
20
10
4
0-4
4
70
-75
T
era
i an
d H
ill
5.
NS
17
01
, F
1
20
10
8
0-9
0
75
-85
T
era
i, M
id H
ill
an
d R
iver
Basi
n
6.
NS
11
01
, F
1
20
10
7
0-7
4
70
-80
T
era
i, M
id H
ill
an
d R
iver
Basi
n
7.
Go
li, F
1
20
10
7
0-7
6
70
-80
T
era
i, M
id H
ill
an
d R
iver
Basi
n
8.
Ak
ash
, F
1
20
10
5
0-5
6
75
-85
T
era
i, M
id H
ill
an
d R
iver
Basi
n
9.
Big
Mam
a 3
, F
1
20
10
5
0
95
T
era
i an
d H
ill
10
. O
mig
a, F
1
20
10
5
0
11
5
Tera
i an
d H
ill
11
. S
up
er
Tara
, F
1
20
10
4
0
11
8
Tera
i an
d H
ill
12
. M
ars
hal,
F1
2
01
0
3
5
11
5
Tera
i an
d H
ill
13
. S
ud
ra, F
1
20
12
4
9.3
6
5
Tera
i, I
nn
er
Tera
i an
d H
ill
14
. P
rem
ium
, F
1
20
13
2
5-3
0
80
-85
T
era
i an
d M
id H
ill
15
. N
ein
a, F
1
20
13
4
0-5
0
80
T
era
i an
d M
id H
ill
BR
INJ
AL
1.
Nu
rki
19
99
N
ep
al
15
-18
6
0-6
5
Hig
h &
Mid
Hil
l an
d T
era
i
Reg
iste
red
Brin
jal
Va
rie
ties
1.
NS
79
7, F
1
20
10
3
0-4
0
55
-60
T
era
i, M
id H
ill
an
d R
iver
Basi
n
2.
Ark
a K
esh
av
, F
1
20
10
2
0-2
4
70
-75
T
era
i, M
id H
ill
an
d R
iver
Basi
n
3.
An
na 8
06
, F
1
20
10
4
0-4
5
64
T
era
i, M
id H
ill
an
d R
iver
Basi
n
4.
Ru
nak
o,
F1
2
01
0
1
0
60
-70
T
era
i, H
ill
an
d H
igh
Hil
l 5
. M
ayalu
-55
5, F
1
20
13
4
5
75
T
era
i an
d M
id H
ill
6.
Sam
li, F
1
20
13
5
0
45
-50
T
era
i
7.
Ash
a, F
1
20
13
6
0-7
0
60
-65
T
era
i an
d M
id H
ill
SP
ON
GE
GO
UR
D
1.
Kan
tip
ure
1
99
4
Nep
al
11
0-1
20
1
44
M
id H
ill
Reg
iste
red
Sp
on
ge G
ou
rd
Va
rie
ties
1.
New
Nara
yani,
F1
20
10
1
5-1
8
11
0-1
20
T
era
i an
d M
id H
ill
2.
Git
a, F
1
20
10
1
3
45
T
era
i an
d M
id H
ill
3.
NS
44
5, F
1
20
10
3
8
40
T
era
i an
d M
id H
ill
4.
NS
44
1, F
1
20
10
2
4-3
6
40
-45
T
era
i an
d M
id H
ill
5.
Nis
ha 7
77
, F
1
20
13
2
0-3
0
40
-45
T
era
i an
d M
id H
ill
6.
Sari
ta, F
1
20
13
4
0
45
T
era
i
7.
Sin
dh
u, F
1
20
13
5
0-7
0
45
-50
T
era
i
CU
CU
MB
ER
1.
Ku
shle
1
99
4
Nep
al
97
7
5-8
0
Mid
Hil
l an
d T
era
i
Reg
iste
red
Cu
cu
mb
er V
arie
ties
1.
NS
40
4, F
1
20
10
2
.4-3
.2
30
-35
T
era
i an
d H
ill
2.
NS
40
8, F
1
20
10
4
4
3-4
5
Tera
i an
d H
ill
3.
Ch
an
dan
i, F
1
20
10
5
8
36
M
id H
ill
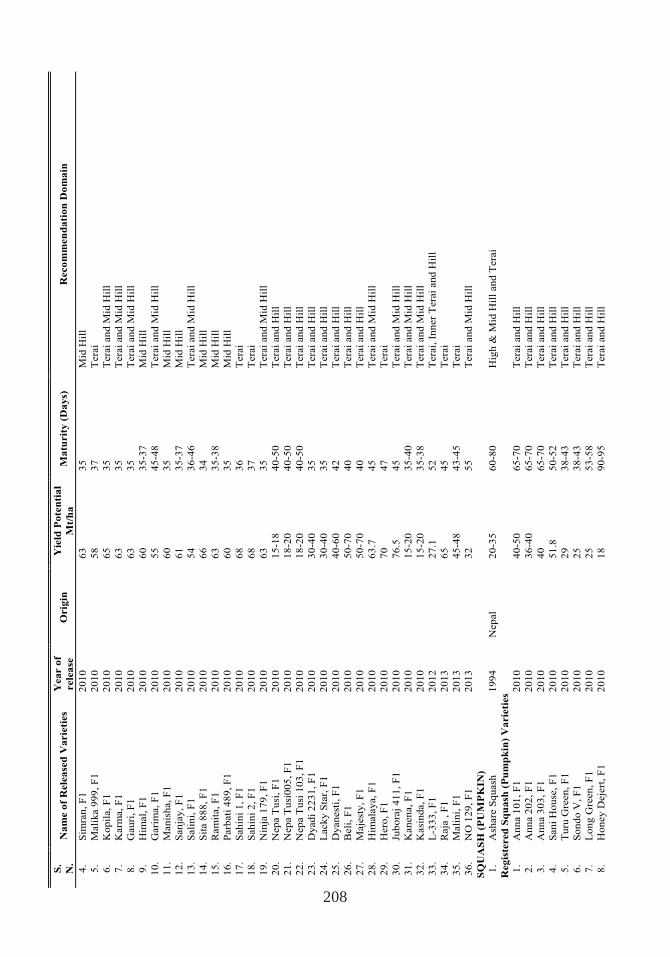
208
S.
N.
Na
me o
f R
ele
ase
d V
arie
ties
Yea
r o
f
rele
ase
O
rig
in
Yie
ld P
ote
nti
al
Mt/
ha
M
atu
rit
y (
Da
ys)
R
eco
mm
en
da
tio
n D
om
ain
4.
Sim
ran
, F
1
20
10
6
3
35
M
id H
ill
5.
Mali
ka 9
99
, F
1
20
10
5
8
37
T
era
i
6.
Ko
pil
a, F
1
20
10
6
5
35
T
era
i an
d M
id H
ill
7.
Karm
a, F
1
20
10
6
3
35
T
era
i an
d M
id H
ill
8.
Gau
ri, F
1
20
10
6
3
35
T
era
i an
d M
id H
ill
9.
Him
al,
F1
2
01
0
6
0
35
-37
M
id H
ill
10
. G
ari
ma, F
1
20
10
5
5
45
-48
T
era
i an
d M
id H
ill
11
. M
an
ish
a, F
1
20
10
6
0
35
M
id H
ill
12
. S
an
jay, F
1
20
10
6
1
35
-37
M
id H
ill
13
. S
ali
ni,
F1
2
01
0
5
4
36
-46
T
era
i an
d M
id H
ill
14
. S
ita 8
88
, F
1
20
10
6
6
34
M
id H
ill
15
. R
am
ita, F
1
20
10
6
3
35
-38
M
id H
ill
16
. P
arb
ati
48
9, F
1
20
10
6
0
35
M
id H
ill
17
. S
ah
ini
1, F
1
20
10
6
8
36
T
era
i
18
. S
ah
ini
2, F
1
20
10
6
8
37
T
era
i
19
. N
inja
17
9, F
1
20
10
6
3
35
T
era
i an
d M
id H
ill
20
. N
ep
a T
usi
, F
1
20
10
1
5-1
8
40
-50
T
era
i an
d H
ill
21
. N
ep
a T
usi
00
5, F
1
20
10
1
8-2
0
40
-50
T
era
i an
d H
ill
22
. N
ep
a T
usi
10
3, F
1
20
10
1
8-2
0
40
-50
T
era
i an
d H
ill
23
. D
yad
i 2
23
1, F
1
20
10
3
0-4
0
35
T
era
i an
d H
ill
24.
Lacky S
tar,
F1
20
10
3
0-4
0
35
T
era
i an
d H
ill
25
. D
yan
est
i, F
1
20
10
4
0-6
0
42
T
era
i an
d H
ill
26
. B
eli
, F
1
20
10
5
0-7
0
40
T
era
i an
d H
ill
27
. M
aje
sty, F
1
20
10
5
0-7
0
40
T
era
i an
d H
ill
28
. H
imala
ya, F
1
20
10
6
3.7
4
5
Tera
i an
d M
id H
ill
29
. H
ero
, F
1
20
10
7
0
47
T
era
i
30
. Ju
bo
raj
41
1,
F1
2
01
0
7
6.5
4
5
Tera
i an
d M
id H
ill
31
. K
an
en
a, F
1
20
10
1
5-2
0
35
-40
T
era
i an
d M
id H
ill
32
. K
asi
nd
a, F
1
20
10
1
5-2
0
35
-38
T
era
i an
d M
id H
ill
33
. L
-33
3, F
1
20
12
2
7.1
5
2
Tera
i, I
nn
er
Tera
i an
d H
ill
34
. R
aja
, F
1
20
13
6
5
45
T
era
i
35
. M
ali
ni,
F1
2
01
3
4
5-4
8
43
-45
T
era
i
36
. N
O 1
29
, F
1
20
13
3
2
55
T
era
i an
d M
id H
ill
SQ
UA
SH
(P
UM
PK
IN)
1.
Ash
are
Sq
uash
1
99
4
Nep
al
20
-35
6
0-8
0
Hig
h &
Mid
Hil
l an
d T
era
i
Reg
iste
red
Sq
ua
sh (
Pu
mp
kin
) V
arie
ties
1.
An
na 1
01
, F
1
20
10
4
0-5
0
65
-70
T
era
i an
d H
ill
2.
An
na 2
02
, F
1
20
10
3
6-4
0
65
-70
T
era
i an
d H
ill
3.
An
na 3
03
, F
1
20
10
4
0
65
-70
T
era
i an
d H
ill
4.
San
i H
ou
se, F
1
20
10
5
1.8
5
0-5
2
Tera
i an
d H
ill
5.
Tu
ru G
reen
, F
1
20
10
2
9
38
-43
T
era
i an
d H
ill
6.
So
nd
o V
, F
1
20
10
2
5
38
-43
T
era
i an
d H
ill
7.
Lo
ng
Gre
en
, F
1
20
10
2
5
53
-58
T
era
i an
d H
ill
8.
Ho
ney D
eje
rt, F
1
20
10
1
8
90
-95
T
era
i an
d H
ill
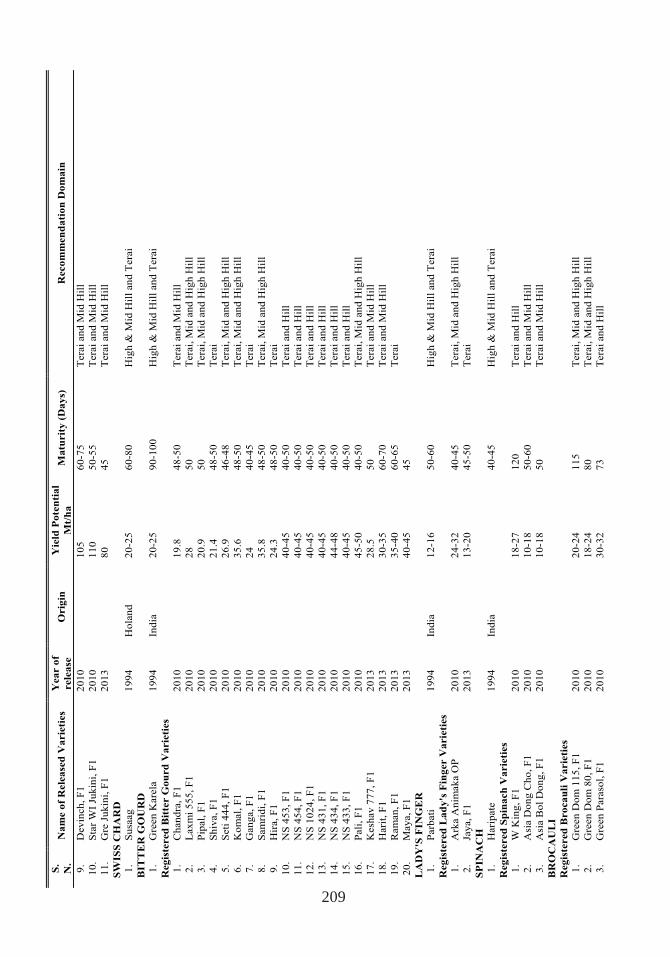
209
S.
N.
Na
me o
f R
ele
ase
d V
arie
ties
Yea
r o
f
rele
ase
O
rig
in
Yie
ld P
ote
nti
al
Mt/
ha
M
atu
rit
y (
Da
ys)
R
eco
mm
en
da
tio
n D
om
ain
9.
Dev
inch
, F
1
20
10
1
05
6
0-7
5
Tera
i an
d M
id H
ill
10
. S
tar
WI
Juk
ini,
F1
2
01
0
1
10
5
0-5
5
Tera
i an
d M
id H
ill
11
. G
re J
uk
ini,
F1
2
01
3
8
0
45
T
era
i an
d M
id H
ill
SW
ISS
CH
AR
D
1.
Su
saag
1
99
4
Ho
lan
d
20
-25
6
0-8
0
Hig
h &
Mid
Hil
l an
d T
era
i
BIT
TE
R G
OU
RD
1.
Gre
en
Kare
la
19
94
In
dia
2
0-2
5
90
-10
0
Hig
h &
Mid
Hil
l an
d T
era
i
Reg
iste
red
Bit
ter G
ou
rd
Va
rie
ties
1.
Ch
an
dra
, F
1
20
10
1
9.8
4
8-5
0
Tera
i an
d M
id H
ill
2.
Lax
mi
55
5, F
1
20
10
2
8
50
T
era
i, M
id a
nd
Hig
h H
ill
3.
Pip
al,
F1
2
01
0
2
0.9
5
0
Tera
i, M
id a
nd
Hig
h H
ill
4.
Sh
iva, F
1
20
10
2
1.4
4
8-5
0
Tera
i
5.
Seti
44
4, F
1
20
10
2
6.9
4
6-4
8
Tera
i, M
id a
nd
Hig
h H
ill
6.
Ko
mal,
F1
2
01
0
3
5.6
4
8-5
0
Tera
i, M
id a
nd
Hig
h H
ill
7.
Gan
ga, F
1
20
10
2
4
40
-45
T
era
i
8.
Sam
rid
i, F
1
20
10
3
5.8
4
8-5
0
Tera
i, M
id a
nd
Hig
h H
ill
9.
Hir
a, F
1
20
10
2
4.3
4
8-5
0
Tera
i
10
. N
S 4
53
, F
1
20
10
4
0-4
5
40
-50
T
era
i an
d H
ill
11
. N
S 4
54
, F
1
20
10
4
0-4
5
40
-50
T
era
i an
d H
ill
12
. N
S 1
02
4,
F1
2
01
0
4
0-4
5
40
-50
T
era
i an
d H
ill
13
. N
S 4
31
, F
1
20
10
4
0-4
5
40
-50
T
era
i an
d H
ill
14
. N
S 4
34
, F
1
20
10
4
4-4
8
40
-50
T
era
i an
d H
ill
15
. N
S 4
33
, F
1
20
10
4
0-4
5
40
-50
T
era
i an
d H
ill
16
. P
ali
, F
1
20
10
4
5-5
0
40
-50
T
era
i, M
id a
nd
Hig
h H
ill
17
. K
esh
av
77
7,
F1
2
01
3
2
8.5
5
0
Tera
i an
d M
id H
ill
18
. H
ari
t, F
1
20
13
3
0-3
5
60
-70
T
era
i an
d M
id H
ill
19
. R
am
an
, F
1
20
13
3
5-4
0
60
-65
T
era
i
20
. M
ay
a, F
1
20
13
4
0-4
5
45
LA
DY
'S F
ING
ER
1.
Parb
ati
1
99
4
Ind
ia
12
-16
5
0-6
0
Hig
h &
Mid
Hil
l an
d T
era
i
Reg
iste
red
La
dy
's F
ing
er V
arie
ties
1.
Ark
a A
nim
ak
a O
P
20
10
2
4-3
2
40
-45
T
era
i, M
id a
nd
Hig
h H
ill
2.
Jaya, F
1
20
13
1
3-2
0
45
-50
T
era
i
SP
INA
CH
1.
Hari
pate
1
99
4
Ind
ia
4
0-4
5
Hig
h &
Mid
Hil
l an
d T
era
i
Reg
iste
red
Sp
ina
ch
Va
rie
ties
1.
W K
ing
, F
1
20
10
1
8-2
7
12
0
Tera
i an
d H
ill
2.
Asi
a D
on
g C
ho
, F
1
20
10
1
0-1
8
50
-60
T
era
i an
d M
id H
ill
3.
Asi
a B
ol
Do
ng
, F
1
20
10
1
0-1
8
50
T
era
i an
d M
id H
ill
BR
OC
AU
LI
Reg
iste
red
Bro
ca
uli
Va
rie
ties
1.
Gre
en
Do
m 1
15
, F
1
20
10
2
0-2
4
11
5
Tera
i, M
id a
nd
Hig
h H
ill
2.
Gre
en
Do
m 8
0, F
1
20
10
1
8-2
4
80
T
era
i, M
id a
nd
Hig
h H
ill
3.
Gre
en
Para
sol,
F1
2
01
0
3
0-3
2
73
T
era
i an
d H
ill
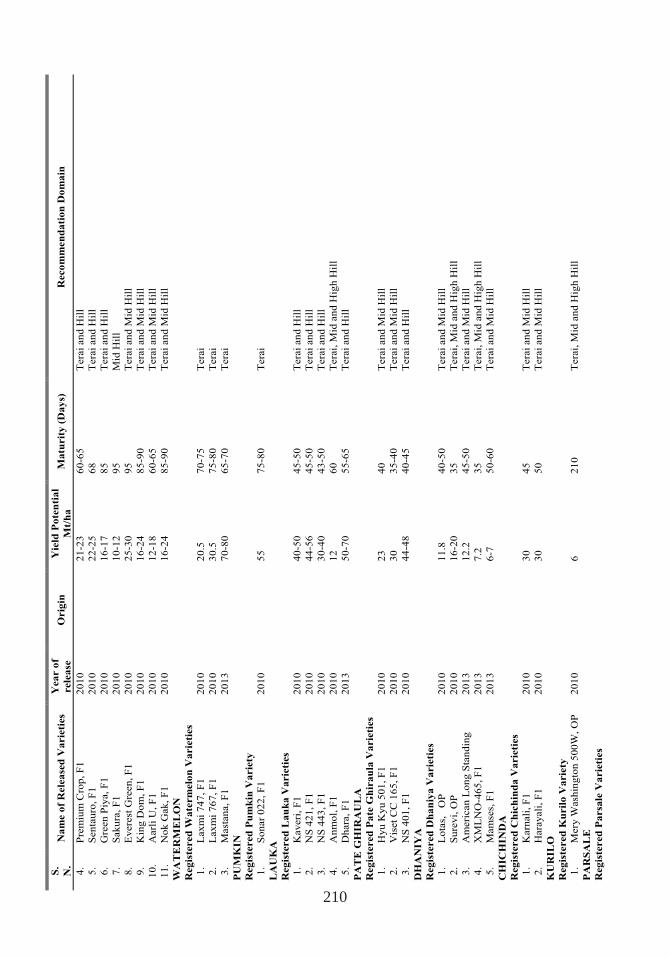
210
S.
N.
Na
me o
f R
ele
ase
d V
arie
ties
Yea
r o
f
rele
ase
O
rig
in
Yie
ld P
ote
nti
al
Mt/
ha
M
atu
rit
y (
Da
ys)
R
eco
mm
en
da
tio
n D
om
ain
4.
Pre
miu
m C
rop
, F
1
20
10
2
1-2
3
60
-65
T
era
i an
d H
ill
5.
Sen
tau
ro, F
1
20
10
2
2-2
5
68
T
era
i an
d H
ill
6.
Gre
en P
iya, F
1
20
10
1
6-1
7
85
T
era
i an
d H
ill
7.
Sak
ura
, F
1
20
10
1
0-1
2
95
M
id H
ill
8.
Ev
ere
st G
reen
, F
1
20
10
2
5-3
0
95
T
era
i an
d M
id H
ill
9.
Kin
g D
om
, F
1
20
10
1
6-2
4
85
-90
T
era
i an
d M
id H
ill
10
. A
arl
i U
, F
1
20
10
1
2-1
8
60
-65
T
era
i an
d M
id H
ill
11
. N
ok
Gak
, F
1
20
10
1
6-2
4
85
-90
T
era
i an
d M
id H
ill
WA
TE
RM
EL
ON
Reg
iste
red
Wa
term
elo
n V
arie
ties
1.
Lax
mi
74
7, F
1
20
10
2
0.5
7
0-7
5
Tera
i
2.
Lax
mi
76
7, F
1
20
10
3
0.5
7
5-8
0
Tera
i
3.
Mast
an
a, F
1
20
13
7
0-8
0
65
-70
T
era
i
PU
MK
IN
Reg
iste
red
Pu
mk
in V
arie
ty
1.
So
nar
02
2, F
1
20
10
5
5
75
-80
T
era
i
LA
UK
A
Reg
iste
red
La
uk
a V
arie
ties
1.
Kav
eri
, F
1
20
10
4
0-5
0
45
-50
T
era
i an
d H
ill
2.
NS
42
1, F
1
20
10
4
4-5
6
45
-50
T
era
i an
d H
ill
3.
NS
44
3, F
1
20
10
3
0-4
0
43
-50
T
era
i an
d H
ill
4.
An
mo
l, F
1
20
10
1
2
60
T
era
i, M
id a
nd
Hig
h H
ill
5.
Dh
ara
, F
1
20
13
5
0-7
0
55
-65
T
era
i an
d H
ill
PA
TE
GH
IRA
UL
A
Reg
iste
red
Pa
te G
hir
au
la V
arie
ties
1.
Hyu
Kyu
50
1, F
1
20
10
2
3
40
T
era
i an
d M
id H
ill
2.
Vis
et
CC
16
5, F
1
20
10
3
0
35
-40
T
era
i an
d M
id H
ill
3.
NS
40
1, F
1
20
10
4
4-4
8
40
-45
T
era
i an
d H
ill
DH
AN
IYA
Reg
iste
red
Dh
an
iya
Va
rie
ties
1.
Lota
s, O
P
20
10
1
1.8
4
0-5
0
Tera
i an
d M
id H
ill
2.
Su
rev
i, O
P
20
10
1
6-2
0
35
T
era
i, M
id a
nd
Hig
h H
ill
3.
Am
eri
can
Lo
ng
Sta
nd
ing
2
01
3
1
2.2
4
5-5
0
Tera
i an
d M
id H
ill
4.
XM
LN
O-4
65
, F
1
20
13
7
.2
35
T
era
i, M
id a
nd
Hig
h H
ill
5.
Mam
ses,
F1
2
01
3
6
-7
50
-60
T
era
i an
d M
id H
ill
CH
ICH
IND
A
Reg
iste
red
Ch
ich
ind
a V
arie
ties
1.
Karn
ali
, F
1
20
10
3
0
45
T
era
i an
d M
id H
ill
2.
Hara
yali
, F
1
20
10
3
0
50
T
era
i an
d M
id H
ill
KU
RIL
O
Reg
iste
red
Ku
ril
o V
arie
ty
1.
Mery
Wash
ing
ton
50
0W
, O
P
20
10
6
2
10
T
era
i, M
id a
nd
Hig
h H
ill
PA
RS
AL
E
Reg
iste
red
Pa
rsa
le V
arie
ties
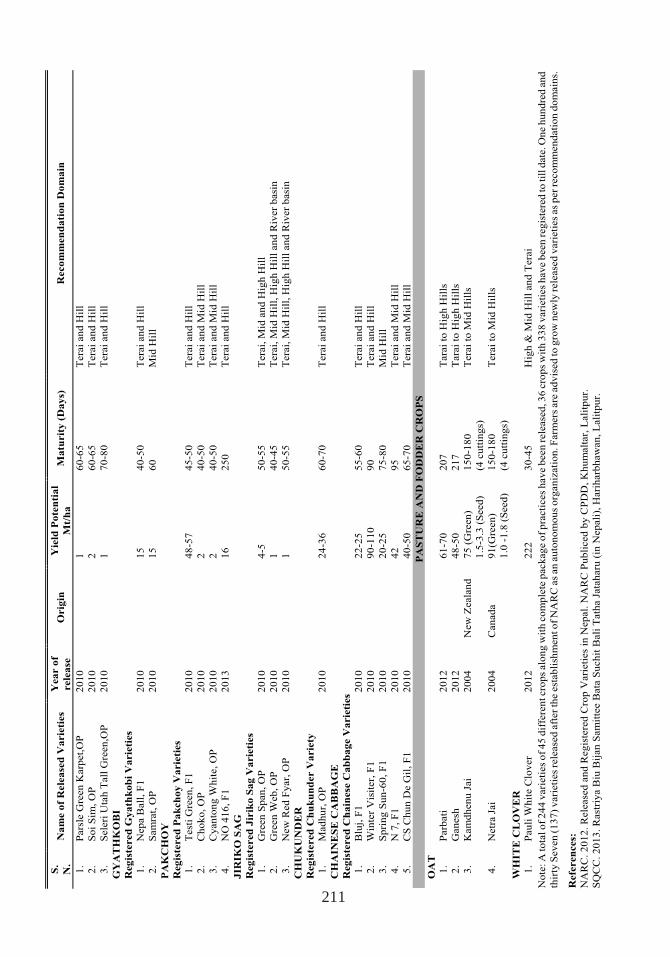
211
S.
N.
Na
me o
f R
ele
ase
d V
arie
ties
Yea
r o
f
rele
ase
O
rig
in
Yie
ld P
ote
nti
al
Mt/
ha
M
atu
rit
y (
Da
ys)
R
eco
mm
en
da
tio
n D
om
ain
1.
Pars
le G
reen K
arp
et,
OP
20
10
1
6
0-6
5
Tera
i an
d H
ill
2.
So
i S
im, O
P
20
10
2
6
0-6
5
Tera
i an
d H
ill
3.
Sele
ri U
tah T
all
Gre
en,O
P
20
10
1
7
0-8
0
Tera
i an
d H
ill
GY
AT
HK
OB
I
Reg
iste
red
Gy
ath
ko
bi
Va
rie
ties
1.
Nep
a B
all
, F
1
20
10
1
5
40
-50
T
era
i an
d H
ill
2.
Sam
rat,
OP
2
01
0
1
5
60
M
id H
ill
PA
KC
HO
Y
Reg
iste
red
Pa
kch
oy
Va
rie
ties
1.
Test
i G
reen
, F
1
20
10
4
8-5
7
45
-50
T
era
i an
d H
ill
2.
Ch
ok
o, O
P
20
10
2
4
0-5
0
Tera
i an
d M
id H
ill
3.
Cyan
ton
g W
hit
e, O
P
20
10
2
4
0-5
0
Tera
i an
d M
id H
ill
4.
NO
41
6, F
1
20
13
1
6
25
0
Tera
i an
d H
ill
JIR
IKO
SA
G
Reg
iste
red
Jir
iko
Sa
g V
arie
ties
1.
Gre
en
Sp
an
, O
P
20
10
4
-5
50
-55
T
era
i, M
id a
nd
Hig
h H
ill
2.
Gre
en
Web
, O
P
20
10
1
4
0-4
5
Tera
i, M
id H
ill,
Hig
h H
ill
an
d R
iver
basi
n
3.
New
Red
Fy
ar,
OP
20
10
1
5
0-5
5
Tera
i, M
id H
ill,
Hig
h H
ill
an
d R
iver
basi
n
CH
UK
UN
DE
R
Reg
iste
red
Ch
uk
un
der V
arie
ty
1.
Mad
hu
r, O
P
20
10
2
4-3
6
60
-70
T
era
i an
d H
ill
CH
AIN
ES
E C
AB
BA
GE
Reg
iste
red
Ch
ain
ese
Ca
bb
ag
e V
arie
ties
1.
Blu
j, F
1
20
10
2
2-2
5
55
-60
T
era
i an
d H
ill
2.
Win
ter
Vis
iter,
F1
2
01
0
9
0-1
10
9
0
Tera
i an
d H
ill
3.
Sp
rin
g S
un
-60
, F
1
20
10
2
0-2
5
75
-80
M
id H
ill
4.
N 7
, F
1
20
10
4
2
95
T
era
i an
d M
id H
ill
5.
CS
Ch
un
De G
il, F
1
20
10
4
0-5
0
65
-70
T
era
i an
d M
id H
ill
PA
ST
UR
E A
ND
FO
DD
ER
CR
OP
S
OA
T
1.
Parb
ati
2
01
2
6
1-7
0
20
7
Tara
i to
Hig
h H
ills
2.
Gan
esh
2
01
2
4
8-5
0
21
7
Tara
i to
Hig
h H
ills
3.
Kam
dh
en
u J
ai
20
04
N
ew
Zeala
nd
7
5 (
Gre
en
)
1.5
-3.3
(S
eed
)
15
0-1
80
(4 c
utt
ing
s)
Tera
i to
Mid
Hil
ls
4.
Netr
a J
ai
20
04
C
an
ad
a
91
(Gre
en
)
1.0
-1
.8 (
Seed
)
15
0-1
80
(4 c
utt
ing
s)
Tera
i to
Mid
Hil
ls
WH
ITE
CL
OV
ER
1.
Pau
li W
hit
e C
lov
er
20
12
22
2
30
-45
H
igh
& M
id H
ill
an
d T
era
i N
ote
: A
to
tal o
f 2
44
vari
eti
es
of
45
dif
fere
nt cro
ps
alo
ng
wit
h c
om
ple
te p
ack
ag
e o
f p
racti
ces
hav
e b
een
rele
ase
d, 3
6 c
rop
s w
ith 3
38 v
ari
eti
es
have b
een r
egis
tere
d to til
l date
. One h
undre
d a
nd
thir
ty S
ev
en
(1
37
) v
ari
eti
es
rele
ase
d a
fter
the e
stab
lish
men
t o
f N
AR
C a
s an
au
ton
om
ou
s o
rgan
izati
on
. F
arm
ers
are
ad
vis
ed
to
gro
w n
ew
ly r
ele
ase
d v
ari
eti
es
as
per
reco
mm
en
dati
on
do
main
s.
Refe
ren
ces:
NA
RC
. 2
01
2. R
ele
ase
d a
nd
Reg
iste
red
Cro
p V
ari
eti
es
in N
ep
al.
NA
RC
Pu
bli
ced
by
CP
DD
, K
hu
malt
ar,
Lali
tpu
r.
SQ
CC
. 2
01
3. R
ast
riy
a B
iu B
ijan
Sam
itte
e B
ata
Su
ch
it B
ali
Tath
a J
ata
haru
(in
Nep
ali
), H
ari
harb
haw
an
, L
ali
tpu
r.
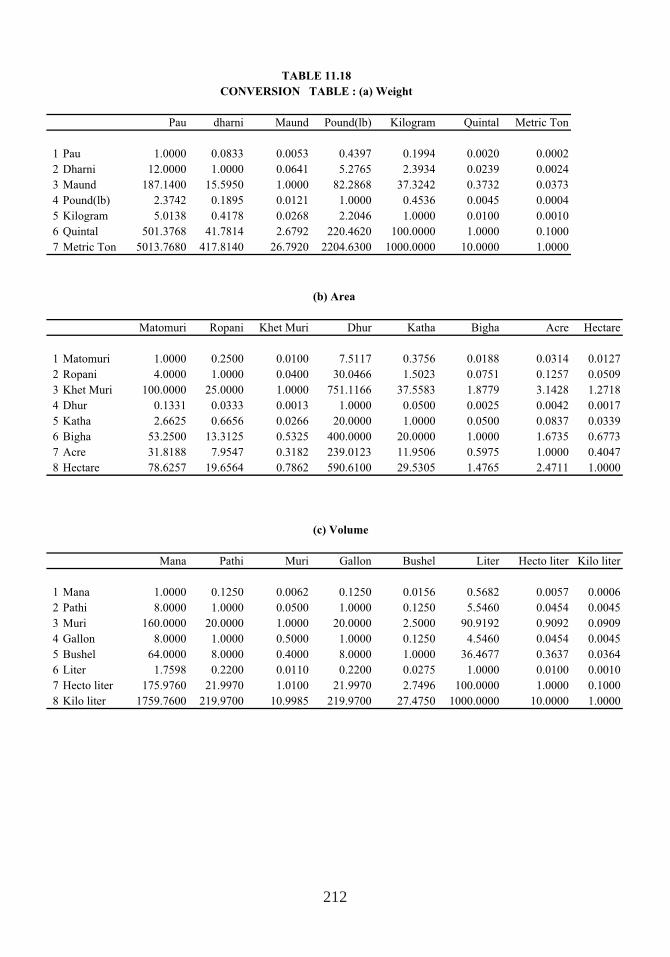
212
Pau dharni Maund Pound(lb) Kilogram Quintal Metric Ton
1 Pau 1.0000 0.0833 0.0053 0.4397 0.1994 0.0020 0.0002
2 Dharni 12.0000 1.0000 0.0641 5.2765 2.3934 0.0239 0.0024
3 Maund 187.1400 15.5950 1.0000 82.2868 37.3242 0.3732 0.0373
4 Pound(lb) 2.3742 0.1895 0.0121 1.0000 0.4536 0.0045 0.0004
5 Kilogram 5.0138 0.4178 0.0268 2.2046 1.0000 0.0100 0.0010
6 Quintal 501.3768 41.7814 2.6792 220.4620 100.0000 1.0000 0.1000
7 Metric Ton 5013.7680 417.8140 26.7920 2204.6300 1000.0000 10.0000 1.0000
(b) Area
Matomuri Ropani Khet Muri Dhur Katha Bigha Acre Hectare
1 Matomuri 1.0000 0.2500 0.0100 7.5117 0.3756 0.0188 0.0314 0.0127
2 Ropani 4.0000 1.0000 0.0400 30.0466 1.5023 0.0751 0.1257 0.0509
3 Khet Muri 100.0000 25.0000 1.0000 751.1166 37.5583 1.8779 3.1428 1.2718
4 Dhur 0.1331 0.0333 0.0013 1.0000 0.0500 0.0025 0.0042 0.0017
5 Katha 2.6625 0.6656 0.0266 20.0000 1.0000 0.0500 0.0837 0.0339
6 Bigha 53.2500 13.3125 0.5325 400.0000 20.0000 1.0000 1.6735 0.6773
7 Acre 31.8188 7.9547 0.3182 239.0123 11.9506 0.5975 1.0000 0.4047
8 Hectare 78.6257 19.6564 0.7862 590.6100 29.5305 1.4765 2.4711 1.0000
(c) Volume
Mana Pathi Muri Gallon Bushel Liter Hecto liter Kilo liter
1 Mana 1.0000 0.1250 0.0062 0.1250 0.0156 0.5682 0.0057 0.0006
2 Pathi 8.0000 1.0000 0.0500 1.0000 0.1250 5.5460 0.0454 0.0045
3 Muri 160.0000 20.0000 1.0000 20.0000 2.5000 90.9192 0.9092 0.0909
4 Gallon 8.0000 1.0000 0.5000 1.0000 0.1250 4.5460 0.0454 0.0045
5 Bushel 64.0000 8.0000 0.4000 8.0000 1.0000 36.4677 0.3637 0.0364
6 Liter 1.7598 0.2200 0.0110 0.2200 0.0275 1.0000 0.0100 0.0010
7 Hecto liter 175.9760 21.9970 1.0100 21.9970 2.7496 100.0000 1.0000 0.1000
8 Kilo liter 1759.7600 219.9700 10.9985 219.9700 27.4750 1000.0000 10.0000 1.0000
TABLE 11.18
CONVERSION TABLE : (a) Weight