
Statistical Consideration for Identification and Quantification in Top-Down Proteomics Richard LeDuc...
19
Statistical Consideration for Identification and Quantification in Top- Down Proteomics Richard LeDuc National Center for Genome Analysis Support Discovery Omics with Top Down Proteomics
-
Upload
antony-harris -
Category
Documents
-
view
222 -
download
2
Transcript of Statistical Consideration for Identification and Quantification in Top-Down Proteomics Richard LeDuc...

Statistical Consideration for Identification and Quantification
in Top-Down Proteomics
Richard LeDuc National Center for Genome Analysis Support
Discovery Omics withTop Down Proteomics

Acknowledgements
• Leonid Zamdborg• Shannee Babai• Bryon Early• Ian Spauling• Kevin Glowacz• Eric Bluhm• Vinayak Viswanathan• Yong-Bin Kim• Ryan Fellers• Tom Januszyk• Brian Cis• Chris Strouse• Seyoung Sohn• Greg Taylor• Joe Sola• Lee Bynum• Andrew Birck
All the other numerous members of the KRG who have contributed insights over the years.
Drs. Neil Kelleher, Paul Thomas, and Andy Forbes, and ProSight Development Team (past and present)
Yury Bukhman, James McCurdy, Adam Halstead, Irene Ong (Area 3), Mary Lipton (PNNL), Kathryn Richmond (Enabling Technologies) and others
Proteomics CoreReid TownsendPetra GilmoreCheryl LichtiJames MaloneAlan Davis
Michael Gross (NCRR Mass Spec)Henry Rohrs (NCRR Mass Spec)Ron Bose (Oncology)Mike Boyne (FDA)Jeffry Hiken (Genetics)
Le-Shin Wu, Carrie Ganote,Tom Doak,Bill Barnett, and a cast of thousands
Limbrick LaboratoryDavid LimbrickDiego Morales
Holtzman LaboratoryDavid HoltzmanRick PerrinJacqueline PaytonChengjie Xiong (Biostatistics)
National Center for Genome Analysis Support
Washington Univ. School of Medicine
The Kelleher Research Group
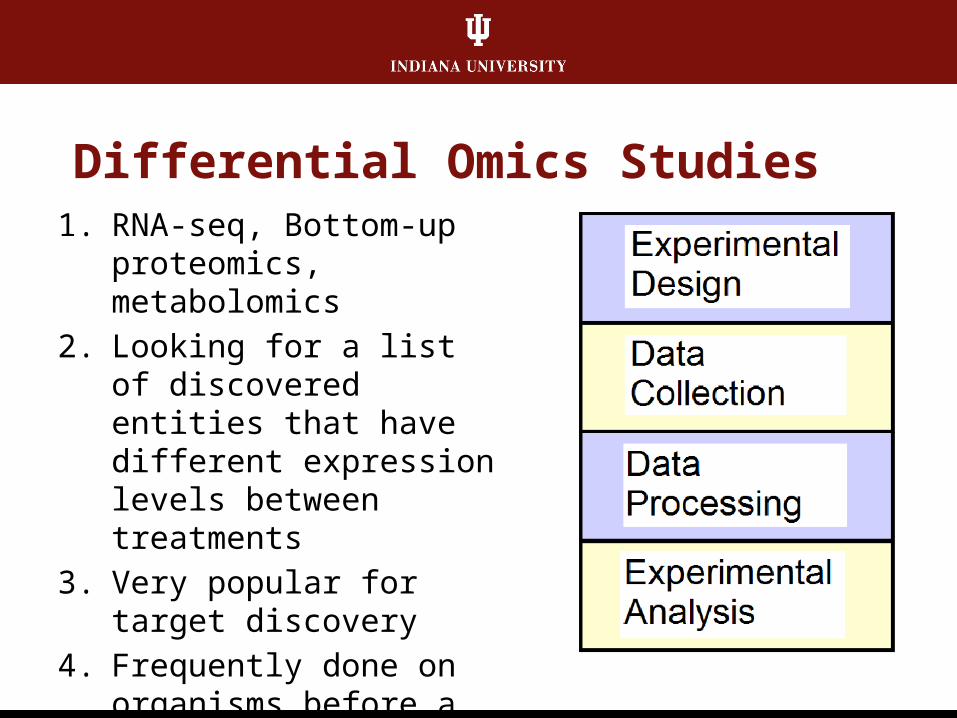
Differential Omics Studies1. RNA-seq, Bottom-up
proteomics, metabolomics
2. Looking for a list of discovered entities that have different expression levels between treatments
3. Very popular for target discovery
4. Frequently done on organisms before a genome is completed

‘P score’ = Pf,n =(xf)n x e-xf
n!
f is the # of input fragment ions,
n is the # of matches,
Ma is the Mass Accuracy
2211.111
1 aMx
1
0
1n
ifn
i
nifncrude ppp
F. Meng, B. Cargile, L. Miller, J. Johnson, and N. Kelleher, Nat. Biotechnol., 2001, 19, 952-957.
“Kelleher P-Score” Example

Modeling the Scrambled P-Scores
Motivation Goodness of Fit
9,839 MS/MS Queries (MS1 and MS2 data)
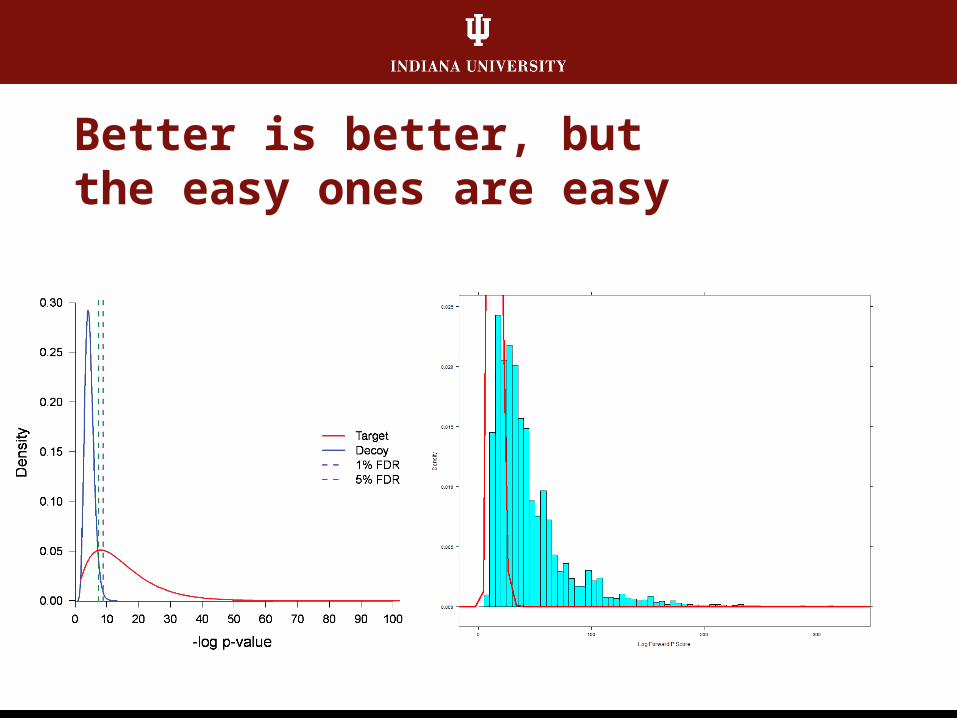
Better is better, butthe easy ones are easy

Computers Ask the Darndest Questions

Top Down Proteomics!• Three pillars of proteomics:
• Identification• Characterization• Quantification.
• Top down proteomic studies are underway.
• These are large and complex studies(At several institutions, a typical production bottom-up study would have 200+ LC runs)

Top Down Proteomics BiometricsSources of
1. Intensity calculation
2. LC alignment
3. Mass Spec Physics
4. SeparationDifferent fractions etc.
5. Protein IsolationChIP, RBC ghosts etc
6. Tissue variation
7. Individual variation
8. Population variation
9. Random and systemic errors

Experimental Design
• Ronald A. Fisher (1926) : "The Arrangement of Field Experiments“
• All measurements have errors• All biological systems have
individual variation
• The goal of experimental design is to design the experiment so that the variation can be partitioned
• Typically testing variation between groups against the variation within
Healthy Group
Sub 1 Sub 2
R1 R2 R3 R4 R5 R7R6 R8
Diseased Group
Sub 1 Sub 2
R1 R2 R3 R4 R5 R7R6 R8

Control Samples PNH Samples
1
0
-1
-2
-3
3
2
1 642 8 10 1211 133 5 7 9
RAP1A
Coomassie
Catalase
Peroxiredoxin
250150100755037
2025
2025
10075
50
CON_
1CO
N_6
PNH_
9PN
H_10
Typical Results: Human RBC Ghosts
Control Samples
PNH Samples
RAP1A

Populations of Experiments• Instead of doing 1
experiment, you are doing an unknown number of experiments
• Number of experiments determined by how many unique entities are observed consistently over the entire set of observations
Control Samples
PNH Samples

Typical Results: Breast Cancer Model

Sources of Variation: The Model
ijklijkijiijkl erdaI )()(Wherei=1 or 2 and represents the two preparations,j = 1 to 3 for each digestion within a given
preparation,k = 1 to 3 for each injection (or run) within each
digestionl = 1 to the number of peptides for the given protein.
Under this model, let
residuals theis e
npreperatio i thefrom digestion random j thefrom run random k for theeffect theis r
npreperatio i thefrom digestion random j for theeffect theis d
npreparatio random i for theeffect theis a
ijkl
thththk(ij)
ththj(i)
thi

Variance Component Estimates

Power Calculations
Hum
an
Sub
ject
s
Power Curves for High Subject Low Residual Variation
0
0.1
0.2
0.3
0.4
0.5
0.6
0.7
0.8
0.9
1
0 0.5 1 1.5 2 2.5Effect Size (in STD)
Pow
er
n=20
n=5
Inbreed Mice

Systems Analysis• What to do with the laundry lists
of significant genes?• Gene Ontology Analysis• Gene Set Enrichment Analysis
• Often paired with RNA or metabolomic data.
• Creates a third level of analysis

To Review
• Everything is in place for top-down proteomic studies.
• In any discovery omic study, extreme care must be taken – lots of pilot work to understand the behavior of your analytic system
• Technology and mathematical formalism does not trump biology. (Bad experimental design results in bad experiments)

• Funded by National Science Foundation1. Large memory clusters for assembly
2. Bioinformatics consulting for biologists
3. Optimized software for better efficiency
• Partner Institutions:• Extreme Science and Engineering Discovery Environment (XSEDE)• Texas Advanced Computing Center (TACC) at the University of Texas at
Austin• San Diego Supercomputer Center (SDSC) at the University of California, San
Diego.• Pittsburgh Supercomputing Center (PSC)
• Open for business at: http://ncgas.org
Sh
amel
ess
NC
GA
S P
lug
Questions?

![[ 4th InternatIonal SympoSIum ] · 2008-04-25 · Analysis & Quantification of Diagnostic Plasma Markers ... Metabolic Profiling [ proGram ] New IMS-MS Technologies for Proteomics](https://static.fdocuments.net/doc/165x107/5f8d7d5eeaebff027b23dc42/-4th-international-symposium-2008-04-25-analysis-quantification-of-diagnostic.jpg)
![ProCon – Proteomics Conversion Tool · With ProCon you can convert proteomics identification and quantification results into HUPO standard formats [1, 2], which can be used to upload](https://static.fdocuments.net/doc/165x107/601b565d5f4f7e573f0e913f/procon-a-proteomics-conversion-tool-with-procon-you-can-convert-proteomics-identification.jpg)


![A Review on Quantitative Multiplexed Proteomics...A Review on Quantitative Multiplexed Proteomics Nishant Pappireddi, [a, b] ... Protein Identification and Quantification in Mass Spectrometry-Based](https://static.fdocuments.net/doc/165x107/5e7f3f3acedae249de4f489a/a-review-on-quantitative-multiplexed-proteomics-a-review-on-quantitative-multiplexed.jpg)


