
Statistical challenges for reproducibility in neuro-imaging Materials... · Statistical challenges...
25
Statistical challenges for reproducibility in neuro-imaging Cyril Pernet, University of Edinburgh, UK [email protected] @ CyrilRPernet
Transcript of Statistical challenges for reproducibility in neuro-imaging Materials... · Statistical challenges...

Statistical challenges for reproducibility in neuro-imaging
Cyril Pernet, University of Edinburgh, UK
[email protected]@CyrilRPernet
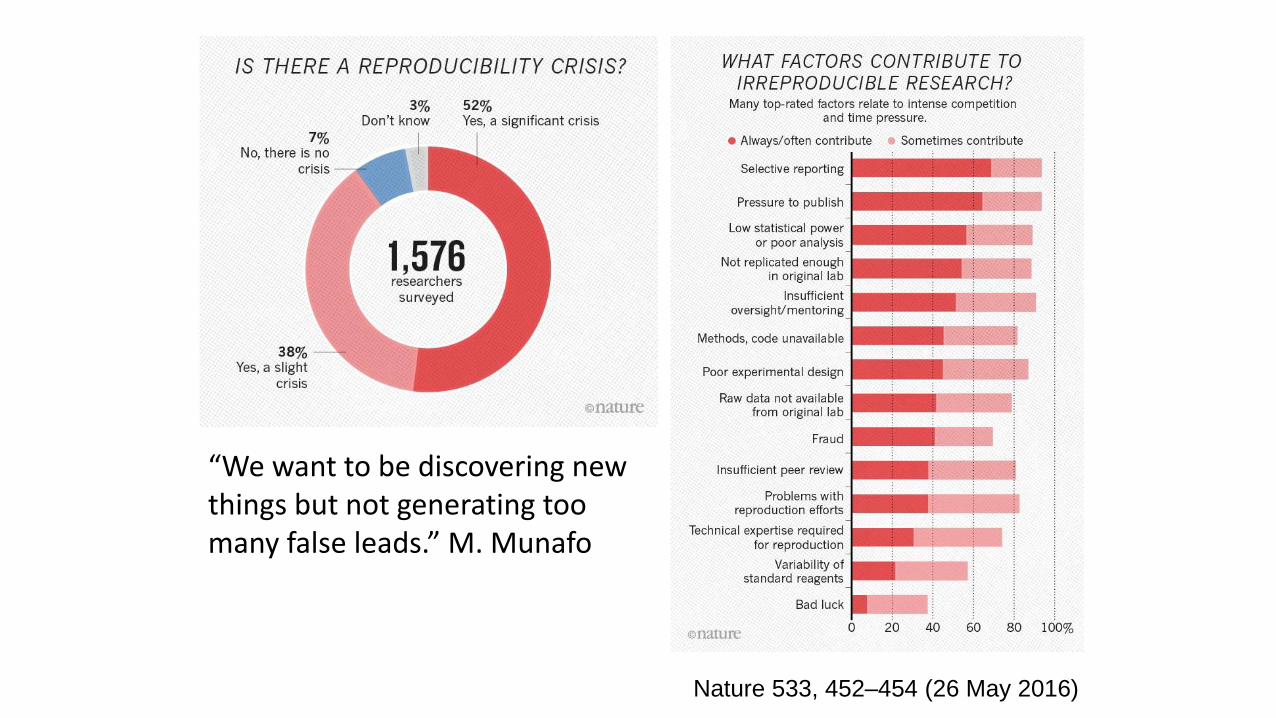
Nature 533, 452–454 (26 May 2016)
“We want to be discovering new things but not generating too many false leads.” M. Munafo
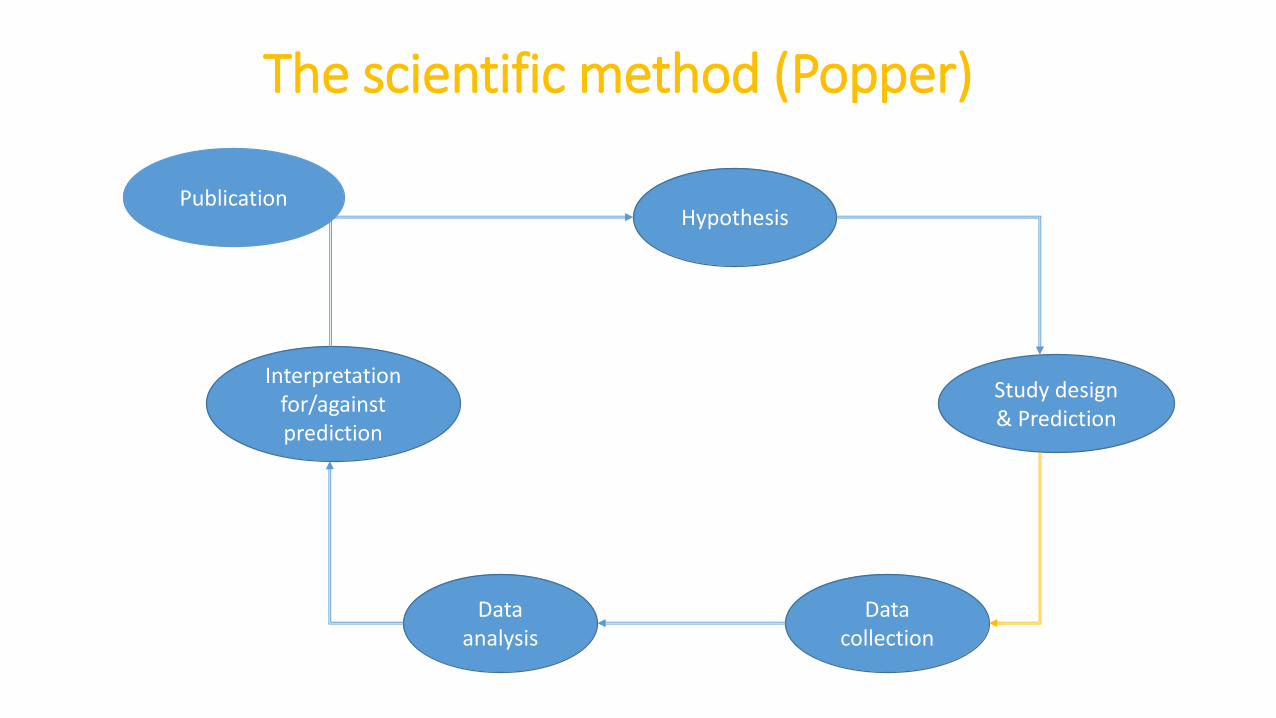
The scientific method (Popper)
Hypothesis
Study design& Prediction
Data collection
Data analysis
Interpretation for/against prediction
Publication
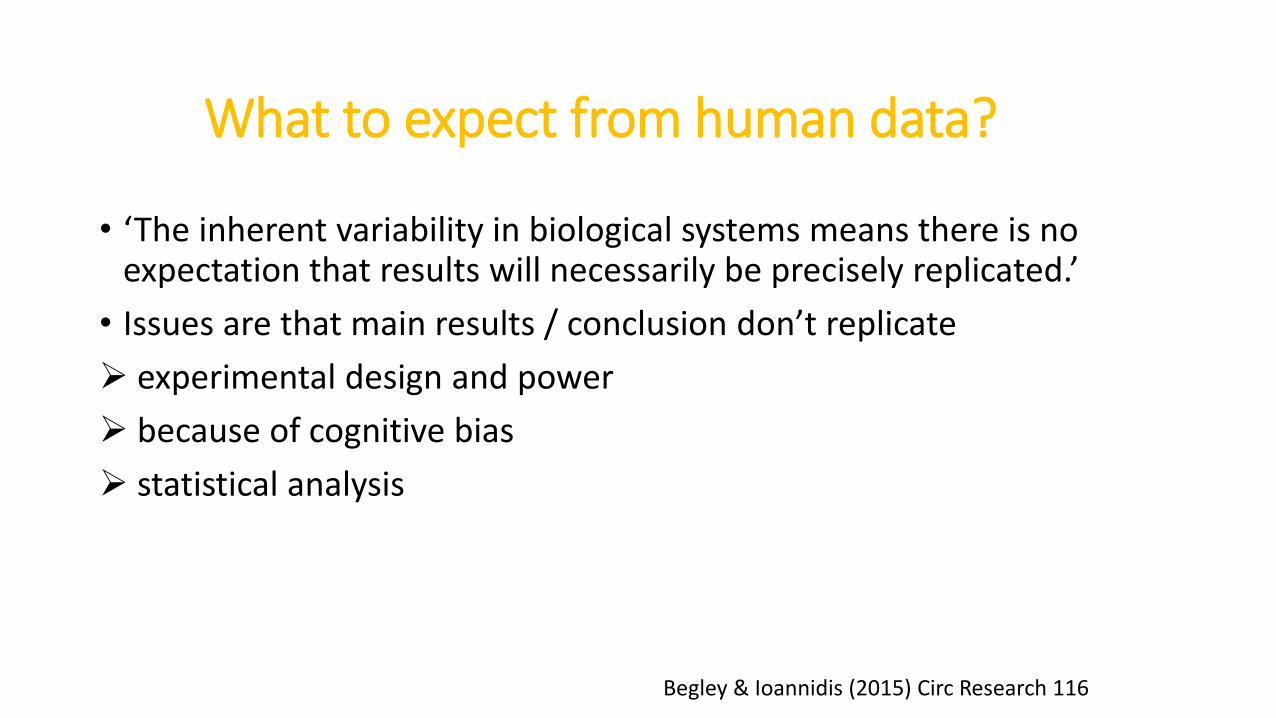
What to expect from human data?
• ‘The inherent variability in biological systems means there is no expectation that results will necessarily be precisely replicated.’
• Issues are that main results / conclusion don’t replicate
experimental design and power
because of cognitive bias
statistical analysis
Begley & Ioannidis (2015) Circ Research 116
Hypothesis
Study design& Prediction
Data collection
Data analysis
Interpretation for/against prediction
Publication
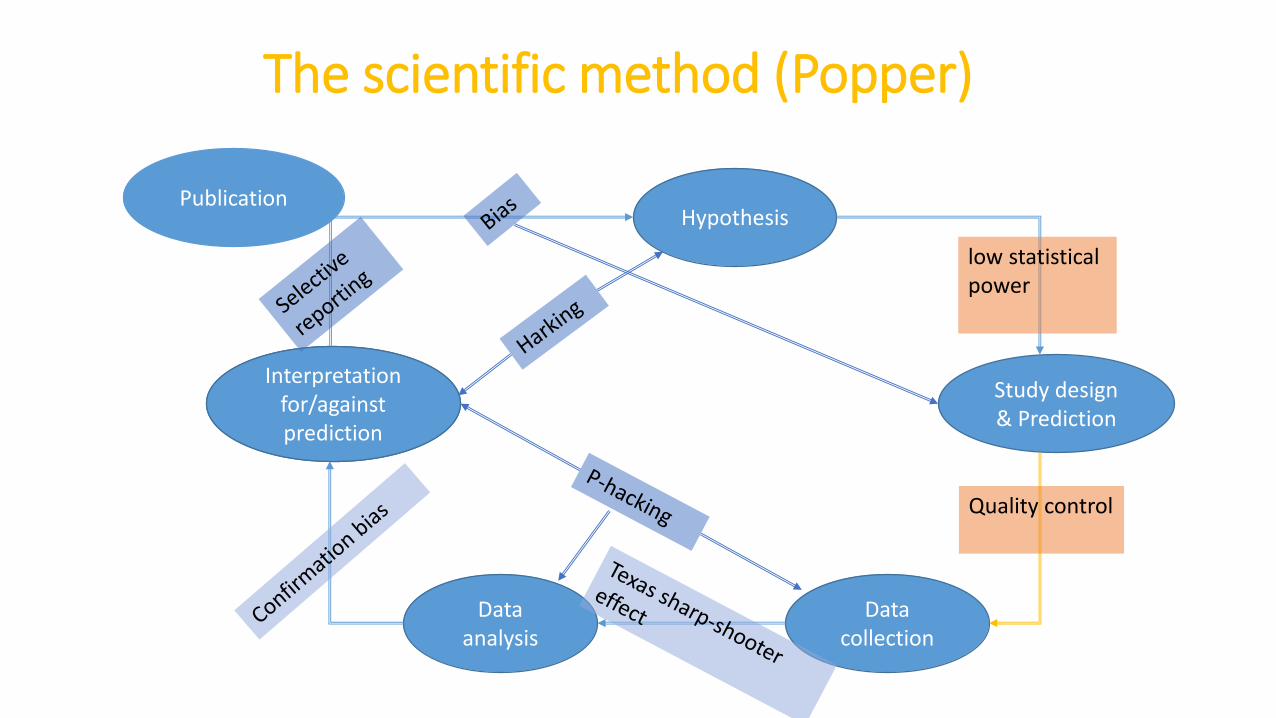
The scientific method (Popper)
Interpretation for/against prediction
low statisticalpower
Quality control

POWER ANALYSES
Power analyses
• One of the main issue in reproducibility is the lack of power – a significant effect with a small sample is likely to be driven by noise.
• Power is the likelihood to reject H0 (e.g. p<0.05) when there is an effect there to be detected (your type II error goes down).
• Depends (mainly) on your threshold alpha, the sample size and the effect size.
• Remember a published results from an under-powered study is likely bigger than in the population.
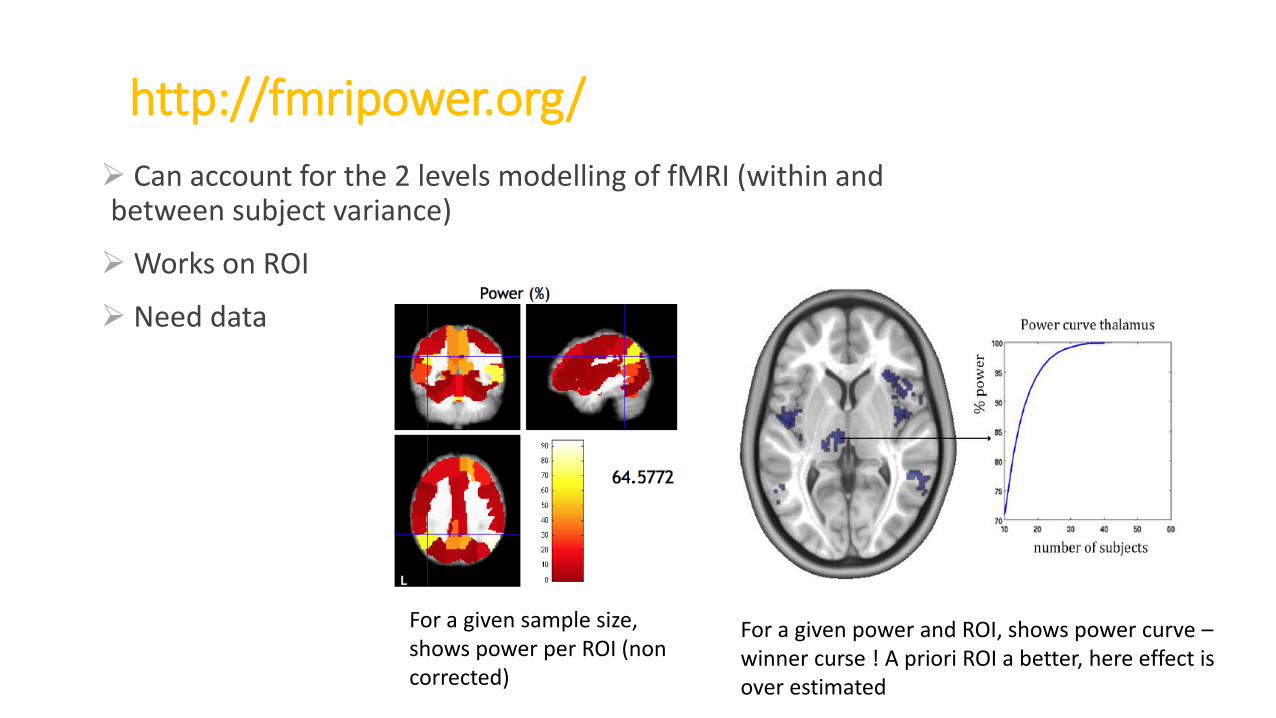
http://fmripower.org/
Can account for the 2 levels modelling of fMRI (within and between subject variance)
Works on ROI
Need data
For a given sample size, shows power per ROI (non corrected)
For a given power and ROI, shows power curve –winner curse ! A priori ROI a better, here effect is over estimated

http://neuropowertools.org/
• Peak-wise and cluster-wise analysis using a cluster forming threshold
• Any stat map can be analysed !
Estimate straight from Neurovault ! Lots of data available(see Chris Gorgolewski)
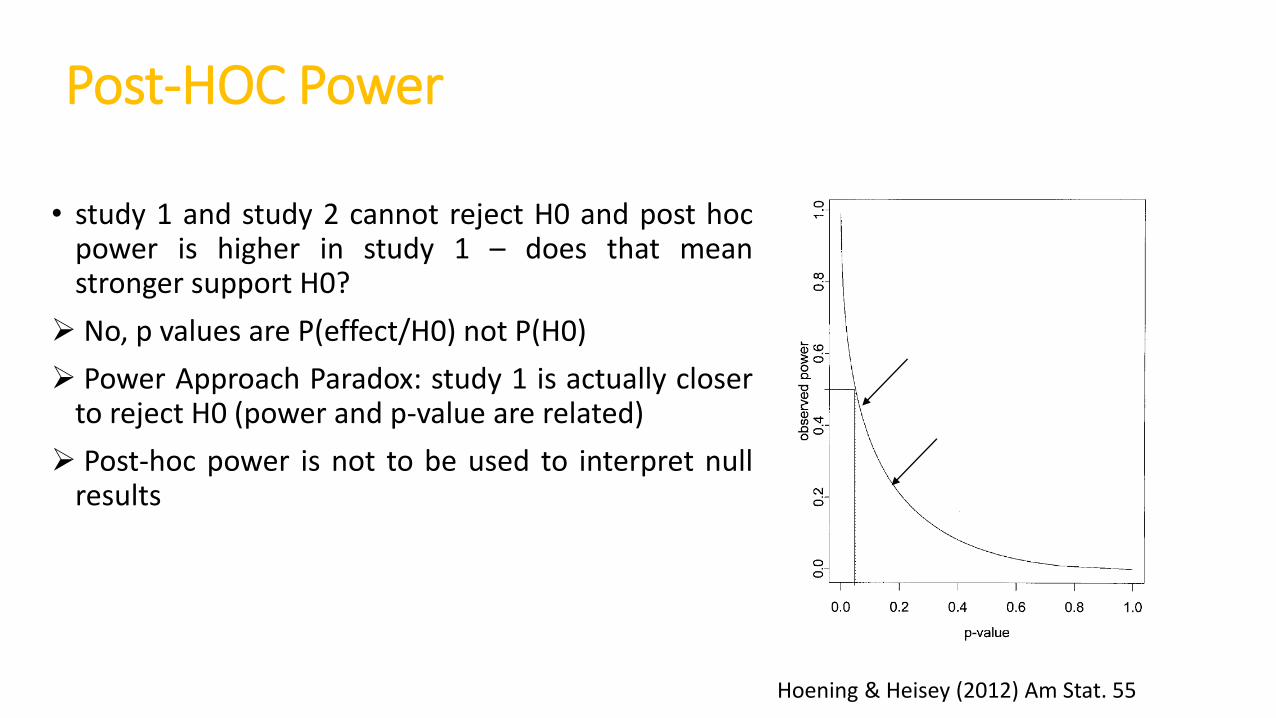
Post-HOC Power
• study 1 and study 2 cannot reject H0 and post hocpower is higher in study 1 – does that meanstronger support H0?
No, p values are P(effect/H0) not P(H0)
Power Approach Paradox: study 1 is actually closerto reject H0 (power and p-value are related)
Post-hoc power is not to be used to interpret nullresults
One tailed z-test
study 1
study 2
Hoening & Heisey (2012) Am Stat. 55
STATS BIASES
Statistical analyses ISSUES
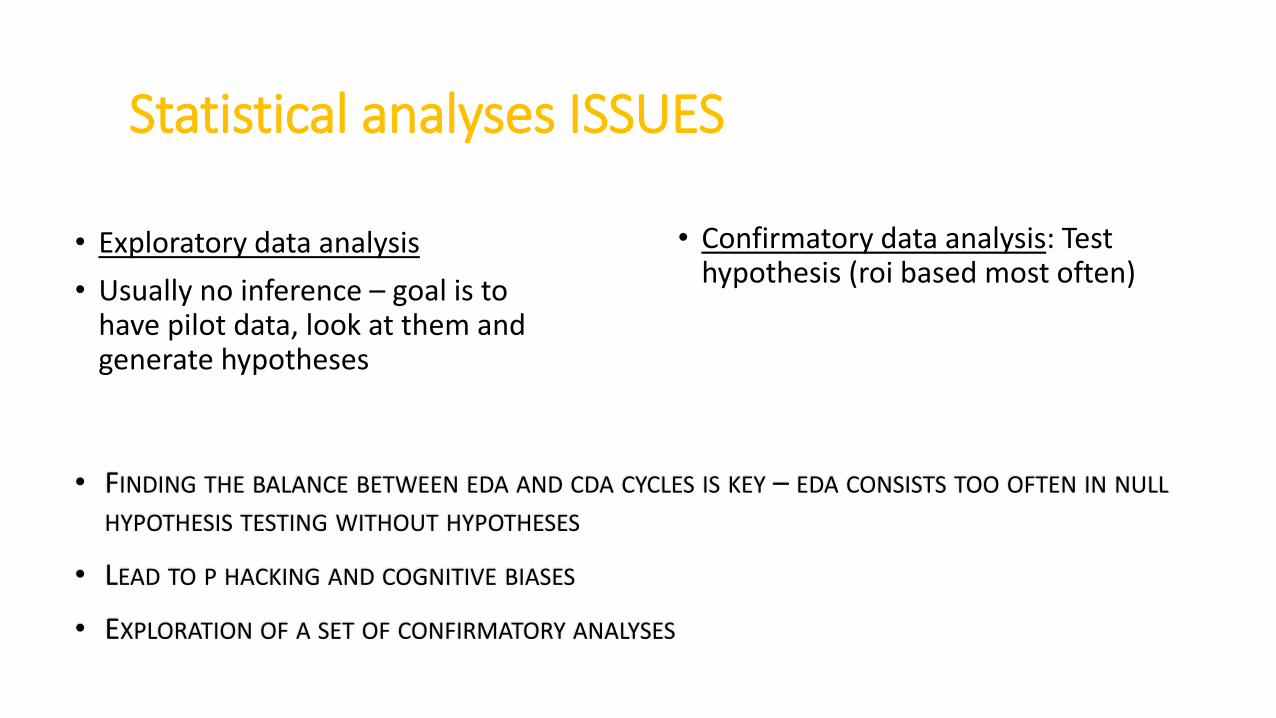
• Exploratory data analysis
• Usually no inference – goal is to have pilot data, look at them and generate hypotheses
• Confirmatory data analysis: Test hypothesis (roi based most often)
• FINDING THE BALANCE BETWEEN EDA AND CDA CYCLES IS KEY – EDA CONSISTS TOO OFTEN IN NULL
HYPOTHESIS TESTING WITHOUT HYPOTHESES
• LEAD TO P HACKING AND COGNITIVE BIASES
• EXPLORATION OF A SET OF CONFIRMATORY ANALYSES
p-hacking
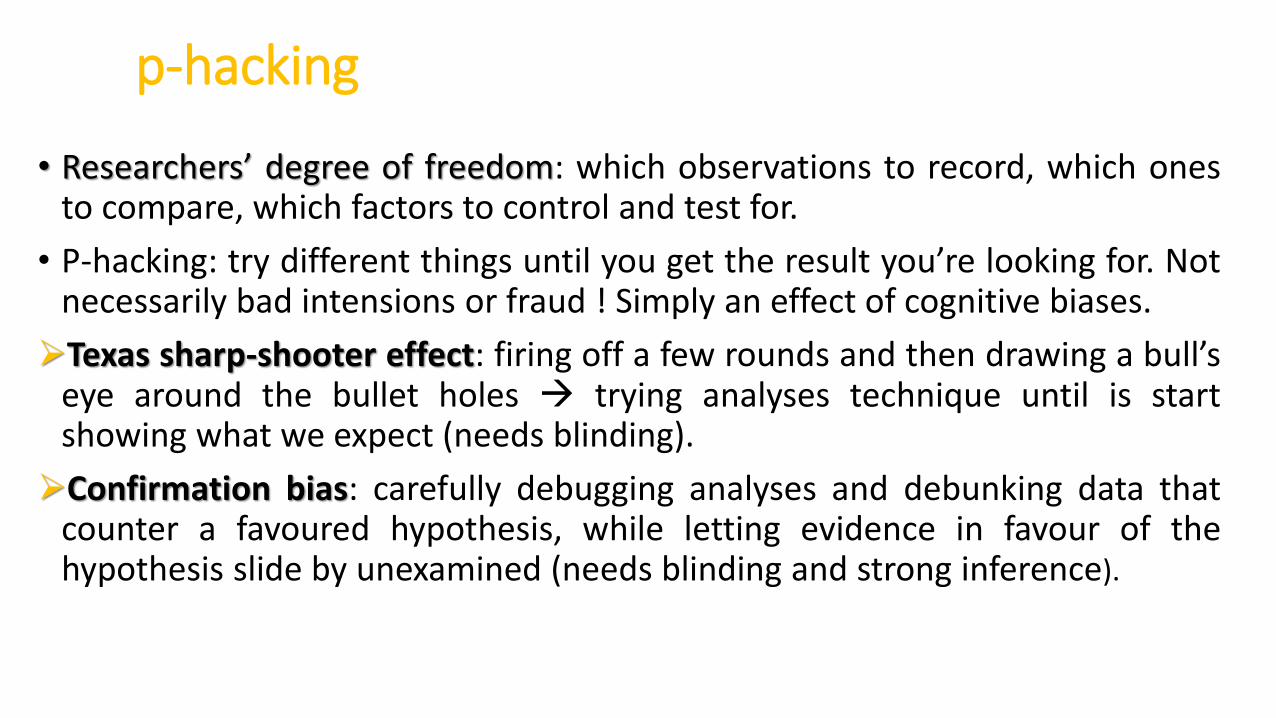
• Researchers’ degree of freedom: which observations to record, which onesto compare, which factors to control and test for.
• P-hacking: try different things until you get the result you’re looking for. Notnecessarily bad intensions or fraud ! Simply an effect of cognitive biases.
Texas sharp-shooter effect: firing off a few rounds and then drawing a bull’seye around the bullet holes trying analyses technique until is startshowing what we expect (needs blinding).
Confirmation bias: carefully debugging analyses and debunking data thatcounter a favoured hypothesis, while letting evidence in favour of thehypothesis slide by unexamined (needs blinding and strong inference).
BLINDING
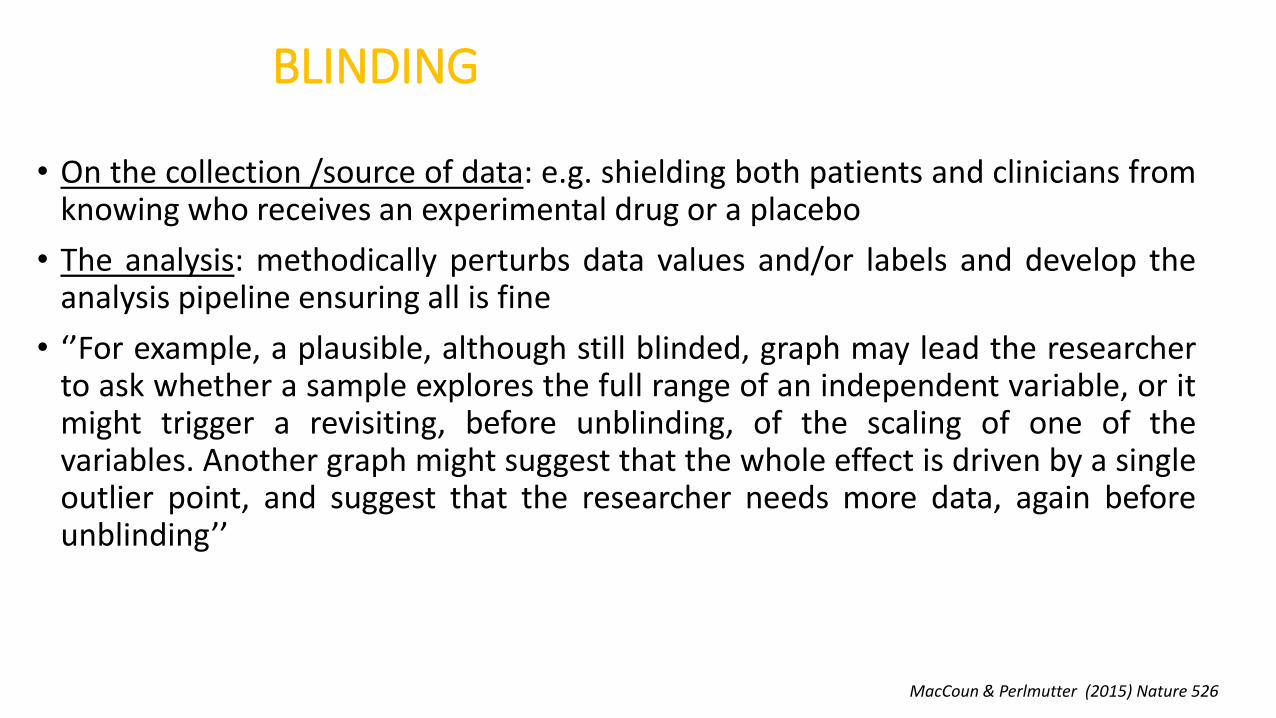
• On the collection /source of data: e.g. shielding both patients and clinicians fromknowing who receives an experimental drug or a placebo
• The analysis: methodically perturbs data values and/or labels and develop theanalysis pipeline ensuring all is fine
• ‘’For example, a plausible, although still blinded, graph may lead the researcherto ask whether a sample explores the full range of an independent variable, or itmight trigger a revisiting, before unblinding, of the scaling of one of thevariables. Another graph might suggest that the whole effect is driven by a singleoutlier point, and suggest that the researcher needs more data, again beforeunblinding’’
MacCoun & Perlmutter (2015) Nature 526
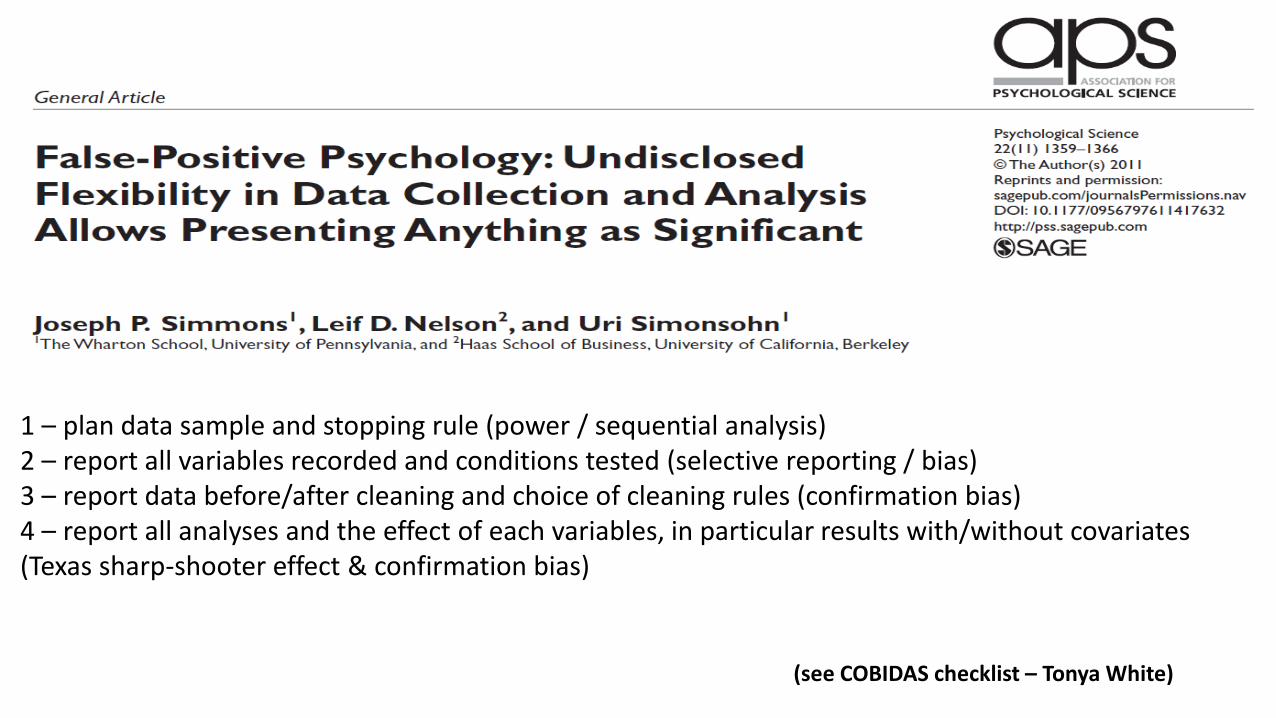
1 – plan data sample and stopping rule (power / sequential analysis)2 – report all variables recorded and conditions tested (selective reporting / bias)3 – report data before/after cleaning and choice of cleaning rules (confirmation bias)4 – report all analyses and the effect of each variables, in particular results with/without covariates (Texas sharp-shooter effect & confirmation bias)
(see COBIDAS checklist – Tonya White)

Analytical complexity

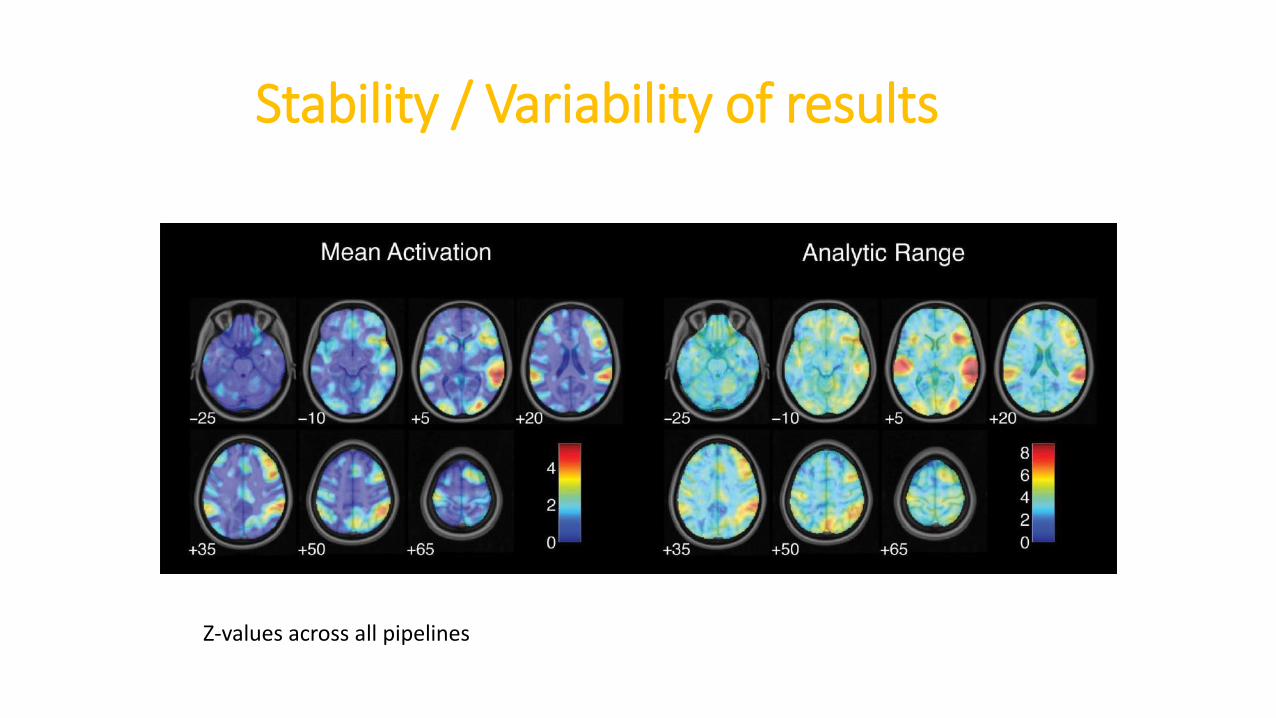
Z-values across all pipelines
Stability / Variability of results
Stability / Variability of results
Stability / Variability of results
• Regions show stable results with increased effect sizes
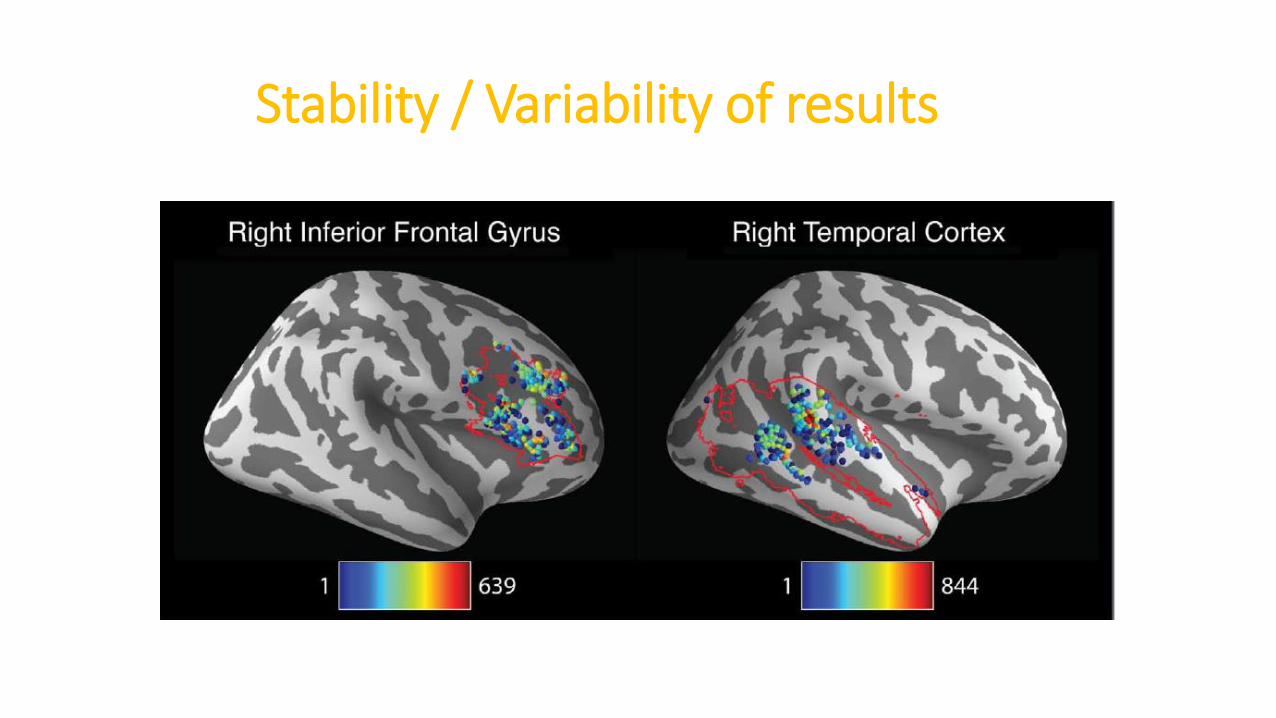
• Effect sizes and precise locations could vary a lot (up to 8 z units)
• This led to large differences once looking at thresholded map (same as in psychologycomparing effect sizes vs comparing sig. vs non-sig results)
You must declare all analysis performed (e.g. when modelling using such basis set wedon’t see any effect, but it works using that other set) – and share the maps (effectsize) because peaks from thresholded maps aren’t stable.
Computational Reproducibility
Software usage
Clicking on a GUI is not reproducible
1) keep track of every analysis step (SPM batch, Nipype workflow, AFNI and FLS scripts)
2) no manual editing (use command to copy/paste, change names, etc)
3) save seeds of random number generators
4) share as supplementary material and/or in a repository
Sandve et al. 2013 Plos Comp Bio 9

Software environment
• Should we set up virtual a machine and take snapshots? If youuse Neurodebian, simply refer to the running version (peoplecould recover that version at any time) – in all cases report youros and version
• Invest in using version control (e.g. https://github.com/)
Improving Code
• Use literate programming ! The code should tell a story about
what is happening the data at each step
which hypotheses are being tested
how a given computation has been tested / validated
Use workflow engines (see Pierre Bellec)
PSOM http://psom.simexp-lab.org/
AA https://github.com/rhodricusack/automaticanalysis/wiki
Nipype http://nipy.org/nipype/
TAKE HOME MESSAGE
• Plan study with enough statistical power
• Avoid bias using preregistration and/or blinding (ask a friend, your boss, etc to blind labels in the experiment and/or groups – this can be that simple)
• Be diligent during reporting (all techniques, methods, thresholds)
• Focus on effect sizes – share raw maps
• Share your data and code – this is the real science not the paper