Statistical Analysis Plan
92
STATISTICAL ANALYSIS PLANS PRINCIPLES AND PRACTICE Workshop Number 8 Presented at the Society for Clinical Trials 2007 Annual Meeting Montreal, Canada Sunday May 20, 2007 James R. Johnson, Ph.D. David Fitts, Ph.D., MPH
-
Upload
himeshagrawal -
Category
Documents
-
view
621 -
download
3
Transcript of Statistical Analysis Plan
STATISTICAL ANALYSIS PLANS PRINCIPLES AND PRACTICE
Workshop Number 8
Presented at the Society for Clinical Trials
2007 Annual Meeting Montreal, Canada
Sunday May 20, 2007
James R. Johnson, Ph.D. David Fitts, Ph.D., MPH
STATISTICAL ANALYSIS PLANSPRINCIPLES AND PRACTICE
Presented at theSociety for Clinical Trials2007 Annual MeetingMontreal, Canada
Sunday May 20, 2007
Presented By: James R. Johnson, PhDDavid Fitts, PhD, MPH
01 May 2007 STATISTICAL ANALYSIS PLANS: PRINCIPLES AND PRACTICE Page 2
Learning Objectives
• At the end of this session you should have a comprehensive understanding of the:– Why we Plan for Statistical Analysis?– Definition of the Statistical Analysis Plan (SAP).– Historical and Regulatory (FDA, EMEA, ICH) framework for the SAP.– Relationship of the SAP to Internal and External Documents/Publications.– SAP audience(s).– The SAP and Statistical Ethics.– Structure and Content of the SAP.– SAP Template(s).
• Drug/Device Development Program Planning• Phase I PK/PD Safety Studies• Phase II Screening and Dose Finding Studies• Phase IIb/III Registration Studies
– Communication and Writing Style.
01 May 2007 STATISTICAL ANALYSIS PLANS: PRINCIPLES AND PRACTICE Page 3
Why do we Plan Statistical Analyses?
01 May 2007 STATISTICAL ANALYSIS PLANS: PRINCIPLES AND PRACTICE Page 4
Why Plan ?
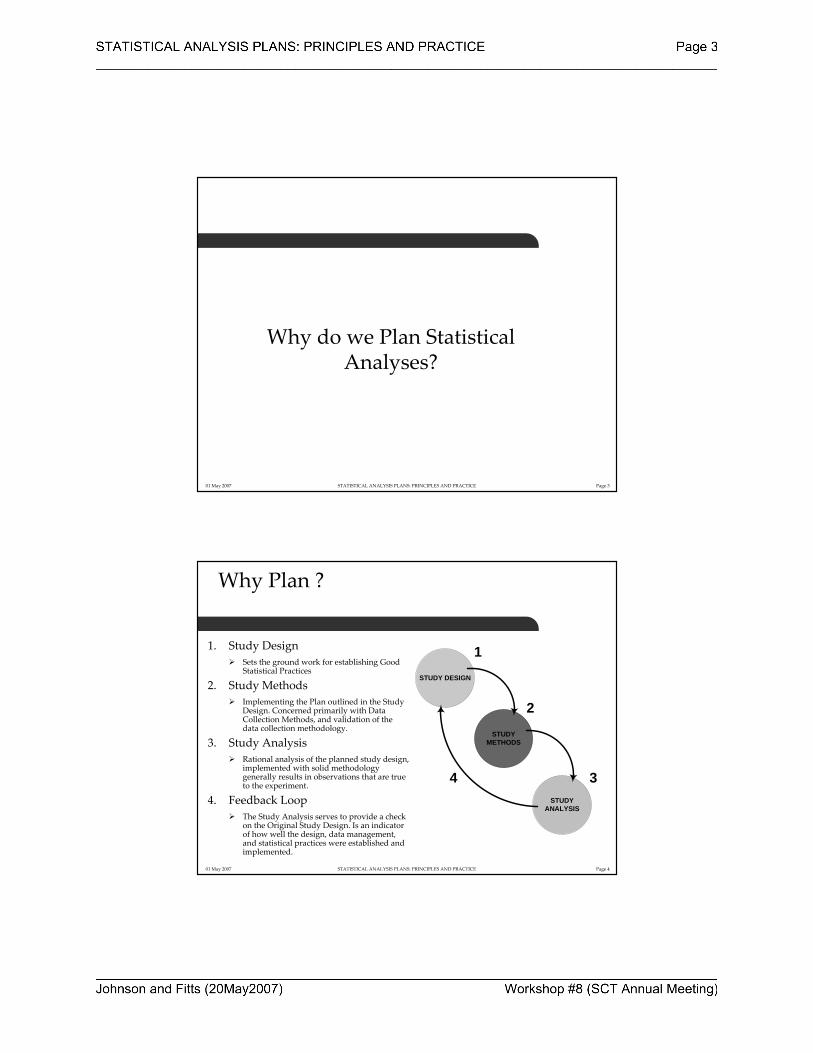
1. Study DesignSets the ground work for establishing Good Statistical Practices
2. Study MethodsImplementing the Plan outlined in the Study Design. Concerned primarily with Data Collection Methods, and validation of the data collection methodology.
3. Study AnalysisRational analysis of the planned study design, implemented with solid methodology generally results in observations that are true to the experiment.
4. Feedback LoopThe Study Analysis serves to provide a check on the Original Study Design. Is an indicator of how well the design, data management, and statistical practices were established and implemented.
STUDY DESIGN
STUDY METHODS
STUDY ANALYSIS
1
2
34
01 May 2007 STATISTICAL ANALYSIS PLANS: PRINCIPLES AND PRACTICE Page 5
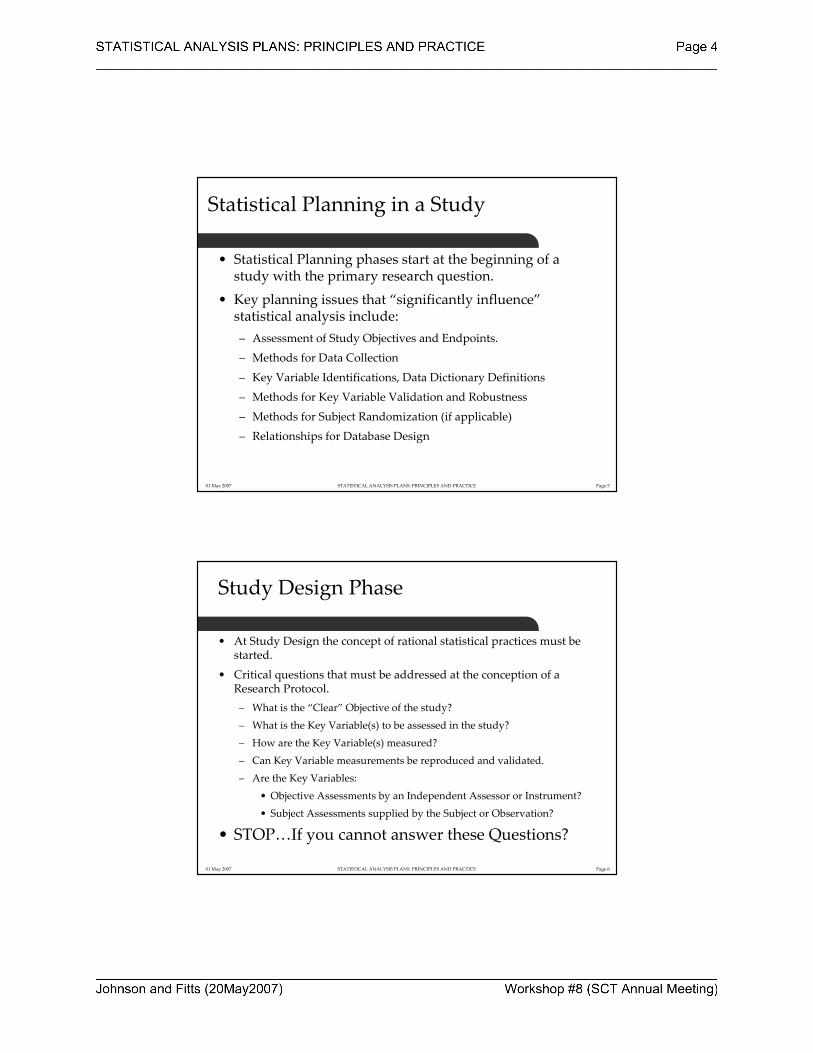
Statistical Planning in a Study
• Statistical Planning phases start at the beginning of a study with the primary research question.
• Key planning issues that “significantly influence”statistical analysis include:– Assessment of Study Objectives and Endpoints.– Methods for Data Collection
– Key Variable Identifications, Data Dictionary Definitions– Methods for Key Variable Validation and Robustness– Methods for Subject Randomization (if applicable)– Relationships for Database Design
01 May 2007 STATISTICAL ANALYSIS PLANS: PRINCIPLES AND PRACTICE Page 6
Study Design Phase
• At Study Design the concept of rational statistical practices must be started.
• Critical questions that must be addressed at the conception of aResearch Protocol.– What is the “Clear” Objective of the study?
– What is the Key Variable(s) to be assessed in the study?
– How are the Key Variable(s) measured?
– Can Key Variable measurements be reproduced and validated.
– Are the Key Variables:
• Objective Assessments by an Independent Assessor or Instrument?
• Subject Assessments supplied by the Subject or Observation?
• STOP…If you cannot answer these Questions?
01 May 2007 STATISTICAL ANALYSIS PLANS: PRINCIPLES AND PRACTICE Page 7
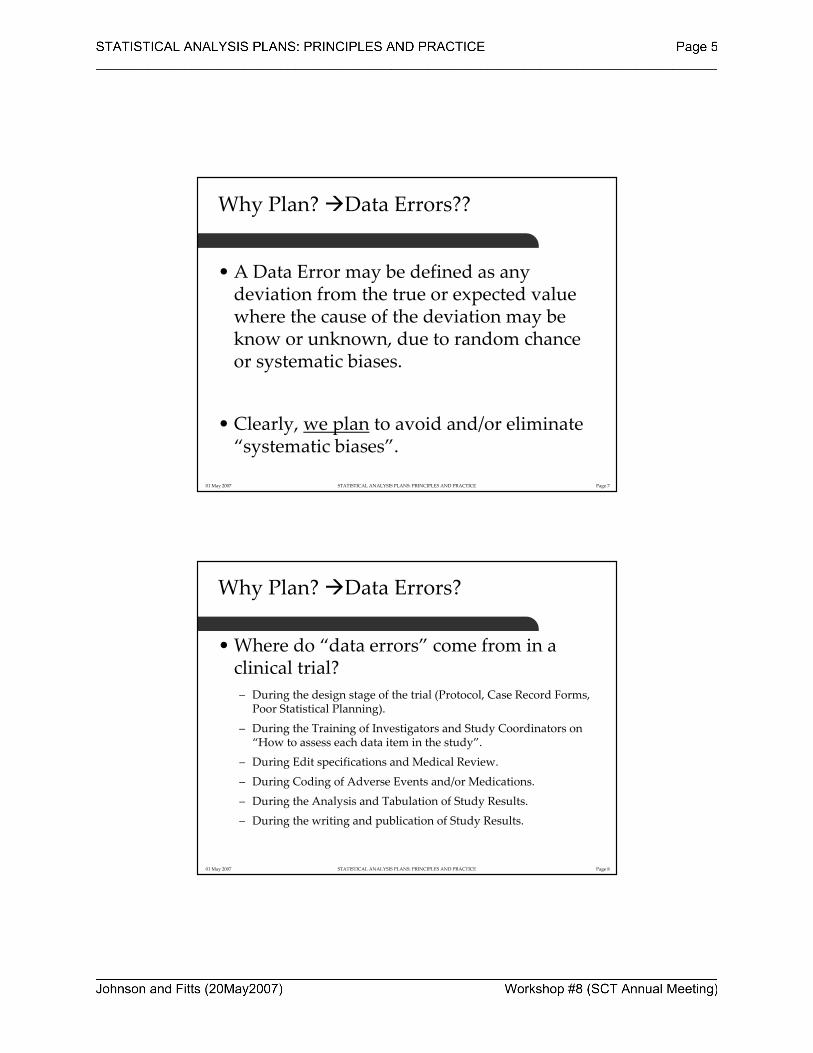
Why Plan? Data Errors??
• A Data Error may be defined as any deviation from the true or expected value where the cause of the deviation may be know or unknown, due to random chance or systematic biases.
• Clearly, we plan to avoid and/or eliminate “systematic biases”.
01 May 2007 STATISTICAL ANALYSIS PLANS: PRINCIPLES AND PRACTICE Page 8
Why Plan? Data Errors?
• Where do “data errors” come from in a clinical trial?– During the design stage of the trial (Protocol, Case Record Forms,
Poor Statistical Planning).– During the Training of Investigators and Study Coordinators on
“How to assess each data item in the study”.– During Edit specifications and Medical Review.
– During Coding of Adverse Events and/or Medications.– During the Analysis and Tabulation of Study Results.– During the writing and publication of Study Results.
01 May 2007 STATISTICAL ANALYSIS PLANS: PRINCIPLES AND PRACTICE Page 9
SAP Definition
01 May 2007 STATISTICAL ANALYSIS PLANS: PRINCIPLES AND PRACTICE Page 10
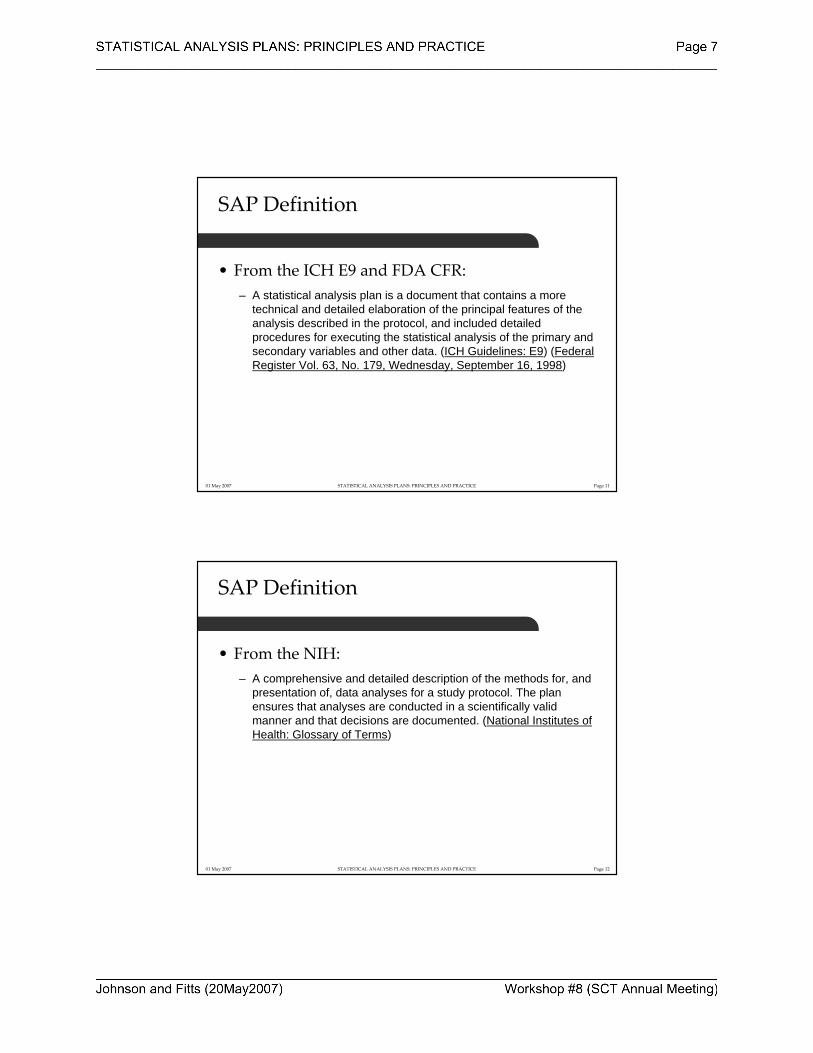
SAP Definition
• The Definition of what is an SAP comes primarily from professional organizations and regulatory authorities:– ICH E9 (Statistical Principles for Clinical Trials)– FDA (Federal Register Vol. 63, No. 179, Wednesday, September
16, 1998)
– National Institutes of Health (NIH)– PSI (Statisticians in the Pharmaceutical Industry)– GMDS (Deutsche Gesellschaft für Medizinische Informatik,
Biometrie und Epidemiologie e.V.)
01 May 2007 STATISTICAL ANALYSIS PLANS: PRINCIPLES AND PRACTICE Page 11
SAP Definition
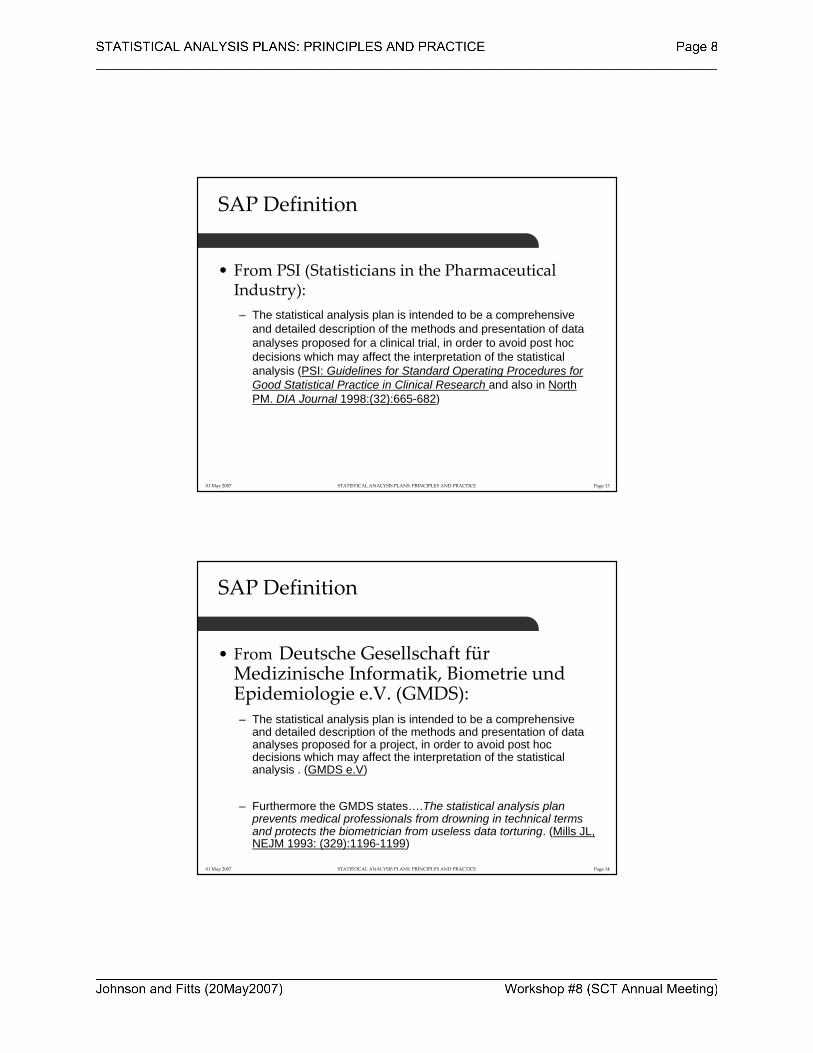
• From the ICH E9 and FDA CFR:– A statistical analysis plan is a document that contains a more
technical and detailed elaboration of the principal features of the analysis described in the protocol, and included detailed procedures for executing the statistical analysis of the primary and secondary variables and other data. (ICH Guidelines: E9) (Federal Register Vol. 63, No. 179, Wednesday, September 16, 1998)
01 May 2007 STATISTICAL ANALYSIS PLANS: PRINCIPLES AND PRACTICE Page 12
SAP Definition
• From the NIH:– A comprehensive and detailed description of the methods for, and
presentation of, data analyses for a study protocol. The plan ensures that analyses are conducted in a scientifically valid manner and that decisions are documented. (National Institutes of Health: Glossary of Terms)
01 May 2007 STATISTICAL ANALYSIS PLANS: PRINCIPLES AND PRACTICE Page 13
SAP Definition
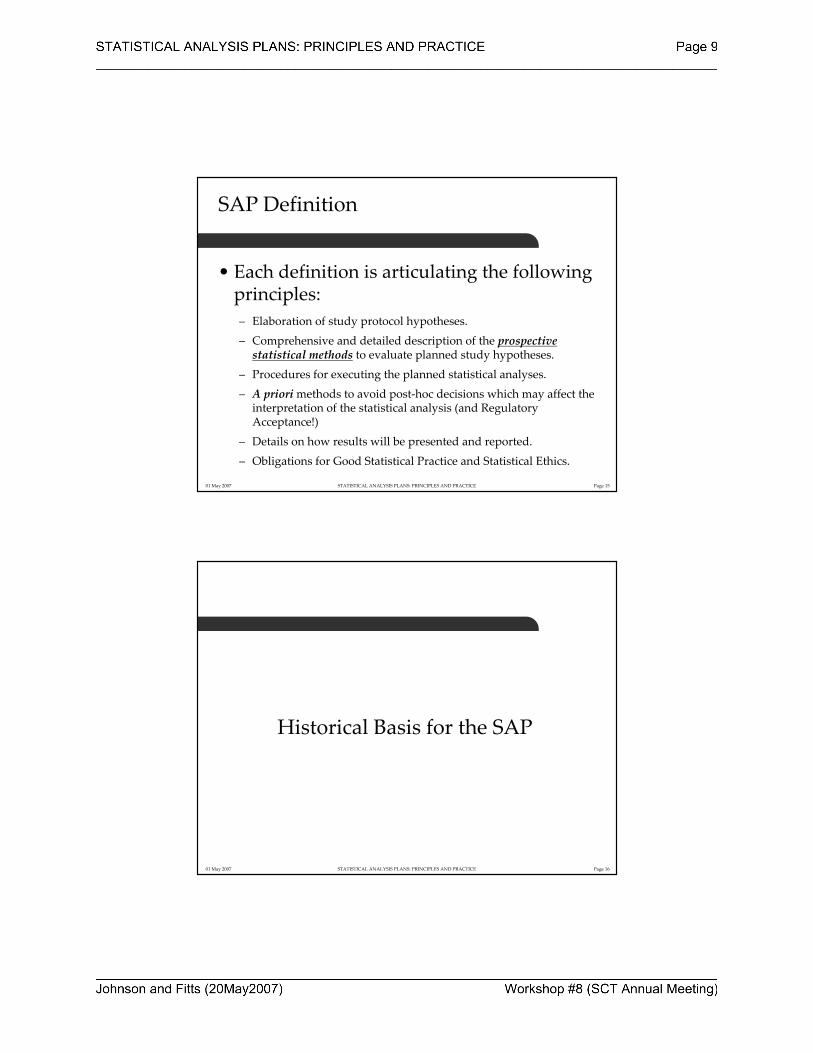
• From PSI (Statisticians in the Pharmaceutical Industry):– The statistical analysis plan is intended to be a comprehensive
and detailed description of the methods and presentation of dataanalyses proposed for a clinical trial, in order to avoid post hoc decisions which may affect the interpretation of the statisticalanalysis (PSI: Guidelines for Standard Operating Procedures for Good Statistical Practice in Clinical Research and also in North PM. DIA Journal 1998:(32):665-682)
01 May 2007 STATISTICAL ANALYSIS PLANS: PRINCIPLES AND PRACTICE Page 14
SAP Definition
• From Deutsche Gesellschaft für Medizinische Informatik, Biometrie und Epidemiologie e.V. (GMDS):– The statistical analysis plan is intended to be a comprehensive
and detailed description of the methods and presentation of dataanalyses proposed for a project, in order to avoid post hoc decisions which may affect the interpretation of the statisticalanalysis . (GMDS e.V)
– Furthermore the GMDS states….The statistical analysis plan prevents medical professionals from drowning in technical terms and protects the biometrician from useless data torturing. (Mills JL, NEJM 1993: (329):1196-1199)
01 May 2007 STATISTICAL ANALYSIS PLANS: PRINCIPLES AND PRACTICE Page 15
SAP Definition
• Each definition is articulating the following principles:– Elaboration of study protocol hypotheses.– Comprehensive and detailed description of the prospective statistical methods to evaluate planned study hypotheses.
– Procedures for executing the planned statistical analyses.– A priorimethods to avoid post‐hoc decisions which may affect the
interpretation of the statistical analysis (and Regulatory Acceptance!)
– Details on how results will be presented and reported.– Obligations for Good Statistical Practice and Statistical Ethics.
01 May 2007 STATISTICAL ANALYSIS PLANS: PRINCIPLES AND PRACTICE Page 16
Historical Basis for the SAP
01 May 2007 STATISTICAL ANALYSIS PLANS: PRINCIPLES AND PRACTICE Page 17
Historical Basis for the SAP
• There has been some historical precedent for the creation of a “Statistical Analysis Plan”…although called by many other names.– Originated in Europe (19th and 20th Century)– US in late 20th Century
01 May 2007 STATISTICAL ANALYSIS PLANS: PRINCIPLES AND PRACTICE Page 18
Historical Basis for the SAP
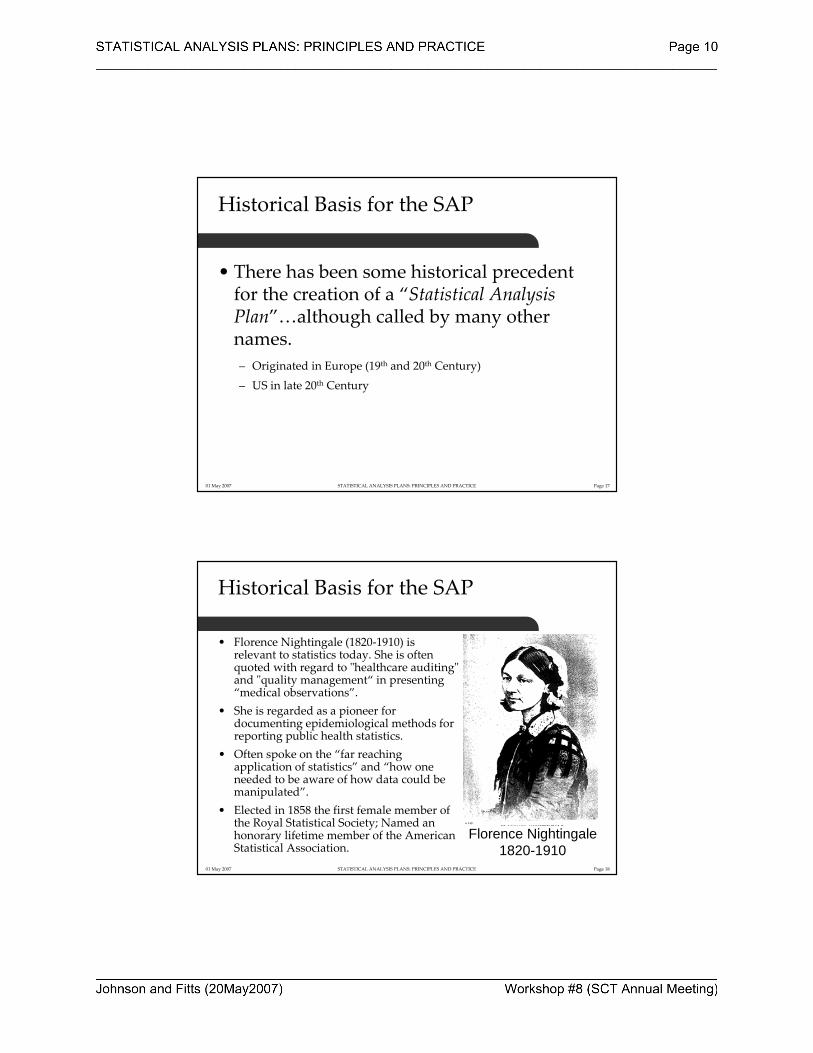
• Florence Nightingale (1820‐1910) is relevant to statistics today. She is often quoted with regard to ʺhealthcare auditingʺ and ʺquality management“ in presenting “medical observations”.
• She is regarded as a pioneer for documenting epidemiological methods for reporting public health statistics.
• Often spoke on the “far reaching application of statistics” and “how one needed to be aware of how data could be manipulated”.
• Elected in 1858 the first female member of the Royal Statistical Society; Named an honorary lifetime member of the American Statistical Association.
Florence Nightingale1820-1910
01 May 2007 STATISTICAL ANALYSIS PLANS: PRINCIPLES AND PRACTICE Page 19
Historical Basis for the SAP
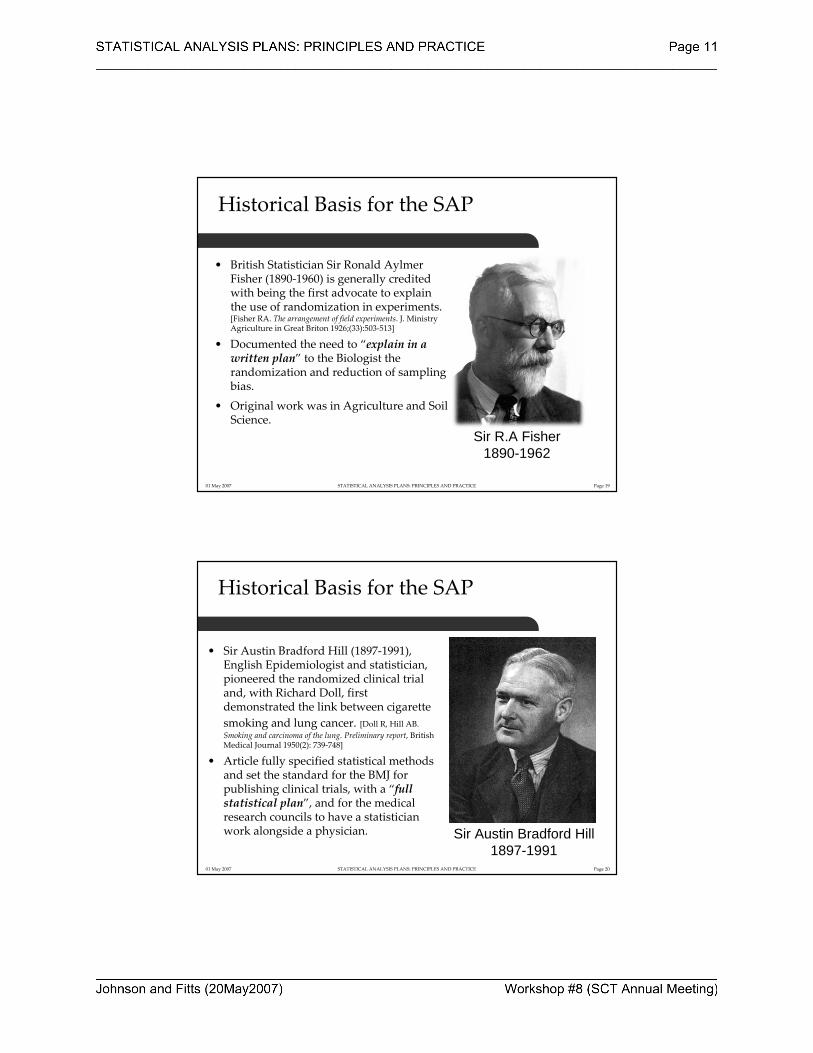
• British Statistician Sir Ronald Aylmer Fisher (1890‐1960) is generally credited with being the first advocate to explain the use of randomization in experiments. [Fisher RA. The arrangement of field experiments. J. Ministry Agriculture in Great Briton 1926;(33):503‐513]
• Documented the need to “explain in a written plan” to the Biologist the randomization and reduction of sampling bias.
• Original work was in Agriculture and Soil Science.
Sir R.A Fisher1890-1962
01 May 2007 STATISTICAL ANALYSIS PLANS: PRINCIPLES AND PRACTICE Page 20
Historical Basis for the SAP
• Sir Austin Bradford Hill (1897‐1991), English Epidemiologist and statistician, pioneered the randomized clinical trial and, with Richard Doll, first demonstrated the link between cigarette smoking and lung cancer. [Doll R, Hill AB. Smoking and carcinoma of the lung. Preliminary report, British Medical Journal 1950(2): 739‐748]
• Article fully specified statistical methods and set the standard for the BMJ for publishing clinical trials, with a “full statistical plan”, and for the medical research councils to have a statistician work alongside a physician. Sir Austin Bradford Hill
1897-1991
01 May 2007 STATISTICAL ANALYSIS PLANS: PRINCIPLES AND PRACTICE Page 21
Historical Basis for the SAP
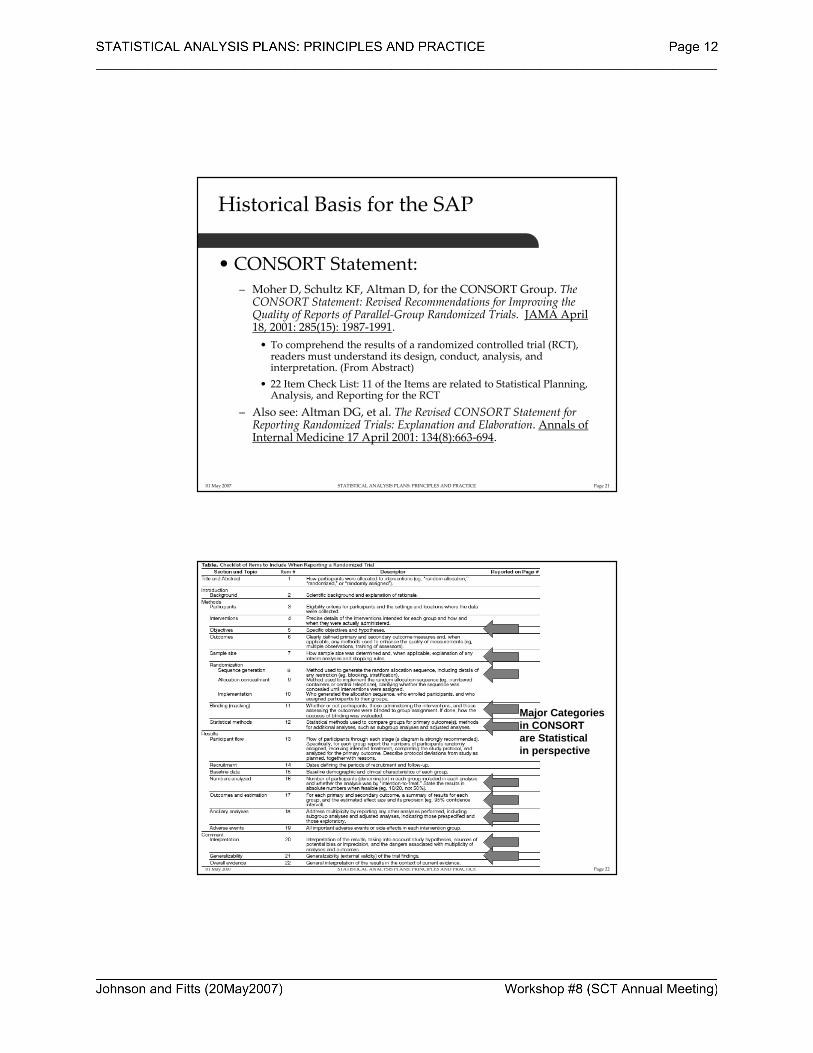
• CONSORT Statement:– Moher D, Schultz KF, Altman D, for the CONSORT Group. The CONSORT Statement: Revised Recommendations for Improving the Quality of Reports of Parallel‐Group Randomized Trials. JAMA April 18, 2001: 285(15): 1987‐1991.• To comprehend the results of a randomized controlled trial (RCT), readers must understand its design, conduct, analysis, and interpretation. (From Abstract)
• 22 Item Check List: 11 of the Items are related to Statistical Planning, Analysis, and Reporting for the RCT
– Also see: Altman DG, et al. The Revised CONSORT Statement for Reporting Randomized Trials: Explanation and Elaboration. Annals of Internal Medicine 17 April 2001: 134(8):663‐694.
01 May 2007 STATISTICAL ANALYSIS PLANS: PRINCIPLES AND PRACTICE Page 22
Major Categoriesin CONSORTare Statisticalin perspective
01 May 2007 STATISTICAL ANALYSIS PLANS: PRINCIPLES AND PRACTICE Page 23
Historical Basis for the SAP
• Statistical Science has historical roots at the FDA:– 1962: Division of New Drugs, Medical Evaluation Branch formed
with responsibility for reviewing Safety and Efficacy Data. First evidence of applied statistical review to applications.
– 1974: Office of Biometrics and Epidemiology formed to support “FDA Science”, provided statistical consulting to FDA Medical Evaluation Branch reviewers upon request.
– 1984: Office of Biostatistics and Epidemiology (Gerald Faich, MD, MPH, Director) starts completing a statistical review of NDAs.
– 2002: Office of Biostatistics formed (Robert T. O’Neil, Ph.D., Director) with expanded responsibilities across the spectrum of drug and biologics review.
[Abstracted From the FDA History Web Page: 2005]
01 May 2007 STATISTICAL ANALYSIS PLANS: PRINCIPLES AND PRACTICE Page 24
Regulatory Roots for the SAP
01 May 2007 STATISTICAL ANALYSIS PLANS: PRINCIPLES AND PRACTICE Page 25
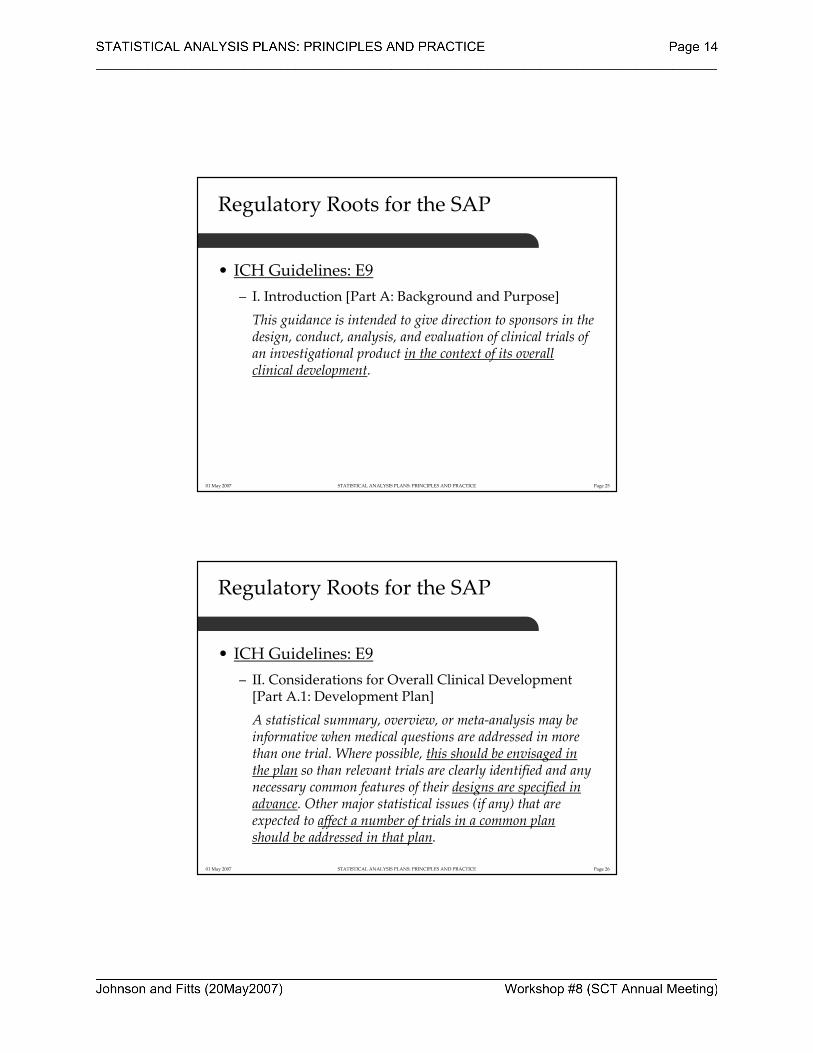
Regulatory Roots for the SAP
• ICH Guidelines: E9– I. Introduction [Part A: Background and Purpose]This guidance is intended to give direction to sponsors in the design, conduct, analysis, and evaluation of clinical trials of an investigational product in the context of its overall clinical development.
01 May 2007 STATISTICAL ANALYSIS PLANS: PRINCIPLES AND PRACTICE Page 26
Regulatory Roots for the SAP
• ICH Guidelines: E9– II. Considerations for Overall Clinical Development [Part A.1: Development Plan]
A statistical summary, overview, or meta‐analysis may be informative when medical questions are addressed in more than one trial. Where possible, this should be envisaged in the plan so than relevant trials are clearly identified and any necessary common features of their designs are specified in advance. Other major statistical issues (if any) that are expected to affect a number of trials in a common plan should be addressed in that plan.
01 May 2007 STATISTICAL ANALYSIS PLANS: PRINCIPLES AND PRACTICE Page 27
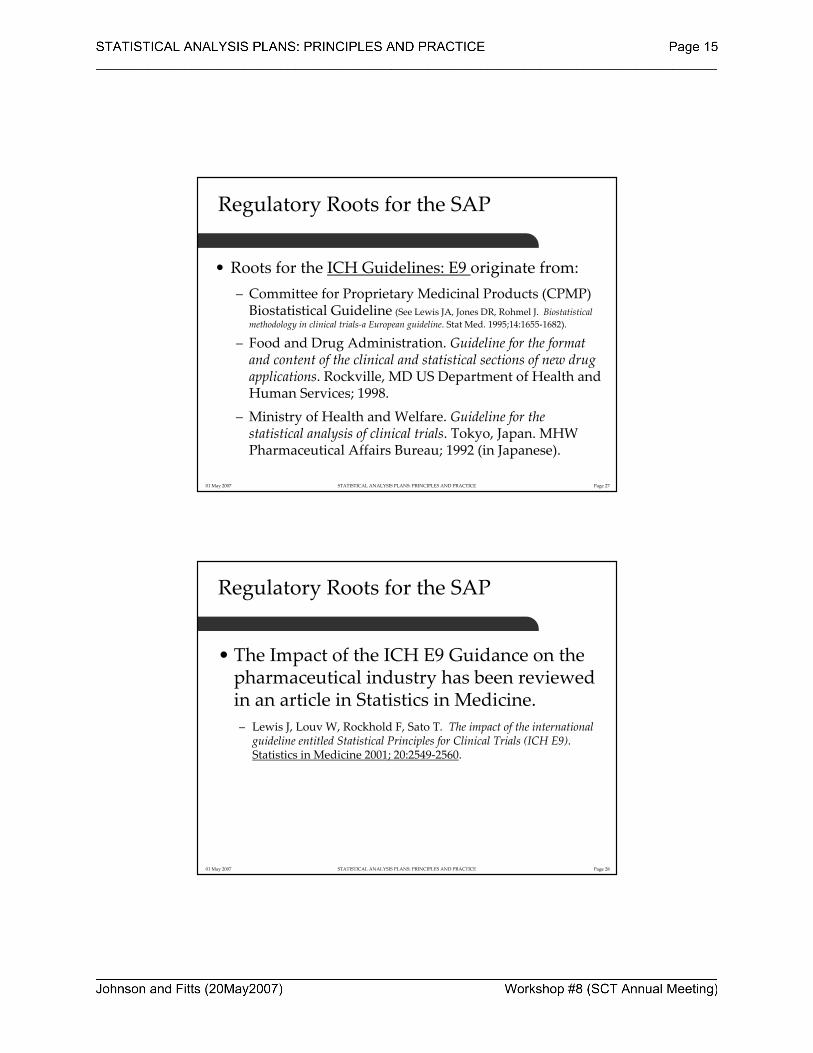
Regulatory Roots for the SAP
• Roots for the ICH Guidelines: E9 originate from:– Committee for Proprietary Medicinal Products (CPMP) Biostatistical Guideline (See Lewis JA, Jones DR, Rohmel J. Biostatistical methodology in clinical trials‐a European guideline. Stat Med. 1995;14:1655‐1682).
– Food and Drug Administration. Guideline for the format and content of the clinical and statistical sections of new drugapplications. Rockville, MD US Department of Health and Human Services; 1998.
– Ministry of Health and Welfare. Guideline for the statistical analysis of clinical trials. Tokyo, Japan. MHW Pharmaceutical Affairs Bureau; 1992 (in Japanese).
01 May 2007 STATISTICAL ANALYSIS PLANS: PRINCIPLES AND PRACTICE Page 28
Regulatory Roots for the SAP
• The Impact of the ICH E9 Guidance on the pharmaceutical industry has been reviewed in an article in Statistics in Medicine.– Lewis J, Louv W, Rockhold F, Sato T. The impact of the international guideline entitled Statistical Principles for Clinical Trials (ICH E9). Statistics in Medicine 2001; 20:2549‐2560.
01 May 2007 STATISTICAL ANALYSIS PLANS: PRINCIPLES AND PRACTICE Page 29
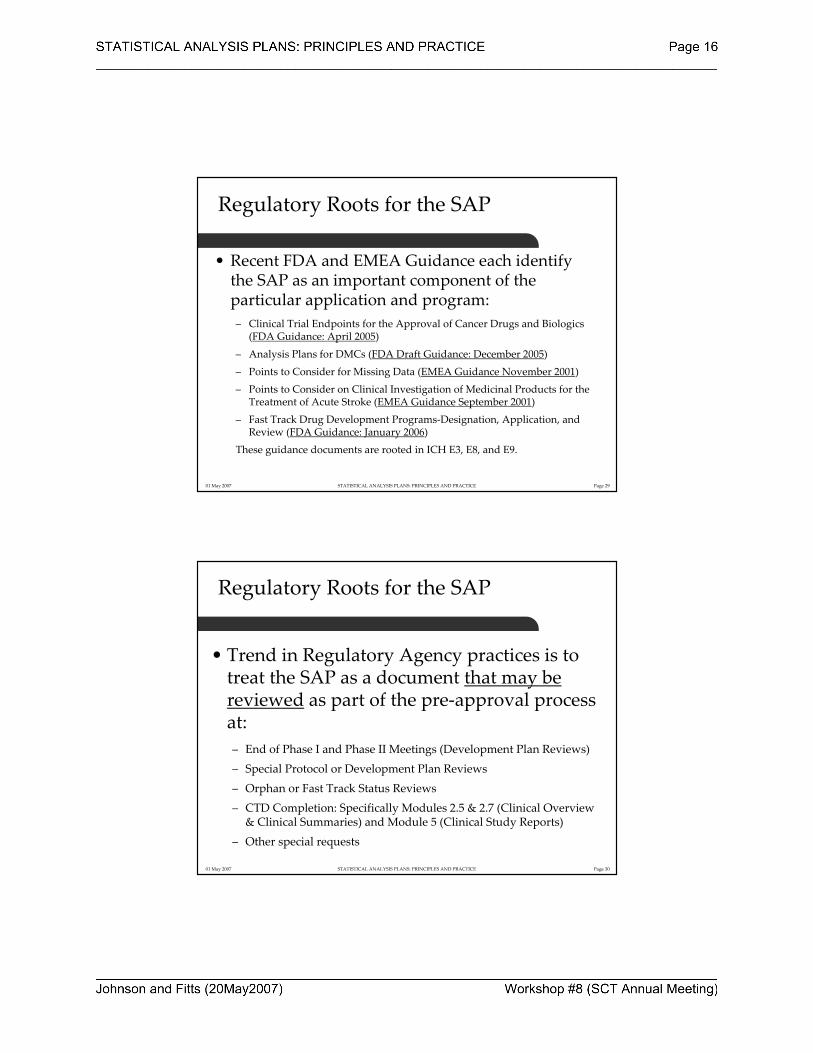
Regulatory Roots for the SAP
• Recent FDA and EMEA Guidance each identify the SAP as an important component of the particular application and program:– Clinical Trial Endpoints for the Approval of Cancer Drugs and Biologics
(FDA Guidance: April 2005)
– Analysis Plans for DMCs (FDA Draft Guidance: December 2005)
– Points to Consider for Missing Data (EMEA Guidance November 2001)– Points to Consider on Clinical Investigation of Medicinal Products for the
Treatment of Acute Stroke (EMEA Guidance September 2001)– Fast Track Drug Development Programs‐Designation, Application, and
Review (FDA Guidance: January 2006)These guidance documents are rooted in ICH E3, E8, and E9.
01 May 2007 STATISTICAL ANALYSIS PLANS: PRINCIPLES AND PRACTICE Page 30
Regulatory Roots for the SAP
• Trend in Regulatory Agency practices is to treat the SAP as a document that may be reviewed as part of the pre‐approval process at:– End of Phase I and Phase II Meetings (Development Plan Reviews)– Special Protocol or Development Plan Reviews– Orphan or Fast Track Status Reviews– CTD Completion: Specifically Modules 2.5 & 2.7 (Clinical Overview
& Clinical Summaries) and Module 5 (Clinical Study Reports)– Other special requests
01 May 2007 STATISTICAL ANALYSIS PLANS: PRINCIPLES AND PRACTICE Page 31
SAP Document Relationships
01 May 2007 STATISTICAL ANALYSIS PLANS: PRINCIPLES AND PRACTICE Page 32
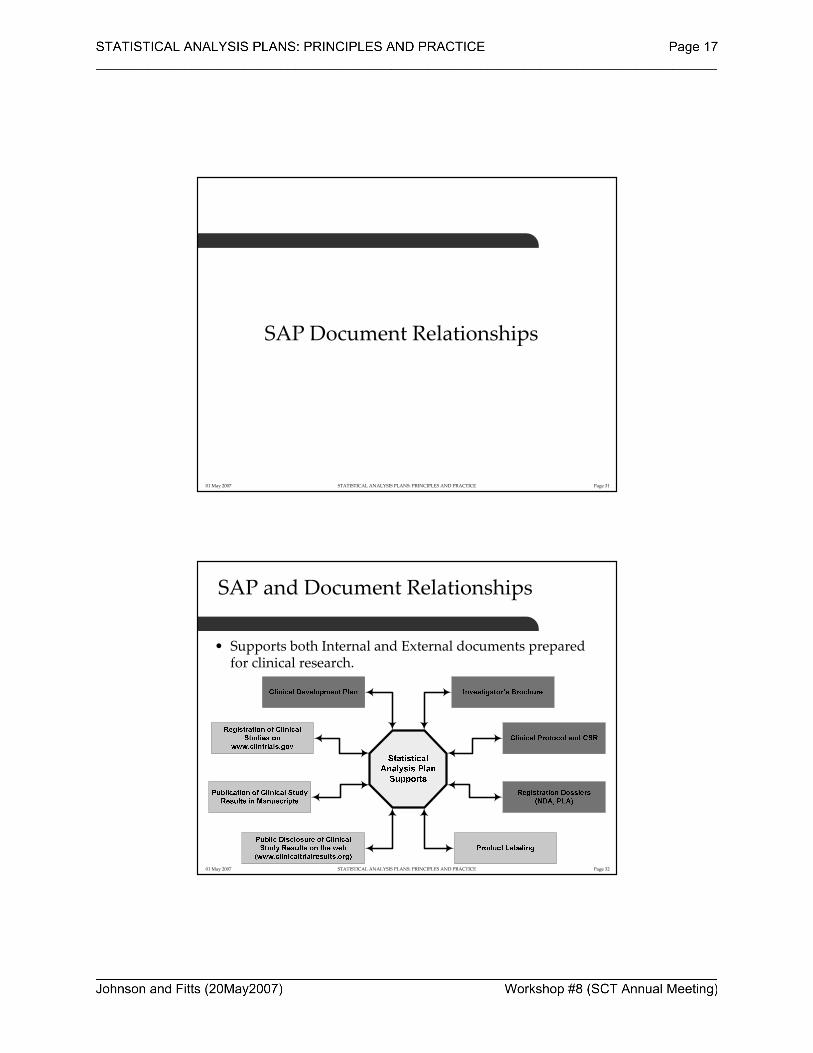
SAP and Document Relationships
• Supports both Internal and External documents prepared for clinical research.
01 May 2007 STATISTICAL ANALYSIS PLANS: PRINCIPLES AND PRACTICE Page 33
SAP and Document Relationships
• Any SAP developed must be viewed for internal support and consistency among the:– Clinical Development Plan
– Investigators Brochure– Clinical Protocol and CSR– Registration Dossier’s (NDA, PLA)
• Consistency in statistical methods between studies is identified in ICH E9 documents at the Development Plan level.– Allows for development of a common analysis theme across a program.
01 May 2007 STATISTICAL ANALYSIS PLANS: PRINCIPLES AND PRACTICE Page 34
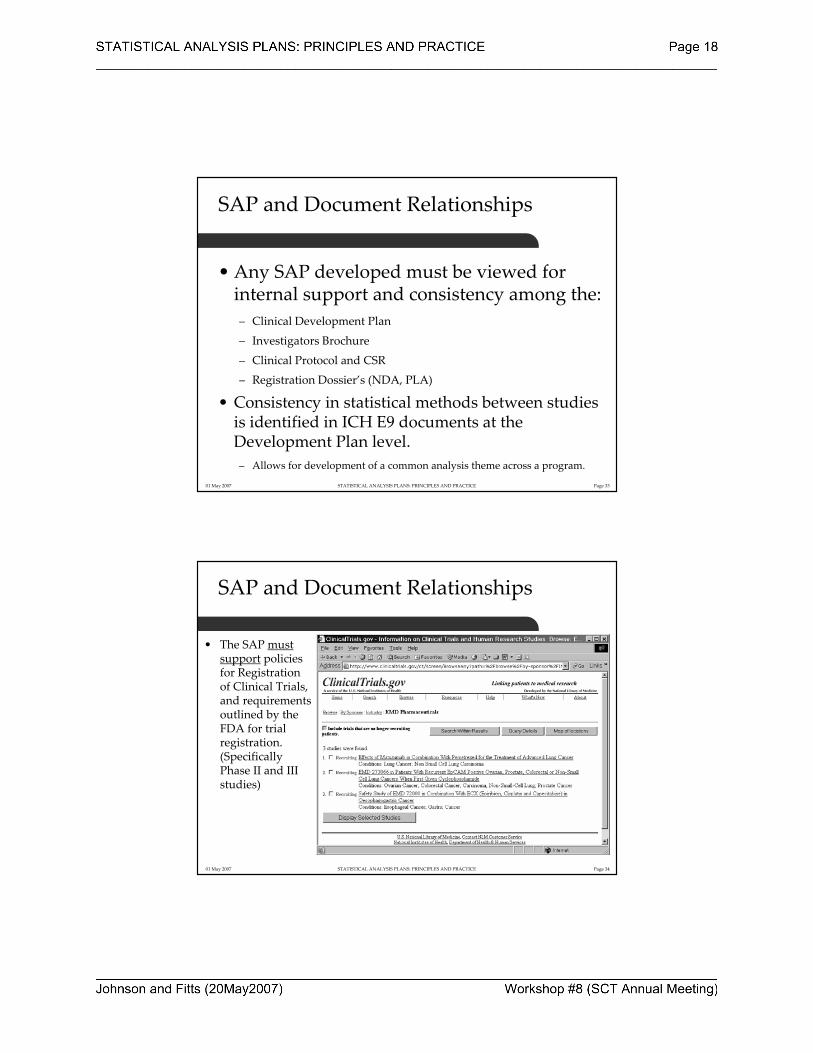
SAP and Document Relationships
• The SAP must support policies for Registration of Clinical Trials, and requirements outlined by the FDA for trial registration.(Specifically Phase II and III studies)
01 May 2007 STATISTICAL ANALYSIS PLANS: PRINCIPLES AND PRACTICE Page 35
SAP and Document Relationships
• The SAP will support Clinical Trials Results Disclosure.
01 May 2007 STATISTICAL ANALYSIS PLANS: PRINCIPLES AND PRACTICE Page 36
SAP Audiences
01 May 2007 STATISTICAL ANALYSIS PLANS: PRINCIPLES AND PRACTICE Page 37
SAP Audiences
• The SAP Must be written assuming that a diverse group of individuals, with a diverse set of skills, with a diverse understanding of Biostatistics may read the SAP….and make decisions from information derived from the SAP.
01 May 2007 STATISTICAL ANALYSIS PLANS: PRINCIPLES AND PRACTICE Page 38
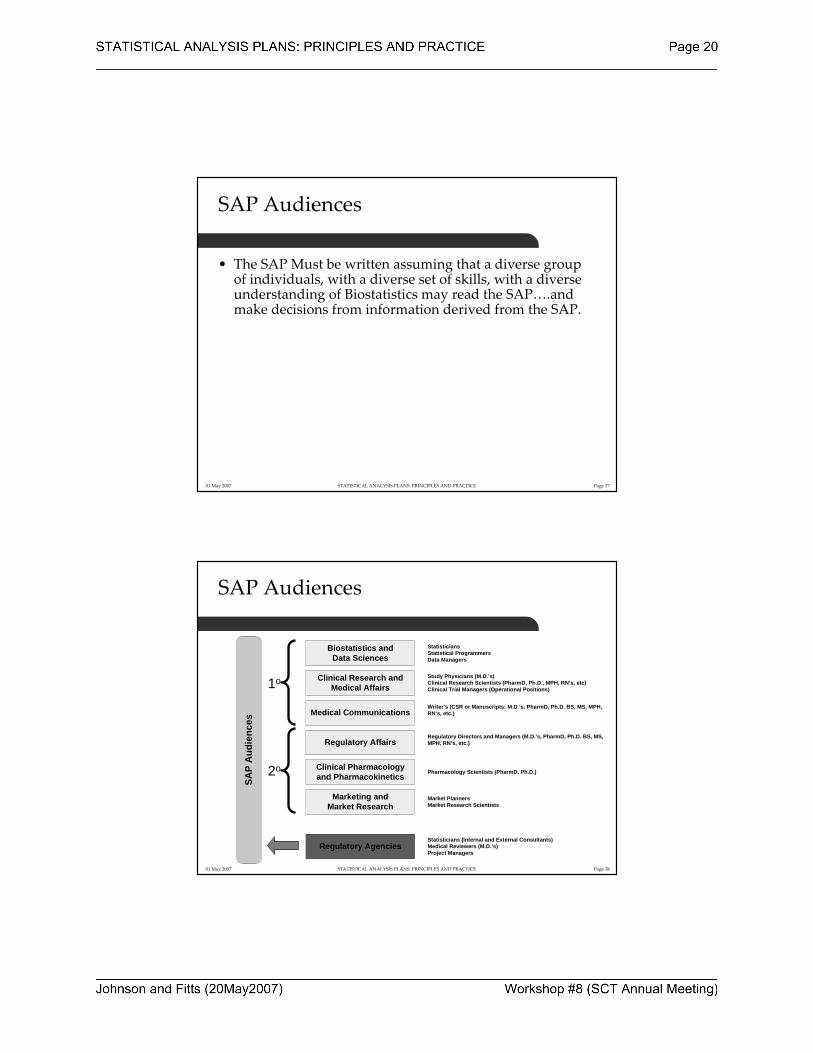
SAP Audiences
Clinical Research and Medical Affairs
Biostatistics and Data Sciences
Regulatory Affairs
Clinical Pharmacology and Pharmacokinetics
StatisticiansStatistical ProgrammersData Managers
Study Physicians (M.D.’s)Clinical Research Scientists (PharmD, Ph.D., MPH, RN’s, etc)Clinical Trial Managers (Operational Positions)
Regulatory Directors and Managers (M.D.’s, PharmD, Ph.D. BS, MS, MPH, RN’s, etc.)
Pharmacology Scientists (PharmD, Ph.D.)
Medical CommunicationsWriter’s (CSR or Manuscripts: M.D.’s, PharmD, Ph.D. BS, MS, MPH, RN’s, etc.)
Regulatory AgenciesStatisticians (Internal and External Consultants)Medical Reviewers (M.D.’s)Project Managers
Marketing andMarket Research
Market PlannersMarket Research Scientists
SAP
Aud
ienc
es
1o
2o
01 May 2007 STATISTICAL ANALYSIS PLANS: PRINCIPLES AND PRACTICE Page 39
SAP and Statistical Ethics
01 May 2007 STATISTICAL ANALYSIS PLANS: PRINCIPLES AND PRACTICE Page 40
SAP and Statistical Ethics
• Ethics associated with statistical practice are documented in:– Guidelines for Standard Operating Procedures for Good Statistical Practice in Clinical Research (PSI Professional Standards Working Party: 1996)
– Good Biometrical Practice in Medical Research (Mansmann, Jensen, and Dirschedl for Deutsche Gesellschaft für Medizinische Informatik, Biometrie und Epidemiologie)
– The Royal Statistical Society Code of Conduct (Royal Statistical Society August 1993. )
– Ethical Guidelines for Statistical Practice (American Statistical Association, August 1997)
01 May 2007 STATISTICAL ANALYSIS PLANS: PRINCIPLES AND PRACTICE Page 41
SAP and Statistical Ethics
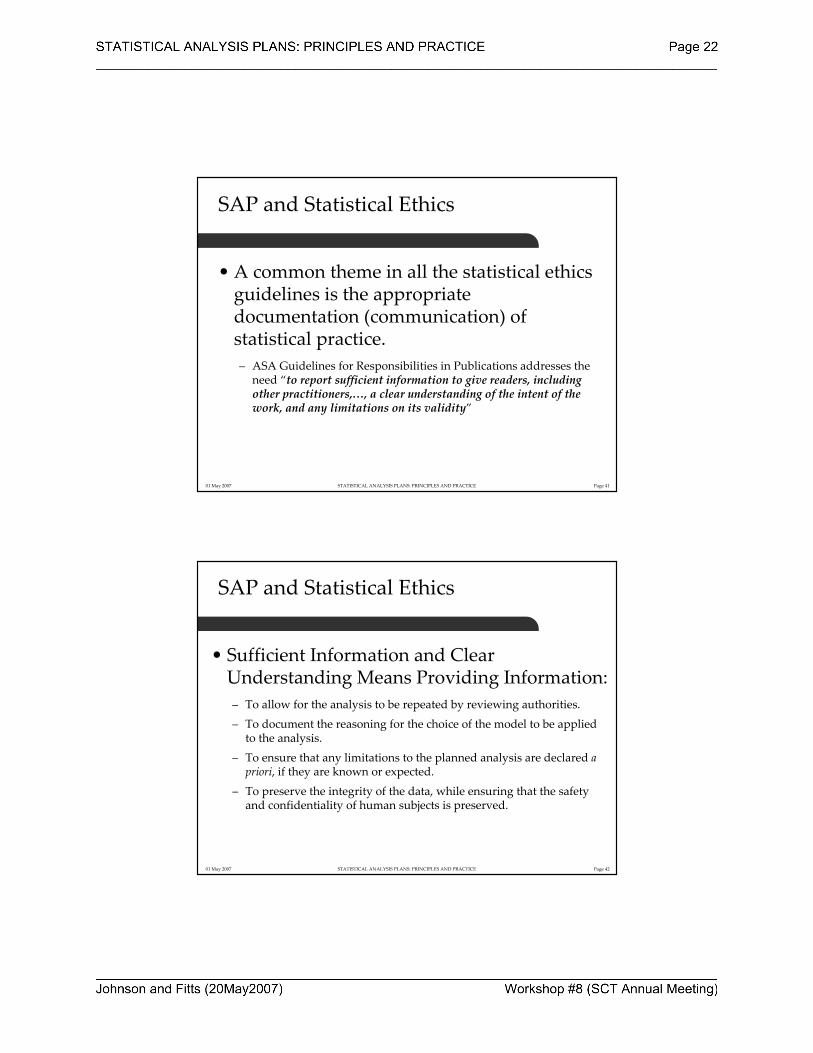
• A common theme in all the statistical ethics guidelines is the appropriate documentation (communication) of statistical practice.– ASA Guidelines for Responsibilities in Publications addresses the
need “to report sufficient information to give readers, including other practitioners,…, a clear understanding of the intent of the work, and any limitations on its validity”
01 May 2007 STATISTICAL ANALYSIS PLANS: PRINCIPLES AND PRACTICE Page 42
SAP and Statistical Ethics
• Sufficient Information and Clear Understanding Means Providing Information:– To allow for the analysis to be repeated by reviewing authorities.– To document the reasoning for the choice of the model to be applied
to the analysis.– To ensure that any limitations to the planned analysis are declared a priori, if they are known or expected.
– To preserve the integrity of the data, while ensuring that the safety and confidentiality of human subjects is preserved.
01 May 2007 STATISTICAL ANALYSIS PLANS: PRINCIPLES AND PRACTICE Page 43
SAP: Structure and Content
01 May 2007 STATISTICAL ANALYSIS PLANS: PRINCIPLES AND PRACTICE Page 44
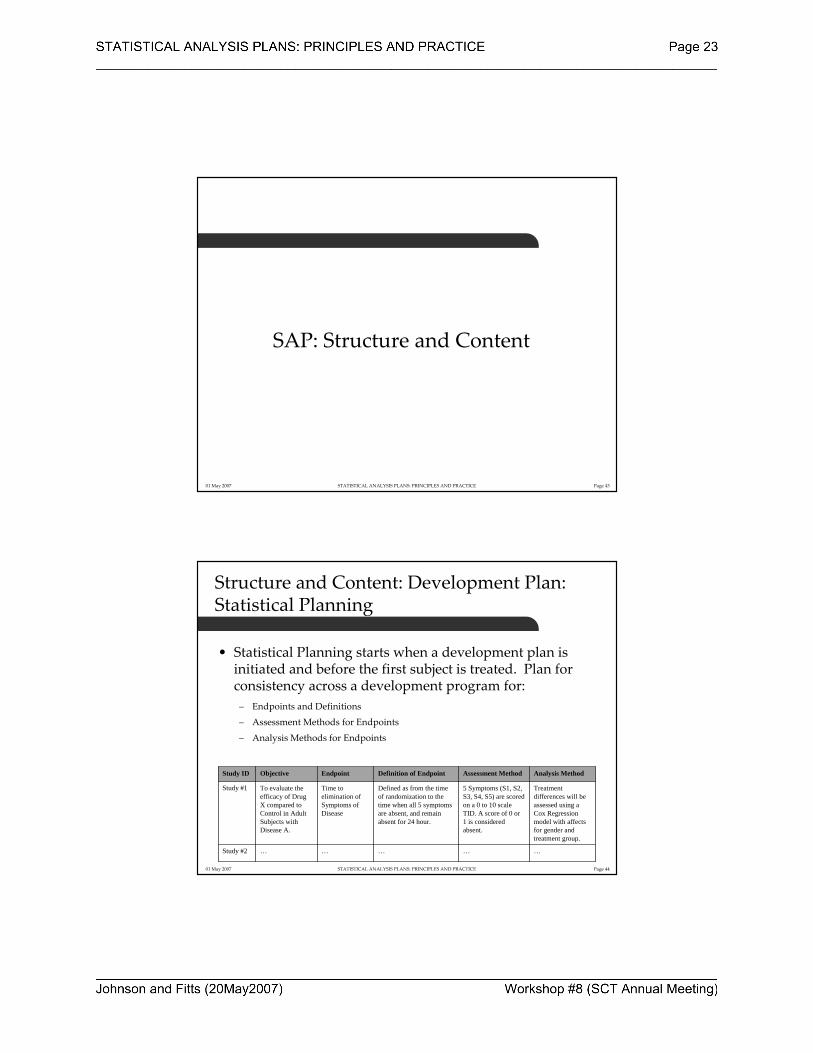
Structure and Content: Development Plan:Statistical Planning
• Statistical Planning starts when a development plan is initiated and before the first subject is treated. Plan for consistency across a development program for:– Endpoints and Definitions
– Assessment Methods for Endpoints
– Analysis Methods for Endpoints
……………Study #2
Treatment differences will be assessed using a Cox Regression model with affects for gender and treatment group.
5 Symptoms (S1, S2, S3, S4, S5) are scored on a 0 to 10 scale TID. A score of 0 or 1 is considered absent.
Defined as from the time of randomization to the time when all 5 symptoms are absent, and remain absent for 24 hour.
Time to elimination of Symptoms of Disease
To evaluate the efficacy of Drug X compared to Control in Adult Subjects with Disease A.
Study #1
Analysis MethodAssessment MethodDefinition of EndpointEndpointObjectiveStudy ID
01 May 2007 STATISTICAL ANALYSIS PLANS: PRINCIPLES AND PRACTICE Page 45
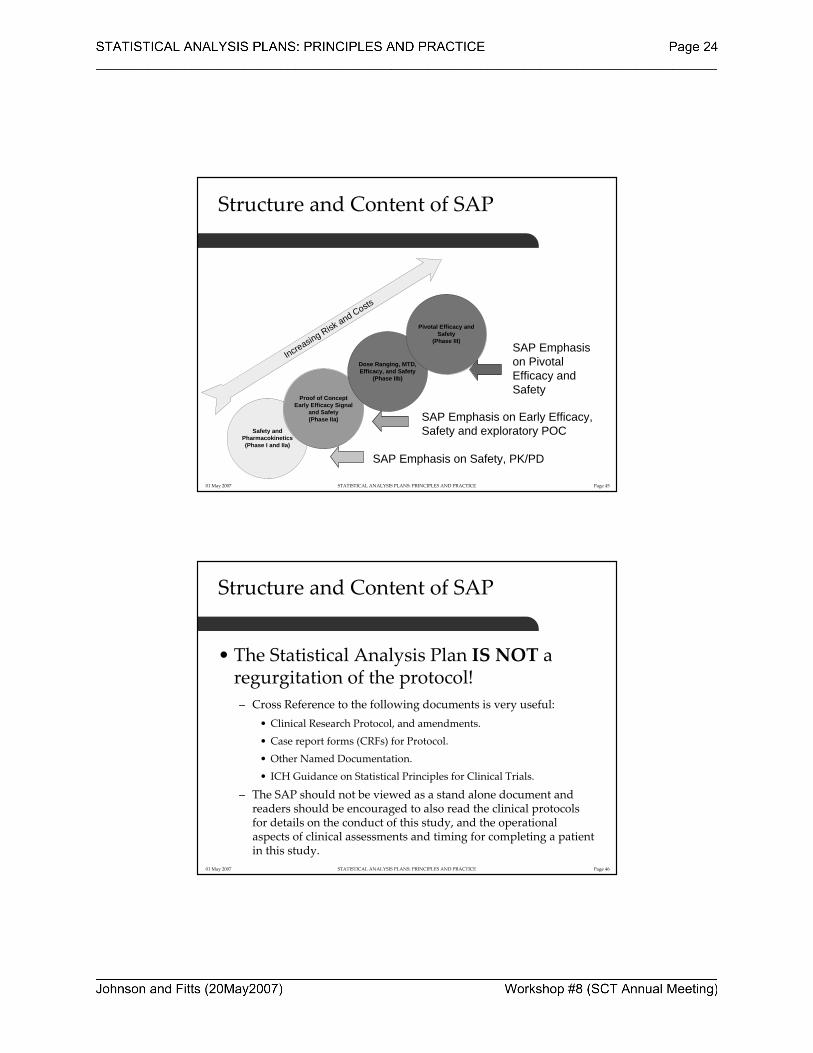
Structure and Content of SAP
SAP Emphasis on Safety, PK/PD
SAP Emphasis on Early Efficacy,Safety and exploratory POC
SAP Emphasis on Pivotal Efficacy andSafety
Increasing Risk and Costs
Safety andPharmacokinetics(Phase I and IIa)
Proof of Concept Early Efficacy Signal
and Safety(Phase IIa)
Dose Ranging, MTD, Efficacy, and Safety
(Phase IIb)
Pivotal Efficacy and Safety
(Phase III)
01 May 2007 STATISTICAL ANALYSIS PLANS: PRINCIPLES AND PRACTICE Page 46
Structure and Content of SAP
• The Statistical Analysis Plan IS NOT a regurgitation of the protocol!– Cross Reference to the following documents is very useful:
• Clinical Research Protocol, and amendments.
• Case report forms (CRFs) for Protocol.
• Other Named Documentation.
• ICH Guidance on Statistical Principles for Clinical Trials.
– The SAP should not be viewed as a stand alone document and readers should be encouraged to also read the clinical protocolsfor details on the conduct of this study, and the operational aspects of clinical assessments and timing for completing a patient in this study.
01 May 2007 STATISTICAL ANALYSIS PLANS: PRINCIPLES AND PRACTICE Page 47
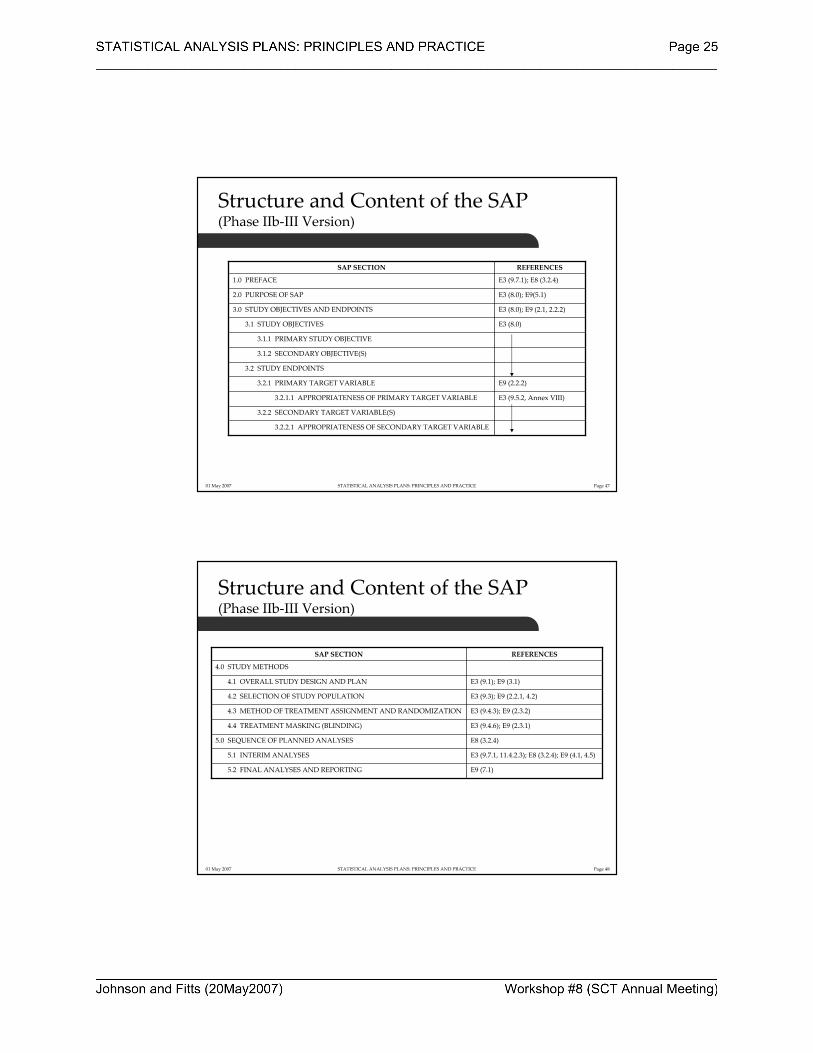
Structure and Content of the SAP(Phase IIb‐III Version)
3.2.2.1 APPROPRIATENESS OF SECONDARY TARGET VARIABLE
3.2.2 SECONDARY TARGET VARIABLE(S)
E3 (9.5.2, Annex VIII)3.2.1.1 APPROPRIATENESS OF PRIMARY TARGET VARIABLE
E9 (2.2.2)3.2.1 PRIMARY TARGET VARIABLE
3.2 STUDY ENDPOINTS
3.1.2 SECONDARY OBJECTIVE(S)
3.1.1 PRIMARY STUDY OBJECTIVE
E3 (8.0)3.1 STUDY OBJECTIVES
E3 (8.0); E9 (2.1, 2.2.2) 3.0 STUDY OBJECTIVES AND ENDPOINTS
E3 (8.0); E9(5.1)2.0 PURPOSE OF SAP
E3 (9.7.1); E8 (3.2.4)1.0 PREFACE
REFERENCESSAP SECTION
01 May 2007 STATISTICAL ANALYSIS PLANS: PRINCIPLES AND PRACTICE Page 48
Structure and Content of the SAP (Phase IIb‐III Version)
E9 (7.1)5.2 FINAL ANALYSES AND REPORTING
E3 (9.7.1, 11.4.2.3); E8 (3.2.4); E9 (4.1, 4.5)5.1 INTERIM ANALYSES
E8 (3.2.4)5.0 SEQUENCE OF PLANNED ANALYSES
E3 (9.4.6); E9 (2.3.1)4.4 TREATMENT MASKING (BLINDING)
E3 (9.4.3); E9 (2.3.2)4.3 METHOD OF TREATMENT ASSIGNMENT AND RANDOMIZATION
E3 (9.3); E9 (2.2.1, 4.2)4.2 SELECTION OF STUDY POPULATION
E3 (9.1); E9 (3.1)4.1 OVERALL STUDY DESIGN AND PLAN
4.0 STUDY METHODS
REFERENCESSAP SECTION
01 May 2007 STATISTICAL ANALYSIS PLANS: PRINCIPLES AND PRACTICE Page 49
Structure and Content of the SAP (Phase IIb‐III Version)
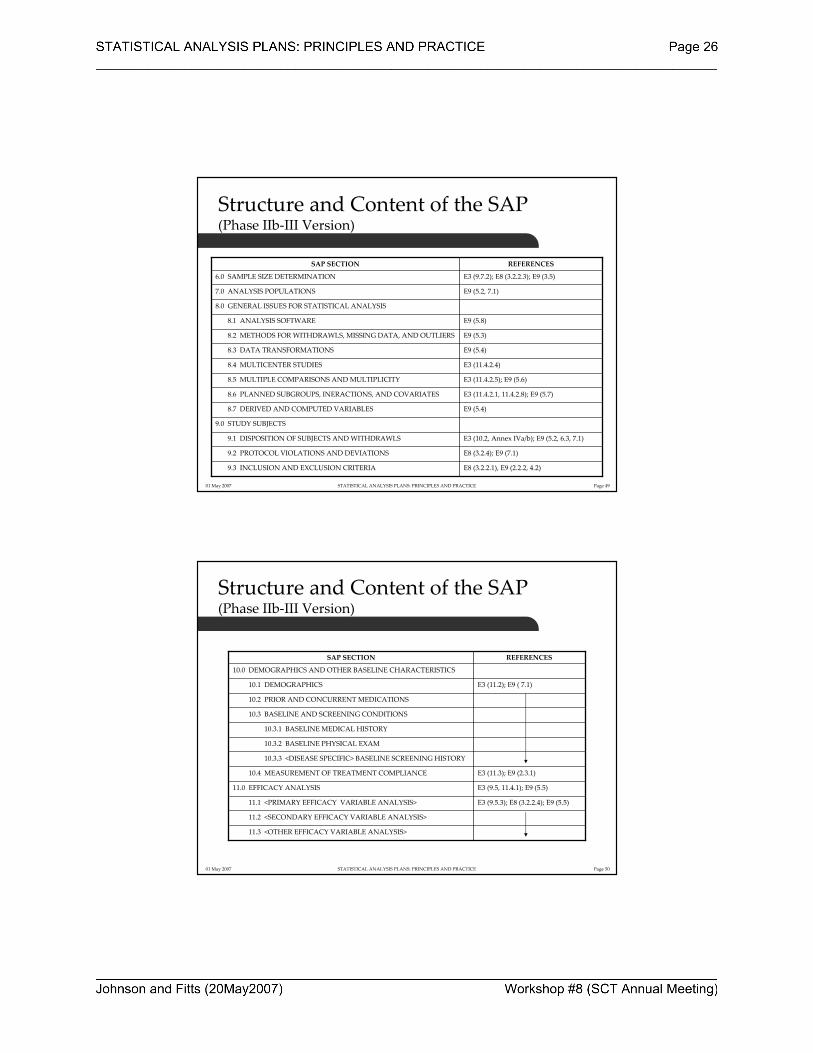
E8 (3.2.2.1), E9 (2.2.2, 4.2)9.3 INCLUSION AND EXCLUSION CRITERIA
E8 (3.2.4); E9 (7.1)9.2 PROTOCOL VIOLATIONS AND DEVIATIONS
E3 (10.2, Annex IVa/b); E9 (5.2, 6.3, 7.1)9.1 DISPOSITION OF SUBJECTS AND WITHDRAWLS
9.0 STUDY SUBJECTS
E9 (5.4)8.7 DERIVED AND COMPUTED VARIABLES
E3 (11.4.2.1, 11.4.2.8); E9 (5.7)8.6 PLANNED SUBGROUPS, INERACTIONS, AND COVARIATES
E3 (11.4.2.5); E9 (5.6)8.5 MULTIPLE COMPARISONS AND MULTIPLICITY
E3 (11.4.2.4)8.4 MULTICENTER STUDIES
E9 (5.4)8.3 DATA TRANSFORMATIONS
E9 (5.3)8.2 METHODS FOR WITHDRAWLS, MISSING DATA, AND OUTLIERS
E9 (5.8)8.1 ANALYSIS SOFTWARE
8.0 GENERAL ISSUES FOR STATISTICAL ANALYSIS
E9 (5.2, 7.1)7.0 ANALYSIS POPULATIONS
E3 (9.7.2); E8 (3.2.2.3); E9 (3.5)6.0 SAMPLE SIZE DETERMINATION
REFERENCESSAP SECTION
01 May 2007 STATISTICAL ANALYSIS PLANS: PRINCIPLES AND PRACTICE Page 50
Structure and Content of the SAP (Phase IIb‐III Version)
11.3 <OTHER EFFICACY VARIABLE ANALYSIS>
11.2 <SECONDARY EFFICACY VARIABLE ANALYSIS>
E3 (9.5.3); E8 (3.2.2.4); E9 (5.5)11.1 <PRIMARY EFFICACY VARIABLE ANALYSIS>
E3 (9.5, 11.4.1); E9 (5.5)11.0 EFFICACY ANALYSIS
E3 (11.3); E9 (2.3.1)10.4 MEASUREMENT OF TREATMENT COMPLIANCE
10.3.3 <DISEASE SPECIFIC> BASELINE SCREENING HISTORY
10.3.2 BASELINE PHYSICAL EXAM
10.3.1 BASELINE MEDICAL HISTORY
10.3 BASELINE AND SCREENING CONDITIONS
10.2 PRIOR AND CONCURRENT MEDICATIONS
E3 (11.2); E9 ( 7.1)10.1 DEMOGRAPHICS
10.0 DEMOGRAPHICS AND OTHER BASELINE CHARACTERISTICS
REFERENCESSAP SECTION
01 May 2007 STATISTICAL ANALYSIS PLANS: PRINCIPLES AND PRACTICE Page 51
Structure and Content of the SAP (Phase IIb‐III Version)
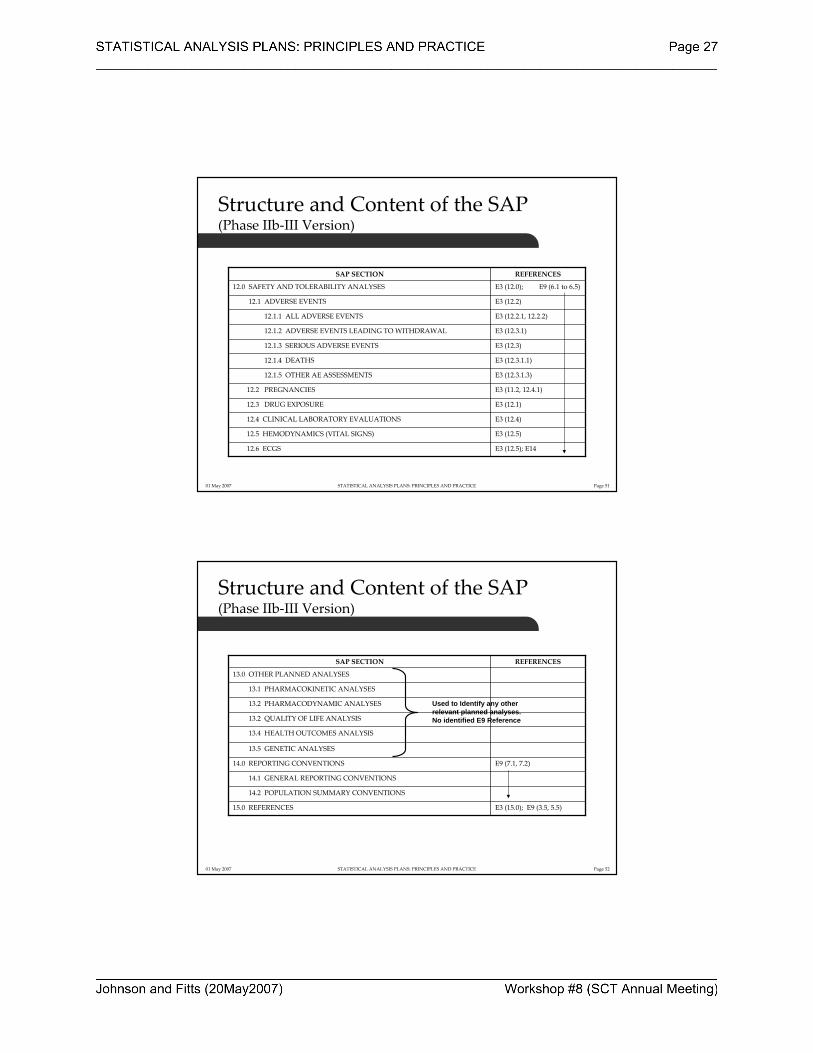
E3 (12.5); E1412.6 ECGS
E3 (12.5)12.5 HEMODYNAMICS (VITAL SIGNS)
E3 (12.4)12.4 CLINICAL LABORATORY EVALUATIONS
E3 (12.1)12.3 DRUG EXPOSURE
E3 (11.2, 12.4.1)12.2 PREGNANCIES
E3 (12.3.1.3)12.1.5 OTHER AE ASSESSMENTS
E3 (12.3.1.1)12.1.4 DEATHS
E3 (12.3)12.1.3 SERIOUS ADVERSE EVENTS
E3 (12.3.1)12.1.2 ADVERSE EVENTS LEADING TO WITHDRAWAL
E3 (12.2.1, 12.2.2)12.1.1 ALL ADVERSE EVENTS
E3 (12.2)12.1 ADVERSE EVENTS
E3 (12.0); E9 (6.1 to 6.5)12.0 SAFETY AND TOLERABILITY ANALYSES
REFERENCESSAP SECTION
01 May 2007 STATISTICAL ANALYSIS PLANS: PRINCIPLES AND PRACTICE Page 52
Structure and Content of the SAP (Phase IIb‐III Version)
E3 (15.0); E9 (3.5, 5.5)15.0 REFERENCES
14.2 POPULATION SUMMARY CONVENTIONS
14.1 GENERAL REPORTING CONVENTIONS
E9 (7.1, 7.2)14.0 REPORTING CONVENTIONS
13.5 GENETIC ANALYSES
13.4 HEALTH OUTCOMES ANALYSIS
13.2 QUALITY OF LIFE ANALYSIS
13.2 PHARMACODYNAMIC ANALYSES
13.1 PHARMACOKINETIC ANALYSES
13.0 OTHER PLANNED ANALYSES
REFERENCESSAP SECTION
Used to Identify any otherrelevant planned analyses.No identified E9 Reference
01 May 2007 STATISTICAL ANALYSIS PLANS: PRINCIPLES AND PRACTICE Page 53
Structure and Content of the SAP (Phase IIb‐III Version)
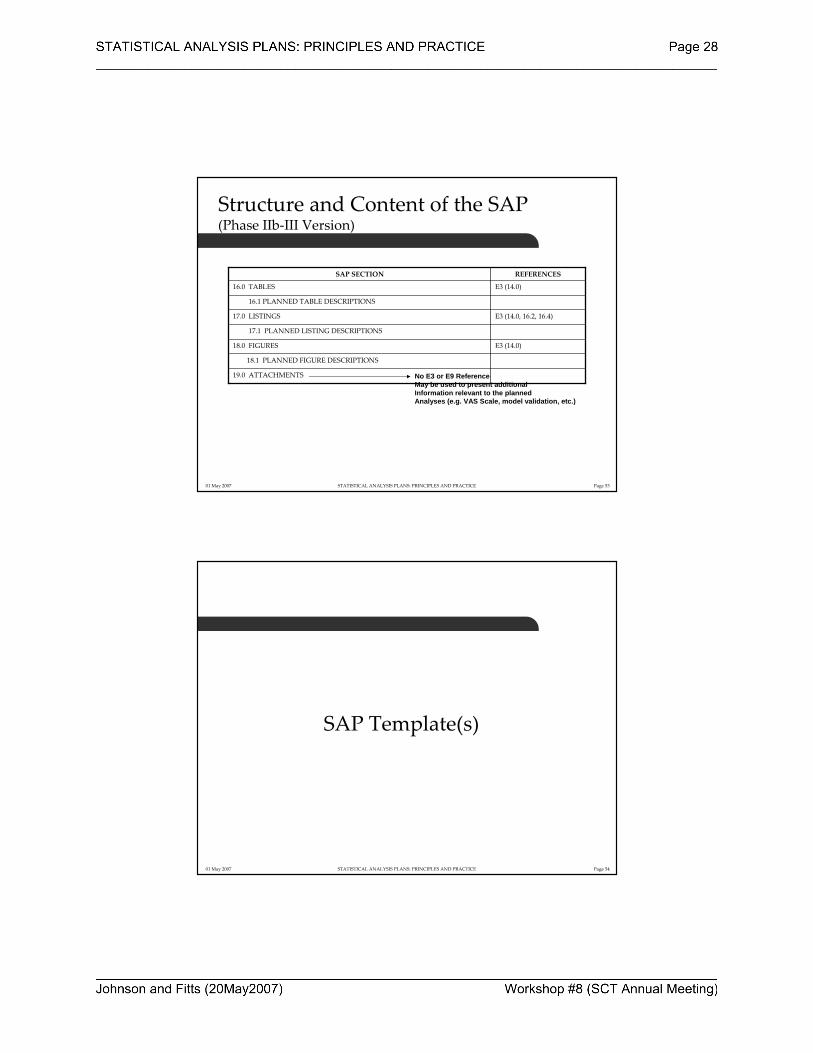
19.0 ATTACHMENTS
18.1 PLANNED FIGURE DESCRIPTIONS
E3 (14.0)18.0 FIGURES
17.1 PLANNED LISTING DESCRIPTIONS
E3 (14.0, 16.2, 16.4)17.0 LISTINGS
16.1 PLANNED TABLE DESCRIPTIONS
E3 (14.0)16.0 TABLES
REFERENCESSAP SECTION
No E3 or E9 ReferenceMay be used to present additionalInformation relevant to the plannedAnalyses (e.g. VAS Scale, model validation, etc.)
01 May 2007 STATISTICAL ANALYSIS PLANS: PRINCIPLES AND PRACTICE Page 54
SAP Template(s)
01 May 2007 STATISTICAL ANALYSIS PLANS: PRINCIPLES AND PRACTICE Page 55
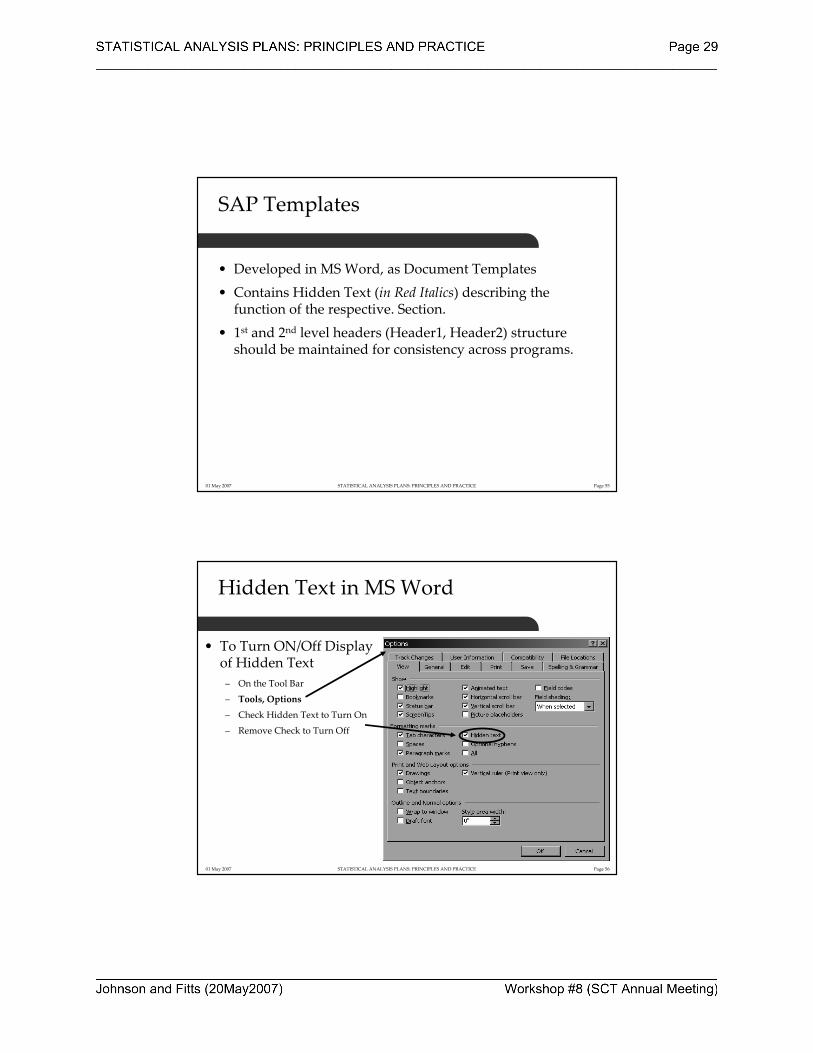
SAP Templates
• Developed in MS Word, as Document Templates
• Contains Hidden Text (in Red Italics) describing the function of the respective. Section.
• 1st and 2nd level headers (Header1, Header2) structure should be maintained for consistency across programs.
01 May 2007 STATISTICAL ANALYSIS PLANS: PRINCIPLES AND PRACTICE Page 56
Hidden Text in MS Word
• To Turn ON/Off Display of Hidden Text– On the Tool Bar
– Tools, Options
– Check Hidden Text to Turn On
– Remove Check to Turn Off
01 May 2007 STATISTICAL ANALYSIS PLANS: PRINCIPLES AND PRACTICE Page 57
SAP Template(s)
• Draft SAP Template for Phase I Studies (with Safety and PK/PK Components, No Efficacy)
• Draft SAP Template for Phase I‐IIa / POC Studies (with an Exploratory Proof Of Concept or screening study Efficacy Component)
• Draft SAP Template for Phase IIb / III Studies (Confirmatory, Registration, Studies)
01 May 2007 STATISTICAL ANALYSIS PLANS: PRINCIPLES AND PRACTICE Page 58
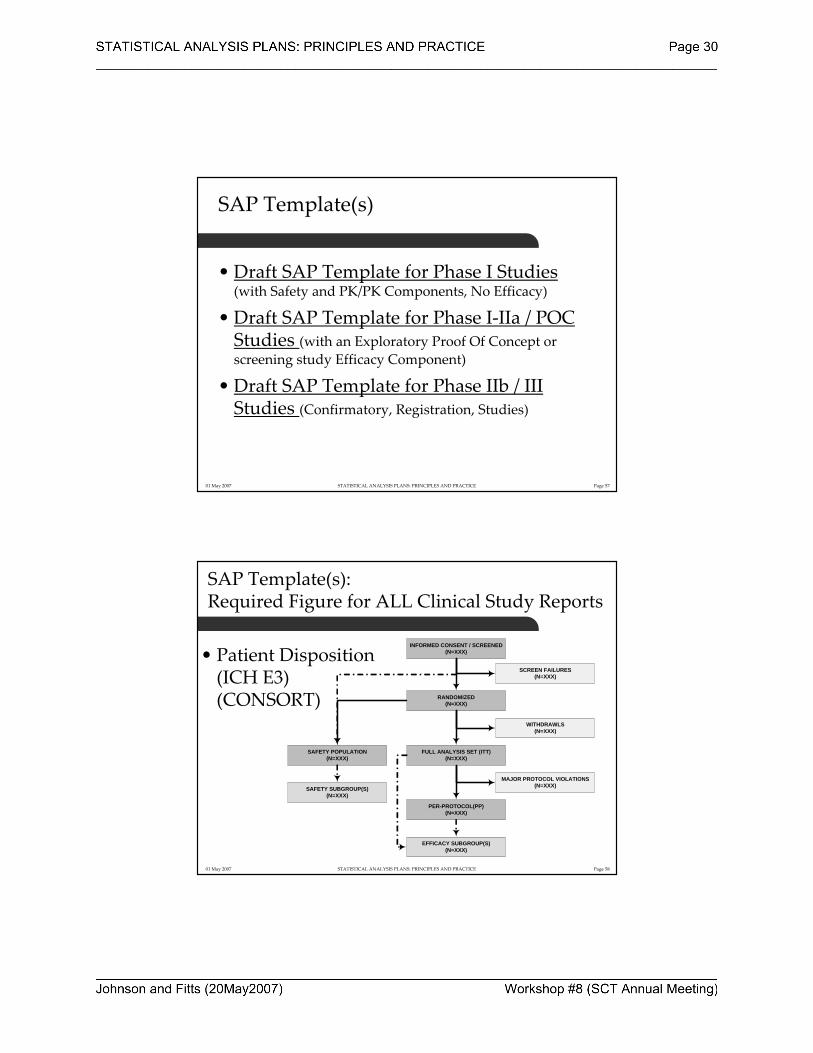
SAP Template(s): Required Figure for ALL Clinical Study Reports
• Patient Disposition(ICH E3)(CONSORT)
INFORMED CONSENT / SCREENED(N=XXX)
SCREEN FAILURES(N=XXX)
RANDOMIZED(N=XXX)
WITHDRAWLS(N=XXX)
SAFETY POPULATION(N=XXX)
FULL ANALYSIS SET (ITT)(N=XXX)
SAFETY SUBGROUP(S)(N=XXX)
MAJOR PROTOCOL VIOLATIONS(N=XXX)
PER-PROTOCOL(PP)(N=XXX)
EFFICACY SUBGROUP(S)(N=XXX)
01 May 2007 STATISTICAL ANALYSIS PLANS: PRINCIPLES AND PRACTICE Page 59
Table, Listing, Figure Template
• The production of Tables, Listings, and Figures (TLF) is separate from the completion of the SAP.
• TLF Production template is a guide for the form and function of each planned TLF, and serves as a programming guide.
• Draft TLF Production Template – (Note: TLF shells can be included that are study, program , or organization
specific.)
01 May 2007 STATISTICAL ANALYSIS PLANS: PRINCIPLES AND PRACTICE Page 60
SAPCommunication & Writing Styles(Some Tips for Effective Statistical Writing)

01 May 2007 STATISTICAL ANALYSIS PLANS: PRINCIPLES AND PRACTICE Page 61
SAP: Effective Communication
• If the reader is to grasp what the writer means, the writer must understand what the reader needs.
• The fundamental purpose of scientific discourse is not the mere presentation of information and thought, but its communication. …. it matters only whether a large majority of the reading audience accurately perceives what the author had in mind. – Gopen GD, Swan JA. The Science of Scientific Writing. American‐Scientist
Nov‐Dec 1990: 78; 550‐558.
01 May 2007 STATISTICAL ANALYSIS PLANS: PRINCIPLES AND PRACTICE Page 62
SAP: Effective Communication
• Myth: Obscurity Equals Brilliance – Many people use jargon and obscure writing that makes their words inscrutable to everyone except the two colleagues who already know their work……What obscurity really does, however, is conveniently mask ignorance and error; if no one understands your work, no one canevaluate it either. (Terra Ziporyn, Ph.D., Associate Editor for JAMA and Scientific Writing Professor)
– Vagueness does not make for good science or good writing; clarity, precision, and specificity do!
01 May 2007 STATISTICAL ANALYSIS PLANS: PRINCIPLES AND PRACTICE Page 63
SAP: Effective Communication
• Myth: Writing Well is Easy – Clear and concise writing takes time and effort.– Effective writing goes hand‐in‐hand with clear thinking and a well developed self‐critical sense to be able to judge your own writing objectively, and honestly evaluate the works ability to communicate the science. (Terra Ziporyn, Ph.D., Associate Editor for JAMA and Scientific Writing Professor)
01 May 2007 STATISTICAL ANALYSIS PLANS: PRINCIPLES AND PRACTICE Page 64
SAP: Effective Communication
• Statistics is NOT easy to Communicate – Recommended Reading:
• King, LS. Why Not Say it Clearly: A Guide to Scientific Writing. 1991.
• Albert, T. A‐Z of Medical Writing. 2000.
• Day RA. Scientific English: A Guide for Scientists and Other Professionals, 2nd Edition. 1995.
• Montgomery SL. The Chicago Guide to Communicating Science. 2003.• Mathews JR. Bowen JM, Mathews RW. Successful Scientific Writing: A Step‐by‐Step Guide to the Biological and Medical Sciences. 2001.
• Lang TA. How to Report Statistics in Medicine: Annotated Guidelines for Authors, Editors, and Reviewers. American College of Physicians. 1997.
01 May 2007 STATISTICAL ANALYSIS PLANS: PRINCIPLES AND PRACTICE Page 65
SAP: Effective Communication
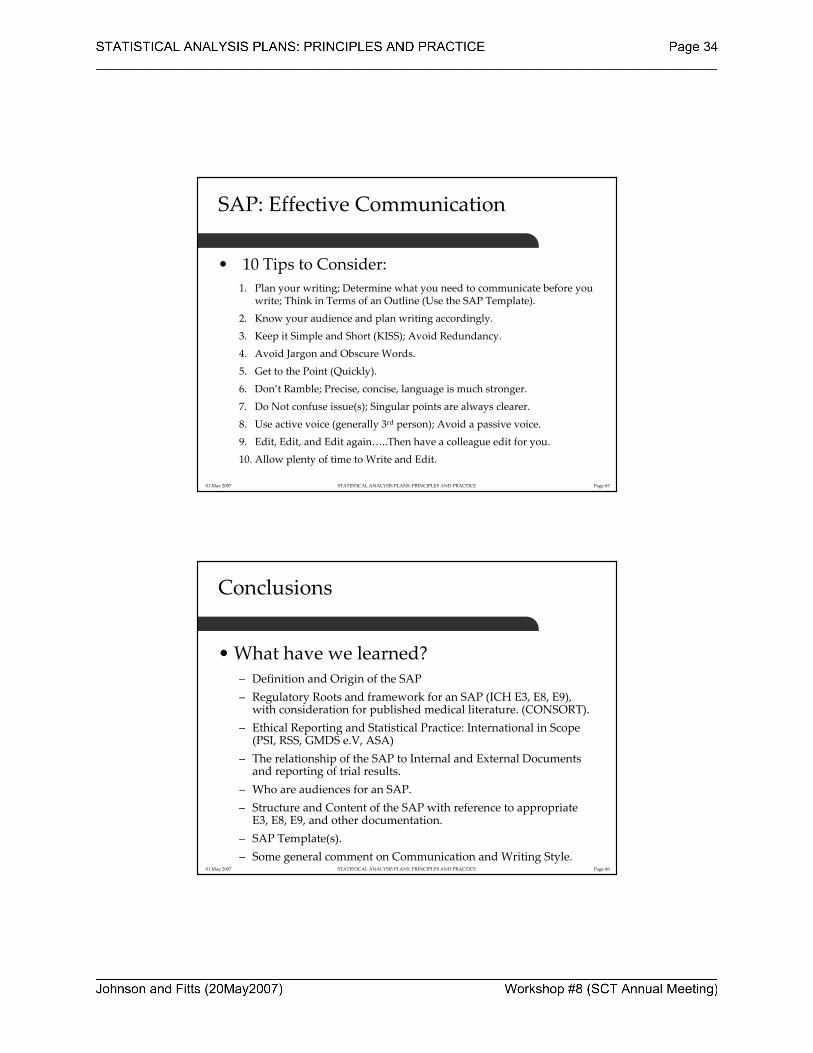
• 10 Tips to Consider:1. Plan your writing; Determine what you need to communicate before you
write; Think in Terms of an Outline (Use the SAP Template).
2. Know your audience and plan writing accordingly.
3. Keep it Simple and Short (KISS); Avoid Redundancy.
4. Avoid Jargon and Obscure Words.
5. Get to the Point (Quickly).
6. Don’t Ramble; Precise, concise, language is much stronger.
7. Do Not confuse issue(s); Singular points are always clearer.
8. Use active voice (generally 3rd person); Avoid a passive voice.
9. Edit, Edit, and Edit again…..Then have a colleague edit for you.10. Allow plenty of time to Write and Edit.
01 May 2007 STATISTICAL ANALYSIS PLANS: PRINCIPLES AND PRACTICE Page 66
Conclusions
• What have we learned?– Definition and Origin of the SAP– Regulatory Roots and framework for an SAP (ICH E3, E8, E9),
with consideration for published medical literature. (CONSORT).– Ethical Reporting and Statistical Practice: International in Scope
(PSI, RSS, GMDS e.V, ASA)– The relationship of the SAP to Internal and External Documents
and reporting of trial results.– Who are audiences for an SAP.– Structure and Content of the SAP with reference to appropriate
E3, E8, E9, and other documentation.– SAP Template(s).– Some general comment on Communication and Writing Style.
01 May 2007 STATISTICAL ANALYSIS PLANS: PRINCIPLES AND PRACTICE Page 67
Download this Workshop
If you wish to download an electronic copy of this workshop go to:
Web Page: www.minimalsufficency.com
Or
Email [email protected]
The presentation and templates are available for free as Microsoft Word (*.dot) files.
01 May 2007 STATISTICAL ANALYSIS PLANS: PRINCIPLES AND PRACTICE Page 68
Questions
STATISTICAL ANALYSIS PLANS PRINCIPLES AND PRACTICE
Society for Clinical Trials Workshop May 20, 2007
Attachment SAP Template for a Phase II/III Study
<INSERT LOGO>
STATISTICAL ANALYSIS PLAN
Insert the full protocol title, final protocol date, SAP Author and versioning, and the name(s) of individuals who will approve the SAP. Protocol Title (Number):
<full title of Protocol> (protocol number)
Protocol Date: SAP Author: SAP Version: SAP Date:
CONFIDENTIAL
<Protocol Number> Statistical Analysis Plan Page 2
4/17/2007 CONFIDENTIAL
Approvals: Approved By: Name: <Name> Date: <Title> Name: <Name> Date: <Title>
<Protocol Number> Statistical Analysis Plan Page 3
4/17/2007 CONFIDENTIAL
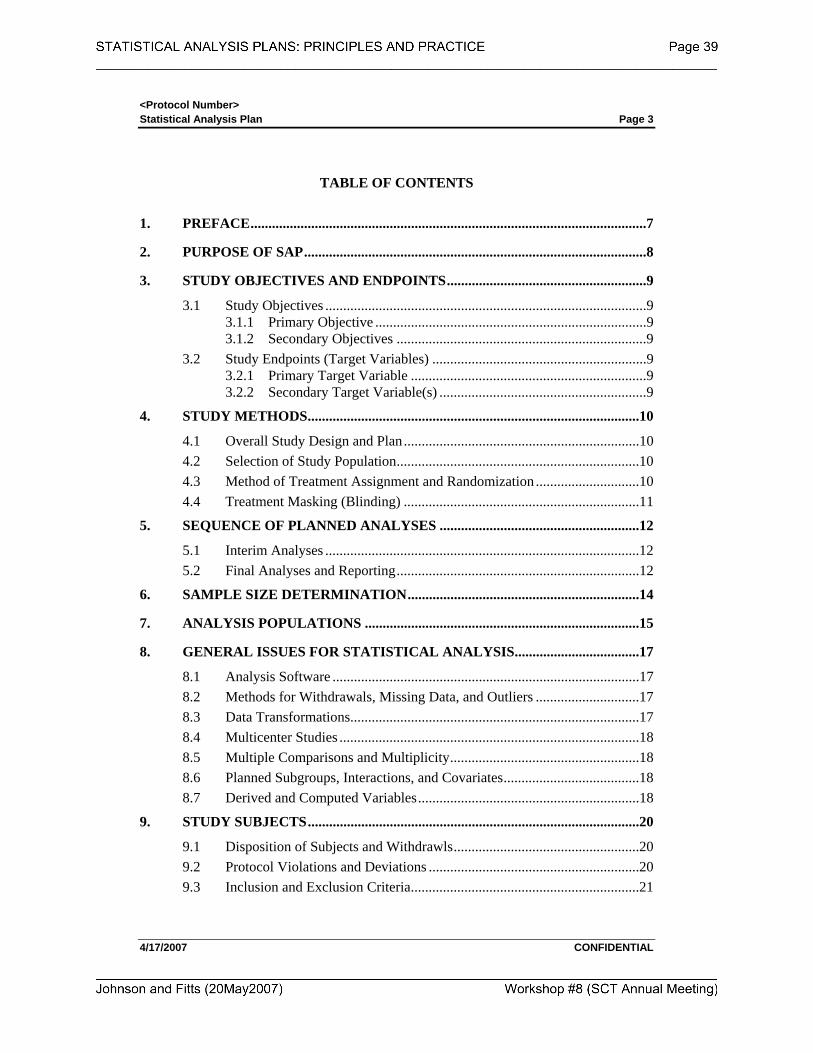
TABLE OF CONTENTS
1. PREFACE...............................................................................................................7
2. PURPOSE OF SAP................................................................................................8
3. STUDY OBJECTIVES AND ENDPOINTS........................................................9
3.1 Study Objectives ..........................................................................................9 3.1.1 Primary Objective ............................................................................9 3.1.2 Secondary Objectives ......................................................................9
3.2 Study Endpoints (Target Variables) ............................................................9 3.2.1 Primary Target Variable ..................................................................9 3.2.2 Secondary Target Variable(s) ..........................................................9
4. STUDY METHODS.............................................................................................10
4.1 Overall Study Design and Plan..................................................................10 4.2 Selection of Study Population....................................................................10 4.3 Method of Treatment Assignment and Randomization .............................10 4.4 Treatment Masking (Blinding) ..................................................................11
5. SEQUENCE OF PLANNED ANALYSES ........................................................12
5.1 Interim Analyses ........................................................................................12 5.2 Final Analyses and Reporting....................................................................12
6. SAMPLE SIZE DETERMINATION.................................................................14
7. ANALYSIS POPULATIONS .............................................................................15
8. GENERAL ISSUES FOR STATISTICAL ANALYSIS...................................17
8.1 Analysis Software ......................................................................................17 8.2 Methods for Withdrawals, Missing Data, and Outliers .............................17 8.3 Data Transformations.................................................................................17 8.4 Multicenter Studies ....................................................................................18 8.5 Multiple Comparisons and Multiplicity.....................................................18 8.6 Planned Subgroups, Interactions, and Covariates......................................18 8.7 Derived and Computed Variables..............................................................18
9. STUDY SUBJECTS.............................................................................................20
9.1 Disposition of Subjects and Withdrawls....................................................20 9.2 Protocol Violations and Deviations ...........................................................20 9.3 Inclusion and Exclusion Criteria................................................................21
<Protocol Number> Statistical Analysis Plan Page 4
4/17/2007 CONFIDENTIAL
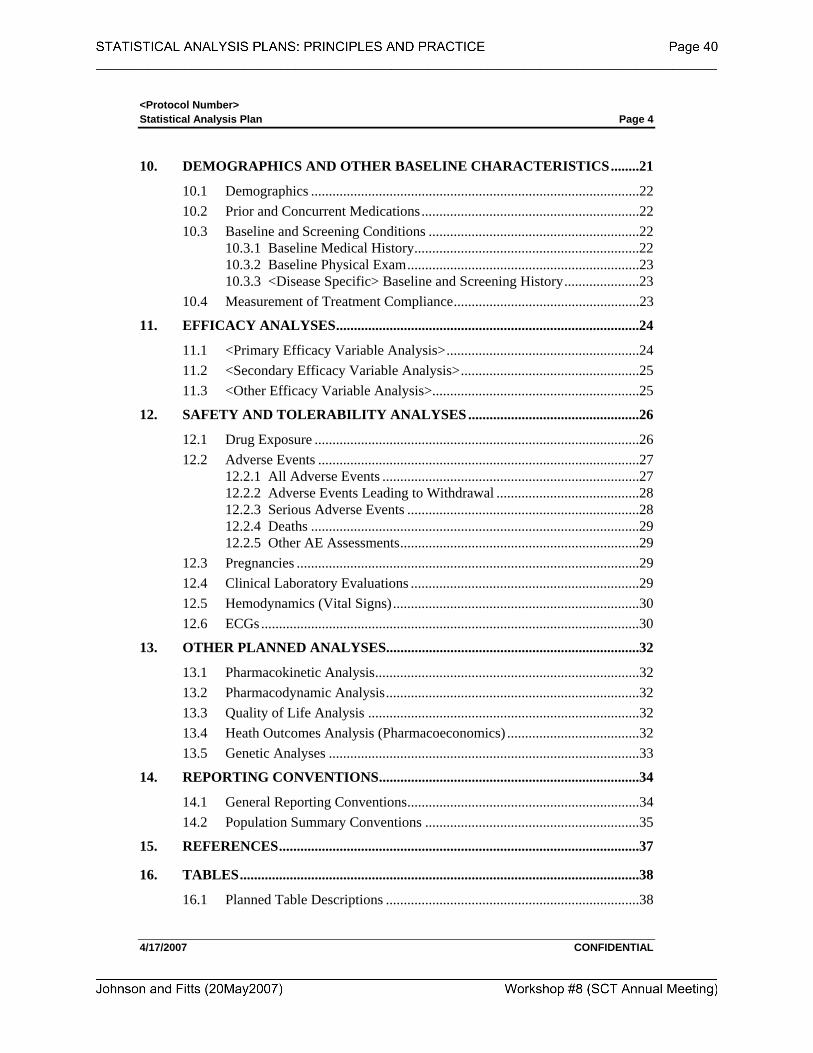
10. DEMOGRAPHICS AND OTHER BASELINE CHARACTERISTICS........21
10.1 Demographics ............................................................................................22 10.2 Prior and Concurrent Medications.............................................................22 10.3 Baseline and Screening Conditions ...........................................................22
10.3.1 Baseline Medical History...............................................................22 10.3.2 Baseline Physical Exam.................................................................23 10.3.3 <Disease Specific> Baseline and Screening History.....................23
10.4 Measurement of Treatment Compliance....................................................23
11. EFFICACY ANALYSES.....................................................................................24
11.1 <Primary Efficacy Variable Analysis>......................................................24 11.2 <Secondary Efficacy Variable Analysis>..................................................25 11.3 <Other Efficacy Variable Analysis>..........................................................25
12. SAFETY AND TOLERABILITY ANALYSES................................................26
12.1 Drug Exposure ...........................................................................................26 12.2 Adverse Events ..........................................................................................27
12.2.1 All Adverse Events ........................................................................27 12.2.2 Adverse Events Leading to Withdrawal ........................................28 12.2.3 Serious Adverse Events .................................................................28 12.2.4 Deaths ............................................................................................29 12.2.5 Other AE Assessments...................................................................29
12.3 Pregnancies ................................................................................................29 12.4 Clinical Laboratory Evaluations ................................................................29 12.5 Hemodynamics (Vital Signs).....................................................................30 12.6 ECGs ..........................................................................................................30
13. OTHER PLANNED ANALYSES.......................................................................32
13.1 Pharmacokinetic Analysis..........................................................................32 13.2 Pharmacodynamic Analysis.......................................................................32 13.3 Quality of Life Analysis ............................................................................32 13.4 Heath Outcomes Analysis (Pharmacoeconomics) .....................................32 13.5 Genetic Analyses .......................................................................................33
14. REPORTING CONVENTIONS.........................................................................34
14.1 General Reporting Conventions.................................................................34 14.2 Population Summary Conventions ............................................................35
15. REFERENCES.....................................................................................................37
16. TABLES................................................................................................................38
16.1 Planned Table Descriptions .......................................................................38
<Protocol Number> Statistical Analysis Plan Page 5
4/17/2007 CONFIDENTIAL
17. LISTINGS.............................................................................................................40
17.1 Planned Listing Descriptions .....................................................................40
18. FIGURES..............................................................................................................41
18.1 Planned Figure Descriptions......................................................................41
19. ATTACHMENT ..................................................................................................42
<Protocol Number> Statistical Analysis Plan Page 6
4/17/2007 CONFIDENTIAL
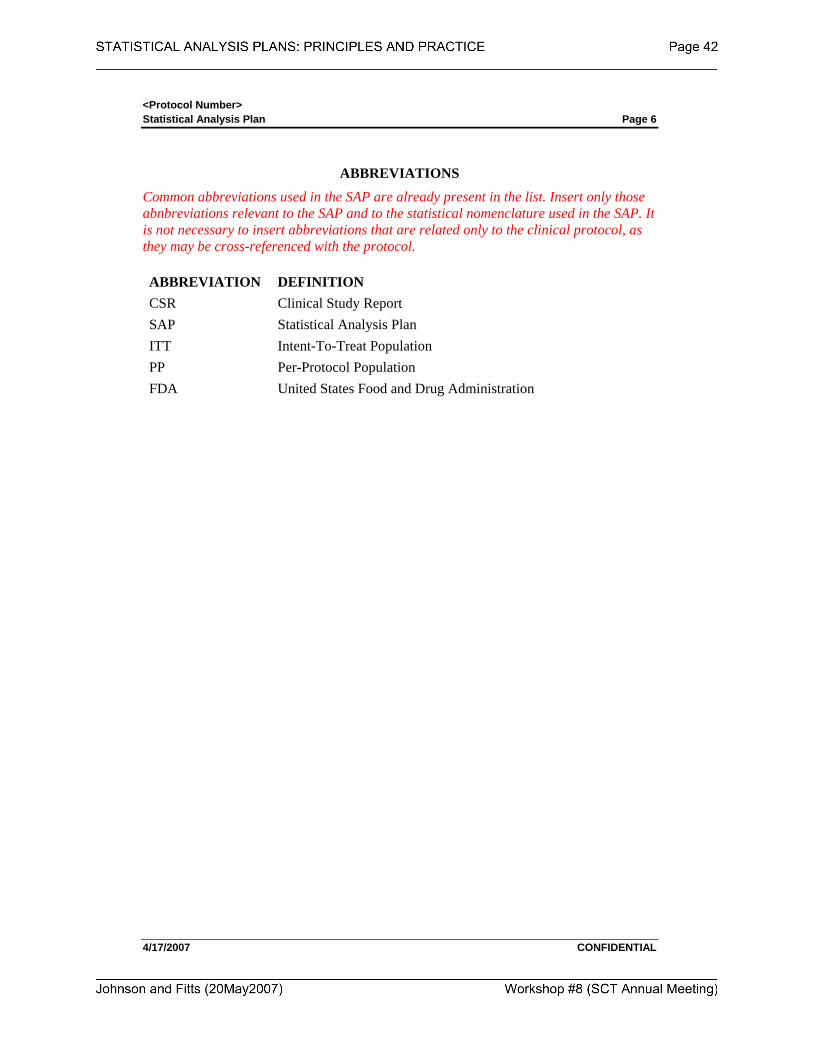
ABBREVIATIONS
Common abbreviations used in the SAP are already present in the list. Insert only those abnbreviations relevant to the SAP and to the statistical nomenclature used in the SAP. It is not necessary to insert abbreviations that are related only to the clinical protocol, as they may be cross-referenced with the protocol. ABBREVIATION DEFINITION CSR Clinical Study Report SAP Statistical Analysis Plan ITT Intent-To-Treat Population PP Per-Protocol Population FDA United States Food and Drug Administration
<Protocol Number> Statistical Analysis Plan Page 7
4/17/2007 CONFIDENTIAL
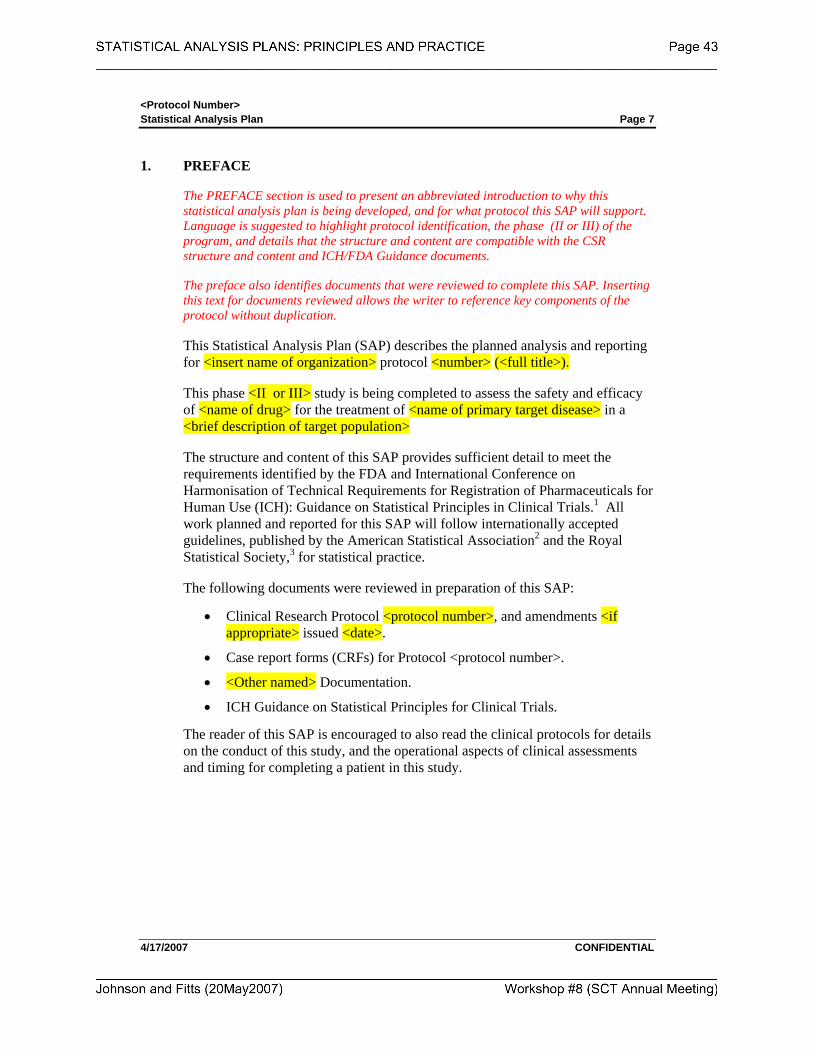
1. PREFACE
The PREFACE section is used to present an abbreviated introduction to why this statistical analysis plan is being developed, and for what protocol this SAP will support. Language is suggested to highlight protocol identification, the phase (II or III) of the program, and details that the structure and content are compatible with the CSR structure and content and ICH/FDA Guidance documents.
The preface also identifies documents that were reviewed to complete this SAP. Inserting this text for documents reviewed allows the writer to reference key components of the protocol without duplication.
This Statistical Analysis Plan (SAP) describes the planned analysis and reporting for <insert name of organization> protocol <number> (<full title>).
This phase <II or III> study is being completed to assess the safety and efficacy of <name of drug> for the treatment of <name of primary target disease> in a <brief description of target population>
The structure and content of this SAP provides sufficient detail to meet the requirements identified by the FDA and International Conference on Harmonisation of Technical Requirements for Registration of Pharmaceuticals for Human Use (ICH): Guidance on Statistical Principles in Clinical Trials.1 All work planned and reported for this SAP will follow internationally accepted guidelines, published by the American Statistical Association2 and the Royal Statistical Society,3 for statistical practice.
The following documents were reviewed in preparation of this SAP:
• Clinical Research Protocol <protocol number>, and amendments <if appropriate> issued <date>.
• Case report forms (CRFs) for Protocol <protocol number>.
• <Other named> Documentation.
• ICH Guidance on Statistical Principles for Clinical Trials.
The reader of this SAP is encouraged to also read the clinical protocols for details on the conduct of this study, and the operational aspects of clinical assessments and timing for completing a patient in this study.
<Protocol Number> Statistical Analysis Plan Page 8
4/17/2007 CONFIDENTIAL
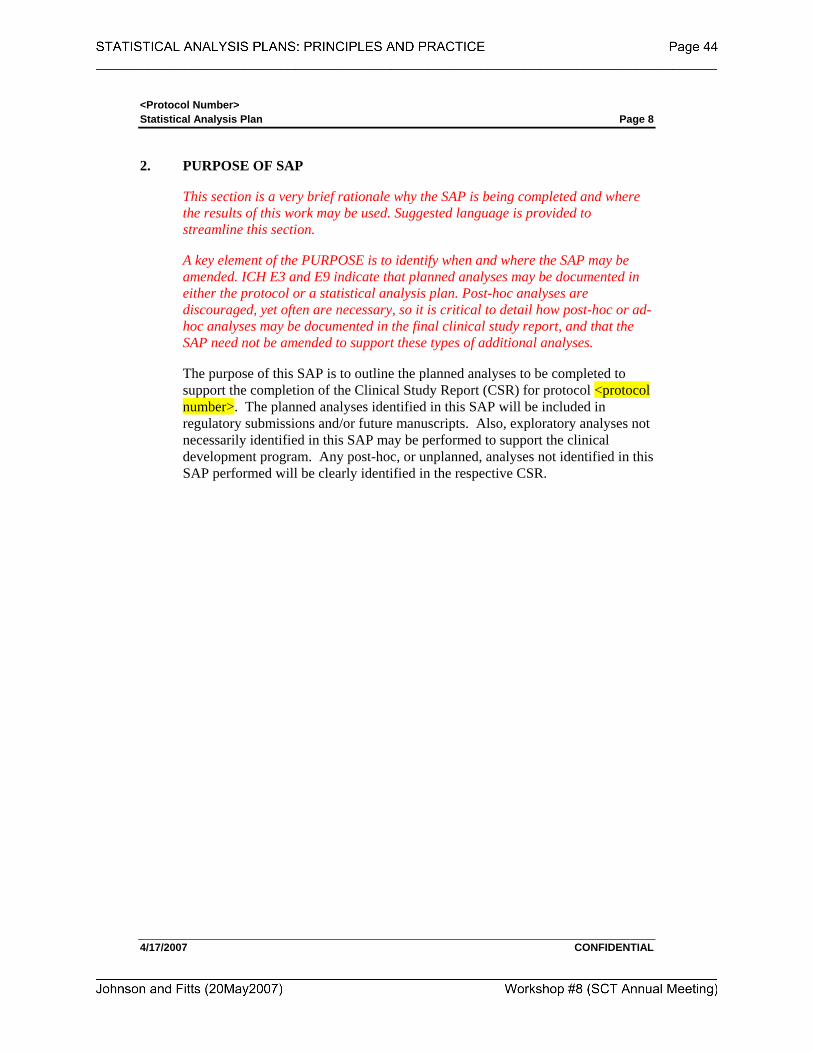
2. PURPOSE OF SAP
This section is a very brief rationale why the SAP is being completed and where the results of this work may be used. Suggested language is provided to streamline this section.
A key element of the PURPOSE is to identify when and where the SAP may be amended. ICH E3 and E9 indicate that planned analyses may be documented in either the protocol or a statistical analysis plan. Post-hoc analyses are discouraged, yet often are necessary, so it is critical to detail how post-hoc or ad-hoc analyses may be documented in the final clinical study report, and that the SAP need not be amended to support these types of additional analyses.
The purpose of this SAP is to outline the planned analyses to be completed to support the completion of the Clinical Study Report (CSR) for protocol <protocol number>. The planned analyses identified in this SAP will be included in regulatory submissions and/or future manuscripts. Also, exploratory analyses not necessarily identified in this SAP may be performed to support the clinical development program. Any post-hoc, or unplanned, analyses not identified in this SAP performed will be clearly identified in the respective CSR.
<Protocol Number> Statistical Analysis Plan Page 9
4/17/2007 CONFIDENTIAL
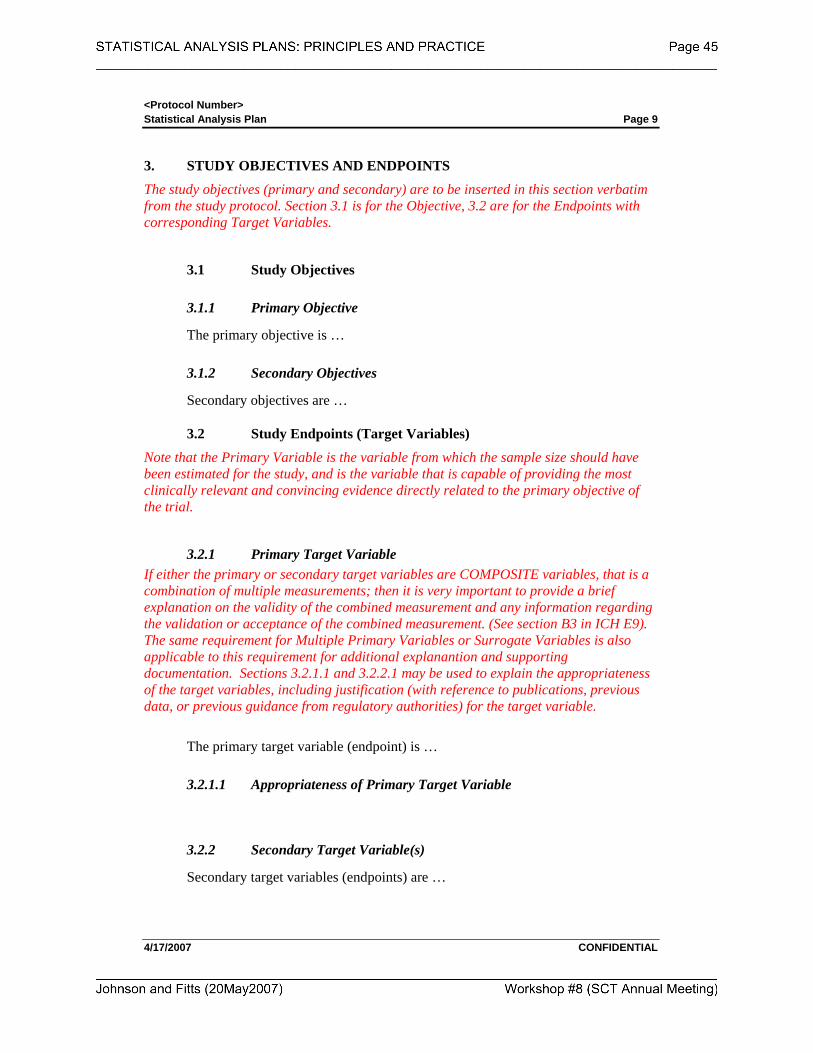
3. STUDY OBJECTIVES AND ENDPOINTS
The study objectives (primary and secondary) are to be inserted in this section verbatim from the study protocol. Section 3.1 is for the Objective, 3.2 are for the Endpoints with corresponding Target Variables.
3.1 Study Objectives
3.1.1 Primary Objective
The primary objective is …
3.1.2 Secondary Objectives
Secondary objectives are … 3.2 Study Endpoints (Target Variables)
Note that the Primary Variable is the variable from which the sample size should have been estimated for the study, and is the variable that is capable of providing the most clinically relevant and convincing evidence directly related to the primary objective of the trial.
3.2.1 Primary Target Variable If either the primary or secondary target variables are COMPOSITE variables, that is a combination of multiple measurements; then it is very important to provide a brief explanation on the validity of the combined measurement and any information regarding the validation or acceptance of the combined measurement. (See section B3 in ICH E9). The same requirement for Multiple Primary Variables or Surrogate Variables is also applicable to this requirement for additional explanantion and supporting documentation. Sections 3.2.1.1 and 3.2.2.1 may be used to explain the appropriateness of the target variables, including justification (with reference to publications, previous data, or previous guidance from regulatory authorities) for the target variable.
The primary target variable (endpoint) is …
3.2.1.1 Appropriateness of Primary Target Variable
3.2.2 Secondary Target Variable(s)
Secondary target variables (endpoints) are …
<Protocol Number> Statistical Analysis Plan Page 10
4/17/2007 CONFIDENTIAL
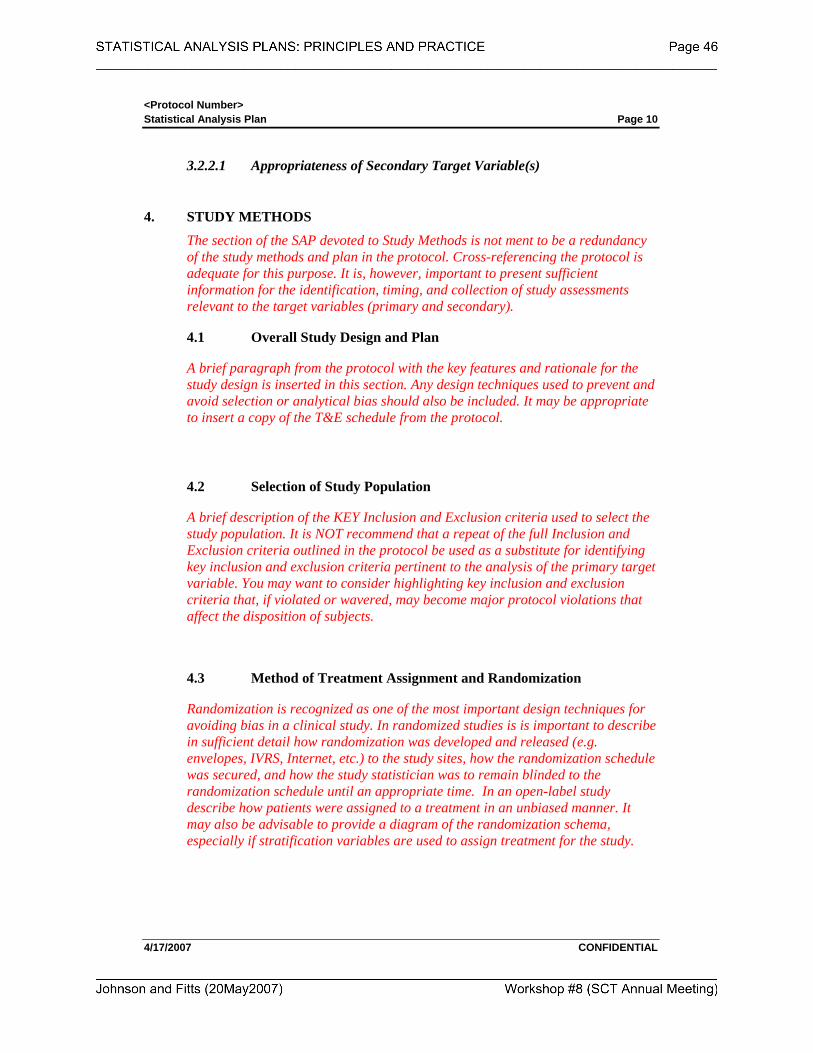
3.2.2.1 Appropriateness of Secondary Target Variable(s)
4. STUDY METHODS
The section of the SAP devoted to Study Methods is not ment to be a redundancy of the study methods and plan in the protocol. Cross-referencing the protocol is adequate for this purpose. It is, however, important to present sufficient information for the identification, timing, and collection of study assessments relevant to the target variables (primary and secondary).
4.1 Overall Study Design and Plan
A brief paragraph from the protocol with the key features and rationale for the study design is inserted in this section. Any design techniques used to prevent and avoid selection or analytical bias should also be included. It may be appropriate to insert a copy of the T&E schedule from the protocol.
4.2 Selection of Study Population
A brief description of the KEY Inclusion and Exclusion criteria used to select the study population. It is NOT recommend that a repeat of the full Inclusion and Exclusion criteria outlined in the protocol be used as a substitute for identifying key inclusion and exclusion criteria pertinent to the analysis of the primary target variable. You may want to consider highlighting key inclusion and exclusion criteria that, if violated or wavered, may become major protocol violations that affect the disposition of subjects.
4.3 Method of Treatment Assignment and Randomization
Randomization is recognized as one of the most important design techniques for avoiding bias in a clinical study. In randomized studies is is important to describe in sufficient detail how randomization was developed and released (e.g. envelopes, IVRS, Internet, etc.) to the study sites, how the randomization schedule was secured, and how the study statistician was to remain blinded to the randomization schedule until an appropriate time. In an open-label study describe how patients were assigned to a treatment in an unbiased manner. It may also be advisable to provide a diagram of the randomization schema, especially if stratification variables are used to assign treatment for the study.
<Protocol Number> Statistical Analysis Plan Page 11
4/17/2007 CONFIDENTIAL
4.4 Treatment Masking (Blinding)
Treatment Masking or Blinding is recognized as one of the most important design techniques for avoiding bias in a clinical study. Describe how treatments were to be masked or made blind, with sufficient information to demonstrate that controls (placebo or active controls) are not detectably different from the test agent.
<Protocol Number> Statistical Analysis Plan Page 12
4/17/2007 CONFIDENTIAL
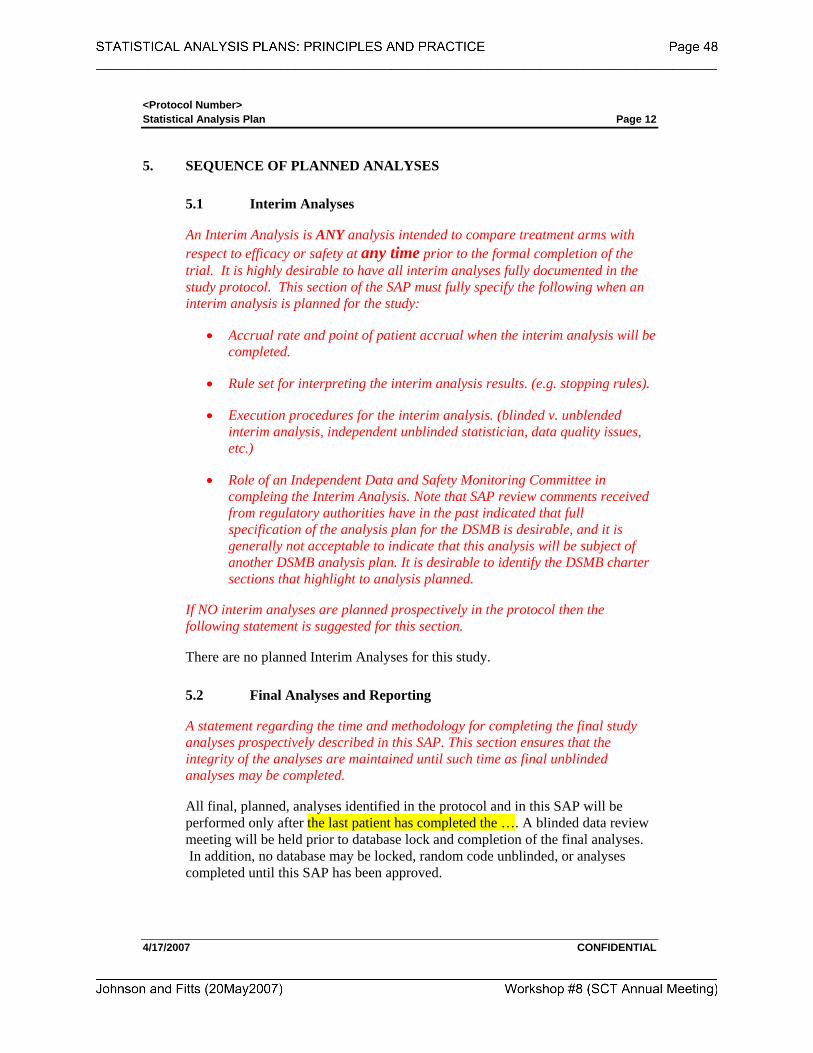
5. SEQUENCE OF PLANNED ANALYSES
5.1 Interim Analyses
An Interim Analysis is ANY analysis intended to compare treatment arms with respect to efficacy or safety at any time prior to the formal completion of the trial. It is highly desirable to have all interim analyses fully documented in the study protocol. This section of the SAP must fully specify the following when an interim analysis is planned for the study:
• Accrual rate and point of patient accrual when the interim analysis will be completed.
• Rule set for interpreting the interim analysis results. (e.g. stopping rules).
• Execution procedures for the interim analysis. (blinded v. unblended interim analysis, independent unblinded statistician, data quality issues, etc.)
• Role of an Independent Data and Safety Monitoring Committee in compleing the Interim Analysis. Note that SAP review comments received from regulatory authorities have in the past indicated that full specification of the analysis plan for the DSMB is desirable, and it is generally not acceptable to indicate that this analysis will be subject of another DSMB analysis plan. It is desirable to identify the DSMB charter sections that highlight to analysis planned.
If NO interim analyses are planned prospectively in the protocol then the following statement is suggested for this section.
There are no planned Interim Analyses for this study.
5.2 Final Analyses and Reporting
A statement regarding the time and methodology for completing the final study analyses prospectively described in this SAP. This section ensures that the integrity of the analyses are maintained until such time as final unblinded analyses may be completed.
All final, planned, analyses identified in the protocol and in this SAP will be performed only after the last patient has completed the …. A blinded data review meeting will be held prior to database lock and completion of the final analyses. In addition, no database may be locked, random code unblinded, or analyses completed until this SAP has been approved.
<Protocol Number> Statistical Analysis Plan Page 13
4/17/2007 CONFIDENTIAL
Key statistics and study results will be made available to <name of team or management> following database lock and prior to completion of the final CSR
Any, post-hoc, exploratory analyses completed to support planned study analyses, which were not identified in this SAP, will be documented and reported in appendices to the CSR. Any results from these unplanned analyses will also be clearly identified in the text of the CSR.
<Protocol Number> Statistical Analysis Plan Page 14
4/17/2007 CONFIDENTIAL
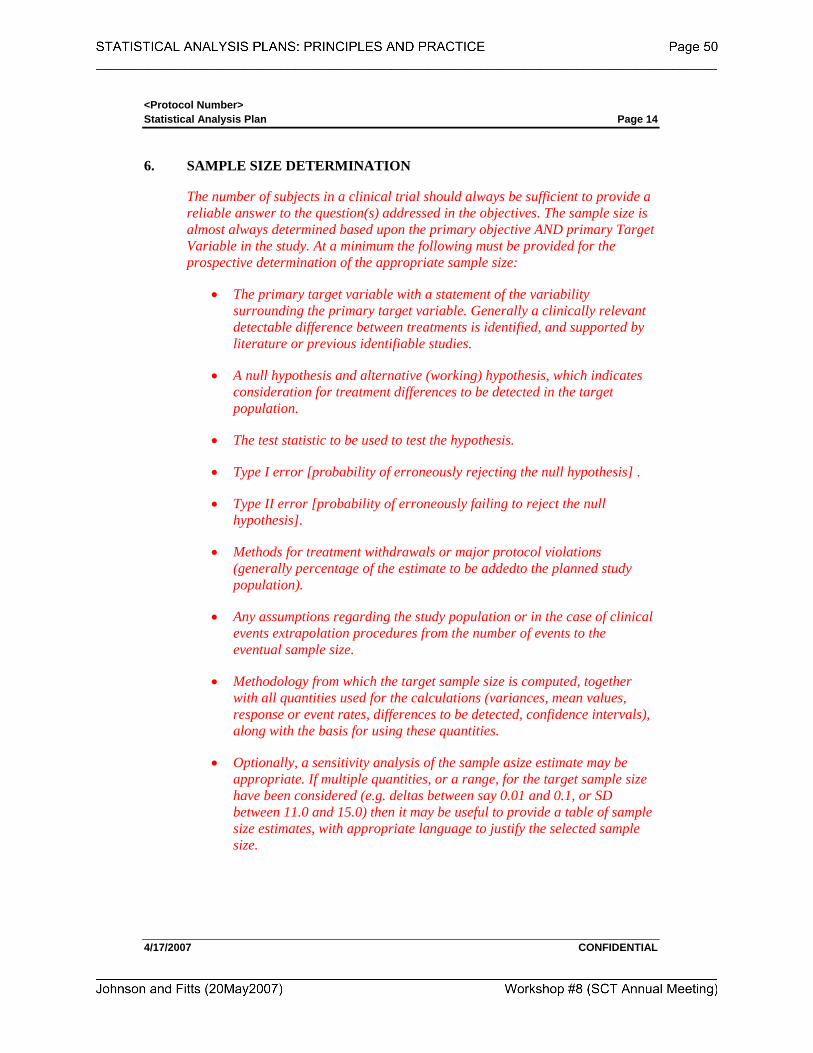
6. SAMPLE SIZE DETERMINATION
The number of subjects in a clinical trial should always be sufficient to provide a reliable answer to the question(s) addressed in the objectives. The sample size is almost always determined based upon the primary objective AND primary Target Variable in the study. At a minimum the following must be provided for the prospective determination of the appropriate sample size:
• The primary target variable with a statement of the variability surrounding the primary target variable. Generally a clinically relevant detectable difference between treatments is identified, and supported by literature or previous identifiable studies.
• A null hypothesis and alternative (working) hypothesis, which indicates consideration for treatment differences to be detected in the target population.
• The test statistic to be used to test the hypothesis.
• Type I error [probability of erroneously rejecting the null hypothesis] .
• Type II error [probability of erroneously failing to reject the null hypothesis].
• Methods for treatment withdrawals or major protocol violations (generally percentage of the estimate to be addedto the planned study population).
• Any assumptions regarding the study population or in the case of clinical events extrapolation procedures from the number of events to the eventual sample size.
• Methodology from which the target sample size is computed, together with all quantities used for the calculations (variances, mean values, response or event rates, differences to be detected, confidence intervals), along with the basis for using these quantities.
• Optionally, a sensitivity analysis of the sample asize estimate may be appropriate. If multiple quantities, or a range, for the target sample size have been considered (e.g. deltas between say 0.01 and 0.1, or SD between 11.0 and 15.0) then it may be useful to provide a table of sample size estimates, with appropriate language to justify the selected sample size.
<Protocol Number> Statistical Analysis Plan Page 15
4/17/2007 CONFIDENTIAL
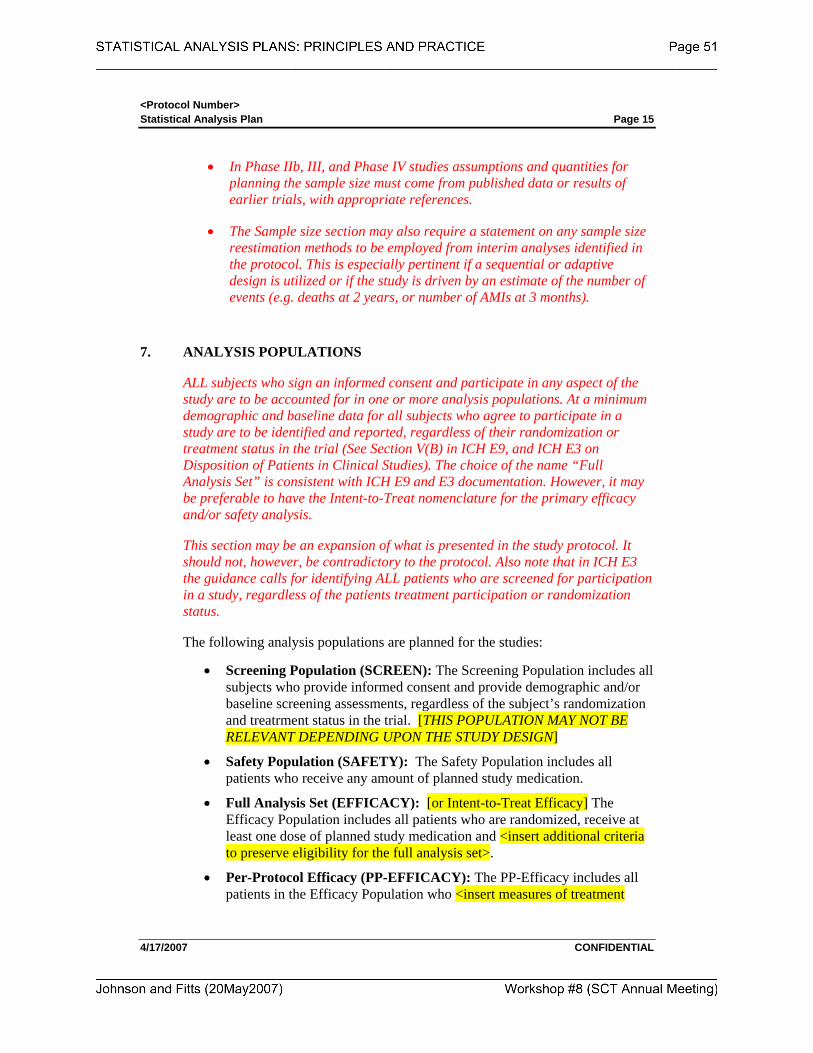
• In Phase IIb, III, and Phase IV studies assumptions and quantities for planning the sample size must come from published data or results of earlier trials, with appropriate references.
• The Sample size section may also require a statement on any sample size reestimation methods to be employed from interim analyses identified in the protocol. This is especially pertinent if a sequential or adaptive design is utilized or if the study is driven by an estimate of the number of events (e.g. deaths at 2 years, or number of AMIs at 3 months).
7. ANALYSIS POPULATIONS
ALL subjects who sign an informed consent and participate in any aspect of the study are to be accounted for in one or more analysis populations. At a minimum demographic and baseline data for all subjects who agree to participate in a study are to be identified and reported, regardless of their randomization or treatment status in the trial (See Section V(B) in ICH E9, and ICH E3 on Disposition of Patients in Clinical Studies). The choice of the name “Full Analysis Set” is consistent with ICH E9 and E3 documentation. However, it may be preferable to have the Intent-to-Treat nomenclature for the primary efficacy and/or safety analysis.
This section may be an expansion of what is presented in the study protocol. It should not, however, be contradictory to the protocol. Also note that in ICH E3 the guidance calls for identifying ALL patients who are screened for participation in a study, regardless of the patients treatment participation or randomization status.
The following analysis populations are planned for the studies:
• Screening Population (SCREEN): The Screening Population includes all subjects who provide informed consent and provide demographic and/or baseline screening assessments, regardless of the subject’s randomization and treatrment status in the trial. [THIS POPULATION MAY NOT BE RELEVANT DEPENDING UPON THE STUDY DESIGN]
• Safety Population (SAFETY): The Safety Population includes all patients who receive any amount of planned study medication.
• Full Analysis Set (EFFICACY): [or Intent-to-Treat Efficacy] The Efficacy Population includes all patients who are randomized, receive at least one dose of planned study medication and <insert additional criteria to preserve eligibility for the full analysis set>.
• Per-Protocol Efficacy (PP-EFFICACY): The PP-Efficacy includes all patients in the Efficacy Population who <insert measures of treatment
<Protocol Number> Statistical Analysis Plan Page 16
4/17/2007 CONFIDENTIAL
compliance, availability of measurements, absence of major protocol violations, or entry criteria that are appropriate>.
<Protocol Number> Statistical Analysis Plan Page 17
4/17/2007 CONFIDENTIAL
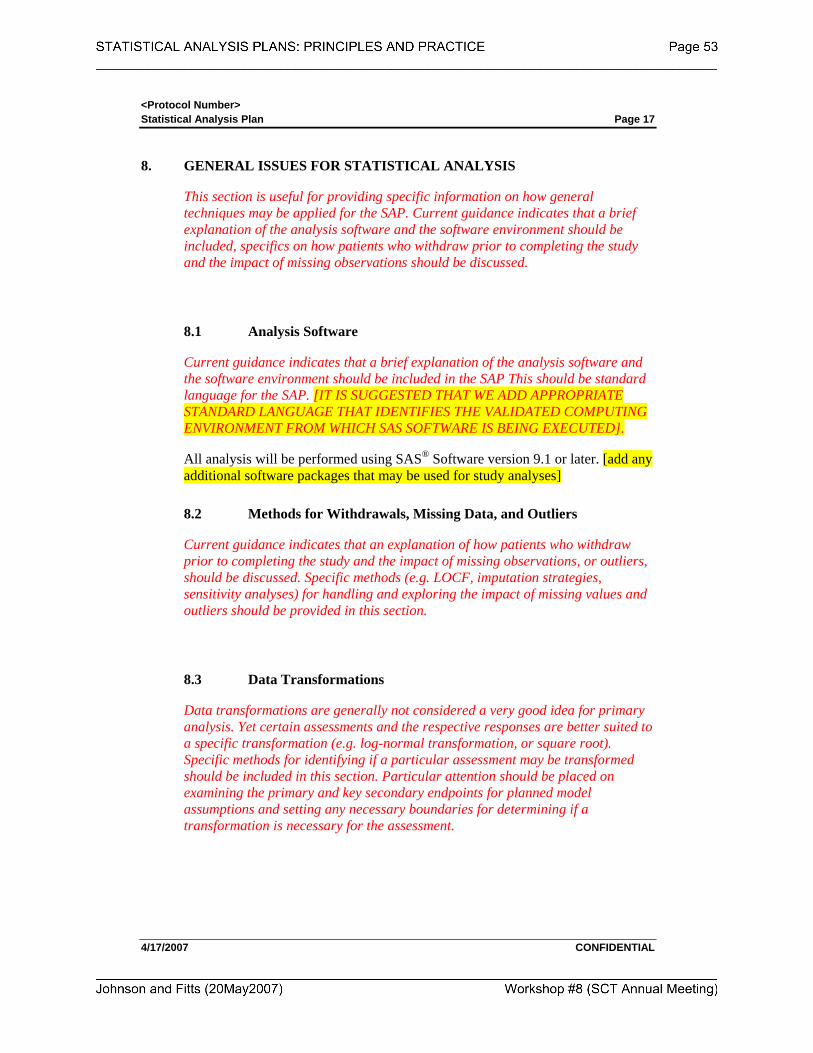
8. GENERAL ISSUES FOR STATISTICAL ANALYSIS
This section is useful for providing specific information on how general techniques may be applied for the SAP. Current guidance indicates that a brief explanation of the analysis software and the software environment should be included, specifics on how patients who withdraw prior to completing the study and the impact of missing observations should be discussed.
8.1 Analysis Software
Current guidance indicates that a brief explanation of the analysis software and the software environment should be included in the SAP This should be standard language for the SAP. [IT IS SUGGESTED THAT WE ADD APPROPRIATE STANDARD LANGUAGE THAT IDENTIFIES THE VALIDATED COMPUTING ENVIRONMENT FROM WHICH SAS SOFTWARE IS BEING EXECUTED].
All analysis will be performed using SAS® Software version 9.1 or later. [add any additional software packages that may be used for study analyses]
8.2 Methods for Withdrawals, Missing Data, and Outliers
Current guidance indicates that an explanation of how patients who withdraw prior to completing the study and the impact of missing observations, or outliers, should be discussed. Specific methods (e.g. LOCF, imputation strategies, sensitivity analyses) for handling and exploring the impact of missing values and outliers should be provided in this section.
8.3 Data Transformations
Data transformations are generally not considered a very good idea for primary analysis. Yet certain assessments and the respective responses are better suited to a specific transformation (e.g. log-normal transformation, or square root). Specific methods for identifying if a particular assessment may be transformed should be included in this section. Particular attention should be placed on examining the primary and key secondary endpoints for planned model assumptions and setting any necessary boundaries for determining if a transformation is necessary for the assessment.
<Protocol Number> Statistical Analysis Plan Page 18
4/17/2007 CONFIDENTIAL
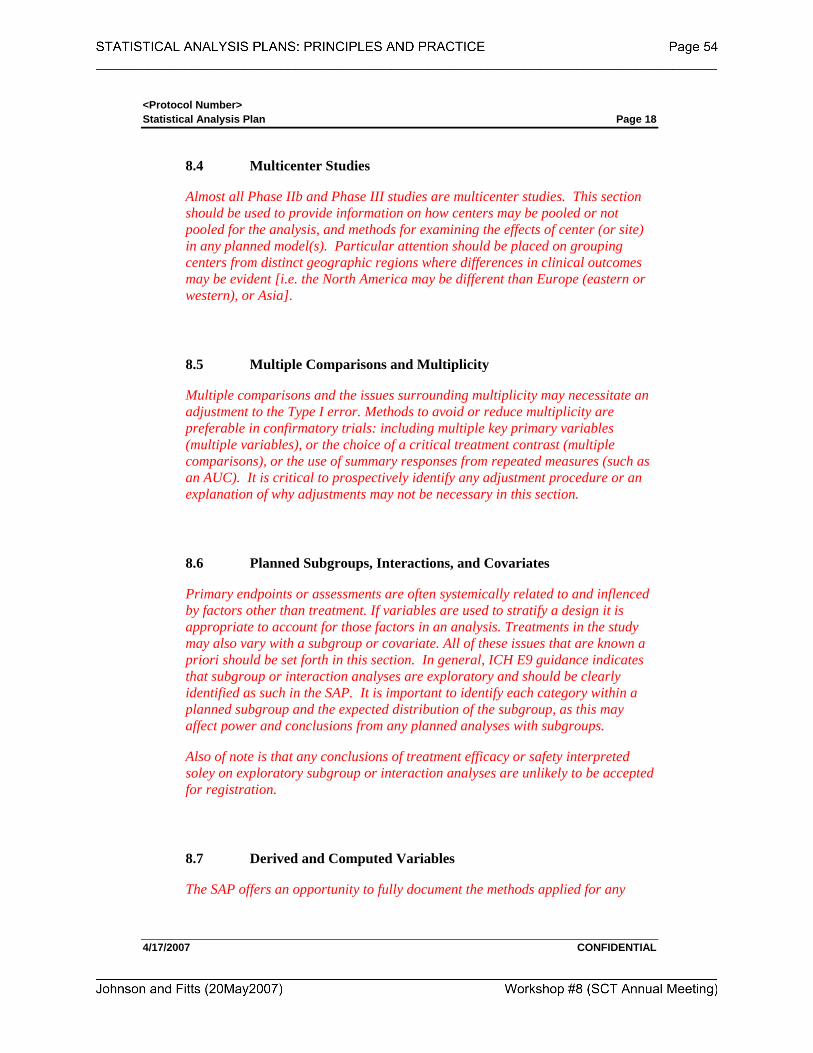
8.4 Multicenter Studies
Almost all Phase IIb and Phase III studies are multicenter studies. This section should be used to provide information on how centers may be pooled or not pooled for the analysis, and methods for examining the effects of center (or site) in any planned model(s). Particular attention should be placed on grouping centers from distinct geographic regions where differences in clinical outcomes may be evident [i.e. the North America may be different than Europe (eastern or western), or Asia].
8.5 Multiple Comparisons and Multiplicity
Multiple comparisons and the issues surrounding multiplicity may necessitate an adjustment to the Type I error. Methods to avoid or reduce multiplicity are preferable in confirmatory trials: including multiple key primary variables (multiple variables), or the choice of a critical treatment contrast (multiple comparisons), or the use of summary responses from repeated measures (such as an AUC). It is critical to prospectively identify any adjustment procedure or an explanation of why adjustments may not be necessary in this section.
8.6 Planned Subgroups, Interactions, and Covariates
Primary endpoints or assessments are often systemically related to and inflenced by factors other than treatment. If variables are used to stratify a design it is appropriate to account for those factors in an analysis. Treatments in the study may also vary with a subgroup or covariate. All of these issues that are known a priori should be set forth in this section. In general, ICH E9 guidance indicates that subgroup or interaction analyses are exploratory and should be clearly identified as such in the SAP. It is important to identify each category within a planned subgroup and the expected distribution of the subgroup, as this may affect power and conclusions from any planned analyses with subgroups.
Also of note is that any conclusions of treatment efficacy or safety interpreted soley on exploratory subgroup or interaction analyses are unlikely to be accepted for registration.
8.7 Derived and Computed Variables
The SAP offers an opportunity to fully document the methods applied for any
<Protocol Number> Statistical Analysis Plan Page 19
4/17/2007 CONFIDENTIAL
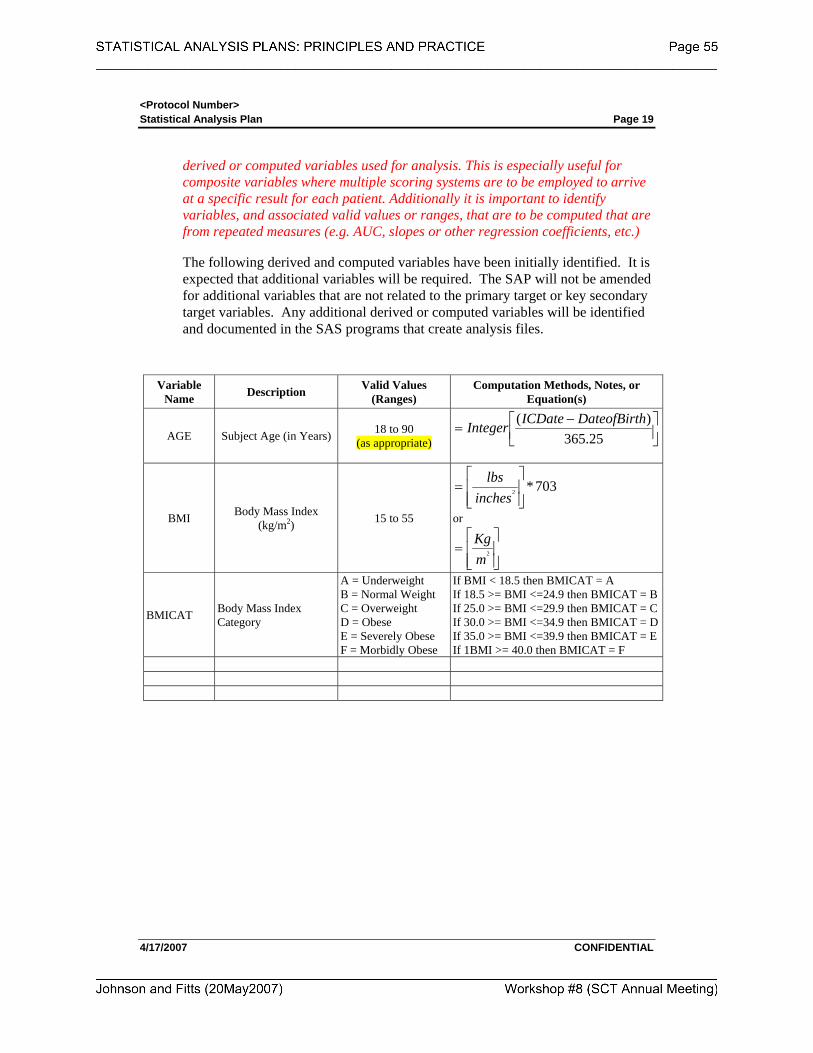
derived or computed variables used for analysis. This is especially useful for composite variables where multiple scoring systems are to be employed to arrive at a specific result for each patient. Additionally it is important to identify variables, and associated valid values or ranges, that are to be computed that are from repeated measures (e.g. AUC, slopes or other regression coefficients, etc.)
The following derived and computed variables have been initially identified. It is expected that additional variables will be required. The SAP will not be amended for additional variables that are not related to the primary target or key secondary target variables. Any additional derived or computed variables will be identified and documented in the SAS programs that create analysis files.
Variable Name Description Valid Values
(Ranges) Computation Methods, Notes, or
Equation(s)
AGE Subject Age (in Years) 18 to 90 (as appropriate)
⎥⎦⎤
⎢⎣⎡ −
=25.365
)( hDateofBirtICDateInteger
BMI Body Mass Index (kg/m2) 15 to 55
703*2
⎥⎥⎦
⎤
⎢⎢⎣
⎡=
incheslbs
or
⎥⎥⎦
⎤
⎢⎢⎣
⎡=
mKg
2
BMICAT Body Mass Index Category
A = Underweight B = Normal Weight C = Overweight D = Obese E = Severely Obese F = Morbidly Obese
If BMI < 18.5 then BMICAT = A If 18.5 >= BMI <=24.9 then BMICAT = BIf 25.0 >= BMI <=29.9 then BMICAT = CIf 30.0 >= BMI <=34.9 then BMICAT = DIf 35.0 >= BMI <=39.9 then BMICAT = EIf 1BMI >= 40.0 then BMICAT = F
<Protocol Number> Statistical Analysis Plan Page 20
4/17/2007 CONFIDENTIAL
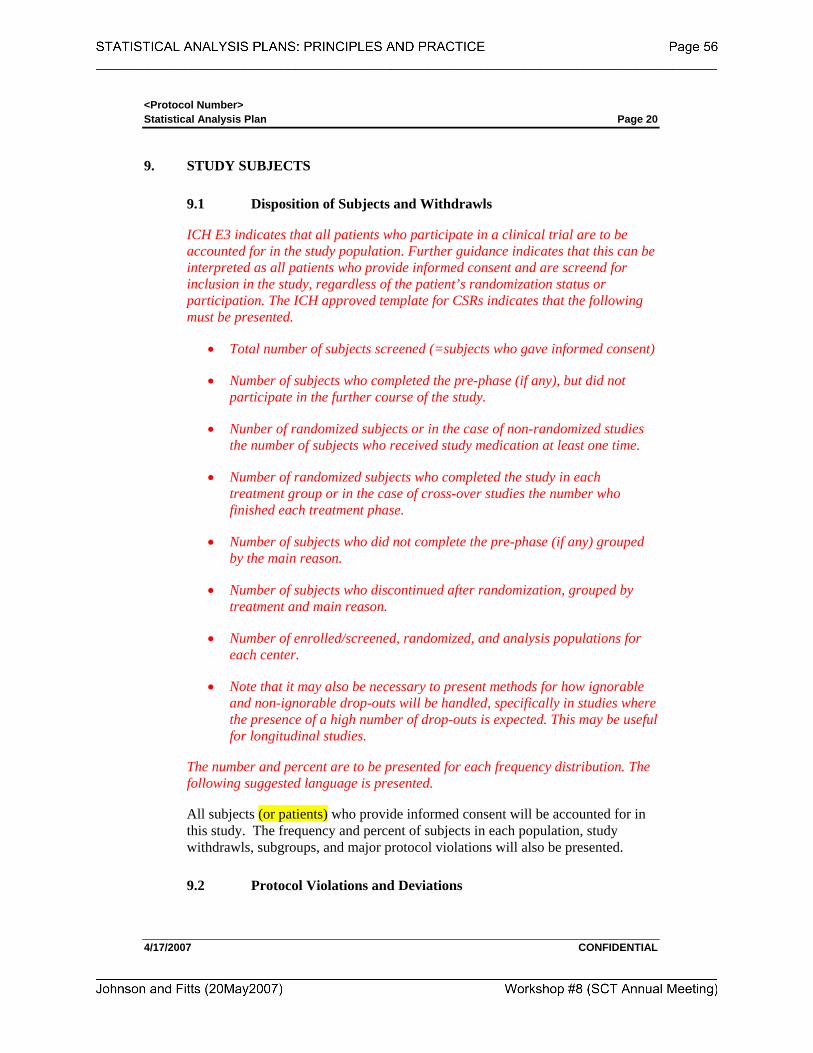
9. STUDY SUBJECTS
9.1 Disposition of Subjects and Withdrawls
ICH E3 indicates that all patients who participate in a clinical trial are to be accounted for in the study population. Further guidance indicates that this can be interpreted as all patients who provide informed consent and are screend for inclusion in the study, regardless of the patient’s randomization status or participation. The ICH approved template for CSRs indicates that the following must be presented.
• Total number of subjects screened (=subjects who gave informed consent)
• Number of subjects who completed the pre-phase (if any), but did not participate in the further course of the study.
• Nunber of randomized subjects or in the case of non-randomized studies the number of subjects who received study medication at least one time.
• Number of randomized subjects who completed the study in each treatment group or in the case of cross-over studies the number who finished each treatment phase.
• Number of subjects who did not complete the pre-phase (if any) grouped by the main reason.
• Number of subjects who discontinued after randomization, grouped by treatment and main reason.
• Number of enrolled/screened, randomized, and analysis populations for each center.
• Note that it may also be necessary to present methods for how ignorable and non-ignorable drop-outs will be handled, specifically in studies where the presence of a high number of drop-outs is expected. This may be useful for longitudinal studies.
The number and percent are to be presented for each frequency distribution. The following suggested language is presented.
All subjects (or patients) who provide informed consent will be accounted for in this study. The frequency and percent of subjects in each population, study withdrawls, subgroups, and major protocol violations will also be presented.
9.2 Protocol Violations and Deviations
<Protocol Number> Statistical Analysis Plan Page 21
4/17/2007 CONFIDENTIAL
Protocol deviations may be significant contributors to analysis bias. Provide a clear description of what the rule set is for determining a major protocol violation (a violation that may be likely to affect the efficacy of treatment), and how these violations are to be determined and classified. A clear description of the rule set for eliminating a major protocol violator from the Per-Protocol Population (if any) from the Full Analysis Set (ITT Population) must be specified. The CSR template requires that the following be listed for major protocol violations
• Number of Subjects (overall and by Center) with each major violation
• [Optional if relevant to the study] Number of subjects (overall and by Center) with any minor protocol violation/deviation.
The number and percent are to be presented for each frequency distribution. It may be appropriate to insert language regarding a blinded data review meeting to assess protocol violations and deviations.
9.3 Inclusion and Exclusion Criteria
The number and percent are to be presented for subjects meeting each Inclusion and Exclusion Criteria. Generally, it is expected that the overall percentage will be 100% for inclusion and exclusion criteria, except when waivers are granted or when data review indicates that inclusion or exclusion criteria have been violated. It may be necessary to include language on how waiver [# (%)] are to be presented. This is supportive for the study population to be analyzed. The may be completed overall and optionally by study center (if relevant).
10. DEMOGRAPHICS AND OTHER BASELINE CHARACTERISTICS
The analysis of demographic and baseline characteristics of the study population is critical to describing the homogeneity or heterogeneity of the study population between treatment groups. In general, summaries of the key demographics by analysed population are to be provided. If sub-groups exist then a summary of the demographics for the subgroup may be relevant to fully characterizing the study population.
The use of p-values and inferential analysis of the demographics and other baseline conditions by treatment in a study population may not be relevant to the overall presentation of study results. Completion of inferential analysis is discouraged unless a compeling reason for the analysis is required to support potential differences that are expected due to randomization.
<Protocol Number> Statistical Analysis Plan Page 22
4/17/2007 CONFIDENTIAL
10.1 Demographics
At a minimum this should include age, gender, ethnic origin / race. Optionally, depending upon the study other demographics such as height, weight, body mass Index (number and or classification), body surface area, and others may need to be included.
Continous variables should include at a minimum the mean, standard deviation, median, and range. Optionally summary statistics may include inter-quartile ranges, coefficient of variation, or measures of skewness or kurtosis.
Categorical variables should include at a minimum the frequency and percentage.
10.2 Prior and Concurrent Medications
The frequency and percent of prior and concurrent medications should be tabulated overall and by treatment group. Medications are to be coded using the WHODRUG dictionary. Summaries by drug class and individual coded medications are to be completed. It is often time useful to identify relevant medications or medication classes that may have (or are known to have) a drug-drug interaction with the study treatment(s). This section should be used to identify this potential and relevant summaries described.
10.3 Baseline and Screening Conditions
The analysis of baseline characteristics of the study population is critical to describing relevant illness (history) and concomitant illness (current findings from a PE) at the initiation of a subjects participation. Relevant co-morbidities should be highlighted and particular attention in describing the findings for these conditions should be the emphasis of this section.
10.3.1 Baseline Medical History
The number and percent of subjects presenting with a baseline medical history, either by body systems or relevant disease specific history (e.g. renal disease, diabetes, heart failure, asthma, etc.). Consider providing relevant disease specific
<Protocol Number> Statistical Analysis Plan Page 23
4/17/2007 CONFIDENTIAL
medical history summaries if associated with specific exclusion or inclusion criteria. At a minimum patient listings of the medical history with any indication of the stability of these pre-existing conditions may be useful.
10.3.2 Baseline Physical Exam
The number and percent of subjects presenting with a baseline concomitant illness (current findings from a physical exam), either by body systems or relevant disease specific history (e.g. renal disease, diabetes, heart failure, asthma, etc.). Consider providing relevant disease specific concomitant illness summaries if associated with specific exclusion or inclusion criteria. Note that a baseline physical exam is not limited to the traditional PE and may include such aspects as summaries of specific modalities used to assess current concomitant illness (e.g. X-ray, MRI, Cardiac SPECT Imaging, Endoscopy, etc.)
10.3.3 <Disease Specific> Baseline and Screening History
This section of the SAP is optional and may be used to provide additional disease specific baseline and screening history. The addition of disease specific baseline and screening history is associated with identifying very specific observations or clinical laboratory findings that at screening are indicative and support of underlying disease is a specific patient population. The number and percent of subjects presenting a specific disease specific history or finding, and optionally a continuous summary of actual results, may be appropriate. Examples might include a summary of HbA1c at baseline for patients with diabetes, or presence or absence of elevated cholesterol in cardiac studies, baseline assessments for specific antibodies for a target disease, etc.
10.4 Measurement of Treatment Compliance
Compliance with treatment regimes in a clinical trial is often times one of the significant factors affecting efficact results (especially if a large placebo effect is evident). A clear description of issues, and rule set, surrounding treatment compliance should be included in this section, especially if used for assessment of a major protocol deviation, or if treatment compliance is used as a model covariate or main affect term.
In general this section is not particularly relevant for single dose treatments (either oral or injectable), or in studies where patient treatment is controlled by the investigator in a hospital or controlled setting, and compliance is not an
<Protocol Number> Statistical Analysis Plan Page 24
4/17/2007 CONFIDENTIAL
issue.
At a minimum for studies where the subject is self-administering doses of study medication a summary of the total amount of medication taken per specified unit (e.g. total daily dose, number of tablets per day or week, total weight (+ units) of study medicaion applied per body surface area unit) should be provided overall by treatment and by treatment and study center. If time is an important factor in measuring treatment compliance then summaries of treatment compliance over specific time intervals may also be relevant.
Another area that may be included in this section is summary methods for the measurement of drug concentrations in body fluids for treatment compliance. This may also be important if steady state drug concentrations are required to receive optimal benefit from a study treatment.
11. EFFICACY ANALYSES
This section of the SAP is to specify the hypotheses to be tested and/or treatment effects that are to be estimated to satisfy the primary objectives of the study. A clear and concise presentation of the statistical methods to be used to accomplish these tasks must be described for the primary and key secondary efficacy variables. The underlying statistical model to be used must be clearly stated, along with any baseline data that are to be used for each subject to adjust estimates for potential baseline differences (e.g. analysis of covariance)
11.1 <Primary Efficacy Variable Analysis>
The analysis of the primary efficacy variable should include a description of the hypothesis to be tested with the alternative hypothesis, statistical model, any model adjustments or covariates, or transformations, and should reflect the current state of medical and statistical knowledge about the primary variable and the study design. This section should also be used to describe how the model assumptions and statistical distribution for the primary and secondary efficacy variables will be evaluated for parametric or nonparametric methods, if appropriate to the discussion.
In general it is almost always better to use simple rather than complex statistical models to support the analysis to provide simplicity in the explanation of treatment effect differences observed. Also, the more complex the statistical model, the less likely the results from the analysis are generalizable across a population of patients with the target disease. Simple is better!
It is critical that this section clarify one or two sided testing. Note that regulatory
<Protocol Number> Statistical Analysis Plan Page 25
4/17/2007 CONFIDENTIAL
authorities generally frown upon one-sided tests. If a one-sided test is to be employed then a prospective justification must be clear and support a clinical rationale for this decision.
Any estimates of treatment effects must be accompanied with confidence intervals, aligned with the Type I error rate (e.g. α=0.05 then CI = 95%, α=0.10 then CI = 90%).
A description of how the primary and secondary anaylsis variables will be summarized and reported, and how statistical significance will be interpreted should also be included.
The analysis of the <insert name of efficacy variable> will include the following test of hypothesis:
H0:
The alternative hypothesis is: H1:
Acceptance of ___ , for the <insert population>, will be considered to be a successful demonstration of efficacy.
The model used to complete the primary analysis is an …..[insert model and any relevant information regarding construction of the model]
11.2 <Secondary Efficacy Variable Analysis>
The same principles outlined for section 11.1 also apply for section 11.2 (secondary efficacy variables).
11.3 <Other Efficacy Variable Analysis>
The same principles outlined for section 11.1 also apply for section 11.3 (other efficacy variables). If this section is not relevant to the study then it may be deleted from the SAP.
<Protocol Number> Statistical Analysis Plan Page 26
4/17/2007 CONFIDENTIAL
12. SAFETY AND TOLERABILITY ANALYSES
Safety and Tolerability is generally completed for the set of subjects who complete one or more doses of trial medication (this may also include screening medications).
The analysis of safety assessments in this study will include summaries of the following categories of safety and tolerability data collected for each subject [ADD OR DELETE FROM LIST AS APPROPRIATE PER THE PROTOCOL]:
• Drug Exposure(s)
• Adverse Events
− AEs and SAEs − AEs leading to withdrawal − Any Deaths
• Pregnancies (if any reported)
• Clinical Laboratory Investigations
• Hemodynamics (vital signs)
• ECG Investigations
• <Disease Specific> Assessments
12.1 Drug Exposure
Methods should be presented on how the extent of exposure to study medications is to be characterized. Generally this includes the distribution of patients at each dose, or cumulative doses and the duration of exposure at each dose. Items to consider for this summary include:
• Summaries of the total daily dose (if multiple dosing regimens are being studied).
• Summaries by treatment cycle (in oncology studies) of total dose exposed.
• Total cumulative dose exposed, as it relates to dose limiting toxicities may be useful.
• Depending upon the study drug it may be useful to summarize drug exposure by age groups, gender, or racial subgroups, or any other pertinent subgroups (e.g. exposure to antihypertensive agents would correlate with a summary of drug exposure by racial groups of black and non-black subgroups).
<Protocol Number> Statistical Analysis Plan Page 27
4/17/2007 CONFIDENTIAL
• A discussion on how drug exposure may be related to changes in safety assessments, such as liver function or renal function tests may also be necessary.
12.2 Adverse Events
A clear description of how Adverse Events are to be coded and summarized is required by ICH E3 and ICH E9. The incidence of adverse events is usually expressed in the form of a proportion relating the sumber of subjects experiencing events to the number of subjects at risk. The number of subjects at risk is usually the number of subjects in each treatment group, and overall treatment groups.
However, other methods such as risk ratios for an adverse event, or survival analysis methods, or cumulative adverse event rates should be considered when long-term safety assessment is planned and a large proportion of the subjects will withdraw or die during the course of the study.
Suggested language for standard adverse event summaries is presented in section 12.1.1(All Adverse Events), 12.1.2 (Adverse Events Leading to Withdrawls), 12.1.3 (Serious Adverse Events), and 12.1.4 (Deaths) for consideration. This language should be modified to match the study protocol and the degree of adverse event assessment planned for the program.
Adverse events will be coded using the Medical Dictionary for Regulatory Activities (MedDRA) central coding dictionary, version x.x or greater.
<Details on how AEs are assigned to a treatment or study period should be included, especially in the presence of a cross-over study>
12.2.1 All Adverse Events
The following is standard language for summaries of Adverse Events. This language may be modified to fit the particular needs of the study. Additional language will be required if inferential testing or model development is completed for adverse events. Another aspect that may need to be considered is the presence of rare events of interest (if relevant), in which case additional methods for analysis of his may be required. It may also be necessay to include language on any toxcicity grading scales that will be used, along with a justification of the scale(s).
Summaries of incidence rates (frequencies and percentages), intensity, and relationship to study drug of individual AEs by System Organ Class and Preferred Term (MedDRA) will be prepared. Each patient will be counted only once within each preferred term per study period. If a patient experiences more than one AE
<Protocol Number> Statistical Analysis Plan Page 28
4/17/2007 CONFIDENTIAL
within a preferred term for the same recording period, only the AE with the strongest relationship or the greatest intensity, as appropriate, will be included in the summaries of relationship and intensity.
Summaries will be presented by treatment group for … Fisher’s exact test will be used to compare rates for System Organ Classes across treatment groups. A similar summary by treatment group will be presented for all patients in the Safety Population.
Counts of AEs by maximum intensity will be presented for patients in the Safety Population by treatment group, grouped by the treatment the patient had received most recently prior to the AE. Only AEs beginning at or after the beginning of study drug administration will be included. Similarly, counts of AEs by strongest relationship to study drug will be presented.
A data listing will also be presented showing all AEs which started prior to the administration of any study drug.
12.2.2 Adverse Events Leading to Withdrawal
ICH E3 and ICH E9 require that a clear summary and description of those patients in the study who withdrawn from participation due to an adverse event must be disclosed and summaries presented. Generally are counts and percents, and rarely would inferential analysis be required for this summary.
A summary of incidence rates (frequencies and percentages) of AEs leading to withdrawal, by treatment group, System Organ Class, and Preferred Term, will be prepared for the Safety Population. No statistical tests will be performed.
A data listing of AEs leading to withdrawal will also be provided, displaying details of the event(s) captured on the CRF.
12.2.3 Serious Adverse Events
ICH E3 and ICH E9 also require a summay of SAEs, along with the summary narratives produced by drug survalience. This section of the SAP should be an agreement with clinical research and drug safety and survalience departments.
Serious adverse event reconciliation will be performed by Data Management, Clinical Research, and <insert name of organization> Drug Safety and Pharmacovigilance via data listings.
A summary of incidence rates (frequencies and percentages) of SAEs by treatment group, System Organ Class, and Preferred Term will be prepared for the Safety Population. No statistical tests will be performed.
<Protocol Number> Statistical Analysis Plan Page 29
4/17/2007 CONFIDENTIAL
A data listing of SAEs will also be provided, displaying details of the event(s) captured on the CRF. Serious adverse event narratives will be provided for the CSR by the <insert name of organization> Drug Safety and Pharmacovilagence Department.
12.2.4 Deaths
ICH E3 and ICH E9 also require a summay of deaths, along with the summary death narratives produced by drug survalience. However, if death is an efficacy endpoint (e.g. survival analysis) and the protocol indicates that death is expected and not considered an SAE (unless some indication that death is drug related) then this language will need to be modified to match the protocol.
If any patients die during the study, relevant information will be supplied in a data listing, and appropriate SAE narratives.
12.2.5 Other AE Assessments This section should be used to define the methods for any study specific adverse event assessments of interest. Otherwise, indicate no other assessments or analysis are planned.
No additional Adveres Event Assessments were completed, and no additional analysis is planned.
12.3 Pregnancies
If a pregnancy registry is used than language indicating how pregnancies will be censored forany planned analysis and followed for the registry should be included.
Pregnancy data will be shown in a data listing. No special analysis will be performed on the pregnancy data. Patients are to be discontinued from the study if they become pregnant.
12.4 Clinical Laboratory Evaluations
Clinical laboratory investigations for safety may take on many different and unique features, depending upon the drug under study. At a minimum, if clinical laboratories are collected pre and pst treatment then listings and shift tables should be completed, as well ass any mean changes, by treatment.
If clinical laboratory studies are being completed over time, with sequential samples over time then analysis over time or visit may be necessary. ICH E3 guidance recommends the consideration of graphs and other visual displays to examine and present this type of data. Special consideration may be necessary of ranges other than the normal range (e.g. twice the upper normal limit, 5 times the upper limit, or other range selection).
<Protocol Number> Statistical Analysis Plan Page 30
4/17/2007 CONFIDENTIAL
Descriptive summaries (mean, SD, median, minimum, and maximum) of changes from baseline will be presented for clinical laboratory values by treatment for the Safety Population.
The number of patients with clinical laboratory values below, within, or above normal ranges, <or other specific ranges of interest> pre-procedure versus post-procedure will be tabulated for each test, for the Safety Population by treatment group. Pre- and post-procedure values will also be presented with an analysis of mean changes from baseline.
Laboratory values that are outside the normal range will also be flagged in the data listings, along with corresponding normal ranges. Any out-of-range values that are identified by the investigator as being clinically significant will also be shown in a data listing.
12.5 Hemodynamics (Vital Signs)
Hemodynamic data should be analysed and presented in ways similar to clinical laboratory investigations. Changes from baseline, sequential assessments, mean changes, etc. should all be considered. For particular importance is the relationship of hemodynamic changes related to dose or concentration data. A discussion on how this relationship will be examined and presented may be useful especially for drugs with a short duration of action or drugs where cumulative doses may be shown to affect changes in hemodynamics.
Descriptive summaries (mean, SD, median, minimum, and maximum) of actual values and changes from baseline will be calculated for SBP, DBP, and HR. These summaries will be presented by treatment for the Safety Population.
12.6 ECGs
Electrocardiogram (ECG) analysis should follow methods similar to that of hemodynamics and clinical laboratory investigations with respect to summaries and changes over time or from baseline. In addition, it may be necessary to provide summaries regarding QT prolongation and evidence for (or against) a drug related effect for QT prolongation. If QT data re collected in the Phase IIb or Phase III study then these summaries are required, along with the appropriate correction factors. Standard language for this computation is provided for consideration.
The number and percentage of patients with normal and abnormal ECG results will be summarized for the Safety Population by treatment group. Abnormal results will be grouped as …
[IF QT DATA ANALYSIS IS REQUIRED THEN CONSIDER THE FOLLOWING]A comparison of QT results will be presented. Summary statistics for baseline values at Screening, <other assessment times>, and Follow-up will be
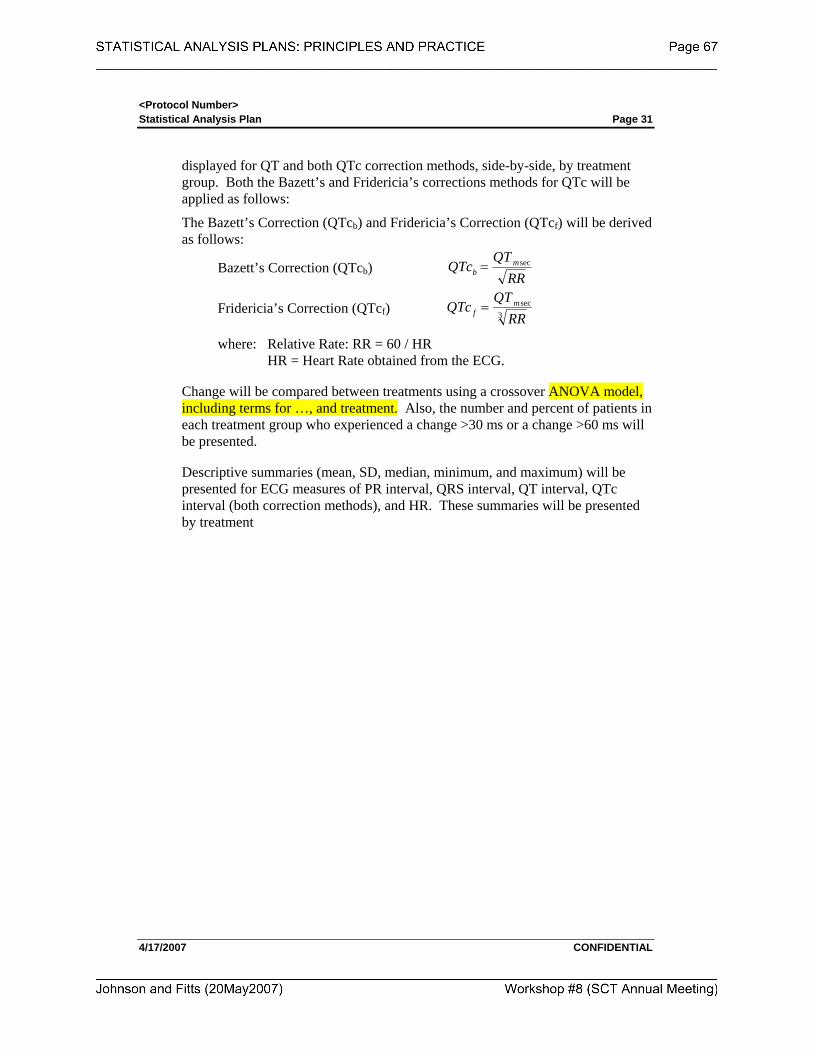
<Protocol Number> Statistical Analysis Plan Page 31
4/17/2007 CONFIDENTIAL
displayed for QT and both QTc correction methods, side-by-side, by treatment group. Both the Bazett’s and Fridericia’s corrections methods for QTc will be applied as follows:
The Bazett’s Correction (QTcb) and Fridericia’s Correction (QTcf) will be derived as follows:
Bazett’s Correction (QTcb) RRQT
QTc mb
sec=
Fridericia’s Correction (QTcf) 3sec
RRQT
QTc mf =
where: Relative Rate: RR = 60 / HR HR = Heart Rate obtained from the ECG.
Change will be compared between treatments using a crossover ANOVA model, including terms for …, and treatment. Also, the number and percent of patients in each treatment group who experienced a change >30 ms or a change >60 ms will be presented.
Descriptive summaries (mean, SD, median, minimum, and maximum) will be presented for ECG measures of PR interval, QRS interval, QT interval, QTc interval (both correction methods), and HR. These summaries will be presented by treatment
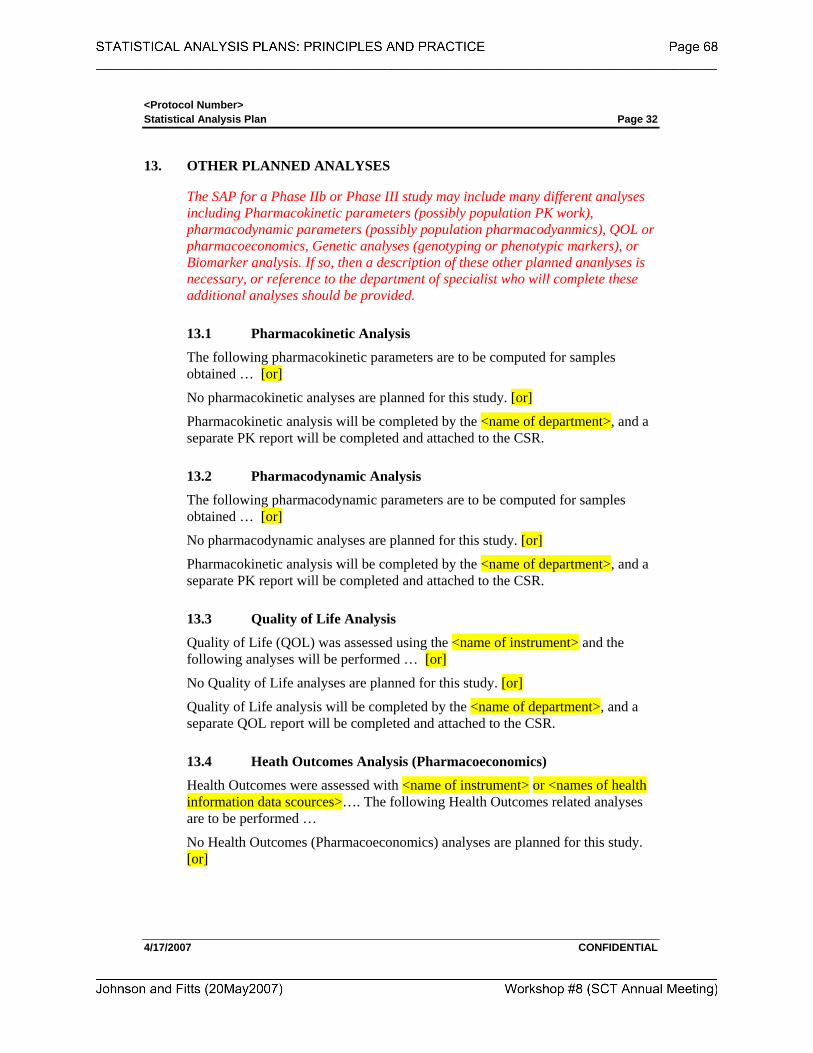
<Protocol Number> Statistical Analysis Plan Page 32
4/17/2007 CONFIDENTIAL
13. OTHER PLANNED ANALYSES
The SAP for a Phase IIb or Phase III study may include many different analyses including Pharmacokinetic parameters (possibly population PK work), pharmacodynamic parameters (possibly population pharmacodyanmics), QOL or pharmacoeconomics, Genetic analyses (genotyping or phenotypic markers), or Biomarker analysis. If so, then a description of these other planned ananlyses is necessary, or reference to the department of specialist who will complete these additional analyses should be provided.
13.1 Pharmacokinetic Analysis
The following pharmacokinetic parameters are to be computed for samples obtained … [or]
No pharmacokinetic analyses are planned for this study. [or]
Pharmacokinetic analysis will be completed by the <name of department>, and a separate PK report will be completed and attached to the CSR.
13.2 Pharmacodynamic Analysis
The following pharmacodynamic parameters are to be computed for samples obtained … [or]
No pharmacodynamic analyses are planned for this study. [or]
Pharmacokinetic analysis will be completed by the <name of department>, and a separate PK report will be completed and attached to the CSR.
13.3 Quality of Life Analysis
Quality of Life (QOL) was assessed using the <name of instrument> and the following analyses will be performed … [or]
No Quality of Life analyses are planned for this study. [or]
Quality of Life analysis will be completed by the <name of department>, and a separate QOL report will be completed and attached to the CSR.
13.4 Heath Outcomes Analysis (Pharmacoeconomics)
Health Outcomes were assessed with <name of instrument> or <names of health information data scources>…. The following Health Outcomes related analyses are to be performed …
No Health Outcomes (Pharmacoeconomics) analyses are planned for this study. [or]
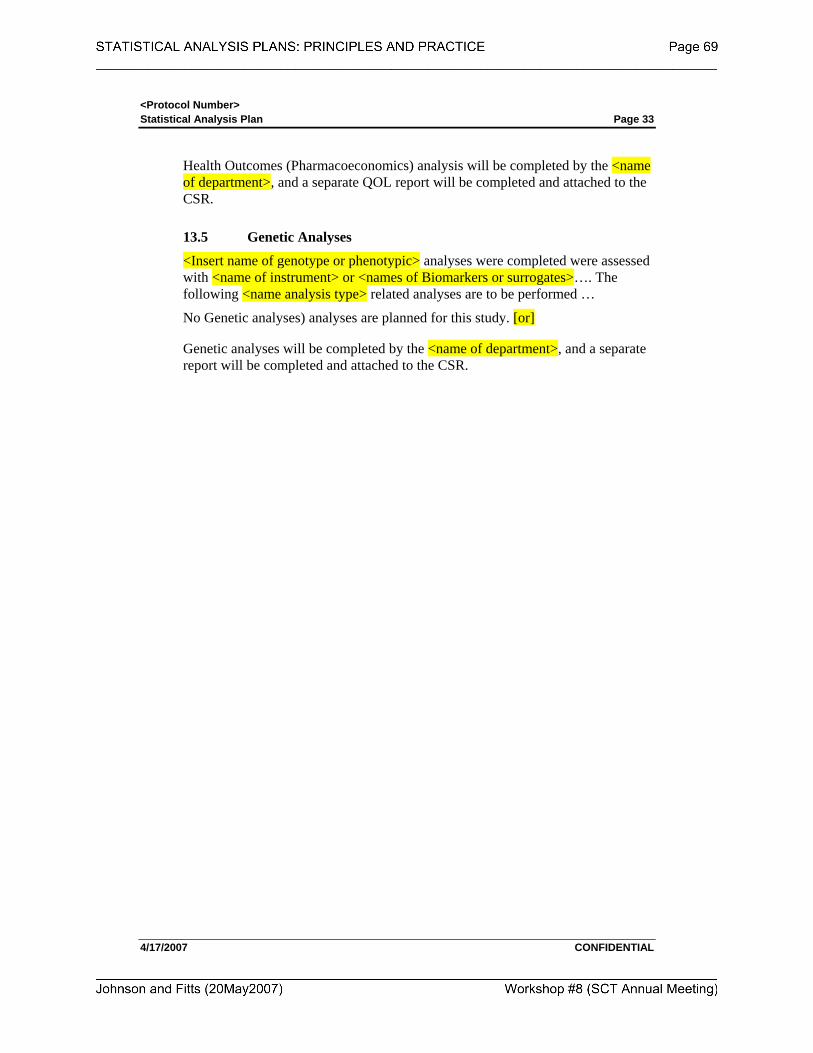
<Protocol Number> Statistical Analysis Plan Page 33
4/17/2007 CONFIDENTIAL
Health Outcomes (Pharmacoeconomics) analysis will be completed by the <name of department>, and a separate QOL report will be completed and attached to the CSR.
13.5 Genetic Analyses
<Insert name of genotype or phenotypic> analyses were completed were assessed with <name of instrument> or <names of Biomarkers or surrogates>…. The following <name analysis type> related analyses are to be performed …
No Genetic analyses) analyses are planned for this study. [or]
Genetic analyses will be completed by the <name of department>, and a separate report will be completed and attached to the CSR.
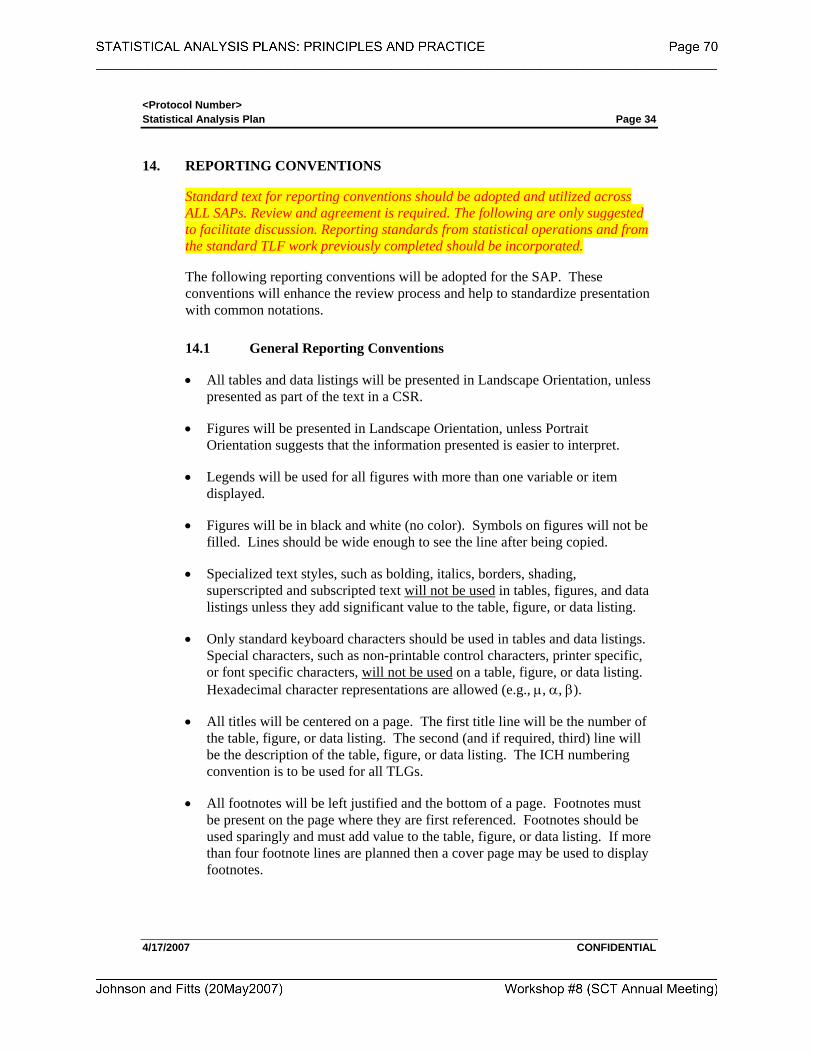
<Protocol Number> Statistical Analysis Plan Page 34
4/17/2007 CONFIDENTIAL
14. REPORTING CONVENTIONS
Standard text for reporting conventions should be adopted and utilized across ALL SAPs. Review and agreement is required. The following are only suggested to facilitate discussion. Reporting standards from statistical operations and from the standard TLF work previously completed should be incorporated.
The following reporting conventions will be adopted for the SAP. These conventions will enhance the review process and help to standardize presentation with common notations.
14.1 General Reporting Conventions
• All tables and data listings will be presented in Landscape Orientation, unless presented as part of the text in a CSR.
• Figures will be presented in Landscape Orientation, unless Portrait Orientation suggests that the information presented is easier to interpret.
• Legends will be used for all figures with more than one variable or item displayed.
• Figures will be in black and white (no color). Symbols on figures will not be filled. Lines should be wide enough to see the line after being copied.
• Specialized text styles, such as bolding, italics, borders, shading, superscripted and subscripted text will not be used in tables, figures, and data listings unless they add significant value to the table, figure, or data listing.
• Only standard keyboard characters should be used in tables and data listings. Special characters, such as non-printable control characters, printer specific, or font specific characters, will not be used on a table, figure, or data listing. Hexadecimal character representations are allowed (e.g., μ, α, β).
• All titles will be centered on a page. The first title line will be the number of the table, figure, or data listing. The second (and if required, third) line will be the description of the table, figure, or data listing. The ICH numbering convention is to be used for all TLGs.
• All footnotes will be left justified and the bottom of a page. Footnotes must be present on the page where they are first referenced. Footnotes should be used sparingly and must add value to the table, figure, or data listing. If more than four footnote lines are planned then a cover page may be used to display footnotes.
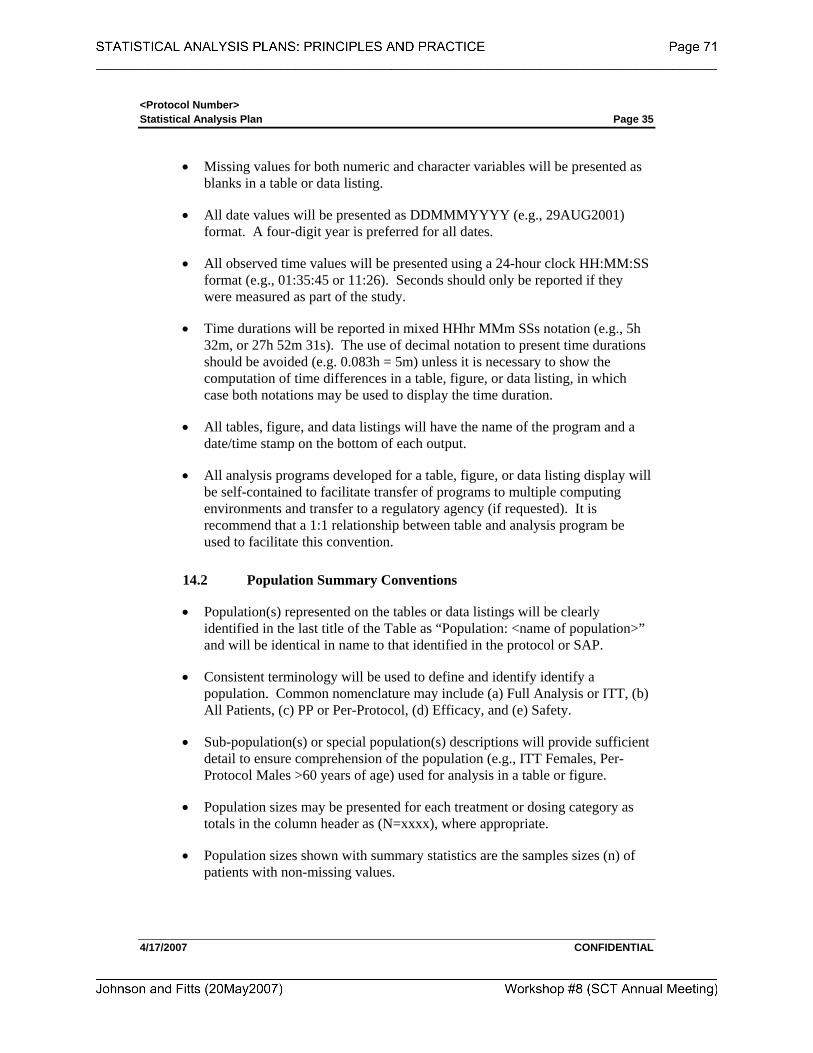
<Protocol Number> Statistical Analysis Plan Page 35
4/17/2007 CONFIDENTIAL
• Missing values for both numeric and character variables will be presented as blanks in a table or data listing.
• All date values will be presented as DDMMMYYYY (e.g., 29AUG2001) format. A four-digit year is preferred for all dates.
• All observed time values will be presented using a 24-hour clock HH:MM:SS format (e.g., 01:35:45 or 11:26). Seconds should only be reported if they were measured as part of the study.
• Time durations will be reported in mixed HHhr MMm SSs notation (e.g., 5h 32m, or 27h 52m 31s). The use of decimal notation to present time durations should be avoided (e.g. 0.083h = 5m) unless it is necessary to show the computation of time differences in a table, figure, or data listing, in which case both notations may be used to display the time duration.
• All tables, figure, and data listings will have the name of the program and a date/time stamp on the bottom of each output.
• All analysis programs developed for a table, figure, or data listing display will be self-contained to facilitate transfer of programs to multiple computing environments and transfer to a regulatory agency (if requested). It is recommend that a 1:1 relationship between table and analysis program be used to facilitate this convention.
14.2 Population Summary Conventions
• Population(s) represented on the tables or data listings will be clearly identified in the last title of the Table as “Population: <name of population>” and will be identical in name to that identified in the protocol or SAP.
• Consistent terminology will be used to define and identify identify a population. Common nomenclature may include (a) Full Analysis or ITT, (b) All Patients, (c) PP or Per-Protocol, (d) Efficacy, and (e) Safety.
• Sub-population(s) or special population(s) descriptions will provide sufficient detail to ensure comprehension of the population (e.g., ITT Females, Per-Protocol Males >60 years of age) used for analysis in a table or figure.
• Population sizes may be presented for each treatment or dosing category as totals in the column header as (N=xxxx), where appropriate.
• Population sizes shown with summary statistics are the samples sizes (n) of patients with non-missing values.
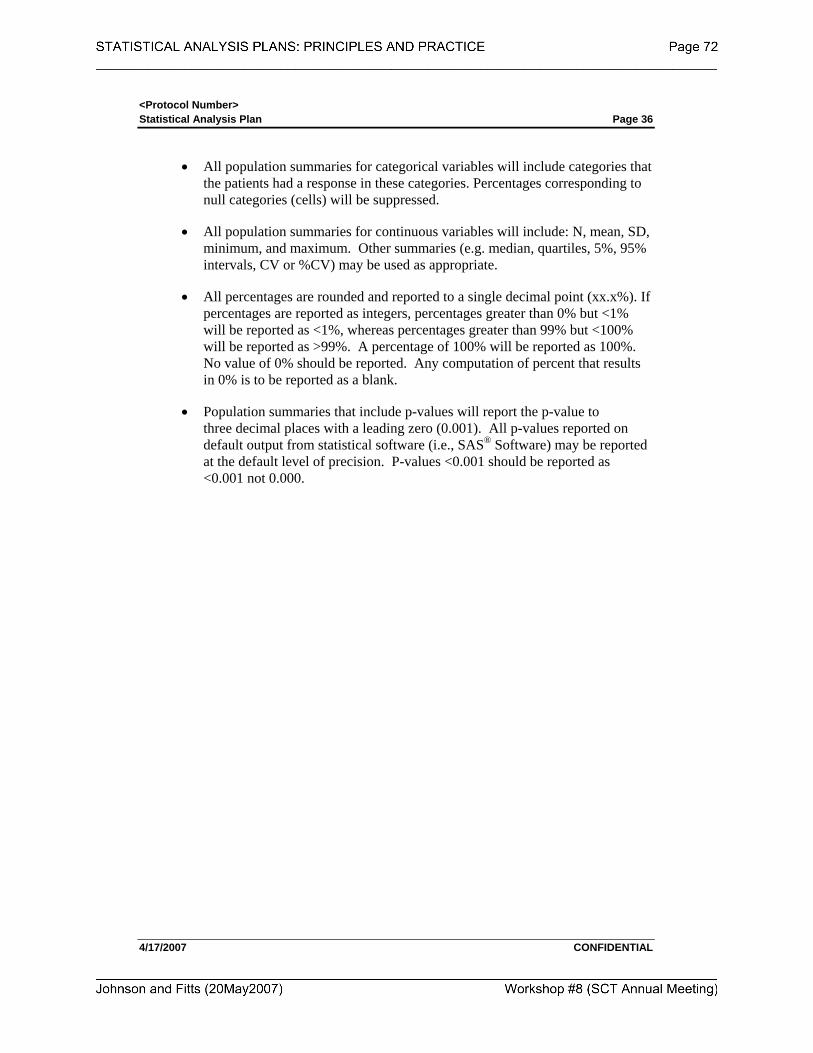
<Protocol Number> Statistical Analysis Plan Page 36
4/17/2007 CONFIDENTIAL
• All population summaries for categorical variables will include categories that the patients had a response in these categories. Percentages corresponding to null categories (cells) will be suppressed.
• All population summaries for continuous variables will include: N, mean, SD, minimum, and maximum. Other summaries (e.g. median, quartiles, 5%, 95% intervals, CV or %CV) may be used as appropriate.
• All percentages are rounded and reported to a single decimal point (xx.x%). If percentages are reported as integers, percentages greater than 0% but <1% will be reported as <1%, whereas percentages greater than 99% but <100% will be reported as >99%. A percentage of 100% will be reported as 100%. No value of 0% should be reported. Any computation of percent that results in 0% is to be reported as a blank.
• Population summaries that include p-values will report the p-value to three decimal places with a leading zero (0.001). All p-values reported on default output from statistical software (i.e., SAS® Software) may be reported at the default level of precision. P-values <0.001 should be reported as <0.001 not 0.000.
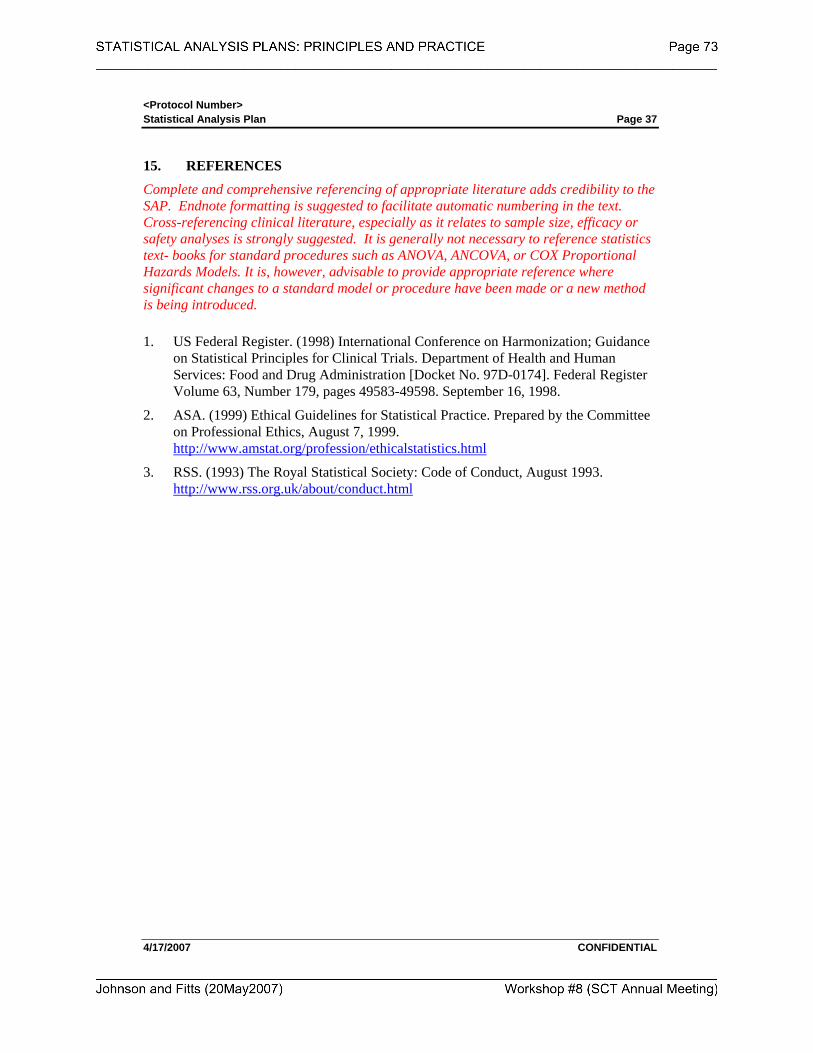
<Protocol Number> Statistical Analysis Plan Page 37
4/17/2007 CONFIDENTIAL
15. REFERENCES
Complete and comprehensive referencing of appropriate literature adds credibility to the SAP. Endnote formatting is suggested to facilitate automatic numbering in the text. Cross-referencing clinical literature, especially as it relates to sample size, efficacy or safety analyses is strongly suggested. It is generally not necessary to reference statistics text- books for standard procedures such as ANOVA, ANCOVA, or COX Proportional Hazards Models. It is, however, advisable to provide appropriate reference where significant changes to a standard model or procedure have been made or a new method is being introduced. 1. US Federal Register. (1998) International Conference on Harmonization; Guidance
on Statistical Principles for Clinical Trials. Department of Health and Human Services: Food and Drug Administration [Docket No. 97D-0174]. Federal Register Volume 63, Number 179, pages 49583-49598. September 16, 1998.
2. ASA. (1999) Ethical Guidelines for Statistical Practice. Prepared by the Committee on Professional Ethics, August 7, 1999. http://www.amstat.org/profession/ethicalstatistics.html
3. RSS. (1993) The Royal Statistical Society: Code of Conduct, August 1993. http://www.rss.org.uk/about/conduct.html
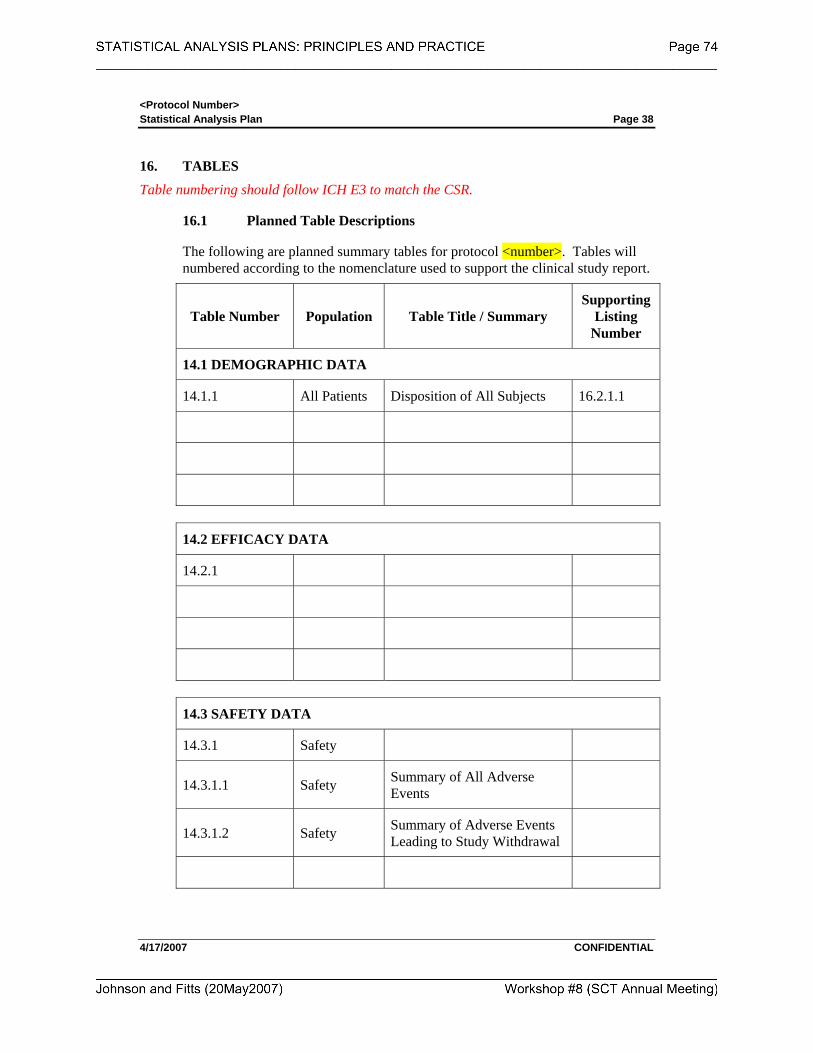
<Protocol Number> Statistical Analysis Plan Page 38
4/17/2007 CONFIDENTIAL
16. TABLES
Table numbering should follow ICH E3 to match the CSR.
16.1 Planned Table Descriptions
The following are planned summary tables for protocol <number>. Tables will numbered according to the nomenclature used to support the clinical study report.
Table Number Population Table Title / Summary Supporting
Listing Number
14.1 DEMOGRAPHIC DATA
14.1.1 All Patients Disposition of All Subjects 16.2.1.1
14.2 EFFICACY DATA
14.2.1
14.3 SAFETY DATA
14.3.1 Safety
14.3.1.1 Safety Summary of All Adverse Events
14.3.1.2 Safety Summary of Adverse Events Leading to Study Withdrawal
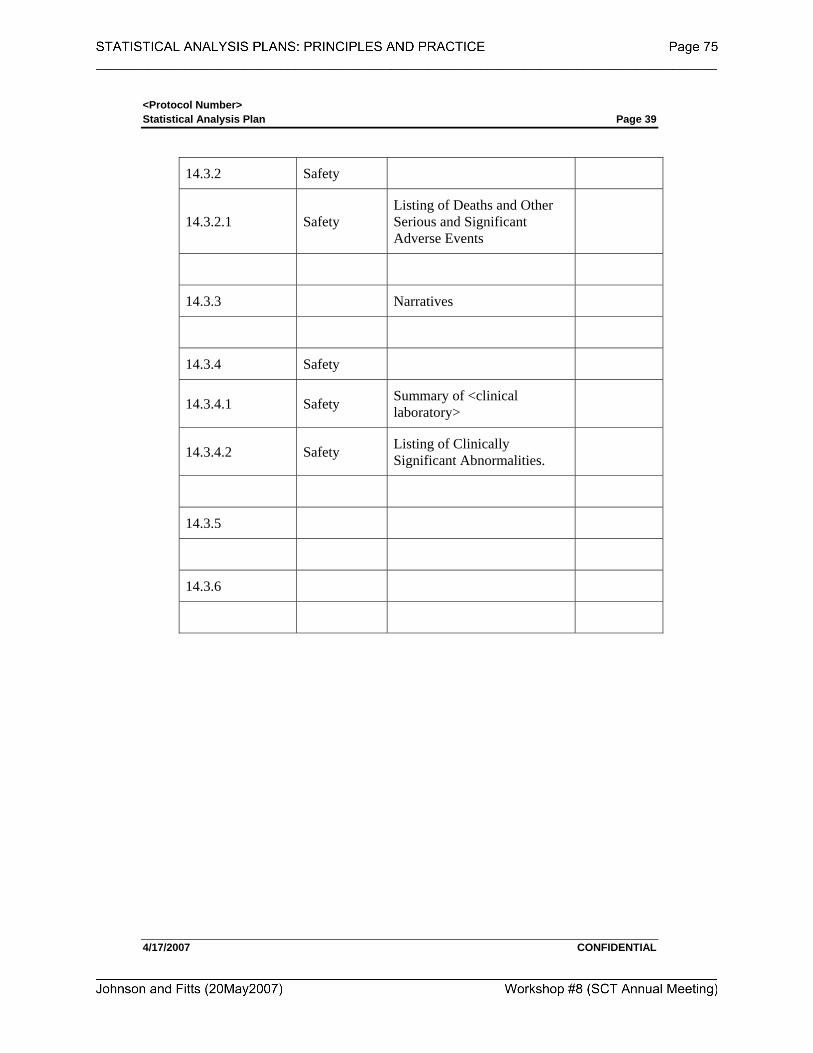
<Protocol Number> Statistical Analysis Plan Page 39
4/17/2007 CONFIDENTIAL
14.3.2 Safety
14.3.2.1 Safety Listing of Deaths and Other Serious and Significant Adverse Events
14.3.3 Narratives
14.3.4 Safety
14.3.4.1 Safety Summary of <clinical laboratory>
14.3.4.2 Safety Listing of Clinically Significant Abnormalities.
14.3.5
14.3.6
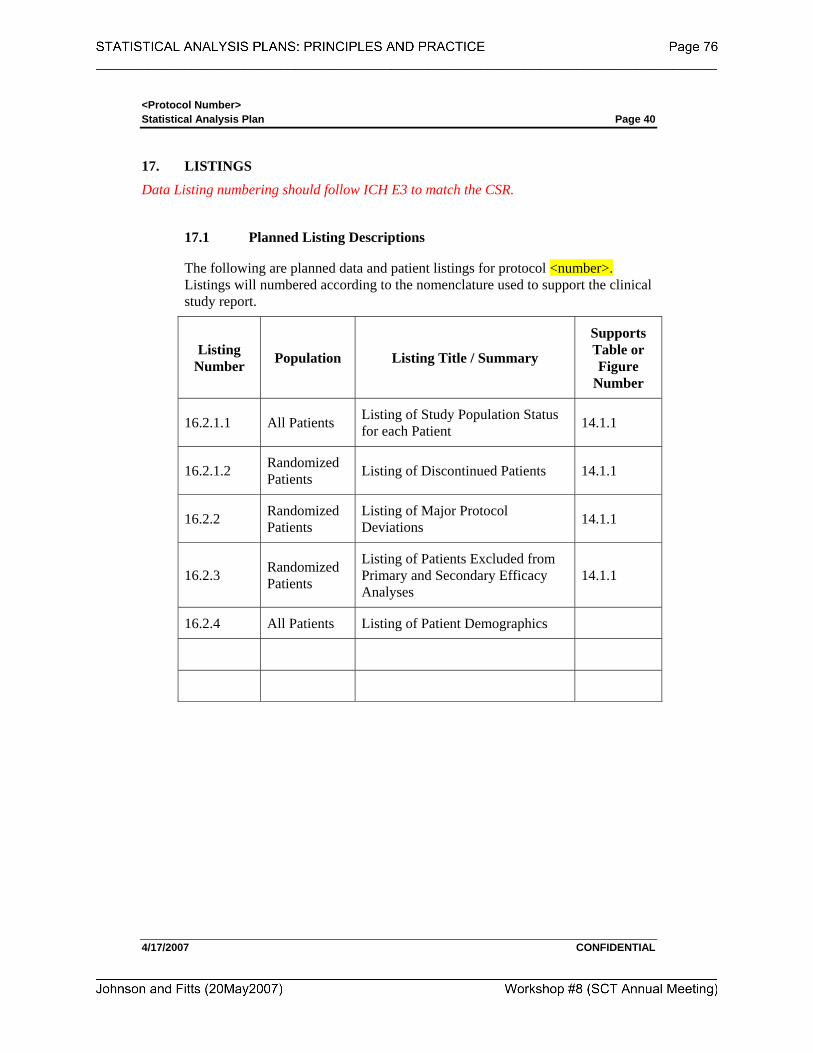
<Protocol Number> Statistical Analysis Plan Page 40
4/17/2007 CONFIDENTIAL
17. LISTINGS
Data Listing numbering should follow ICH E3 to match the CSR.
17.1 Planned Listing Descriptions
The following are planned data and patient listings for protocol <number>. Listings will numbered according to the nomenclature used to support the clinical study report.
Listing Number Population Listing Title / Summary
Supports Table or Figure
Number
16.2.1.1 All Patients Listing of Study Population Status for each Patient 14.1.1
16.2.1.2 Randomized Patients Listing of Discontinued Patients 14.1.1
16.2.2 Randomized Patients
Listing of Major Protocol Deviations 14.1.1
16.2.3 Randomized Patients
Listing of Patients Excluded from Primary and Secondary Efficacy Analyses
14.1.1
16.2.4 All Patients Listing of Patient Demographics
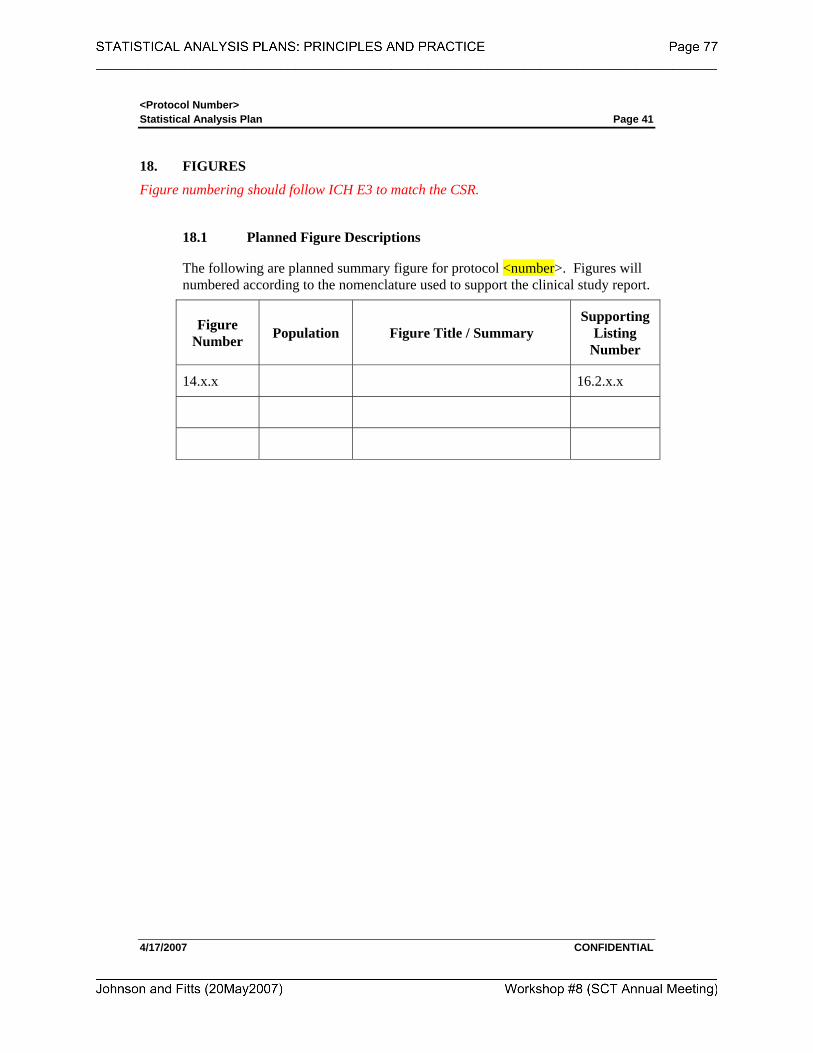
<Protocol Number> Statistical Analysis Plan Page 41
4/17/2007 CONFIDENTIAL
18. FIGURES
Figure numbering should follow ICH E3 to match the CSR.
18.1 Planned Figure Descriptions
The following are planned summary figure for protocol <number>. Figures will numbered according to the nomenclature used to support the clinical study report.
Figure Number Population Figure Title / Summary
Supporting Listing
Number
14.x.x 16.2.x.x
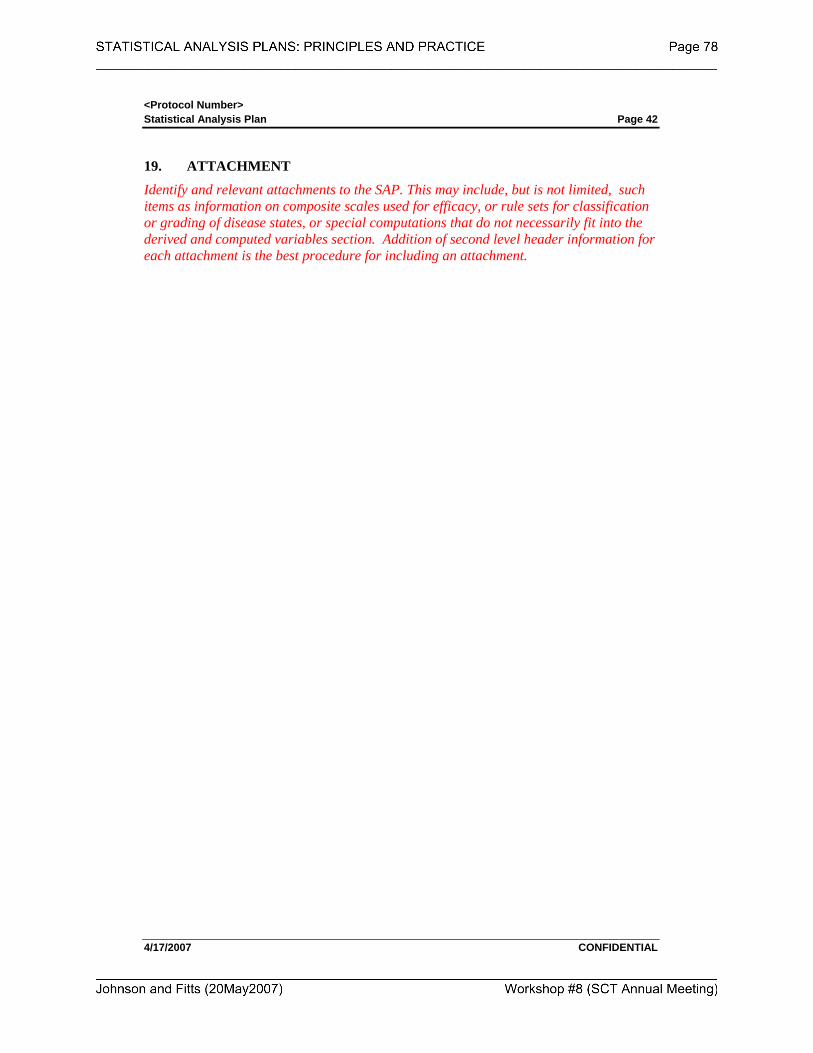
<Protocol Number> Statistical Analysis Plan Page 42
4/17/2007 CONFIDENTIAL
19. ATTACHMENT
Identify and relevant attachments to the SAP. This may include, but is not limited, such items as information on composite scales used for efficacy, or rule sets for classification or grading of disease states, or special computations that do not necessarily fit into the derived and computed variables section. Addition of second level header information for each attachment is the best procedure for including an attachment.
STATISTICAL ANALYSIS PLANS PRINCIPLES AND PRACTICE
Society for Clinical Trials Workshop May 20, 2007
Attachment Template for Developing Tables, Listings, Figures
that Support an SAP
<INSERT LOGO>
TABLES, LISTINGS, AND FIGURES
DEVELOPMENT DOCUMENTATION
Insert the full protocol title, final protocol date, SAP Author and date. Insert the Statistical Programmer responsible for the TLF Development for the project. This TLF Programming Development Documentation Template is useful for prospectively defining the structure and form of planned TLFs for a particular study. By separating the TLF production from the SAP development the SAP can be finalized earlier in the process and the TLF development may evolve over the course of the development process. Protocol Title (Number):
<full title of Protocol> (protocol number)
Protocol Date: SAP Author: SAP Date: Statistical Programmer:
CONFIDENTIAL
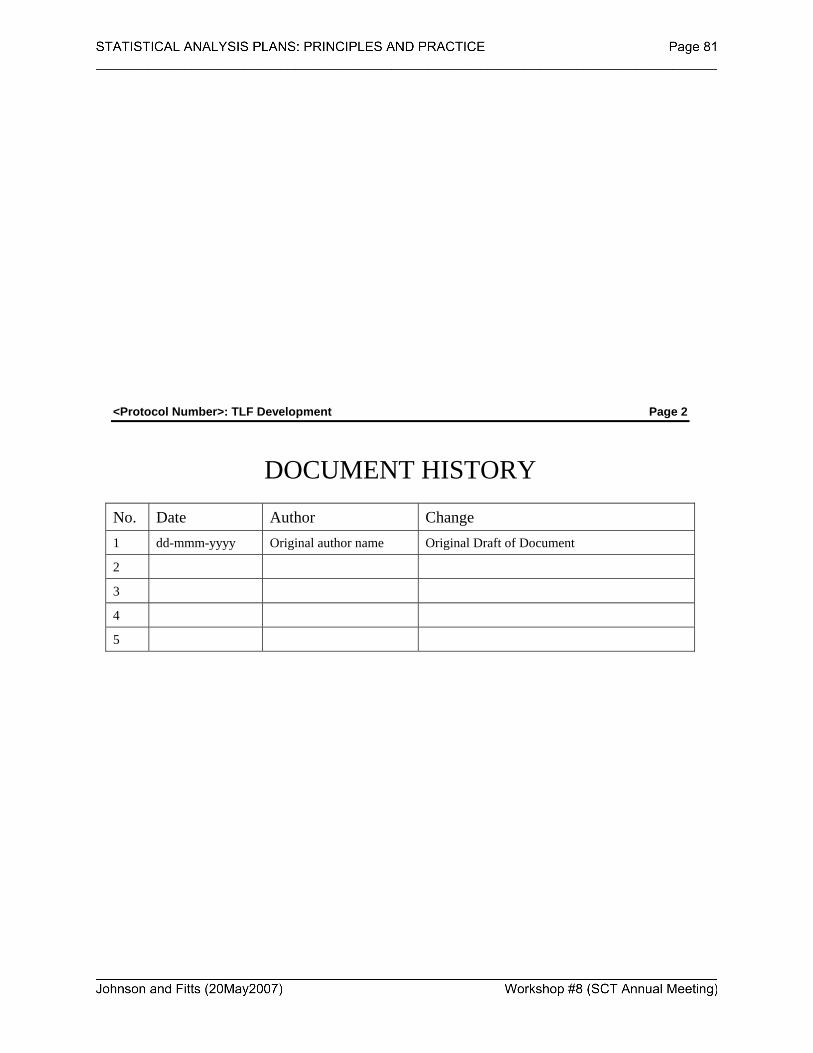
<Protocol Number>: TLF Development Page 2
DOCUMENT HISTORY No. Date Author Change 1 dd-mmm-yyyy Original author name Original Draft of Document
2
3
4
5
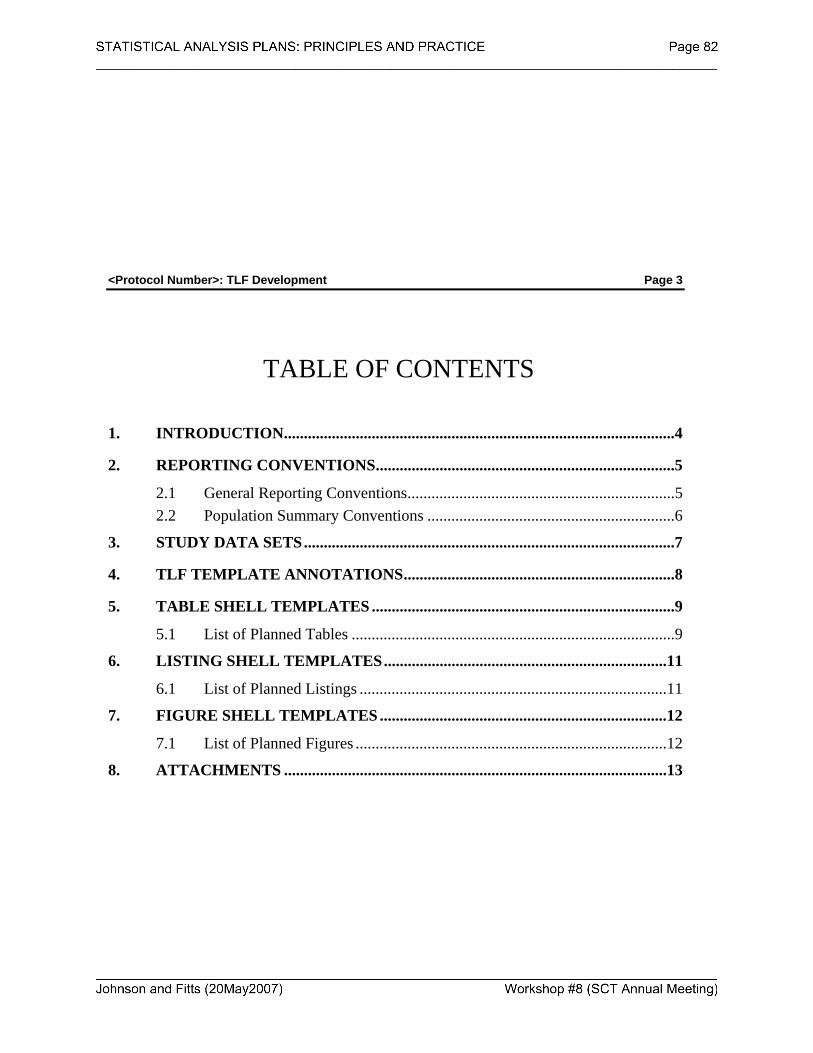
<Protocol Number>: TLF Development Page 3
TABLE OF CONTENTS
1. INTRODUCTION..................................................................................................4
2. REPORTING CONVENTIONS...........................................................................5
2.1 General Reporting Conventions...................................................................5 2.2 Population Summary Conventions ..............................................................6
3. STUDY DATA SETS.............................................................................................7
4. TLF TEMPLATE ANNOTATIONS....................................................................8
5. TABLE SHELL TEMPLATES ............................................................................9
5.1 List of Planned Tables .................................................................................9
6. LISTING SHELL TEMPLATES.......................................................................11
6.1 List of Planned Listings .............................................................................11
7. FIGURE SHELL TEMPLATES ........................................................................12
7.1 List of Planned Figures ..............................................................................12
8. ATTACHMENTS ................................................................................................13
<Protocol Number>: TLF Development Page 4 1. INTRODUCTION
This Tables, Listing, and Figures (TLF) development document provides the documentation and templates and for development, validation, and approval of the TLFs planned for <insert study protocol number>.
May want to insert a paragraph regarding the SOP that supports Statistical Operations programming standards and other relevant SOP’s within BDS for support.
All program development will be completed with SAS Software, Version 9.x, on the <name of operating system or server>. The location of all programs, macros, data sets, and supporting documentation for <insert study protocol number> may be found in <insert the file location>.
This TLF Development Document evolves during the course of a study and is supported by the following documents:
• Protocol: <insert study protocol number>
• Annotated Case record Form for <insert study protocol number>
• Statistical Analysis Plan for <insert study protocol number>
Following completion of the TLF development attachments to this document include validation documentation, and copies of the approval documentation. Additional programming documentation (log files or output) are also attached to further document the production of thes TLFs.
<Protocol Number>: TLF Development Page 5 2. REPORTING CONVENTIONS
Standard text for reporting conventions should be adopted and utilized across ALL SAPs ant TLF Development. Review and agreement is required. The following are only suggested to facilitate discussion. Reporting standards from statistical operations and from the standard TLF work previously completed should be incorporated.
The following reporting conventions will be adopted for the production of TLFs. These conventions will enhance the review process and help to standardize presentation with common notations.
2.1 General Reporting Conventions
• All tables and data listings will be presented in Landscape Orientation, unless presented as part of the text in a CSR.
• Figures will be presented in Landscape Orientation, unless Portrait Orientation suggests that the information presented is easier to interpret.
• Legends will be used for all figures with more than one variable or item displayed.
• Figures will be in black and white (no color). Symbols on figures will not be filled. Lines should be wide enough to see the line after being copied.
• Specialized text styles, such as bolding, italics, borders, shading, superscripted and subscripted text will not be used in tables, figures, and data listings unless they add significant value to the table, figure, or data listing.
• Only standard keyboard characters should be used in tables and data listings. Special characters, such as non-printable control characters, printer specific, or font specific characters, will not be used on a table, figure, or data listing. Hexadecimal character representations are allowed (e.g., μ, α, β).
• All titles will be centered on a page. The first title line will be the number of the table, figure, or data listing. The second (and if required, third) line will be the description of the table, figure, or data listing. The ICH numbering convention is to be used for all TLGs.
• All footnotes will be left justified and the bottom of a page. Footnotes must be present on the page where they are first referenced. Footnotes should be used sparingly and must add value to the table, figure, or data listing. If more than four footnote lines are planned then a cover page may be used to display footnotes.
<Protocol Number>: TLF Development Page 6
• Missing values for both numeric and character variables will be presented as blanks in a table or data listing.
• All date values will be presented as DDMMMYYYY (e.g., 29AUG2001) format. A four-digit year is preferred for all dates.
• All observed time values will be presented using a 24-hour clock HH:MM:SS format (e.g., 01:35:45 or 11:26). Seconds should only be reported if they were measured as part of the study.
• Time durations will be reported in mixed HHhr MMm SSs notation (e.g., 5h 32m, or 27h 52m 31s). The use of decimal notation to present time durations should be avoided (e.g. 0.083h = 5m) unless it is necessary to show the computation of time differences in a table, figure, or data listing, in which case both notations may be used to display the time duration.
• All tables, figure, and data listings will have the name of the program and a date/time stamp on the bottom of each output.
• All analysis programs developed for a table, figure, or data listing display will be self-contained to facilitate transfer of programs to multiple computing environments and transfer to a regulatory agency (if requested). It is recommend that a 1:1 relationship between table and analysis program be used to facilitate this convention.
2.2 Population Summary Conventions
• Population(s) represented on the tables or data listings will be clearly identified in the last title of the Table as “Population: <name of population>” and will be identical in name to that identified in the protocol or SAP.
• Consistent terminology will be used to define and identify identify a population. Common nomenclature may include (a) Full Analysis or ITT, (b) All Patients, (c) PP or Per-Protocol, (d) Efficacy, and (e) Safety.
• Sub-population(s) or special population(s) descriptions will provide sufficient detail to ensure comprehension of the population (e.g., ITT Females, Per-Protocol Males >60 years of age) used for analysis in a table or figure.
• Population sizes may be presented for each treatment or dosing category as totals in the column header as (N=xxxx), where appropriate.
• Population sizes shown with summary statistics are the samples sizes (n) of patients with non-missing values.
<Protocol Number>: TLF Development Page 7
• All population summaries for categorical variables will include categories that the patients had a response in these categories. Percentages corresponding to null categories (cells) will be suppressed.
• All population summaries for continuous variables will include: N, mean, SD, minimum, and maximum. Other summaries (e.g. median, quartiles, 5%, 95% intervals, CV or %CV) may be used as appropriate.
• All percentages are rounded and reported to a single decimal point (xx.x%). If percentages are reported as integers, percentages greater than 0% but <1% will be reported as <1%, whereas percentages greater than 99% but <100% will be reported as >99%. A percentage of 100% will be reported as 100%. No value of 0% should be reported. Any computation of percent that results in 0% is to be reported as a blank.
• Population summaries that include p-values will report the p-value to three decimal places with a leading zero (0.001). All p-values reported on default output from statistical software (i.e., SAS® Software) may be reported at the default level of precision. P-values <0.001 should be reported as <0.001 not 0.000.
3. STUDY DATA SETS
The organization and contents of the data sets for this study are located in <insert directory name>. Contents of the final study data sets are attached to this document.
<may want to add more>
<Protocol Number>: TLF Development Page 8 4. TLF TEMPLATE ANNOTATIONS
Within each TLF template specified annotations are made to support the development of the particular output.
Legend Annotation:
• Red italicized text (Text) indicates table variables
• Blue italicized text in brackets [Text] indicates optional/possible fields to be displayed.
• Information following each TLF decribes additional programming and repeat directives.
<Pro
toco
l Num
ber>
TLF
Dev
elop
men
t Pa
ge 9
4/
27/2
007
CO
NFI
DEN
TIA
L
5.
TA
BL
E S
HE
LL
TE
MPL
AT
ES
The
follo
win
g Ta
bles
are
pla
nned
for t
his s
tudy
. Eac
h Sh
ell T
able
con
tain
s a te
mpl
ate,
and
pro
gram
min
g no
tes f
or d
evel
opm
ent a
nd
valid
atio
n of
the
resp
ectiv
e ta
ble.
Fin
al N
umbe
ring
for t
he T
able
s will
be
com
plet
ed a
fter c
onsu
ltatio
n w
ith th
e m
edic
al w
riter
and
pr
ojec
t sta
tistic
ian.
5.1
Lis
t of P
lann
ed T
able
s
Tab
le 1
. (1
4.1.
1) A
naly
sis P
opul
atio
ns...
......
......
......
......
......
......
......
......
......
......
......
......
......
......
......
......
......
......
......
......
......
......
....1
0
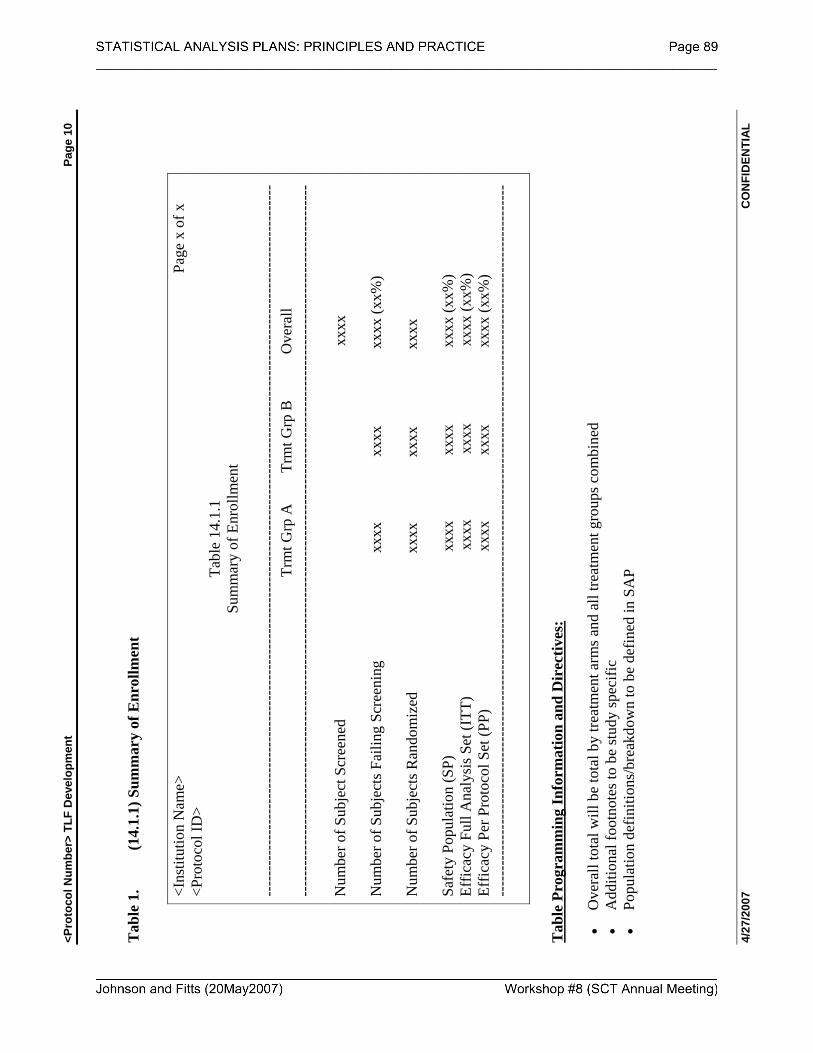
<Pro
toco
l Num
ber>
TLF
Dev
elop
men
t Pa
ge 1
0 4/
27/2
007
CO
NFI
DEN
TIA
L
Tab
le 1
. (1
4.1.
1) S
umm
ary
of E
nrol
lmen
t
<I
nstit
utio
n N
ame>
Pa
ge x
of x
<P
roto
col I
D>
Tabl
e 14
.1.1
Su
mm
ary
of E
nrol
lmen
t
----
----
----
----
----
----
----
----
----
----
----
----
----
----
----
----
----
----
----
----
----
----
----
----
----
----
----
----
----
----
----
----
----
----
--
T
rmt G
rp A
Trm
t Grp
B
O
vera
ll --
----
----
----
----
----
----
----
----
----
----
----
----
----
----
----
----
----
----
----
----
----
----
----
----
----
----
----
----
----
----
----
----
----
----
N
umbe
r of S
ubje
ct S
cree
ned
xxxx
N
umbe
r of S
ubje
cts F
ailin
g Sc
reen
ing
xx
xx
xxx
x
x
xxx
(xx%
) N
umbe
r of S
ubje
cts R
ando
miz
ed
xx
xx
xxx
x
x
xxx
Sa
fety
Pop
ulat
ion
(SP)
x
xxx
x
xxx
xxx
x (x
x%)
Effic
acy
Full
Ana
lysi
s Set
(ITT
)
xx
xx
xxx
x
x
xxx
(xx%
) Ef
ficac
y Pe
r Pro
toco
l Set
(PP)
x
xxx
x
xxx
xxx
x (x
x%)
----
----
----
----
----
----
----
----
----
----
----
----
----
----
----
----
----
----
----
----
----
----
----
----
----
----
----
----
----
----
----
----
----
----
--
T
able
Pro
gram
min
g In
form
atio
n an
d D
irec
tives
: •
Ove
rall
tota
l will
be
tota
l by
treat
men
t arm
s and
all
treat
men
t gro
ups c
ombi
ned
• A
dditi
onal
foot
note
s to
be st
udy
spec
ific
• Po
pula
tion
defin
ition
s/br
eakd
own
to b
e de
fined
in S
AP
<Pro
toco
l Num
ber>
TLF
Dev
elop
men
t Pa
ge 1
1 4/
27/2
007
CO
NFI
DEN
TIA
L
6.
LIS
TIN
G S
HE
LL
TE
MPL
AT
ES
The
follo
win
g Li
stin
gs a
re p
lann
ed fo
r thi
s stu
dy. E
ach
shel
l Lis
ting
cont
ains
a te
mpl
ate,
and
pro
gram
min
g no
tes f
or d
evel
opm
ent a
nd
valid
atio
n of
the
resp
ectiv
e Li
stin
g. F
inal
Num
berin
g fo
r the
Lis
tings
will
be
com
plet
ed a
fter c
onsu
ltatio
n w
ith th
e m
edic
al w
riter
and
pr
ojec
t sta
tistic
ian.
6.1
Lis
t of P
lann
ed L
istin
gs
<Pro
toco
l Num
ber>
TLF
Dev
elop
men
t Pa
ge 1
2 4/
27/2
007
CO
NFI
DEN
TIA
L
7.
FIG
UR
E S
HE
LL
TE
MPL
AT
ES
The
follo
win
g Fi
gure
s are
pla
nned
for t
his s
tudy
. Eac
h sh
ell f
igur
e co
ntai
ns a
tem
plat
e, a
nd p
rogr
amm
ing
note
s for
dev
elop
men
t and
va
lidat
ion
of th
e re
spec
tive
figur
e. F
inal
Num
berin
g fo
r the
Fig
ures
will
be
com
plet
ed a
fter c
onsu
ltatio
n w
ith th
e m
edic
al w
riter
and
pr
ojec
t sta
tistic
ian.
7.1
Lis
t of P
lann
ed F
igur
es
<Pro
toco
l Num
ber>
TLF
Dev
elop
men
t Pa
ge 1
3 4/
27/2
007
CO
NFI
DEN
TIA
L
8.
AT
TA
CH
ME
NT
S
Atta
chem
ents
to th
e TL
F D
evel
opm
ent D
ocum
ent a
re N
ot n
umbe
red.
<Ins
ert L
ist o
f Atta
chem
ents
to b
e pl
aced
with
this
doc
umen
tatio
n>