Statistical Analysis Plan for the efficacy trial of the ...
13
Statistical Analysis Plan for the efficacy trial of the Fit to Study intervention NatCen Social Research PROJECT TITLE Fit to Study DEVELOPER Oxford Brookes University and University of Oxford EVALUATOR NatCen Social Research PRINCIPAL INVESTIGAT OR/ EVALUATIO N LEAD Vainius Bartasevicius (NATCEN) TRIAL (CHIEF) STATISTICIA N & INSTITUTION Fatima Husain (NATCEN) SAP AUTHOR & INSTITUTION Vainius Bartasevicius and Nico Jabin (NATCEN) TRIAL REGISTRATI ON NUMBER ISRCTN15730512 EVALUATIO N PROTOCOL URL https://educationendowmentfoundation.org.uk/public/files/Projects/Evaluation_Protocol s/Neuroscience_-_Fit_to_Study_Trial_Protocol.pdf Ackground SAP version history VERSION DATE REASON FOR REVISION 1.0 15/03/2018 Original Version
Transcript of Statistical Analysis Plan for the efficacy trial of the ...

Statistical Analysis Plan for the efficacy trial of the Fit to Study intervention NatCen Social Research
PROJECT TITLE
Fit to Study
DEVELOPER Oxford Brookes University and University of Oxford
EVALUATOR NatCen Social Research
PRINCIPAL INVESTIGAT
OR/ EVALUATIO
N LEAD
Vainius Bartasevicius (NATCEN)
TRIAL (CHIEF)
STATISTICIAN &
INSTITUTION
Fatima Husain (NATCEN)
SAP AUTHOR &
INSTITUTION Vainius Bartasevicius and Nico Jabin (NATCEN)
TRIAL REGISTRATION NUMBER
ISRCTN15730512
EVALUATION
PROTOCOL URL
https://educationendowmentfoundation.org.uk/public/files/Projects/Evaluation_Protocols/Neuroscience_-_Fit_to_Study_Trial_Protocol.pdf
Ackground
SAP version history
VERSION DATE REASON FOR REVISION
1.0 15/03/2018 Original Version

2
Table of Contents Protocol and SAP changes ..................................................................................................................... 3
Introduction.............................................................................................................................................. 3
Study design ........................................................................................................................................... 4
Randomisation ........................................................................................................................................ 6
Calculation of sample size ...................................................................................................................... 6
Follow-up ................................................................................................................................................. 7
Outcome measures ................................................................................................................................. 8
Primary outcome .............................................................................................................................. 8
Data and data sources ............................................................................................................................ 8
Analysis ................................................................................................................................................... 8
Primary intention-to-treat (ITT) analysis .......................................................................................... 8
Interim analyses ............................................................................................................................... 9
Imbalance at baseline for analysed groups ..................................................................................... 9
Sensitivity analyses .......................................................................................................................... 9
Missing data ..................................................................................................................................... 9
Non-compliance with intervention .................................................................................................. 10
Subgroup analyses ........................................................................................................................ 11
Effect size calculation .................................................................................................................... 11
References ............................................................................................................................................ 12

3
Protocol and SAP changes
The changes made to the proposed analysis since the publication of the Protocol are listed below,
alongside the reason for the changes.
1. In the protocol we originally proposed to stratify randomisation by gender-status of schools
(co-educational or single-sex) and by geography. The latter was meant to improve
implementation of teacher training. However, due to changes to the way teachers are trained
(following the introduction of the online training element), this is no longer required. We also
intended to retain stratification by urban/rural status, as this may reflect different existing
exercise regimes and thus influence treatment effectiveness. However, stratification by both
gender-status and an urban/rural status of schools proved to be impossible because all rural
schools selected for the trial were co-educational. Therefore, stratification was done by the
gender-status of schools only. However, we will check for any imbalances between the
treatment and control groups in terms of the urban/rural status.
2. In the protocol we suggested that we would select three Year 8 form groups per school.
However, we believe it would be more appropriate to randomly select the number of form
groups proportionally to the school size, ensuring that each pupil and each school contribute
more equally to any estimated effect.
3. It was expected that the randomisation of schools and selection of forms would be conducted
at the same time. However, due to the likely changes to the number and composition of forms
from Year 7(when school level randomisation took place) to Year 8, selection of forms will
take place once the final data on the year 8 forms has been obtained, and at the latest by
March 2018.
4. We reviewed MDES estimates based on comments from reviewers and the sample achieved
Introduction
This statistical analysis plan sets out the details of the analysis planned for the cluster-randomised
controlled efficacy trial of Fit to Study. Fit to Study aims to improve pupils’ educational outcomes by
increasing pupils’ vigorous physical activity (VPA) levels.
Fit to Study is a whole-school intervention that implements a schedule of VPA in schools’ Physical
Education (PE) lessons, ensuring that each pupil receives around 20 minutes of VPA per week1.
Increased VPA is hypothesised to lead to improved cognition and concentration, better classroom
behaviour and, after a year of increased VPA, improved attainment.
To implement the intervention, all PE teachers in participating schools receive two hours of face-to-
face training (also available via online live stream), and follow-up support including online videos,
delivered by a team of sports scientists from Oxford University. Oxford University is also responsible
for school recruitment.
The trial aims to test a single hypothesis: Fit to Study can improve maths attainment of Year 8 pupils
within one school year. Oxford University are exploring additional hypotheses about the link between
measured levels of pupils’ activity and educational and fitness outcomes. These hypotheses do not
form part of this trial design.
Fit to Study is implemented in the school year 2017/18. School recruitment takes place in January to
April 2017, with baseline fitness testing carried out by Oxford in between April and June 2017. The
randomisation took place in July 2017, followed by PE teacher training in July 2017 and September
1 The intervention requires 10 minutes of VPA per lesson, delivered as four-minute warm-up at the start of the PE lesson and three two-minute intensive bursts of VPA, called ‘fitness infusions.’ Assuming two PE lessons per pupil per week this results in around 20 minutes of VPA per pupil.

4
20172. The intervention is implemented between September 2017 and June 2018, with outcome
testing between June and July 2018. This is set out in Table 1.
Table 1: Fit to Study trial timetable
2017 2018
Mar
Apr
May
Jun
Jul
Aug
Sep
Oct
Nov
Dec
Jan
Feb
Mar
Apr
May
Jun
Jul
School recruitment
Baseline testing
Randomisation
Teacher training
Intervention delivery
Outcome testing
Design overview
Please ensure all details are in line with the latest version of the protocol.
Trial type and number of arms Efficacy, 2-arm trial
Unit of randomisation School
Stratification variables (if applicable)
Gender-status of schools (co-educational or single-sex)
Outcomes
primary Maths attainment
secondary -
Outcome sources
(instruments, datasets)
primary Raw scores achieved in the Progress Test in Mathematics (PTM), Level 13
secondary -
Study design
The trial of Fit to Study is an efficacy trial, exploring the intervention’s potential to improve outcomes,
under as ideal circumstances as possible and looking at a restricted cohort (Thorpe et al. 2009). The
trial is designed as two-arm (school-) cluster-randomised trial, in which pupils cluster within schools.
Schools have been chosen as unit of randomisation due to the whole-school nature of the
programme.
In order to take part in the trial, schools have to fulfil the following criteria:
school type is state school or free school but not grammar school;
the school is located in one of the following geographic regions: Greater London; Thames
Valley; Southampton and Portsmouth; Bristol and Bath; Birmingham and Coventry;
Cheltenham/Gloucester; or Luton, Bedford and Milton Keynes.
2 Some schools will be trained in July and others in September 2017. All schools will be provided with online training videos in September 2017.

5
FSM eligibility in the sample of selected schools is 16.7%. In comparison, 13.2% of pupils were
known to be eligible for, and claiming, free school meals in England’s secondary schools in 2016)3.
In all participating schools, pupils in all Year 8 forms will receive the intervention; however, not all
forms will form part of the trial. Instead, for pragmatic reasons, in each school 49% of forms will be
randomly selected for trial participation. Selecting a proportion of forms relative to the school size
ensures that our estimates give a more equal weighting to each pupil, rather than more weight to
pupils in smaller and less weight to pupils in larger schools. Unequal probability sample without
replacement will be drawn, meaning that each class may only be selected once. Sampling
probabilities will be proportional to class size. Classes with larger number of pupils will have higher
likelihood to be selected for the trial.
It has to be noted that classes with only one pupil will be excluded from the random selection process.
The same will apply to classes with less than 10 pupils if there are classes with more than 10 pupils in
the same school. These exclusions are done with the aim of testing as many Year 8 pupils as
possible.
In each trial form, those pupils that do not opt out will be part of the trial.
According to the protocol, a total of 100 schools were to be recruited for the trial. A slightly higher
number of schools was recruited in order to protect the final sample size if schools dropped out of the
trial. The final number of recruited schools was 106 (see Table 2) although 18 of them have already
dropped out of the trial. The figures provided in Table 2 will be updated based on the final data
received from schools. In the report, we will also provide the numbers of classes and pupils selected
for testing.
Table 2: Recruited schools
Schools participating in the trial were randomly assigned, by NatCen, to one of two intervention
conditions:
Schools in Group 1 (intervention schools) will receive the Fit to Study programme
Schools in Group 2 (control schools) will continue with ‘business as usual’
Business as usual will involve the usual regime of PE teaching and the exercise contained within.
Schools may or may not have additional opportunities for pupil exercise.
School participation is incentivised. Both control and treatment schools receive £500 for taking part in
the trial, upon completion of the academic testing at the end of the trial. Both control and treatment
schools receive the financial incentive, because while treatment schools receive the intervention, they
also experience a high level of research burden. Control schools will not receive the intervention when
the trial is complete.
Outcomes will be measured between June and July 2018, at the end of the school year in which the
intervention was implemented. Other outcomes, as part of Oxford University’s evaluation, will be
collected from a sample of trial pupils throughout the year.
Baseline data (Key Stage 2 Maths outcomes) will be collected from the NPD.
3 January 2016 School Census data. Schools, pupils and their characteristics: January 2016, Department for Education, p. 6.
Schools recruited 106
Forms within recruited schools 734
Forms per school 6.9
Average number of pupils per form 26

6
Randomisation
Schools were randomly assigned to treatment and control using a stratified block randomisation.
Stratification was done by single-sex / co-educational status of schools. Both treatment and the
comparison group have 10 single-sex schools each. Due to changes in the training of PE teachers to
include online as well as face-to-face training, the geographical stratification set out in the Protocol
was no longer required. Teachers who were unable to attend training sessions delivered in
Birmingham, Oxford, and London could access online training. The training was designed and
delivered by the developer.
In addition to assigning schools, forms in each school will be randomly selected to be part of the trial.
Our approach is not a classic sampling, in which the sampled forms provide evidence of a true
population (school) parameter. Instead, only the randomly sampled forms will be considered part of
the trial, and the true school level parameter will be estimated in the selected classes.
Finally, we suggested in the protocol that we would select three forms per school. However, we will
now select the number of forms proportionally to the school size, to better ensure that each pupil and
each school contribute more equally to any estimated effect. The randomisation of forms will take
place once the data on the Year 8 form groups has been obtained.
Calculation of sample size
Our original estimates of the minimum detectable effect size were based on the following
assumptions:
90 pupils (3 forms) per school are tested
a two-tailed test
a significance level of 5% and power of 80%
baseline covariates explaining 50% of variance at pupil level
no clustering of effects at the class level.
Table 3: Minimum detectable effect size
Achieved sample size (schools)
80 90 100
ICC4
0.10 0.21 0.19 0.18
0.12 0.22 0.21 0.20
0.16 0.26 0.24 0.23
We have updated these estimates in the light of our current knowledge of the participation status of
schools. Out of 106 schools that had originally agreed to take part in the trial, 2 schools dropped out
before the randomisation and further 16 schools (11 of them with a treatment status and 5 with a
control) opted out in the early stages of the trial. Therefore, the number of participant schools dropped
to 88. The original sample of recruited schools had an average of 6.9 forms per school and 26 pupils
per form. It is important to note that our updated MDES calculations are based on the assumption of
no further school-level attrition. If more schools are to drop out of the trial, MDES is likely to increase.
Moreover, the number of drop outs in the treatment and control groups is unequal. This may
reintroduce imbalances between the two groups that had been previously eliminated (in expectation)
as a result of randomisation.
4 ICC estimates provided by the Education Endowment Foundation (2015, p.1) for Maths scores at Key Stage 4 range from 0.11 to 0.21 for different English regions. Estimates tend to be lower for younger pupils, so we would expect marginally smaller scores for Year 8 pupils. Education Endowment Foundation (2015) Intra-cluster correlation coefficients. London: Education Endowment Foundation.

7
Based on the comments from reviewers, we have also made a few changes to the assumptions that
we are using in MDES calculation. The changes that were made regard the percentage of variance
explained by baseline covariates and the intra-cluster correlation. Below is the full list of assumptions
made in the revised calculations of MDES:
a two-tailed test;
a 5% statistical significance level;
80% power to detect an effect of at least the MDES, if an effect exists;
88 participant schools and no further attrition at school and pupil level;
On average, 78 pupils per school will be tested (3 forms per school x 26 pupils on average in
one form)
40% of pupil-level variance explained by baseline covariates5;
10% of school-level variance explained by baseline covariates (we lack strong evidence for
selecting this figure and therefore opt for the conservative estimate);
an intra-school correlation of 0.166; and
47% of participating schools allocated to treatment.
Minimum detectable effect size (MDES) calculated with these assumptions is equal to 0.24 standard
deviations. If all 106 recruited schools would have participated in the trial MDES would be 0.21
standard deviations. All calculations were performed in PowerUp!, version 01/22/2015 (Dong and
Maynard 2013).
Follow-up
School enrolment and randomisation processes are summarised in the figure below.
Figure1: CONSORT Flow diagram
5 EEF (2013) gives estimates of the correlation between KS2 and GCSE Maths results at 0.76, giving an estimated R2 of 0.58. However, we have conservatively estimated a lower value of 40% at pupil level. 6 ICC estimates provided by the Education Endowment Foundation (2015a, 1) for Maths scores at Key Stage 4 range from 0.11 to 0.21 for different English regions.
106 schools recruited and assessed for eligibility
104 schools randomised
2 schools excluded
Declined to participate (n=2)
Enrolment
52 schools allocated to intervention (11 of them have dropped out)
52 schools allocated to control (5 of them have dropped out)
Allocation

8
Outcome measures
Primary outcome
The primary outcome is maths attainment, as measured by the raw scores achieved in the Progress
Test in Mathematics (PTM), Level 13 (GL Assessment 2015). The test will be administered by NatCen
interviewers in schools post-treatment towards the end of the 2017/18 summer term. Interviewers will
be blind to the school’s allocation and will be instructed not to enquire about the school’s allocation
status. However we cannot control for schools disclosing their status to interviewers.
PTM is a standardised group test that assesses pupils' mathematical skills and concepts. PTM Level
13 is suitable for pupils completing Year 8. The test takes 75 minutes to complete.
PTM assesses two dimensions of learning:
1. mathematical content knowledge (Curriculum Content Category); and
2. understanding and applying mathematical processes through reasoning and problem solving
(Process Category).
No secondary outcomes are assessed.
Data and data sources
The analysis will include data from the sources set out in Table 3:
Table 3: Data sources
Source Data
School baseline survey Data on pupils participating in the trial including name, Unique Pupil Number (UPN), gender, date of birth, home postcode, form
School level information such as school type and number
of Year 8 forms and pupils
Pupil test Progress in Maths, Level 13 – the end of Year assessment of maths proficiency
National Pupil Database Baseline Key Stage 2 Maths outcome, as measured by the variable KS2_MATMRK
Absence rates for pupils in Year 8
Edubase The urban/rural status of schools
Teacher logs Data on PE lessons in treatment schools, including the number of minutes of VPA during warm-up and the number of 2 minute infusions
Analysis
Primary intention-to-treat (ITT) analysis
The primary analysis will examine the hypothesis that F2S improves outcomes in maths, as measured
using the primary outcome measure. The analysis will be conducted on an intention-to-treat basis and
will include pupils in all Year 8 forms selected to be part of the trial, subject to consent and successful
collection of outcome data.
Following EEF guidance (Education Endowment Foundation 2015b), evidence of effectiveness and
reported effect sizes will be obtained from a baseline-adjusted analysis, in which the dependent
variable is the result of the outcome test, and effects are estimated through a multilevel linear model
containing a dummy variable indicator capturing treatment/control group membership, the

9
stratification variable (gender-status of school), and pupil level baseline test scores. The model
analysed will be a two-level model in which pupils cluster in school, with schools modelled as random
effects using a random intercept model (see equation (1)).
𝑇𝑒𝑠𝑡𝑖𝑗 = 𝛽0 + 𝛽1𝑏𝑎𝑠𝑒𝑙𝑖𝑛𝑒𝑖𝑗 + 𝛽2𝑖𝑛𝑡𝑒𝑟𝑣𝑒𝑛𝑡𝑖𝑜𝑛𝑗 + 𝛽3𝑠𝑡𝑟𝑎𝑡𝑖𝑓𝑖𝑒𝑟𝑠𝑗 + 𝑢𝑗 + 𝑒𝑖𝑗 (1)
where i presents the individual, j presents the school, and uj is the school random effect. The
intervention effect is estimated by β2.
The analysis will run in R in the latest available version (R Core Team 2015) using the eefAnalytics
package (Kasim et al. 2016) in the latest available version. Analysts will not be blind to treatment
status of the groups.
Interim analyses
There are no interim analyses planned for this trial.
Imbalance at baseline for analysed groups
Baseline characteristics will be summarised by treatment and control group across schools and
pupils. Where available variables will be presented at pupil level, otherwise at school level.
Continuous variables will be summarised with descriptive statistics (n, mean, standard deviation,
range and median).
At school level, the comparison will cover:
School type (academy, free school, etc.)
Number of Year 8 pupils
Number of Year 8 forms
Urban/rural status
At the pupil level, the following baseline comparisons will be presented:
Eligibility for free school meals
Gender
Key Stage 2 maths scores (obtained from the NPD)
Imbalance on baseline covariates between the treatment and control groups in the sample as
analysed will be assessed for the covariates listed above using the appropriate statistical test (two-
independent-sample t-test for continuous variables and Fisher’s exact test for categorical variables),
with a p-value of 0.05 or smaller considered as indication of covariate imbalance. Differences in
baseline outcomes will be reported as Hedges’ g effect size.
If imbalances are found to exist, a model that includes the unbalanced variables in addition to those in
the main model will be estimated as sensitivity analyses.
Sensitivity analyses
Two additional sensitivity analyses will be carried out to explore the robustness of the main finding:
An unadjusted analysis that does not include the baseline covariates;
An adjusted analysis that includes any variables we believe are likely to be predictive of
outcomes: gender, absence rate and FSM eligibility.
Missing data
Our primary analysis assumes that any missing outcome data are missing completely at random
(MCAR) and uses complete case analysis. We will assess the robustness of our results to alternative
assumptions about the mechanisms leading to missing data.

10
We will explore the number, pattern and likely reasons for missing outcome data. We will report the
number of pupils with missing outcome data by treatment arm and present a comparison of baseline
characteristics with observed and missing outcomes using cross-tabulations. We will then run a drop-
out model to assess whether any existing covariates predict the observed loss-to-follow up pattern.
We will estimate the propensity score using multivariate logistic regression. In this case, the
propensity score can be thought of as the conditional probability that a pupil has been tested or a
parent responded in the post-intervention questionnaire given the set of existing covariates capturing
pupil/parent characteristics.
If loss-to-follow up can be predicted using existing covariates, we will impute missing outcomes using
multiple imputation, under the assumption that data are missing at random (MAR). Following the new
EEF guidance documentation, MI will only be carried out if the amount of missing data exceeds 5%.
We will impute a number of new datasets7 using a two-level linear model: pupil (level 1), and school
(level 2). The model will include all variables in the main analysis; any variables predictive of
missingness; and variables associated with the outcome, individual-level indicators of FSM eligibility,
gender and absences. The estimated regression equations will then be used to generate predicted
values for the cases with missing data and estimate treatment effects and standard errors under the
alternative assumption. Rubin’s rules will be used to combine the estimates from multiple datasets
into an overall MI estimate.
In addition, we will explore the robustness of our results to extreme suppositions under the
assumption that data are missing not at random (MNAR). We will impute the highest possible scores
for missing outcome values in the treatment group and lowest possible scores for the missing values
in the control group to model the best case scenario, and vice versa for the worst case scenario, and
re-estimate the treatment effects in both cases. This analysis will provide a range of treatment effects
under the most extreme cases of data missing not at random and therefore the upper and lower
bounds of the likely effect sizes under the assumption that data is not missing at random.
Treatment Effects in the presence of Non-compliance
A complier average treatment effect (CACE) will be estimated to show the effect of Fit to Study on
pupils in schools that comply with the assignment to their trial status. Compliance will be defined with
reference to the proportion of VPA sessions actually delivered, out of the number of sessions that
should have been delivered. CACE estimates will be reported for a range of compliance cut-offs, from
90% compliance to zero compliance. The real CACE estimation is assumed to be generated
somewhere between minimal and optimal compliance thresholds8.
Given that teachers and pupils in control schools do not have access to the F2S programme, the
CACE can be estimated under the assumption of one-sided non-compliance. We will label any trial
pupils in treatment school which did not deliver as many F2S sessions as the cut-off as non-compliant
and estimate a complier average treatment effect (CACE) by dividing the ITT estimate by the share of
compliers.
𝐶𝐴𝐶𝐸 = 𝐼𝑇𝑇𝑦
Pr (𝐶𝑜𝑚𝑝𝑙𝑖𝑒𝑟𝑠)
(2)
Teacher logs will be the main source of information when estimating compliance. Teacher logs are
records containing detailed information on VPA sessions that were delivered during PE lessons in
treatment schools. PE teachers in all treatment schools have been asked to enter information on
every PE lesson delivered. However, as teachers need to complete the log immediately after a PE
lesson, there is likely to be incomplete, missing, or inaccurate data. Therefore, it may be that a
compliance estimate derived from teacher logs will not cover all treatment schools. Also, we will not
7 The number of imputed datasets will be selected based on guidance by Graham et al. (2007) who approached the problem in terms of loss of power for hypothesis testing. Based on simulations (and a willingness to tolerate up to a 1 percent loss of power), they recommended 20 imputations for 10% to 30% missing information, and 40 imputations for 50% missing information. Source: (Graham, Olchowski, and Gilreath 2007) 8 Gerber and Green, Field Experiments: Design, Analysis, and Interpretation, 2012.

11
use teacher logs to estimate compliance in those schools which have provided information on less
than 50% of PE lessons. In instances where a school does not report on each and every PE lesson
but provides information on more than 50% of all PE classes, we will assume that no VPA sessions
were implemented in the lessons for which we have no data.
To compensate for the potentially limited school coverage of teacher logs, we will run a second
analysis which will be based on responses to a post-intervention school survey. Specifically, in the
survey we will ask for an estimate of the % of Y8 PE lessons delivered as intended. Since survey data
will be retrospective and will not capture the delivery of VPA in each PE lesson, this type of
compliance analysis will be less accurate. However, we expect it to cover more schools than the
analysis based on teacher logs.
Subgroup analyses
Two subgroup analyses will be carried out, examining whether there is evidence for a differential
impact of the intervention on pupils by:
FSM eligibility
Gender
Prior attainment
Estimation of subgroup effects on the primary outcome will involve the re-estimation of the adjusted
model described above, with the addition of a further covariate for the particular subgroup concerned.
This additional covariate will be interacted with the treatment/control group indicator. Where the
coefficients resulting from this interaction reach statistical significance at the 95 per cent level,
separate models will be estimated and reported for each subgroup.
Effect size calculation
Calculation of effect sizes and their variances (and thus 95% confidence intervals) will be carried out
using the eefAnalytics plugin for cluster-randomised trials. This estimates the effect size following
Hedges (2007), using the total pooled within-groups standard deviation, and assuming unequal
cluster sizes9.
The effect size will be calculated as follows:
𝑑 =(�̅�𝑇−�̅�𝐶)𝑎𝑑𝑗
𝜎𝑇√1 − (
(𝑁−𝑛𝑈𝑇 𝑚𝑇−𝑛𝑈
𝐶 𝑚𝐶)+𝑛𝑈𝑇 +𝑛𝑈
𝐶 −2
𝑁−2) (3)
Where (�̅�𝑇 − �̅�𝐶)𝑎𝑑𝑗 is the difference between the treatment and control group means taken from the
model (1) above, controlling for baseline and stratification variables only. The denominator (𝜎𝑇) is
calculated as the unconditional variance of model (1), i.e. has no variables entered other than the
treatment effect indicator. This calculation assumes meta-analytic inference is aimed at the
population of individuals. It is calculated, as follows:
𝜎𝑇 = √∑ ∑ (𝑌𝑖𝑗𝑇−�̅�++
𝑇 )+∑ ∑ (𝑌𝑖𝑗𝐶−�̅�++
𝐶 )𝑛𝑖
𝐶
𝑗=1𝑚𝐶𝑖=1
𝑛𝑖𝑇
𝑗=1𝑚𝑇𝑖=1
𝑁−2 (4)
The second term on the rhs of (3) is calculated using the following:
𝑛𝑈𝑇 =
(𝑁𝑇)2 − ∑ (𝑛𝑖𝑇)2𝑚𝑇
𝑖=1
𝑁𝑇(𝑚𝑇 − 1)
9 Hedges, Larry V. 2007. ‘Effect Sizes in Cluster-Randomized Designs’. https://www.researchgate.net/publication/250185702_Effect_Sizes_in_Cluster-Randomized_Designs p. 15-16,
12
𝑛𝑈𝐶 =
(𝑁𝐶)2 − ∑ (𝑛𝑖𝐶)2𝑚𝐶
𝑖=1
𝑁𝐶(𝑚𝐶 − 1)
𝑁 = 𝑁𝑇 + 𝑁𝐶
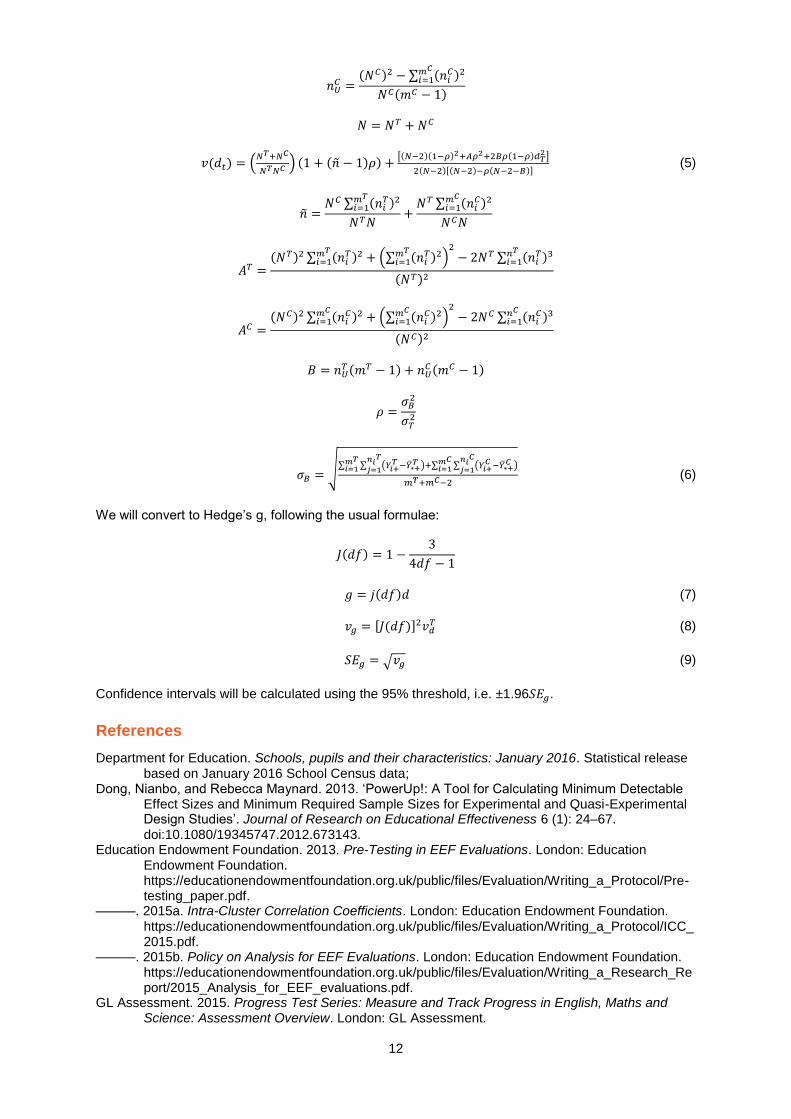
𝑣(𝑑𝑡) = (𝑁𝑇+𝑁𝐶
𝑁𝑇𝑁𝐶 ) (1 + (�̃� − 1)𝜌) +[(𝑁−2)(1−𝜌)2+𝐴𝜌2+2𝐵𝜌(1−𝜌)𝑑𝑇
2]
2(𝑁−2)[(𝑁−2)−𝜌(𝑁−2−𝐵)] (5)
�̃� =𝑁𝐶 ∑ (𝑛𝑖
𝑇)2𝑚𝑇
𝑖=1
𝑁𝑇𝑁+
𝑁𝑇 ∑ (𝑛𝑖𝐶)2𝑚𝐶
𝑖=1
𝑁𝐶𝑁
𝐴𝑇 =(𝑁𝑇)2 ∑ (𝑛𝑖
𝑇)2 + (∑ (𝑛𝑖𝑇)2𝑚𝑇
𝑖=1 )2
− 2𝑁𝑇 ∑ (𝑛𝑖𝑇)3𝑛𝑇
𝑖=1𝑚𝑇
𝑖=1
(𝑁𝑇)2
𝐴𝐶 =(𝑁𝐶)2 ∑ (𝑛𝑖
𝐶)2 + (∑ (𝑛𝑖𝐶)2𝑚𝐶
𝑖=1 )2
− 2𝑁𝐶 ∑ (𝑛𝑖𝐶)3𝑛𝐶
𝑖=1𝑚𝐶
𝑖=1
(𝑁𝐶)2
𝐵 = 𝑛𝑈𝑇 (𝑚𝑇 − 1) + 𝑛𝑈
𝐶 (𝑚𝐶 − 1)
𝜌 =𝜎𝐵
2
𝜎𝑇2
𝜎𝐵 = √∑ ∑ (𝑌𝑖+𝑇 −�̅�∗+
𝑇 )+∑ ∑ (𝑌𝑖+𝐶 −�̅�∗+
𝐶 )𝑛𝑖
𝐶
𝑗=1𝑚𝐶𝑖=1
𝑛𝑖𝑇
𝑗=1𝑚𝑇𝑖=1
𝑚𝑇+𝑚𝐶−2 (6)
We will convert to Hedge’s g, following the usual formulae:
𝐽(𝑑𝑓) = 1 −3
4𝑑𝑓 − 1
𝑔 = 𝑗(𝑑𝑓)𝑑 (7)
𝑣𝑔 = [𝐽(𝑑𝑓)]2𝑣𝑑𝑇 (8)
𝑆𝐸𝑔 = √𝑣𝑔 (9)
Confidence intervals will be calculated using the 95% threshold, i.e. ±1.96𝑆𝐸𝑔.
References
Department for Education. Schools, pupils and their characteristics: January 2016. Statistical release based on January 2016 School Census data;
Dong, Nianbo, and Rebecca Maynard. 2013. ‘PowerUp!: A Tool for Calculating Minimum Detectable Effect Sizes and Minimum Required Sample Sizes for Experimental and Quasi-Experimental Design Studies’. Journal of Research on Educational Effectiveness 6 (1): 24–67. doi:10.1080/19345747.2012.673143.
Education Endowment Foundation. 2013. Pre-Testing in EEF Evaluations. London: Education Endowment Foundation. https://educationendowmentfoundation.org.uk/public/files/Evaluation/Writing_a_Protocol/Pre-testing_paper.pdf.
———. 2015a. Intra-Cluster Correlation Coefficients. London: Education Endowment Foundation. https://educationendowmentfoundation.org.uk/public/files/Evaluation/Writing_a_Protocol/ICC_2015.pdf.
———. 2015b. Policy on Analysis for EEF Evaluations. London: Education Endowment Foundation. https://educationendowmentfoundation.org.uk/public/files/Evaluation/Writing_a_Research_Report/2015_Analysis_for_EEF_evaluations.pdf.
GL Assessment. 2015. Progress Test Series: Measure and Track Progress in English, Maths and Science: Assessment Overview. London: GL Assessment.

13
GL Assessment. 2015. Sample Reports for Progress Tests in Maths. London: GL Assessment.
Gerber A. and Green D., Field Experiments: Design, Analysis, and Interpretation, 2012.
Graham, John W., Allison E. Olchowski, and Tamika D. Gilreath. 2007. ‘How Many Imputations Are Really Needed? Some Practical Clarifications of Multiple Imputation Theory’. Prevention Science 8 (3): 206–13. doi:10.1007/s11121-007-0070-9.
Hedges, Larry V. 2007. ‘Effect Sizes in Cluster-Randomized Designs’. Journal of Educational and Behavioral Statistics 32 (4): 341–70.
Kasim, Adetayo, ZhiMin Xiao, Steve Higgings, and Ewoud De Troyer. 2016. EefAnalytics: Analytical Package for Analysing Education Trials. http://R-Forge.R-project.org/projects/eefanalytics/.
R Core Team. 2015. R: A Language and Environment for Statistical Computing. Vienna, Austria: R Foundation for Statistical Computing. http://www.R-project.org/.
Thorpe, Kevin E., Merrick Zwarenstein, Andrew D. Oxman, Shaun Treweek, Curt D. Furberg, Douglas G. Altman, Sean Tunis, et al. 2009. ‘A Pragmatic–explanatory Continuum Indicator Summary (PRECIS): A Tool to Help Trial Designers’. Journal of Clinical Epidemiology 62 (5): 464–75. doi:10.1016/j.jclinepi.2008.12.011.