STATISTICAL ANALYSIS PLAN FINAL - ClinicalTrials.gov
41
Page 1 of 40 STATISTICAL ANALYSIS PLAN FINAL Title: A Randomized, Double-Masked, Active-Controlled Phase 2 Study of the Efficacy, Safety, and Tolerability of Repeated Doses of Intravitreal REGN910-3 in Patients with Diabetic Macular Edema Protocol: R910-3-DME-1518.03; 31 May 2017 Phase: 2 Sponsor: Regeneron Pharmaceuticals, Inc. Date: October 12, 2017 Author’s Name: See appended electronic signature page Approved by: See appended electronic signature page Approved by: See appended electronic signature page NCT02712008
Transcript of STATISTICAL ANALYSIS PLAN FINAL - ClinicalTrials.gov
Page 1 of 40
STATISTICAL ANALYSIS PLAN FINAL
Title: A Randomized, Double-Masked, Active-Controlled Phase 2 Study of the Efficacy, Safety, and Tolerability of Repeated Doses of Intravitreal REGN910-3 in Patients with Diabetic Macular Edema
Protocol: R910-3-DME-1518.03; 31 May 2017
Phase: 2
Sponsor: Regeneron Pharmaceuticals, Inc.
Date: October 12, 2017
Author’s Name:
See appended electronic signature page
Approved by:
See appended electronic signature page
Approved by:
See appended electronic signature page
NCT02712008
Regeneron Pharmaceuticals, Inc. R910-3-DME-1518 Statistical Analysis Plan October 12, 2017
Page 2 of 40
TABLE OF CONTENTS LIST OF ABBREVIATIONS ..........................................................................................................5
1. OVERVIEW .................................................................................................................7
1.1. Background and Rationale ............................................................................................7
1.2. Study Objectives ...........................................................................................................7
1.2.1. Primary Objective .........................................................................................................7
1.2.2. Secondary Objectives ...................................................................................................8
1.2.3. Modifications from the Statistical Section in the Final Protocol ..................................8
2. INVESTIGATIONAL PLAN .......................................................................................8
2.1. Study Design and Randomization ................................................................................8
2.2. Sample Size and Power Considerations .....................................................................10
3. ANALYSIS POPULATIONS ....................................................................................11
3.1. Safety Analysis Set (SAF) ..........................................................................................11
3.2. Full analysis set (FAS)................................................................................................11
3.3. Anti-Drug Antibody (ADA) Analysis Set ..................................................................11
3.4. “FAS Secondary Randomization” set .........................................................................11
3.5. “SAF Secondary Randomization” set .........................................................................11
3.6. Pharmacokinetic Analysis Set ....................................................................................12
4. ANALYSIS VARIABLES .........................................................................................12
4.1. Demographic, Baseline Characteristics, and Medical History ...................................12
4.2. Compliance, Exposure, and Additional Treatment .....................................................13
4.3. Prior/Concomitant Medication Variables ...................................................................14
4.4. Efficacy Variables ......................................................................................................14
4.4.1. Primary Efficacy Variable ..........................................................................................14
4.4.2. Secondary Efficacy Variables .....................................................................................14
4.4.3. Additional Efficacy Variables ....................................................................................14
4.5. Safety Variables ..........................................................................................................15
4.5.1. Adverse Events and Serious Adverse Events .............................................................15
4.5.2. Surgeries .....................................................................................................................16
4.5.3. Laboratory Safety Variables .......................................................................................16
4.5.4. Ocular Safety Measures ..............................................................................................16
4.5.5. Electrocardiogram .......................................................................................................17
Regeneron Pharmaceuticals, Inc. R910-3-DME-1518 Statistical Analysis Plan October 12, 2017
Page 3 of 40
4.5.6. Vital Signs ..................................................................................................................17
4.5.7. Immunogenicity ..........................................................................................................17
4.5.8. Pharmacokinetic Variables .........................................................................................17
5. STATISTICAL METHODS .......................................................................................18
5.1. Demographics, Baseline Characteristics, Medical History, and Prior/Concomitant Medication ...................................................................................18
5.2. Patient Disposition ......................................................................................................18
5.3. Compliance, Exposure, and Additional Treatment .....................................................19
5.4. Efficacy Analyses .......................................................................................................19
5.4.1. Analysis of Efficacy Variables ...................................................................................19
5.4.1.1. Primary Analysis of Primary Efficacy Variable .........................................................19
5.4.1.2. Sensitivity Analyses of Primary Efficacy Variable ....................................................20
5.4.2. Analysis of Secondary Efficacy Variables .................................................................21
5.4.2.1. Analyses of Continuous Secondary Efficacy Variable ...............................................21
5.4.2.2. Analyses of Categorical Secondary Efficacy Variable ...............................................21
5.4.3. Analysis of Additional Efficacy Variables .................................................................21
5.4.3.1. Analyses of Continuous Additional Efficacy Variables .............................................21
5.4.3.2. Analyses of Categorical Additional Efficacy Variables .............................................21
5.4.3.3. Analyses of Time-to event Additional Efficacy Variables .........................................22
5.4.4. Additional Analysis due to IVRS Dosing Error .........................................................22
5.5. Analysis of Safety Data ..............................................................................................22
5.5.1. Adverse Events ...........................................................................................................23
5.5.2. Surgeries .....................................................................................................................23
5.5.3. Clinical Laboratory .....................................................................................................24
5.5.4. Vital Signs ..................................................................................................................24
5.5.5. Ocular Safety Measures ..............................................................................................24
5.5.6. Electrocardiogram .......................................................................................................24
5.5.7. Analysis of Drug Concentration Data .........................................................................24
5.5.8. Immunogenicity ..........................................................................................................24
6. DATA CONVENTIONS ............................................................................................25
6.1. Definition of Baseline .................................................................................................25
6.2. Handling of Missing Data ...........................................................................................25
6.3. Unscheduled Assessments ..........................................................................................25
Regeneron Pharmaceuticals, Inc. R910-3-DME-1518 Statistical Analysis Plan October 12, 2017
Page 4 of 40
7. INTERIM ANALYSIS ...............................................................................................26
8. SOFTWARE ...............................................................................................................26
9. REFERENCES ...........................................................................................................26
10. APPENDIX.................................................................................................................27
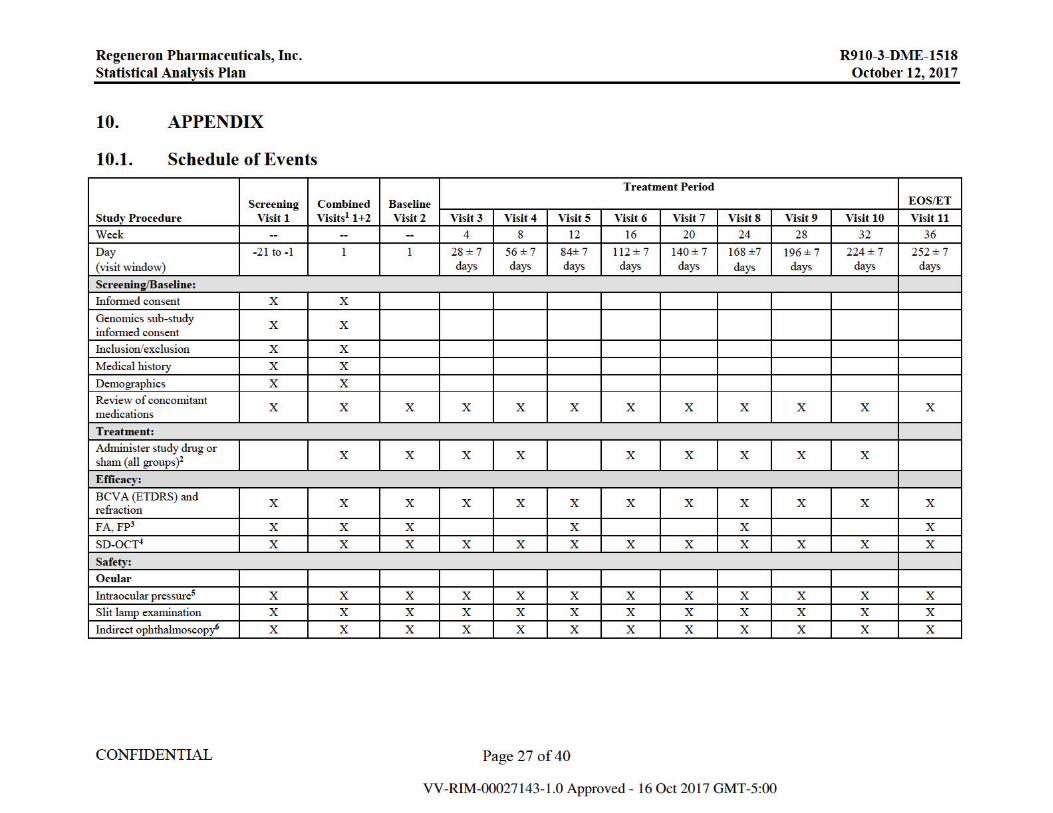
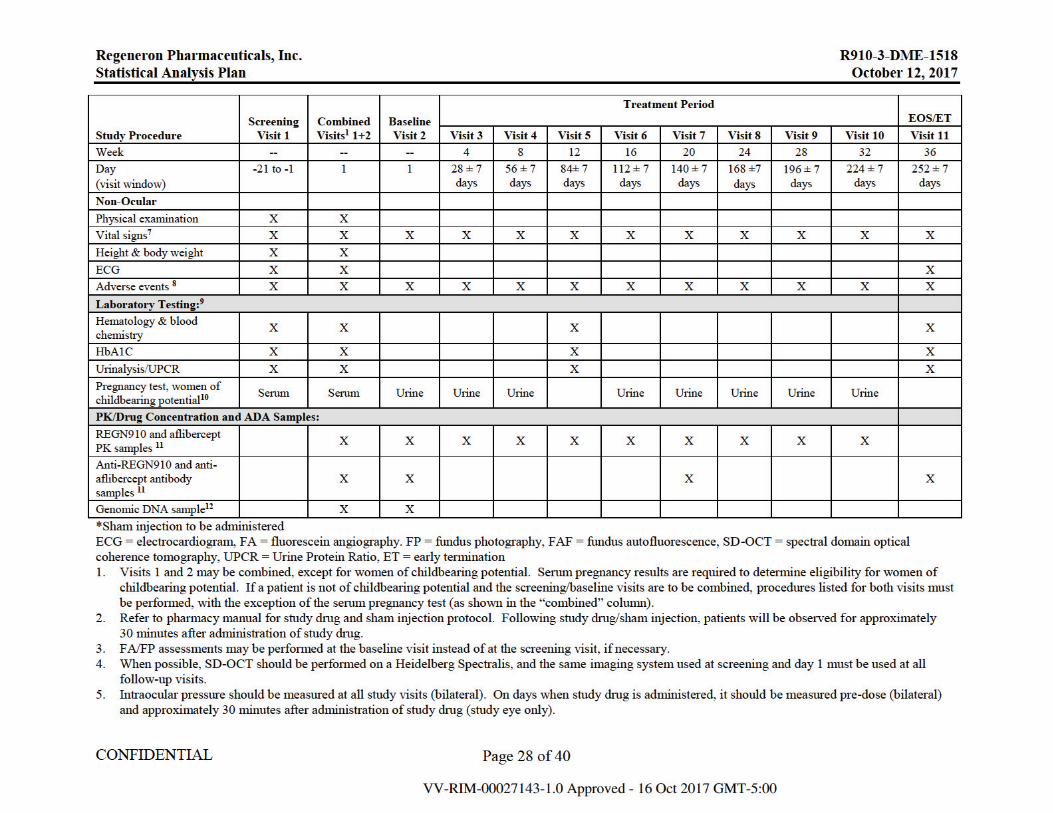
10.1. Schedule of Events .....................................................................................................27
10.2. Summary of Statistical Analyses ................................................................................30
10.3. Detailed Definition of Selected Subgroups ................................................................32
10.3.1. Hypertension ...............................................................................................................32
10.3.2. Intraocular Inflammation ............................................................................................34
10.4. Criteria for Predefined Lab Abnormalities .................................................................36
10.5. Calculation of Confidence Intervals using Mantel-Haenszel Weighting Scheme ........................................................................................................................38
10.6. Detailed Definition of Specific Baseline Assessments ...............................................39
10.6.1. Prior intravitreal anti-VEGF .......................................................................................39
10.6.2. Prior intravitreal steroids ............................................................................................39
10.6.3. Prior focal or grid laser ...............................................................................................39
10.7. Steps for EDTRS Diabetic Retinopathy Severity Scale .............................................40
LIST OF FIGURES Figure 1: Study Flow Diagram .....................................................................................................8
Figure 2: Study Flow Figure ........................................................................................................9
Figure 3: Dosing Schedule .........................................................................................................10
Regeneron Pharmaceuticals, Inc. R910-3-DME-1518 Statistical Analysis Plan October 12, 2017
Page 5 of 40
LIST OF ABBREVIATIONS ADA Anti-drug antibody
AE Adverse event
ALT Alanine Aminotransferase
AMD Age-related macular degeneration
Ang2 Angiopoietin 2
ANCOVA Analysis of covariance
APTC Adjudicated Anti-platelet trialists’ collaboration
AST Aspartate Aminotransferase
ATC Anatomical Therapeutic Chemical
AUC Area under curve
BCVA Best corrected visual acuity
BMI Body mass index
BUN Blood urea nitrogen
CMH Cochran-Mantel-Haenszel
CNV Choroidal neovascularization
CPK Creatine phosphokinase
CRF Case report form (electronic or paper)
CST Central subfield retinal thickness
DME Diabetic macular edema
DNA Deoxyribonucleic acid
DR Diabetic retinopathy
DRIL Disorganization of Retinal Inner Layers
DRSS Diabetic Retinopathy Severity Scale
ECG Electrocardiogram
ETDRS Early treatment diabetic retinopathy study
FA Fluorescein angiography
FAS Full analysis set
FDA Food and Drug Administration
FP Fundus photography
HbA1C Hemoglobin A1C
Regeneron Pharmaceuticals, Inc. R910-3-DME-1518 Statistical Analysis Plan October 12, 2017
Page 6 of 40
IAI Intravitreal aflibercept injection
ICF Informed consent form
ICH International Conference on Harmonization
IOP Intraocular pressure
IV Intravenous
IVT Intravitreal
LOCF Last Observation Carried Forward
MedDRA Medical Dictionary for Regulatory Activities
(MedDRA) HLT High Level Term
(MedDRA) LLT Low Level Term
(MedDRA) PT Preferred term
(MedDRA) SOC System organ class
MI Multiple imputation
OC Observed case
OCT Optical coherence tomography
PCSV Potentially clinically significant value
PK Pharmacokinetic
RBC Red blood cell
Regeneron Regeneron Pharmaceuticals, Inc.
SAE Serious adverse event
SAF Safety analysis set
SAP Statistical analysis plan
SAS Statistical Analysis Software
TEAE Treatment-emergent adverse event
UPCR Urine Protein Creatinine Ratio
VA Visual acuity
VEGF Vascular endothelial growth factor
WBC White blood cell
Regeneron Pharmaceuticals, Inc. R910-3-DME-1518 Statistical Analysis Plan October 12, 2017
Page 7 of 40
1. OVERVIEW The purpose of the statistical analysis plan (SAP) is to ensure the credibility of the study results by pre-specifying the statistical approaches for analysis of the study prior to the database lock. The statistical evaluation will be performed according to the specifications given in the protocol and, and if applicable, the corresponding amendments.
The SAP is intended to be a comprehensive and detailed description of the strategy and statistical technique to be used for the analysis of the REGN910-3-DME-1518 study. The statistical analysis of all data will be performed after all patients have either discontinued or completed the study at Week 36 (End of Study).
1.1. Background and Rationale Diabetic retinopathy (DR) is a major cause of visual impairment in the United States. Diabetic macular edema (DME) is a manifestation of DR and is the most frequent cause of blindness in young and mid-aged adults. Anti-vascular endothelial growth factor (VEGF) therapy has become the standard of care treatment for DME. The efficacy and safety of intravitreal aflibercept injection (IAI) in this patient population is well characterized. However, in DME there is the possibility of improving treatment outcomes.
Like VEGF, Ang2 expression is upregulated by hypoxia and exposure to elevated glucose levels, and ocular levels of both Ang2 and VEGF are elevated in the eyes of humans afflicted with wet age-related macular degeneration (AMD) or ischemic retinopathies, including retinopathy of prematurity and diabetic retinopathy. In addition, a growing body of experimental evidence indicates that not only are VEGF and Ang2 co-regulated in these disease states, but that they may also act together to promote pathological neovascularization and vascular permeability. These observations together indicate that not only would pharmacological inhibition of Ang2 be likely to provide therapeutic benefit in the treatment of diabetic eye disease, but that combined inhibition of Ang2 and VEGF could produce a greater therapeutic effect than inhibition of either angiogenic factor alone.
In addition to improving visual outcomes, targeting both the VEGF and Ang-2 pathways in neovascular and ischemic eye disease also has the possibility of providing a longer duration of action resulting in a longer treatment interval.
REGN910-3 is a co-formulation of REGN910 (anti-Ang2 antibody, nesvacumab) and REGN3 (anti-VEGF; also called aflibercept).
1.2. Study Objectives
1.2.1. Primary Objective The primary objective of the study is to compare the efficacy of IVT-administered REGN910-3 compared to IAI in improving best corrected visual acuity (BCVA) in patients with DME.
Regeneron Pharmaceuticals, Inc. R910-3-DME-1518 Statistical Analysis Plan October 12, 2017
Page 8 of 40
1.2.2. Secondary Objectives The secondary objectives of the study are to assess:
If REGN910-3 demonstrates an anatomic benefit compared to IAI alone
The duration of effect of REGN910-3 following 3 initial monthly injections
The safety and tolerability of REGN910-3
The presence of anti-REGN910 and anti-aflibercept antibodies in serum
1.2.3. Modifications from the Statistical Section in the Final Protocol Not applicable
2. INVESTIGATIONAL PLAN
2.1. Study Design and Randomization This is a randomized, double-masked, active-controlled phase 2, multi-center study of the efficacy and safety of repeated doses of IVT REGN910-3 versus IAI alone in patients with DME.
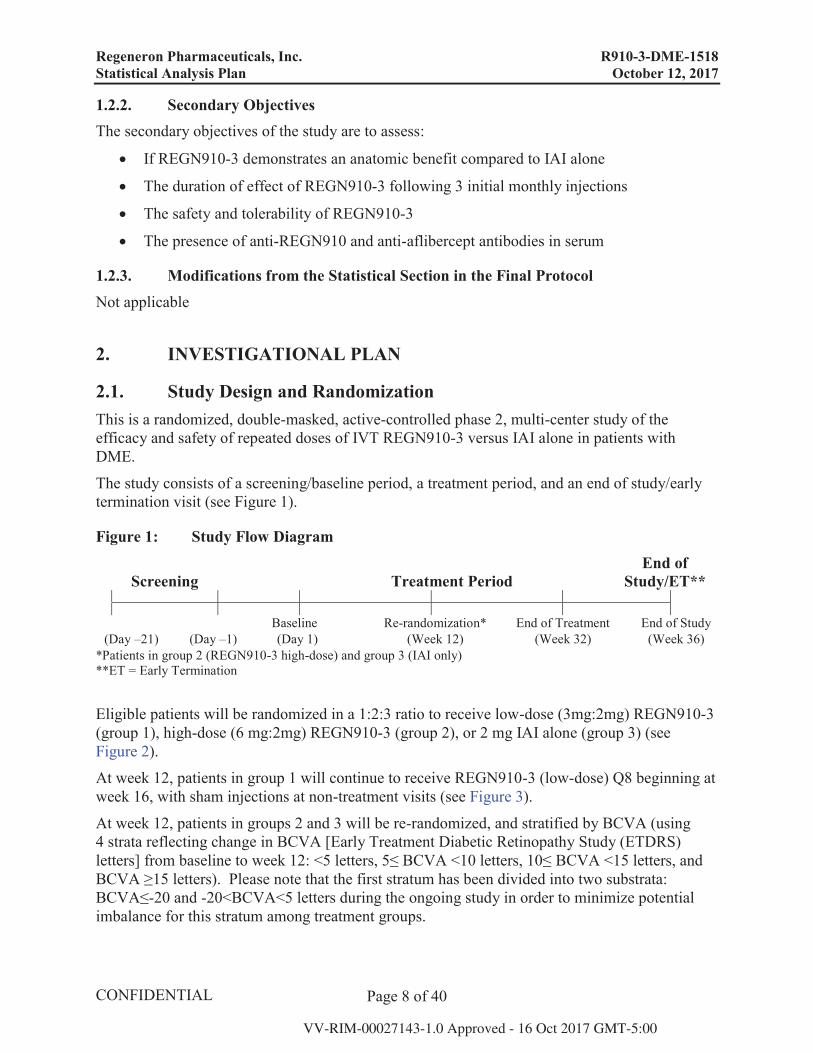
The study consists of a screening/baseline period, a treatment period, and an end of study/early termination visit (see Figure 1).
Figure 1: Study Flow Diagram
Screening Treatment PeriodEnd of
Study/ET**
Baseline Re-randomization* End of Treatment End of Study(Day –21) (Day –1) (Day 1) (Week 12) (Week 32) (Week 36)
*Patients in group 2 (REGN910-3 high-dose) and group 3 (IAI only) **ET = Early Termination
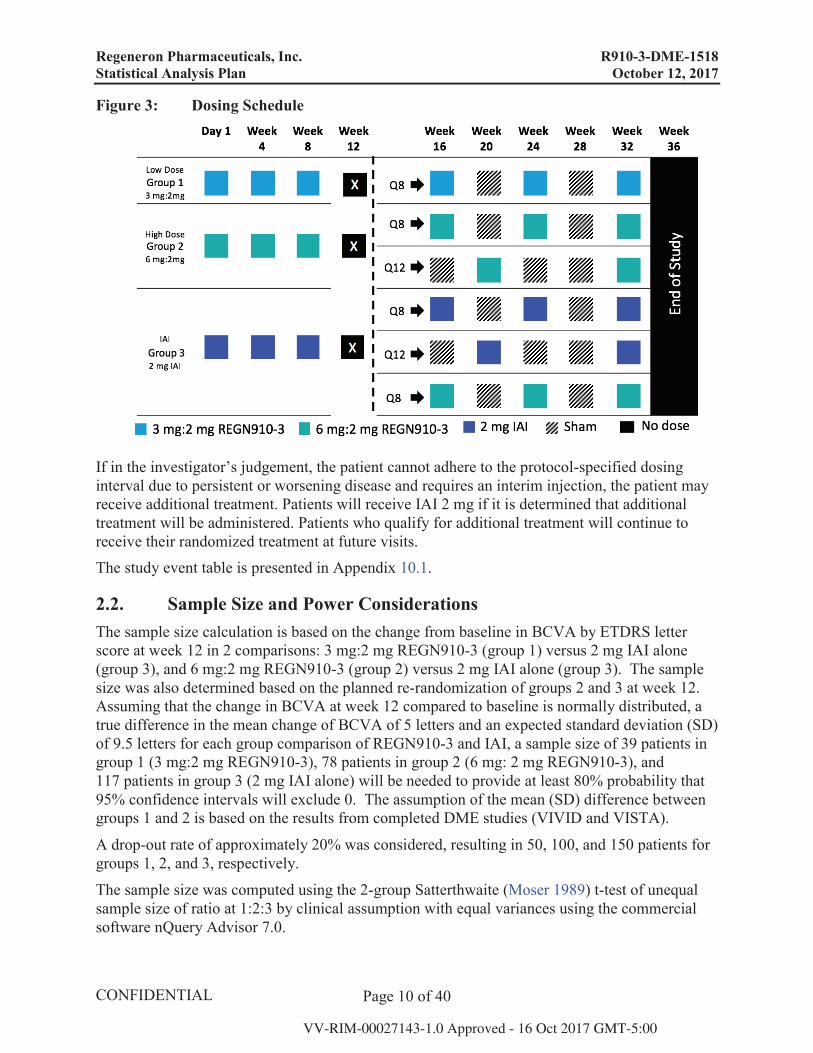
Eligible patients will be randomized in a 1:2:3 ratio to receive low-dose (3mg:2mg) REGN910-3 (group 1), high-dose (6 mg:2mg) REGN910-3 (group 2), or 2 mg IAI alone (group 3) (see Figure 2).
At week 12, patients in group 1 will continue to receive REGN910-3 (low-dose) Q8 beginning at week 16, with sham injections at non-treatment visits (see Figure 3).
At week 12, patients in groups 2 and 3 will be re-randomized, and stratified by BCVA (using 4 strata reflecting change in BCVA [Early Treatment Diabetic Retinopathy Study (ETDRS) letters] from baseline to week 12: <5 letters, 5≤ BCVA <10 letters, 10≤ BCVA <15 letters, and BCVA ≥15 letters). Please note that the first stratum has been divided into two substrata: BCVA≤-20 and -20<BCVA<5 letters during the ongoing study in order to minimize potential imbalance for this stratum among treatment groups.
Regeneron Pharmaceuticals, Inc. R910-3-DME-1518 Statistical Analysis Plan October 12, 2017
Page 9 of 40
Patients in group 2 will be re-randomized into 2 groups, with dosing from week 16 through week 32 as indicated:
Group 2a: REGN910-3 high-dose (6 mg:2 mg) Q8 beginning at week 16, with sham injections at non-treatment visits
Group 2b: REGN910-3 high-dose (6 mg:2 mg) every 12 weeks (Q12) beginning at week 20, with sham injections at non-treatment visits
Patients in group 3 will be re-randomized into 3 groups, with dosing from week 16 through week 32 as indicated:
Group 3a: IAI 2 mg Q8 beginning at week 16, with sham injections at non-treatment visits
Group 3b: IAI 2 mg Q12 beginning at week 20, with sham injections at non-treatment visits
Group 3c: REGN910-3 high-dose (6 mg:2 mg) Q8 beginning at week 16, with sham injections at non-treatment visits
Figure 2: Study Flow Figure
1 Stratification for re-randomization will be based on VA outcomes at week 12
Regeneron Pharmaceuticals, Inc. R910-3-DME-1518 Statistical Analysis Plan October 12, 2017
Page 10 of 40
Figure 3: Dosing Schedule
If in the investigator’s judgement, the patient cannot adhere to the protocol-specified dosing interval due to persistent or worsening disease and requires an interim injection, the patient may receive additional treatment. Patients will receive IAI 2 mg if it is determined that additional treatment will be administered. Patients who qualify for additional treatment will continue to receive their randomized treatment at future visits. The study event table is presented in Appendix 10.1.
2.2. Sample Size and Power Considerations The sample size calculation is based on the change from baseline in BCVA by ETDRS letter score at week 12 in 2 comparisons: 3 mg:2 mg REGN910-3 (group 1) versus 2 mg IAI alone (group 3), and 6 mg:2 mg REGN910-3 (group 2) versus 2 mg IAI alone (group 3). The sample size was also determined based on the planned re-randomization of groups 2 and 3 at week 12. Assuming that the change in BCVA at week 12 compared to baseline is normally distributed, a true difference in the mean change of BCVA of 5 letters and an expected standard deviation (SD) of 9.5 letters for each group comparison of REGN910-3 and IAI, a sample size of 39 patients in group 1 (3 mg:2 mg REGN910-3), 78 patients in group 2 (6 mg: 2 mg REGN910-3), and 117 patients in group 3 (2 mg IAI alone) will be needed to provide at least 80% probability that 95% confidence intervals will exclude 0. The assumption of the mean (SD) difference between groups 1 and 2 is based on the results from completed DME studies (VIVID and VISTA).
A drop-out rate of approximately 20% was considered, resulting in 50, 100, and 150 patients for groups 1, 2, and 3, respectively.
The sample size was computed using the 2-group Satterthwaite (Moser 1989) t-test of unequal sample size of ratio at 1:2:3 by clinical assumption with equal variances using the commercial software nQuery Advisor 7.0.
Regeneron Pharmaceuticals, Inc. R910-3-DME-1518 Statistical Analysis Plan October 12, 2017
Page 11 of 40
3. ANALYSIS POPULATIONS In accordance with guidance from the International Conference of Harmonization of Technical Requirements for Registration of Pharmaceuticals for Human Use (ICH) guideline ICH E9 Statistical Principles for Clinical Trials (1998), the following populations of analysis will be used for statistical analysis as described below.
3.1. Safety Analysis Set (SAF) The safety analysis set (SAF) includes all patients who received any study treatment; analyses on the SAF will be based on the treatment actually received (as treated).
The “as-treated” assignment will only differ from the “as randomized” if the patient is systematically (more than 50% of the given treatments) receiving as their primary therapy the treatment from an alternative treatment group. Patients whose “as treated” assignment differs from their “as randomized” assignment will be listed.
Treatment compliance/administration at Week 12 and safety analyses for adverse events, Intraocular pressure (IOP), and surgeries through Week 36 will be analyzed using the SAF.
3.2. Full analysis set (FAS) The full analysis set (FAS) will include all randomized patients who received any study treatment, have a baseline measurement of BCVA, and at least 1 post-baseline assessment of BCVA.
The FAS will be used to evaluate all efficacy variables at Week 12. The analysis on the FAS will be performed according to the treatment assigned at baseline (as randomized).
3.3. Anti-Drug Antibody (ADA) Analysis Set The ADA analysis set will include all treated patients who received any study drug and who had a reportable result for ADA following the first dose of study drug. ADA analysis will be based on all treatments actually received (as treated).
3.4. “FAS Secondary Randomization” setThis set will include all the patients in FAS who had completed the study through week 12, had received any study treatment after secondary randomization (for patients in group 2-high dose and group 3-IAI) or after Week 12 (for patients in group 1-low dose), had assessment of BCVA at Week 12, and had at least 1 post-Week 16 assessment of BCVA. The analysis on the “FAS Secondary Randomization” will be performed according to the treatment assigned (as randomized) at Week 12 for group 2 and 3 (high dose and IAI, respectively) or at baseline for group 1 (low dose).
For efficacy analyses after Week 12, “FAS Secondary Randomization” will be used.
3.5. “SAF Secondary Randomization” setThis set will include all the patients in SAF who had completed the study through week 12, had received any study treatment after secondary randomization (for patients in group 2-high dose and group 3-IAI) or after Week 12 (for patients in group 1-low dose). The analysis on the “SAF
Regeneron Pharmaceuticals, Inc. R910-3-DME-1518 Statistical Analysis Plan October 12, 2017
Page 12 of 40
Secondary Randomization” will be performed according to the treatment assigned (as randomized) at Week 12 for group 2 and 3 (high dose and IAI, respectively) or at baseline for group 1 (low dose).
For treatment compliance/administration and all safety analyses through Week 36, “SAF Secondary Randomization” will be used.
3.6. Pharmacokinetic Analysis Set The pharmacokinetic (PK) population includes all treated patients who received any study drug and who had at least 1 non-missing result for drug concentration following the first dose of study drug.
4. ANALYSIS VARIABLES
4.1. Demographic, Baseline Characteristics, and Medical History Demographic and baseline assessments to be summarized will include:
Age, gender, and race
Weight, height, and body mass index (BMI)
Vital signs (baseline heart rate, systolic blood pressure, diastolic blood pressure, and temperature)
Hemoglobin A1C (HbA1C)
Duration of Diabetes (years): defined as time from diagnosis (based on medical history data (MedDRA HLT “diabetes mellitus”) to randomization
Diabetes Type (Type 1 and Type 2)
Intraocular pressure (IOP)
Medical history
Previous treatment for DME
Prior intravitreal anti-VEGF
Prior intravitreal steroids
Prior focal or grid laser
Baseline BCVA
Baseline central subfield retinal thickness (CST)
Baseline Diabetic Retinopathy Severity Score (DRSS) by level
Presence of Disorganization of Retinal Inner Layers (DRIL)
Medical history will be coded according to Medical Dictionary for Regulatory Activities (MedDRA) version 20.0.
Regeneron Pharmaceuticals, Inc. R910-3-DME-1518 Statistical Analysis Plan October 12, 2017
Page 13 of 40
Prior intravitreal anti-VEGF, Prior intravitreal steroids, and Prior focal or grid laser are defined in Appendix 10.6.
4.2. Compliance, Exposure, and Additional Treatment Compliance Per patient, compliance with protocol-defined study medication during the 2 time periods (12 weeks and 36 weeks) will be calculated for the study eye as follows:
Treatment Compliance = (Number of received REGN910-3/IAI injections through time period/(Number of planned REGN910-3/IAI injections during period of participation in the study through time period) x 100%
For patients who discontinue early, the number of planned injections will be included up to the last visit before dropout.
Exposure Exposure to study drug will be analyzed for each patient. The following variables will be listed and summarized:
Total number of planned REGN910-3/IAI doses administered. REGN910-3 and IAI doses will be summarized separately if patients switch to the other treatment.
Treatment duration of REGN910-3/ IAI: [last treatment date] – [first dose date] + 28 days (28 days are added, because of the minimum 4-week dosing interval in the study)
Additional Treatment Beginning at Week 12, if, in the investigator’s judgement, the patient cannot adhere to the protocol-specified dosing interval due to persistent or worsening disease and requires an interim injection, the patient may receive additional treatment. Patients will receive IAI 2 mg if it is determined that additional treatment will be administered. Additional treatment will be summarized as follows:
Total number of patients that received additional treatment by treatment group
Total number of injection given as additional treatments to each treatment group beginning at Week 12
Regeneron Pharmaceuticals, Inc. R910-3-DME-1518 Statistical Analysis Plan October 12, 2017
Page 14 of 40
4.3. Prior/Concomitant Medication Variables Medications (prior or concomitant) will be recorded and will be coded to Anatomical Therapeutic Chemical (ATC) according to World Health Organization Drug Dictionary (WHO Drug Dictionary) March 2016 enhanced version provided by Bayer Health Care.
Medications will be summarized as follows:
Prior medication is defined as medications that are started before and ended before a patient received the first study treatment.
Concomitant medication is defined as medications that are ongoing at or begin after the start of study treatment.
New medication is defined as medication that began after the start of study treatment.
4.4. Efficacy Variables Analyses of efficacy will include the variables below.
4.4.1. Primary Efficacy Variable The primary efficacy variable is the change from baseline in BCVA measured by the ETDRS letter score at week 12 through week 36.
4.4.2. Secondary Efficacy Variables The secondary efficacy variables are:
Change from baseline in central subfield retinal thickness (CST) at week 12 through week 36 as measured by SD-OCT
Proportion of patients with a ≥2-step improvement in Diabetic Retinopathy Severity Scale (DRSS) from baseline at week 12 through week 36
4.4.3. Additional Efficacy Variables The additional efficacy variables are:
Area under curve (AUC) for BCVA from baseline at week 12 through week 36*
Proportion of patients who gain any letters (> 0 letter) and ≥ 5, 10, 15 ETDRS letters from baseline at week 12 through week 36
Proportion of patients who lose ≥ 5, 10 and 15 ETDRS letters from baseline at week 12 through week 36
Proportion of patients who achieve BCVA of ≥68 letters (20/40 Snellen equivalent) at week 12 through week 36
AUC for CST from baseline at week 12 through week 36*
Proportion of patients with a ≥ 2-step worsening from baseline in the ETDRS DRSS at week 12 through week 36
Regeneron Pharmaceuticals, Inc. R910-3-DME-1518 Statistical Analysis Plan October 12, 2017
Page 15 of 40
Proportion of patients with a ≥ 3-step improvement from baseline in the ETDRS DRSS at week 12 through week 36
Proportion of patients with a ≥ 3-step worsening from baseline in the ETDRS DRSS at week 12 through week 36
Proportion of patients with no retinal and/or subretinal fluid**at week 12 through week 36
Time to no retinal and/or subretinal fluid**
Proportion of patients with absence of DRIL*** at week 12 through week 36.
*For changes in CST and BCVA, and AUC for CST and BCVA, analyses will also be performed using the change from week 12 to week 36. Here, AUC will be calculated as a weighted average based on total AUC (using the trapezoidal rule) divided by total duration in days.
**Retinal and/or subretinal fluid is assessed using Intraretinal Fluid (IRF) Cystoid Edema and Subretinal Fluid (SRF). If answers are “No” to both measurements, there is no Retinal and/or subretinal fluid (Dry); if “Yes” to any of the two measurements, there is Retinal and/or subretinal fluid (Not Dry); other than the previous two cases, Retinal and/or subretinal fluid is undetermined.
***Absence of DRIL is the opposite answer to the assessment of DRIL: absence of DRIL is “Yes” if “No” to the assessment of DRIL; absence of DRIL is “No” if “Yes” to the assessment of DRIL. Otherwise, DRIL is undetermined.
4.5. Safety Variables
4.5.1. Adverse Events and Serious Adverse Events An Adverse Event (AE) is any untoward medical occurrence in a patient administered a study drug which may or may not have a causal relationship with the study drug.
AEs will be collected from the time of informed consent signature and at each visit until the end of the study. If the patient withdraws from the study during the screening, AEs will be collected up until the patient withdraws. If the patient withdraws after receiving the first dose of study medication, AEs will be collected up until end of study or early termination, whichever is earlier, and will be coded using MedDRA version 20.0 with the Lowest Level Terms (LLT), the Preferred Term (PT), and the primary System Organ Class (SOC).
AEs will be summarized as:
Pre-treatment AE: Include adverse events that occur after the patient has signed the informed consent, but prior to Visit 2 (Day 1- date of the patient’s first dose of study drug).
Treatment-Emergent Adverse Event (TEAE): TEAE is defined as an AE that is observed or reported after first and not later than 30 days after last administration of study medication (REGN910-3/IAI/sham as scheduled or additional treatment) in study eye. Only worsening, pre-existing AEs and new AEs reported during treatment period (period after first treatment) will be collected in the study.
Regeneron Pharmaceuticals, Inc. R910-3-DME-1518 Statistical Analysis Plan October 12, 2017
Page 16 of 40
Other variables for AE description and analysis will include AE Verbatim Term, AE start date and end date/ongoing and corresponding study day, AE duration, relationship of AE to study drug, relationship of AE to study procedure, relationship to injection procedure, seriousness, intensity, action due to AE, treatment of AE, and outcome.
4.5.2. Surgeries All surgeries after informed consent are collected on the CRF and are coded by MedDRA. The following variables will be tabulated by MedDRA preferred term:
Pre-treatment surgery is defined as surgery performed before the start of study treatment
Treatment emergent surgery is defined as surgery that is started on or after the first study treatment.
Ocular treatment emergent surgery for study eye and fellow eye Non-ocular treatment emergent surgery
4.5.3. Laboratory Safety Variables Clinical laboratory variables will include the following:
Chemistry panel: Sodium, Potassium, Chloride, Carbon dioxide, Calcium, Glucose, Albumin, Total protein, serum, Creatinine, Blood urea nitrogen (BUN), Aspartate aminotransferase (AST), Alanine aminotransferase (ALT), Alkaline phosphatase, Lactate dehydrogenase, Total bilirubin, Total cholesterol, Triglycerides, Uric acid, Creatine phosphokinase
Hematology panel: Hemoglobin, Hematocrit, Red blood cells (RBCs), White blood cells (WBCs), Red cell indices, Platelet count, Neutrophils, Lymphocytes, Monocytes, Basophils, Eosinophils
Urinalysis: Urine Protein Creatinine Ratio (UPCR), Color, Clarity, pH, Specific gravity, Ketones, Protein, Glucose, Blood, Bilirubin, Leukocyte esterase, Nitrite, WBC, RBC, Hyaline and other casts, Bacteria, Epithelial cells, Crystals, Yeast
HbA1C
4.5.4. Ocular Safety Measures Variables of analysis for ocular safety measures include:
Proportion of patients with increased intraocular pressure (IOP):
≥ 10 mmHg increase in IOP measurement from baseline to any pre-dose measurement > 21 mmHg for any pre-dose measurement ≥ 25 mmHg for any pre-dose measurement ≥ 35 mmHg at any time during the study
Post dose IOP measurement should be the last IOP recorded.
Regeneron Pharmaceuticals, Inc. R910-3-DME-1518 Statistical Analysis Plan October 12, 2017
Page 17 of 40
4.5.5. Electrocardiogram A standard 12-lead ECG will be performed. The 12-Lead ECG parameters include: ventricular rate, the PR interval, QRS interval, RR interval, QT interval, QT interval with Bazett and Fridericia correction, and ECG status (normal or abnormal).
4.5.6. Vital Signs Variables of analysis for vital signs include temperature, heart rate, and blood pressure measures.
4.5.7. Immunogenicity Antibody (ADA) serum samples collected pre-dose at day 1 (visit 1 or 2), Week 20 (visit 7), and Week 36 (visit 11/end of study) or early termination will be analyzed for anti-REGN910 antibodies and anti-VEGF Trap antibodies, separately. The following variables will be described:
Total number of patients whose response in the ADA assay is negative at all timepoints analyzed
Pre-existing immunoreactivity defined either as a baseline positive ADA assay response (pre-dose at visit 1 or 2) with all post-dose ADA assay results negative, or a baseline positive assay response with all post-dose ADA assay responses less than 4-fold over baseline titer levels.
Treatment-emergent positive ADA response defined as any post-dose positive ADA assay response when there is no baseline positive ADA assay response.
Treatment-boosted positive ADA response defined as any post-dose positive ADA assay response that is at least a 4-fold over the baseline titer level when baseline is positive in the ADA assay.
Titer values for positive ADA assay response (Titer value category)
Low (titer < 1,000)
Moderate (1,000 ≤ titer ≤ 10,000)
High (titer > 10,000)
4.5.8. Pharmacokinetic Variables
Concentrations of REGN910 in serum and concentrations of free aflibercept and adjusted bound aflibercept in plasma will be summarized over time, and at each visit through week 36.
Regeneron Pharmaceuticals, Inc. R910-3-DME-1518 Statistical Analysis Plan October 12, 2017
Page 18 of 40
5. STATISTICAL METHODS All safety and efficacy variables will be summarized descriptively with appropriate statistical methods: categorical variables by frequency tables (absolute and relative frequencies) and continuous variables by sample statistics (i.e. mean, standard deviation, minimum, median, quartiles and maximum). Continuous variables will be described by Visit and as change from Baseline or Week 12, if applicable. Efficacy variables will be analyzed descriptively. No formal statistical testing will be provided, however confidence intervals and nominal p-values will be provided.
A summary of efficacy and safety analyses is presented in Appendix 10.2.
5.1. Demographics, Baseline Characteristics, Medical History, and Prior/Concomitant Medication
Demographic data and baseline characteristics variables, described in Section 4.1, will be summarized using descriptive statistics for SAF, FAS, and FAS Secondary Randomization.
Medical history is evaluated in SAF population by frequency tables, showing number of patients with medical history findings by primary system organ class (SOC), and high level term (HLT) by MedDRA terms.
Prior/concomitant medication will be summarized in SAF population by WHO-DD March 2016 enhanced version ATC codes (ATC 3-digit class and ATC 5-digit subclass) for medication taken during the study. Separate frequency tables will be displayed for patients with prior medications, new medications and concomitant medications by the time periods described in Section 4.3.
New and concomitant medications will be summarized by the period from Day 1 up to Week 36 (End of study).
5.2. Patient Disposition Patient disposition will include:
The total number of screened patients who met the inclusion criteria regarding the target indication, and signed the ICF (Informed consent form)
The total number of randomized patients at the initial randomization who receive a randomization number
The total number of patients at the re-randomization at Week 12 for group 2 and 3
The total number or patients in each analysis set (e.g., FAS, SAF, etc.)
The total number of patients who discontinued the study before Week 12 and Week 36 with the reasons for discontinuation
The following listings will be provided to assess the patient disposition:
A listing of patients treated but not randomized, and patients randomized but not treated, based on both the initial randomization and the secondary randomization at Week 12
Regeneron Pharmaceuticals, Inc. R910-3-DME-1518 Statistical Analysis Plan October 12, 2017
Page 19 of 40
A listing of patients who discontinued from study, along with reasons for discontinuation
A listing of patients who received additional treatment in the study eye, including the total number of additional treatments and the visits at which they received additional treatment
A listing of major protocol deviations
5.3. Compliance, Exposure, and Additional Treatment The variables for dose exposure, compliance, and additional treatment described in Section 4.2will be summarized for the study eye in SAF and “SAF Secondary Randomization” populations, using descriptive statistics by the following time periods:
Day 1 to Week 12
Day 1 to Week 36, End of study
5.4. Efficacy Analyses Efficacy analyses of all efficacy variables at Week 12 defined in Section 4.4 will be conducted using the FAS population, and after Week 12 using “FAS Secondary Randomization” population. The analysis on the FAS at Week 12 will be performed according to the treatment assigned at baseline (as randomized). Week 36 analysis will be performed according to the treatment assigned (as randomized) at Week 12 for group 2 and 3 (high dose and IAI, respectively) or at baseline for group 1 (low dose).
5.4.1. Analysis of Efficacy Variables
5.4.1.1. Primary Analysis of Primary Efficacy Variable The primary analysis of primary efficacy variables at Week 12 is an ANCOVA model with baseline measure as a covariate and treatment group as a fixed factor. The least squares mean and the 2-sided 95% confidence interval of the difference (each of REGN910-3 groups minus IAI groups) will be calculated. For analysis after Week 12, since patients are re-randomized and stratified by BCVA, the analysis will use an ANCOVA model with baseline measure as a covariate and fixed factors including treatment group and BCVA stratification variable. For group 2 and 3 (high dose and IAI, respectively), the BCVA stratification variable from IVRS for re-randomization will be used. For group 1 (low dose), the BCVA stratification variable will be derived from BCVA measurement in EDC at Week 12 since group 1 was not re-randomized and BCVA stratification variable was not available in IVRS.
For patients receiving additional treatment, their assessments will be set to missing from the next visit after the first additional treatment. If the assessments are missing, the last post-baseline efficacy variable on or prior to receiving additional treatment will be carried forward (LOCF) for the assessments.
The analysis will be performed at Week 12 using FAS population and after Week 12 using “FAS Secondary Randomization” population.

Regeneron Pharmaceuticals, Inc. R910-3-DME-1518 Statistical Analysis Plan October 12, 2017
Page 20 of 40
5.4.1.2. Sensitivity Analyses of Primary Efficacy Variable Several sensitivity analyses will be performed to address the impact of missing data due todrop-outs or receiving additional treatment. All sensitivity analyses described below will be analyzed at Week 12 using FAS population and after Week 12 using FAS population and “FAS Secondary Randomization” population. The following sensitivity analyses are used for the primary efficacy variable:
Observed case (OC) analysis Only patients that have the measurement available at a given time-point will be used. For patients receiving additional treatment, their assessments will be censored from the next visit after the first additional treatment.
Multiple Imputation (MI) analysis This approach assumes that the efficacy variables are missing at random. Multiple imputation involves the following three steps:
a. Imputation – In this step, missing data will be imputed 100 times to generate 100 completed datasets. The missing data will be imputed by a two-step procedure.
First missing data will be imputed in order to achieve a monotone missing pattern using the MCMC (Markov Chain Monte Carlo) method
Subsequently, missing data will be imputed by a regression model using the same covariates as the primary efficacy model
b. Analysis – This is the general analysis step using the multiple imputed datasets as completed sets and will be performed for each of 100 imputed datasets. Analysis model will be the same as the primary efficacy analysis.
c. Pooling – The combination of the different parameter estimates across the multiple datasets based on Rubin’s rules produce a unique point estimate and standard error taking into account the uncertainty of the imputation process.
Patients who have received additional treatment In these analyses the value at the given timepoint will be used regardless of whether the patient received additional treatment or not. Two different analyses will be conducted:
Ancillary LOCF (aLOCF) – Data obtained after the initiation of additional treatment will be included; missing data will be imputed by LOCF. The data will be analyzed in the same way as described for the primary analysis in Section 5.4.1.1.
Ancillary observed case (aOC) - All observed values will be used for analysis, including measurements taken after the initiation of additional treatment is given. Missing data will not be imputed. The data will be analyzed in the same way as described for the primary analysis in Section 5.4.1.1.
Regeneron Pharmaceuticals, Inc. R910-3-DME-1518 Statistical Analysis Plan October 12, 2017
Page 21 of 40
5.4.2. Analysis of Secondary Efficacy Variables
5.4.2.1. Analyses of Continuous Secondary Efficacy Variable Continuous secondary efficacy variable will be analyzed similarly as primary efficacy variable in Section 5.4.1.1.
The same LOCF approach for missing measurements used for the primary efficacy variable will be applied to the continuous efficacy variables. For sensitivity analyses, OC, aOC, and aLOCF approaches mentioned in Section 5.4.1.2 will be used for the continuous efficacy variables.
5.4.2.2. Analyses of Categorical Secondary Efficacy Variable The proportion of patients with a≥2-step improvement in DRSS will be summarized by frequencies and percentages.
For Week 12 analysis, a 2-sided 95% confidence interval using normal approximation for the treatment difference (each of REGN910-3 groups minus the IAI group) will be calculated. For analysis after Week 12, since patients are re-randomized and stratified by BCVA, the Cochran-Mantel-Haenszel weighted test adjusted by the same BCVA stratification factor as in the primary analysis (see Appendix 10.5) will be used to generate a 2-sided 95% confidence interval using normal approximation for the treatment difference (each of REGN910-3 groups minus the IAI group).
The same LOCF approach for missing measurements used for the primary efficacy variable willbe applied to the categorical variables. For sensitivity analyses, OC, aOC, and aLOCF approaches mentioned in Section 5.4.1.2 will be used.
In order to analyze the step improvement, DRSS will be mapped to Severity Level based on Appendix 10.7. Note that DRSS of 90 (cannot grade) will be mapped to severity level of 90. Missing data in the LOCF and aLOCF approaches will be imputed by the last non-missing (including 90) post-baseline severity level. However, the percentage will be calculated based on the evaluable patients (excluding 90).
5.4.3. Analysis of Additional Efficacy Variables
5.4.3.1. Analyses of Continuous Additional Efficacy Variables Continuous additional efficacy variables will be analyzed similarly as primary efficacy variable in Section 5.4.1.1.
The same LOCF approach for missing measurements used for the primary efficacy variable will be applied to the continuous efficacy variables. For sensitivity analyses, OC, aOC, and aLOCF approaches mentioned in Section 5.4.1.2 will be used for the continuous efficacy variables.
5.4.3.2. Analyses of Categorical Additional Efficacy Variables Proportion of patients who gain ≥ 15 ETDRS letters and proportion of patients with no retinal and/or subretinal fluid will be analyzed similarly as categorical secondary efficacy variable in Section 5.4.2.2. Other categorical additional efficacy variables will be summarized descriptively.
Regeneron Pharmaceuticals, Inc. R910-3-DME-1518 Statistical Analysis Plan October 12, 2017
Page 22 of 40
The same LOCF approach for missing measurements used for the primary efficacy variable will be applied to the categorical efficacy variables. For sensitivity analyses, OC, aOC, and aLOCF approaches mentioned in Section 5.4.1.2 will be used.
5.4.3.3. Analyses of Time-to event Additional Efficacy Variables Event is defined as the first time patient has no retinal and/or subretinal fluid (“No” for both measurements of IRF and SRF) without taking additional treatment previously. Otherwise, patient is censored at the date of receiving additional treatment or the date of last available OCT measurements, whichever is earlier. The analysis will be based on observed case only using the Kaplan-Meier method.
5.4.4. Additional Analysis due to IVRS Dosing Error
A programming error that affected the dosing schedule was identified in the IRT system. Due to this IVRS system error, a majority of patients in group 1 (REGN910-3 3 mg:2 mg -low dose) were given 2Q4 dosing instead of the planned 2Q8 dosing after week 12. Some patients were given one extra dose at Week 20; some were given two extra doses at both Week 20 and Week 28. About half of patients in group 2b (REGN910-3 6 mg:2 mg -high dose 2Q12) were given an injection at Week 28 (8 weeks after the previous injection). Some patients had 1 dosing error at week 28 (active instead of Sham at week 28 and Active at week 32); some had two dosing errors (active at week 28 and Sham at week 32). The following analyses will be implemented to address the impact of the dosing error for primary and secondary efficacy variables.
Subgroup analysis: At Week 36, a subgroup analysis for patients with no dosing error will be performed in addition to original analysis at Week 36. However, this subgroup analysis will exclude group 1a since the majority of patients in group 1a had a dosing error.
Week 20 analysis: Primary and secondary efficacy variables will be analyzed at Week 20 prior to the introduction of the dosing error impacting group 1a (low dose). Week 20 analysis will only evaluate Q8 groups as Q12 groups are not synchronized with respect to time since last active dose.
Week 28 analysis: Primary and secondary efficacy variables will be analyzed at Week 28 prior to introduction of dosing error impacting group 2b (high dose Q12). Week 28 analysis will only evaluate Q12 groups as Q8 groups are not synchronized with respect to time since last active dose.
5.5. Analysis of Safety Data Safety data, such as AE, surgeries, and IOP through Week 36 will be summarized in the SAF and SAF Secondary Randomization populations using descriptive statistics. The analysis on the SAF will be performed according to the treatment assigned at baseline (as randomized). Week 36 analysis on the SAF Secondary Randomization population will be performed according to the treatment assigned (as randomized) at Week 12 for group 2 and 3 (high dose and IAI, respectively) or at baseline for group 1 (low dose). Other safety data, such as lab, vital signs and ECG will be summarized in the SAF Secondary Randomization population descriptively
Regeneron Pharmaceuticals, Inc. R910-3-DME-1518 Statistical Analysis Plan October 12, 2017
Page 23 of 40
according to the treatment assigned (as randomized) at Week 12 for group 2 and 3 (high dose and IAI, respectively) or at baseline for group 1 (low dose). For patients who are not re-randomized, their lab, vital signs and ECG data will be listed according to the treatment assigned at baseline.
5.5.1. Adverse Events AE summaries will be constructed displaying frequencies and proportions of patients reporting AEs within each SOC in decreasing order of total frequency according to the numbers of patients reporting the SOC and the AE within the SOC (not number of reports).
AEs will be classified as Pre-treatment AEs and TEAEs, and will further be summarized by the following categories:
Ocular AEs in the study eye
Ocular AEs in the fellow eye
Non-ocular AEs
Serious Adverse Events (SAEs), drug-related AEs, drug-related SAEs, and TEAEs leading to discontinuation will be summarized in the same way as described for TEAEs.
TEAEs in the study eye related to the injection procedure and those related to the study medication will be summarized separately.
The summaries of the number of patients with TEAEs through Week 36 will be given by treatment group:
The analysis on the SAF will be performed according to the treatment assigned at baseline (as randomized).
The analysis on the SAF Secondary Randomization population will be performed according to the treatment assigned (as randomized) at Week 12 for group 2 and 3 (high dose and IAI, respectively) or at baseline for group 1 (low dose).
An overall summary of the AE profile for REGN910-3/IAI through Week 36 will be provided.
A listing will be constructed that includes the patient identification, the treatment group, category of AE (ocular study/fellow eye, non-ocular), AE, MedDRA term, seriousness, severity, causality, elapsed time to onset, duration, and outcome.
Adjudicated APTC events, intraocular inflammation and hypertension will be tabulated and listed.
The detailed definitions of the preferred terms for intraocular inflammation and hypertension are presented in Appendix 10.3.
5.5.2. Surgeries
An overall summary of number of patients undergoing surgery as described in Section 4.5.2through Week 36 will be given by treatment group in the SAF and SAF Secondary Randomization populations.
Regeneron Pharmaceuticals, Inc. R910-3-DME-1518 Statistical Analysis Plan October 12, 2017
Page 24 of 40
5.5.3. Clinical Laboratory Baseline clinical laboratory analytic values and change from baseline to each scheduled assessment visit in clinical laboratory analytic values will be summarized with descriptive statistics for Week 36 analyses in the SAF Secondary Randomization population. Shift tables will also be provided for abnormalities. For patients who are not re-randomized, their data will be listed according to the treatment assigned at baseline.
Predefined lab abnormalities will be identified for selected clinical laboratory values according to the specified ranges (see Appendix 10.4). The frequency and percentage of patients with at least one predefined lab abnormalities during the treatment period will be displayed by treatment group for each analyte.
Lab values out of normal range will be flagged in lab value listings.
5.5.4. Vital Signs Vital signs will be summarized by baseline and change from baseline to each scheduled assessment time with descriptive statistics for Week 36 analyses in the SAF Secondary Randomization population. For patients who are not re-randomized, their data will be listed according to the treatment assigned at baseline.
5.5.5. Ocular Safety Measures Frequency tables will be provided on the variables listed in Section 4.5.4 by treatment groups and visits for Week 36 analyses in the SAF and SAF Secondary Randomization population. For patients who are not re-randomized, their data will be listed according to the treatment assigned at baseline.
Baseline IOP and change from Baseline in IOP to each scheduled assessment visit will be summarized with descriptive statistics for study eye and fellow eye.
5.5.6. Electrocardiogram All ECG variables as described in Section 4.5.5 will be analyzed by appropriate descriptive methods for Week 36 analyses in the SAF Secondary Randomization population. For patients who are not re-randomized, their data will be listed according to the treatment assigned at baseline. Change from baseline or frequency tables, and/or cross tabulation of baseline vs. post-baseline status for categorical variables (overall interpretation of ECG normal/abnormal, and clinical relevant abnormalities no/yes) by visit and treatment group will be included.
5.5.7. Analysis of Drug Concentration Data The concentrations of REGN910 in serum and concentrations of free aflibercept and adjusted bound aflibercept in plasma will be analyzed to include descriptive statistics at each sampling time.
5.5.8. Immunogenicity The following summaries will be performed based on ADA analysis set for Week 36 analysis:
Listing of ADA results (negative or titer value for positive ADA) by patient, visit and cohort
Regeneron Pharmaceuticals, Inc. R910-3-DME-1518 Statistical Analysis Plan October 12, 2017
Page 25 of 40
Incidence of pre-existing immunoreactivity, treatment-emergent, and treatment-boosted ADA assay responses assessed as absolute occurrence (N) and percent of patients (%), grouped by cohort
Potential impact of treatment-emergent or treatment-boosted ADA assay response on safety or efficacy may be evaluated
6. DATA CONVENTIONS The following analysis conventions will be used in the statistical analysis.
6.1. Definition of Baseline Unless otherwise specified, the Baseline assessment for all measurements will be the last available valid measurement taken prior to the first administration of investigational product.
For efficacy analysis after Week 12, the Baseline is defined as the measurement at Week 12.
6.2. Handling of Missing Data When appropriate, the following rules will be implemented so as not to exclude patients from statistical analyses due to missing or incomplete data:
Efficacy Variables
Rules for handling missing data for primary, secondary, and additional efficacy variables are described in the efficacy analysis section (see Section 5.4).
AE variables
For some AEs it is important to determine whether the AE started before or after the first REGN910-3/IAI injection. If the AE start date is partially missing, it will be imputed by the latest possible date (considering other available data, e.g., stop date) to be conservative.
Prior/concomitant medication
For the tabulation of prior and concomitant medication, partially missing start dates of the medication will be imputed by the earliest possible time point, partially missing stop dates will be imputed by the latest possible time point.
Medication coding
Medications whose ATC level 4 (5-digit class) cannot be coded will be summarized by setting ATC4 (5-digit class)=ATC2 (3-digit class) in the table programs. However, these uncoded ATC level 4 records still need to be confirmed with study Data Manager and study Medical Director.
6.3. Unscheduled Assessments Assessments taken outside of protocol allowable windows will be displayed according to the case report form (CRF) assessment recorded by the investigator.
Unscheduled and extra assessments (laboratory data or vital signs associated with non-protocol clinical visits, or obtained in the course of investigating or managing AEs) will be included in
Regeneron Pharmaceuticals, Inc. R910-3-DME-1518 Statistical Analysis Plan October 12, 2017
Page 26 of 40
listings but not summaries, with the exception of IOP measurements. If more than 1 laboratory value is available for a given visit, the first observation will be used in summaries and all observations will be presented in listings.
Early termination visit (ET): For efficacy assessments, the ET visit will be re-slotted to the next visit after the last scheduled visit if ET visit was performed 4 weeks (+/- 1 week) after the last scheduled visit. ET visits outside the window will be treated as unscheduled assessments, that is, will not be used for analyses and will only be shown in the patient listings.
7. INTERIM ANALYSIS No interim analysis is planned in this study.
8. SOFTWARE All analyses will be done using SAS Version 9.2 or later.
9. REFERENCES ICH. (1998, February 5). ICH Harmonized tripartite guideline: Statistical principles for clinical trials (E9). International Conference on Harmonization of Technical Requirements for Registration of Pharmaceuticals for Human Use.
Moser BK, Stevens GR, Watts CL. The two-sample t-test versus Satterthwaite’s approximate f test. Communications in Statistics – Theory and Methods 1989;18(11);3:963-3975.
Regeneron Pharmaceuticals, Inc. R910-3-DME-1518 Statistical Analysis Plan October 12, 2017
Page 29 of 40
6. Indirect ophthalmoscopy should be performed at all study visits (bilateral). On days when study drug is administered, it should be performed pre-dose (bilateral) and immediately after administration of study drug (study eye only).
7. Vital signs (body temperature, blood pressure, and heart rate) should be measured after the patient has been sitting for 5 minutes. 8. If a patient withdraws from the study, ongoing AEs should be followed to the end of study visit or until the patient withdraws consent. 9. All samples collected for laboratory assessments should be obtained prior to administration of study drug. 10. For women of childbearing potential, a negative serum pregnancy test at screening is required for eligibility. All women of childbearing potential will have
a urine pregnancy test at each treatment visit starting at visit 2 (day 1). A negative urine pregnancy test is required before treatment is administered. 11. PK samples (serum for REGN910 and plasma for aflibercept) should be drawn pre-dose on all visits through week 32. All ADA serum samples should be
collected prior to administration of study drug. 12. The genomic sub-study ICF should be presented to patients at the screening visit and may be signed at any subsequent visit at which the patient chooses to
participate after screening. The genomic DNA sample should only be collected on day1/baseline (pre-dose) or at any study visit from patients who have signed the sub-study ICF.
Regeneron Pharmaceuticals, Inc. R910-3-DME-1518 Statistical Analysis Plan October 12, 2017
Page 30 of 40
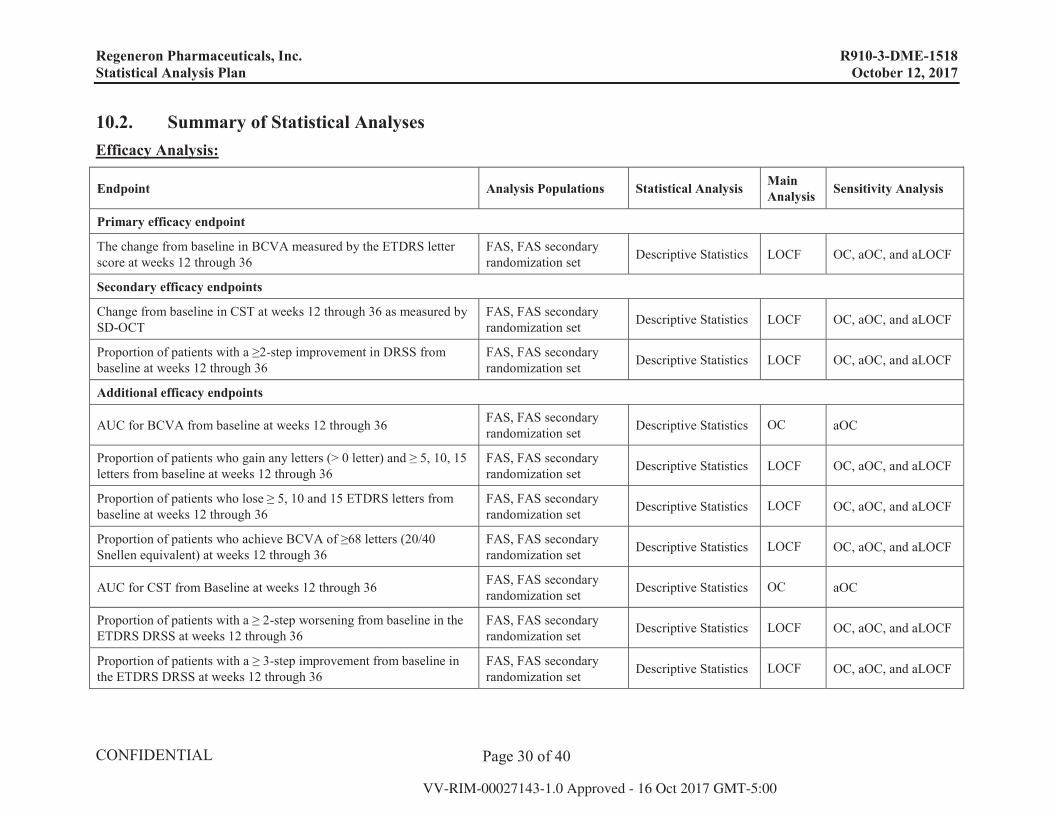
10.2. Summary of Statistical Analyses Efficacy Analysis:
Endpoint Analysis Populations Statistical Analysis MainAnalysis Sensitivity Analysis
Primary efficacy endpoint
The change from baseline in BCVA measured by the ETDRS letter score at weeks 12 through 36
FAS, FAS secondary randomization set Descriptive Statistics LOCF OC, aOC, and aLOCF
Secondary efficacy endpoints
Change from baseline in CST at weeks 12 through 36 as measured by SD-OCT
FAS, FAS secondary randomization set Descriptive Statistics LOCF OC, aOC, and aLOCF
Proportion of patients with a ≥2-step improvement in DRSS from baseline at weeks 12 through 36
FAS, FAS secondary randomization set Descriptive Statistics LOCF OC, aOC, and aLOCF
Additional efficacy endpoints
AUC for BCVA from baseline at weeks 12 through 36 FAS, FAS secondary randomization set Descriptive Statistics OC aOC
Proportion of patients who gain any letters (> 0 letter) and ≥ 5, 10, 15 letters from baseline at weeks 12 through 36
FAS, FAS secondary randomization set Descriptive Statistics LOCF OC, aOC, and aLOCF
Proportion of patients who lose ≥ 5, 10 and 15 ETDRS letters from baseline at weeks 12 through 36
FAS, FAS secondary randomization set Descriptive Statistics LOCF OC, aOC, and aLOCF
Proportion of patients who achieve BCVA of ≥68 letters (20/40 Snellen equivalent) at weeks 12 through 36
FAS, FAS secondary randomization set Descriptive Statistics LOCF OC, aOC, and aLOCF
AUC for CST from Baseline at weeks 12 through 36 FAS, FAS secondaryrandomization set Descriptive Statistics OC aOC
Proportion of patients with a ≥ 2-step worsening from baseline in the ETDRS DRSS at weeks 12 through 36
FAS, FAS secondary randomization set Descriptive Statistics LOCF OC, aOC, and aLOCF
Proportion of patients with a ≥ 3-step improvement from baseline in the ETDRS DRSS at weeks 12 through 36
FAS, FAS secondary randomization set Descriptive Statistics LOCF OC, aOC, and aLOCF
Regeneron Pharmaceuticals, Inc. R910-3-DME-1518 Statistical Analysis Plan October 12, 2017
Page 31 of 40
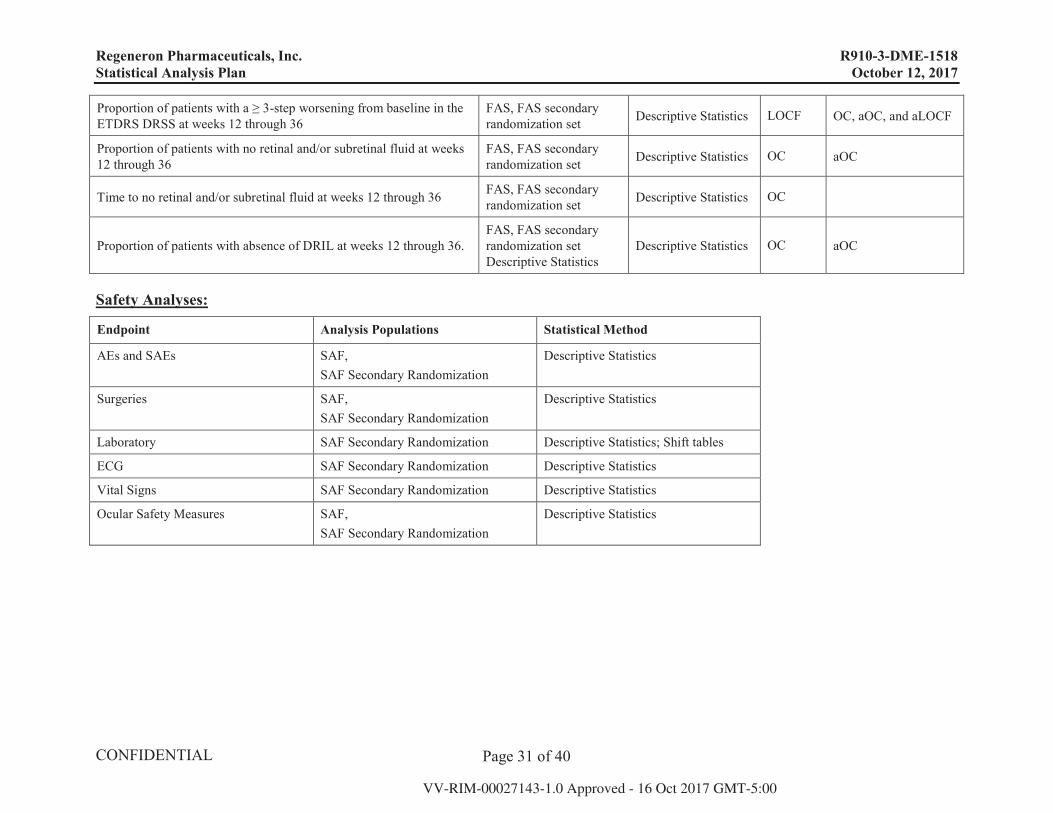
Proportion of patients with a ≥ 3-step worsening from baseline in the ETDRS DRSS at weeks 12 through 36
FAS, FAS secondary randomization set Descriptive Statistics LOCF OC, aOC, and aLOCF
Proportion of patients with no retinal and/or subretinal fluid at weeks 12 through 36
FAS, FAS secondary randomization set Descriptive Statistics OC aOC
Time to no retinal and/or subretinal fluid at weeks 12 through 36 FAS, FAS secondary randomization set Descriptive Statistics OC
Proportion of patients with absence of DRIL at weeks 12 through 36.FAS, FAS secondary randomization set Descriptive Statistics
Descriptive Statistics OC aOC
Safety Analyses:
Endpoint Analysis Populations Statistical Method
AEs and SAEs SAF,SAF Secondary Randomization
Descriptive Statistics
Surgeries SAF,SAF Secondary Randomization
Descriptive Statistics
Laboratory SAF Secondary Randomization Descriptive Statistics; Shift tables
ECG SAF Secondary Randomization Descriptive Statistics
Vital Signs SAF Secondary Randomization Descriptive Statistics
Ocular Safety Measures SAF,SAF Secondary Randomization
Descriptive Statistics
Regeneron Pharmaceuticals, Inc. R910-3-DME-1518 Statistical Analysis Plan October 12, 2017
Page 32 of 40
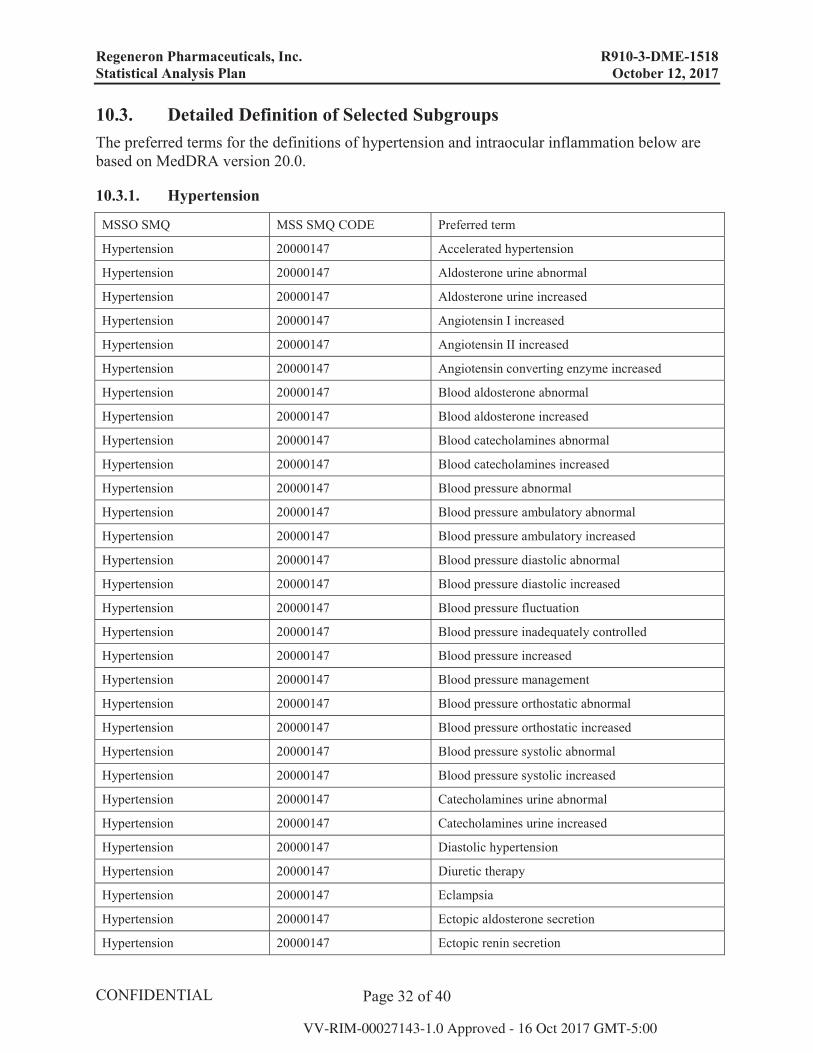
10.3. Detailed Definition of Selected Subgroups The preferred terms for the definitions of hypertension and intraocular inflammation below are based on MedDRA version 20.0.
10.3.1. Hypertension
MSSO SMQ MSS SMQ CODE Preferred term
Hypertension 20000147 Accelerated hypertension
Hypertension 20000147 Aldosterone urine abnormal
Hypertension 20000147 Aldosterone urine increased
Hypertension 20000147 Angiotensin I increased
Hypertension 20000147 Angiotensin II increased
Hypertension 20000147 Angiotensin converting enzyme increased
Hypertension 20000147 Blood aldosterone abnormal
Hypertension 20000147 Blood aldosterone increased
Hypertension 20000147 Blood catecholamines abnormal
Hypertension 20000147 Blood catecholamines increased
Hypertension 20000147 Blood pressure abnormal
Hypertension 20000147 Blood pressure ambulatory abnormal
Hypertension 20000147 Blood pressure ambulatory increased
Hypertension 20000147 Blood pressure diastolic abnormal
Hypertension 20000147 Blood pressure diastolic increased
Hypertension 20000147 Blood pressure fluctuation
Hypertension 20000147 Blood pressure inadequately controlled
Hypertension 20000147 Blood pressure increased
Hypertension 20000147 Blood pressure management
Hypertension 20000147 Blood pressure orthostatic abnormal
Hypertension 20000147 Blood pressure orthostatic increased
Hypertension 20000147 Blood pressure systolic abnormal
Hypertension 20000147 Blood pressure systolic increased
Hypertension 20000147 Catecholamines urine abnormal
Hypertension 20000147 Catecholamines urine increased
Hypertension 20000147 Diastolic hypertension
Hypertension 20000147 Diuretic therapy
Hypertension 20000147 Eclampsia
Hypertension 20000147 Ectopic aldosterone secretion
Hypertension 20000147 Ectopic renin secretion
Regeneron Pharmaceuticals, Inc. R910-3-DME-1518 Statistical Analysis Plan October 12, 2017
Page 33 of 40
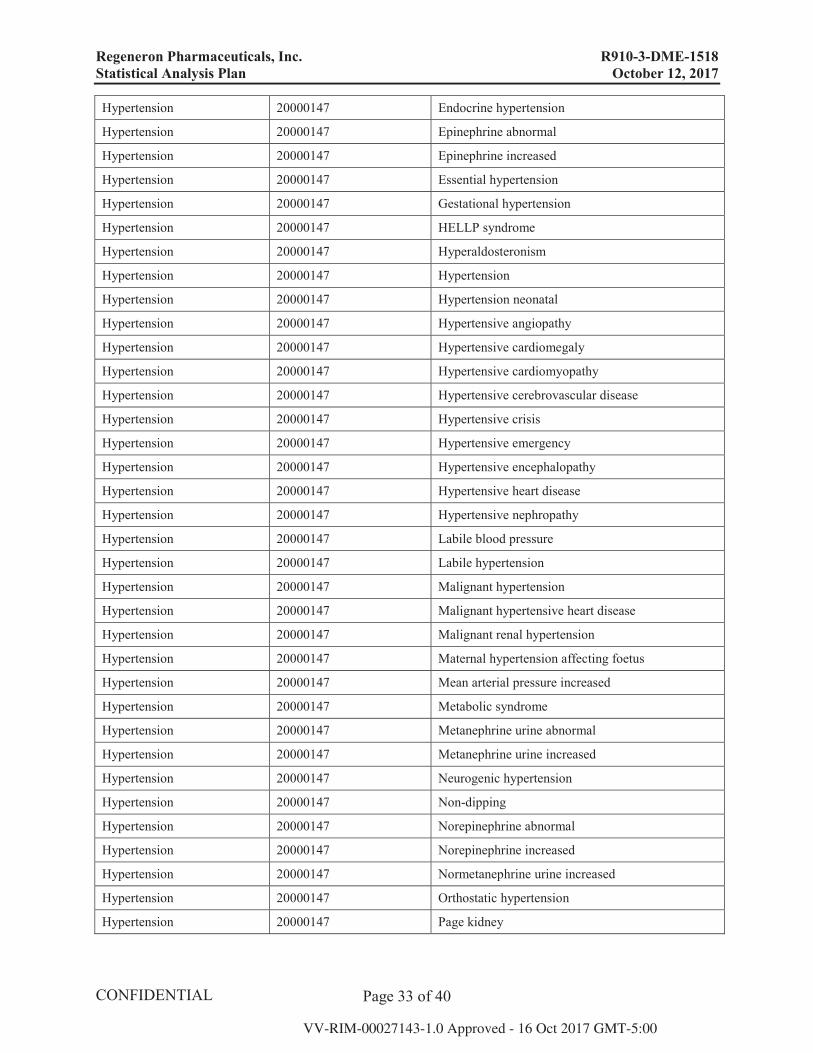
Hypertension 20000147 Endocrine hypertension
Hypertension 20000147 Epinephrine abnormal
Hypertension 20000147 Epinephrine increased
Hypertension 20000147 Essential hypertension
Hypertension 20000147 Gestational hypertension
Hypertension 20000147 HELLP syndrome
Hypertension 20000147 Hyperaldosteronism
Hypertension 20000147 Hypertension
Hypertension 20000147 Hypertension neonatal
Hypertension 20000147 Hypertensive angiopathy
Hypertension 20000147 Hypertensive cardiomegaly
Hypertension 20000147 Hypertensive cardiomyopathy
Hypertension 20000147 Hypertensive cerebrovascular disease
Hypertension 20000147 Hypertensive crisis
Hypertension 20000147 Hypertensive emergency
Hypertension 20000147 Hypertensive encephalopathy
Hypertension 20000147 Hypertensive heart disease
Hypertension 20000147 Hypertensive nephropathy
Hypertension 20000147 Labile blood pressure
Hypertension 20000147 Labile hypertension
Hypertension 20000147 Malignant hypertension
Hypertension 20000147 Malignant hypertensive heart disease
Hypertension 20000147 Malignant renal hypertension
Hypertension 20000147 Maternal hypertension affecting foetus
Hypertension 20000147 Mean arterial pressure increased
Hypertension 20000147 Metabolic syndrome
Hypertension 20000147 Metanephrine urine abnormal
Hypertension 20000147 Metanephrine urine increased
Hypertension 20000147 Neurogenic hypertension
Hypertension 20000147 Non-dipping
Hypertension 20000147 Norepinephrine abnormal
Hypertension 20000147 Norepinephrine increased
Hypertension 20000147 Normetanephrine urine increased
Hypertension 20000147 Orthostatic hypertension
Hypertension 20000147 Page kidney
Regeneron Pharmaceuticals, Inc. R910-3-DME-1518 Statistical Analysis Plan October 12, 2017
Page 34 of 40
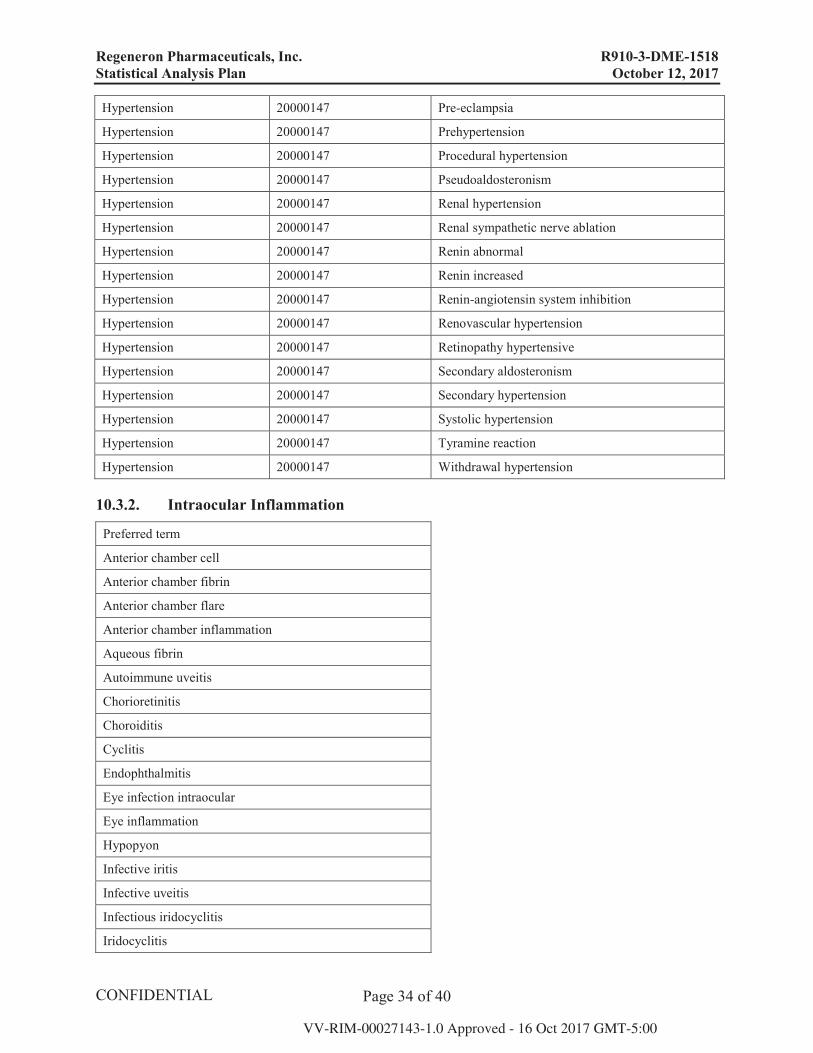
Hypertension 20000147 Pre-eclampsia
Hypertension 20000147 Prehypertension
Hypertension 20000147 Procedural hypertension
Hypertension 20000147 Pseudoaldosteronism
Hypertension 20000147 Renal hypertension
Hypertension 20000147 Renal sympathetic nerve ablation
Hypertension 20000147 Renin abnormal
Hypertension 20000147 Renin increased
Hypertension 20000147 Renin-angiotensin system inhibition
Hypertension 20000147 Renovascular hypertension
Hypertension 20000147 Retinopathy hypertensive
Hypertension 20000147 Secondary aldosteronism
Hypertension 20000147 Secondary hypertension
Hypertension 20000147 Systolic hypertension
Hypertension 20000147 Tyramine reaction
Hypertension 20000147 Withdrawal hypertension
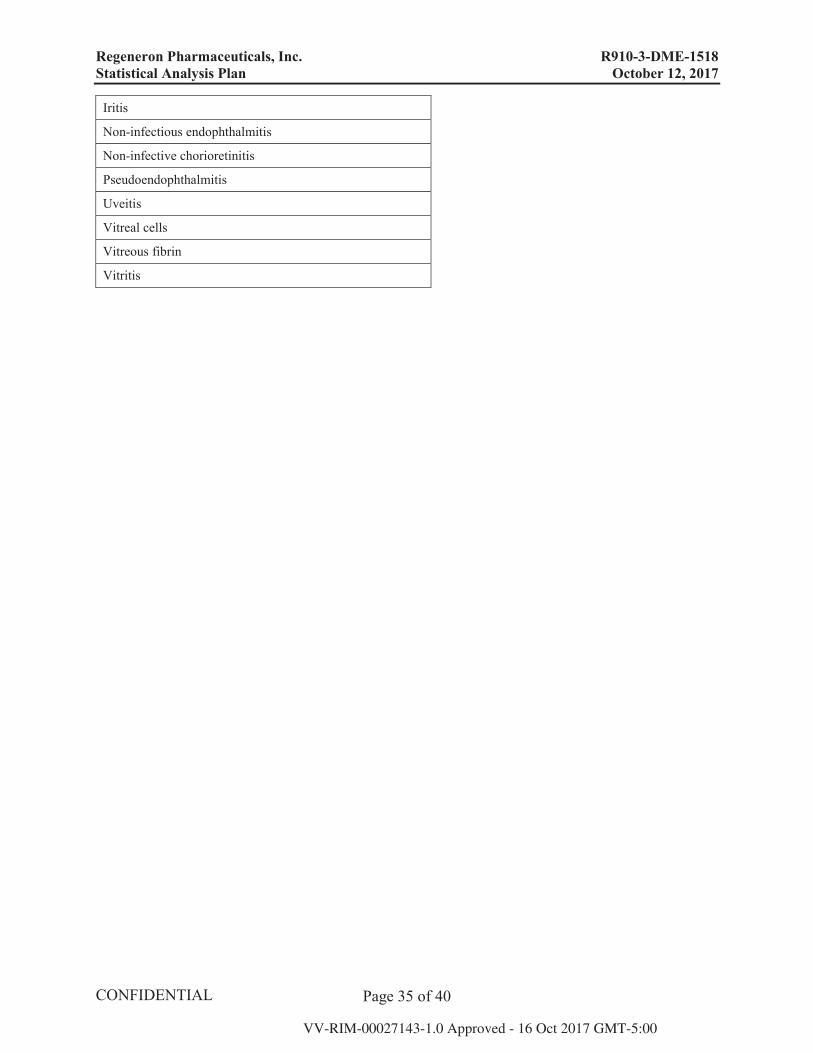
10.3.2. Intraocular Inflammation
Preferred term
Anterior chamber cell
Anterior chamber fibrin
Anterior chamber flare
Anterior chamber inflammation
Aqueous fibrin
Autoimmune uveitis
Chorioretinitis
Choroiditis
Cyclitis
Endophthalmitis
Eye infection intraocular
Eye inflammation
Hypopyon
Infective iritis
Infective uveitis
Infectious iridocyclitis
Iridocyclitis
Regeneron Pharmaceuticals, Inc. R910-3-DME-1518 Statistical Analysis Plan October 12, 2017
Page 35 of 40
Iritis
Non-infectious endophthalmitis
Non-infective chorioretinitis
Pseudoendophthalmitis
Uveitis
Vitreal cells
Vitreous fibrin
Vitritis
Regeneron Pharmaceuticals, Inc. R910-3-DME-1518 Statistical Analysis Plan October 12, 2017
Page 36 of 40
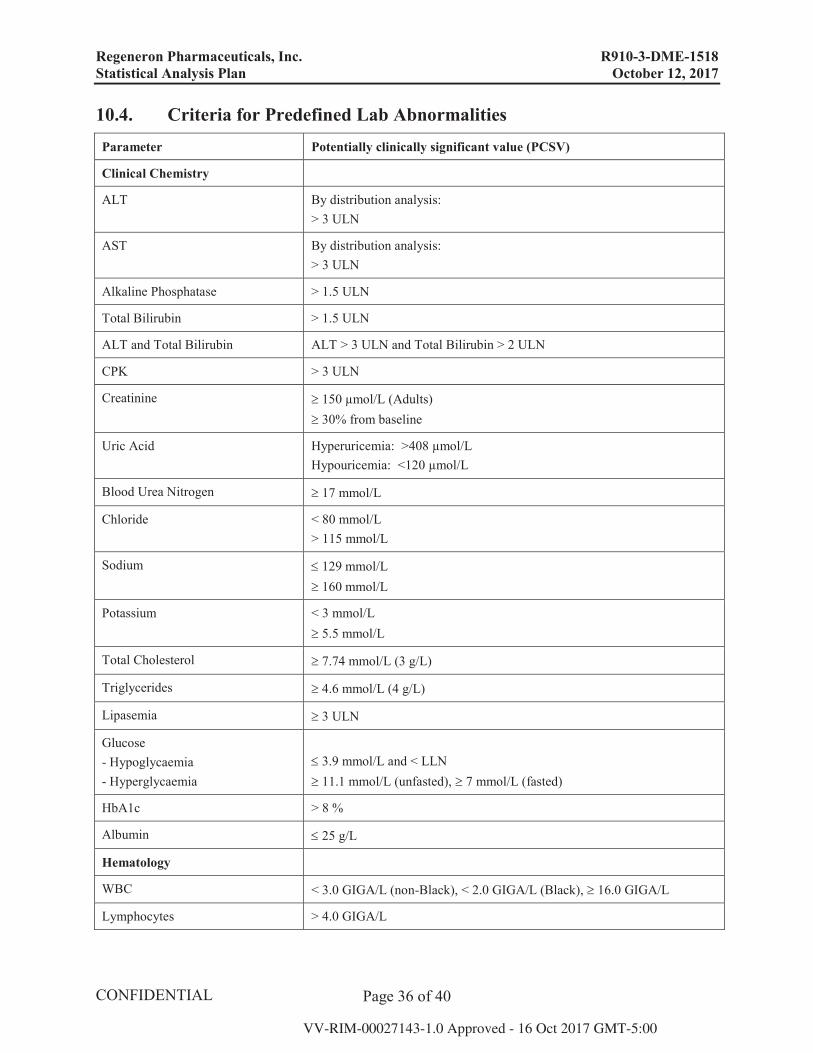
10.4. Criteria for Predefined Lab Abnormalities Parameter Potentially clinically significant value (PCSV)
Clinical Chemistry
ALT By distribution analysis:> 3 ULN
AST By distribution analysis:> 3 ULN
Alkaline Phosphatase > 1.5 ULN
Total Bilirubin > 1.5 ULN
ALT and Total Bilirubin ALT > 3 ULN and Total Bilirubin > 2 ULN
CPK > 3 ULN
Creatinine 150 μmol/L (Adults)30% from baseline
Uric Acid Hyperuricemia: >408 μmol/LHypouricemia: <120 μmol/L
Blood Urea Nitrogen 17 mmol/L
Chloride < 80 mmol/L> 115 mmol/L
Sodium 129 mmol/L160 mmol/L
Potassium < 3 mmol/L5.5 mmol/L
Total Cholesterol 7.74 mmol/L (3 g/L)
Triglycerides 4.6 mmol/L (4 g/L)
Lipasemia 3 ULN
Glucose- Hypoglycaemia- Hyperglycaemia
3.9 mmol/L and < LLN11.1 mmol/L (unfasted), 7 mmol/L (fasted)
HbA1c > 8 %
Albumin 25 g/L
Hematology
WBC < 3.0 GIGA/L (non-Black), < 2.0 GIGA/L (Black), 16.0 GIGA/L
Lymphocytes > 4.0 GIGA/L
Regeneron Pharmaceuticals, Inc. R910-3-DME-1518 Statistical Analysis Plan October 12, 2017
Page 37 of 40
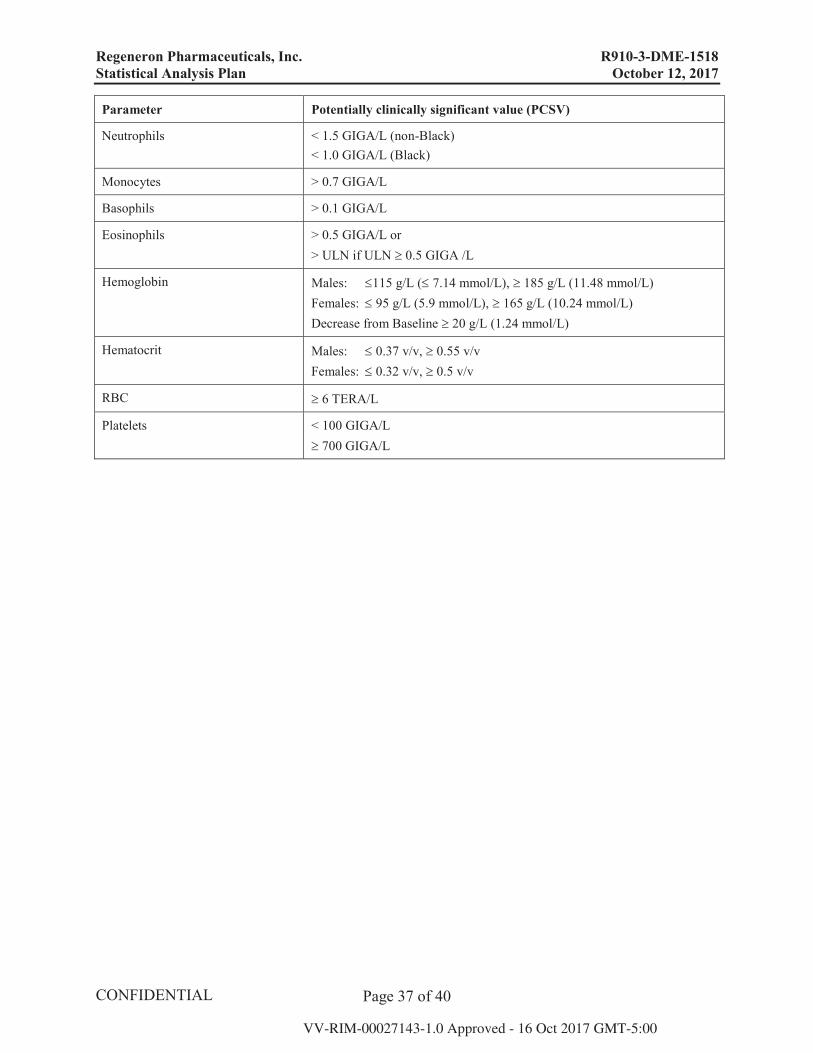
Parameter Potentially clinically significant value (PCSV)
Neutrophils < 1.5 GIGA/L (non-Black)< 1.0 GIGA/L (Black)
Monocytes > 0.7 GIGA/L
Basophils > 0.1 GIGA/L
Eosinophils > 0.5 GIGA/L or> ULN if ULN 0.5 GIGA /L
Hemoglobin Males: 115 g/L ( 7.14 mmol/L), 185 g/L (11.48 mmol/L)Females: 95 g/L (5.9 mmol/L), 165 g/L (10.24 mmol/L)Decrease from Baseline 20 g/L (1.24 mmol/L)
Hematocrit Males: 0.37 v/v, 0.55 v/vFemales: 0.32 v/v, 0.5 v/v
RBC 6 TERA/L
Platelets < 100 GIGA/L700 GIGA/L
Regeneron Pharmaceuticals, Inc. R910-3-DME-1518 Statistical Analysis Plan October 12, 2017
Page 38 of 40
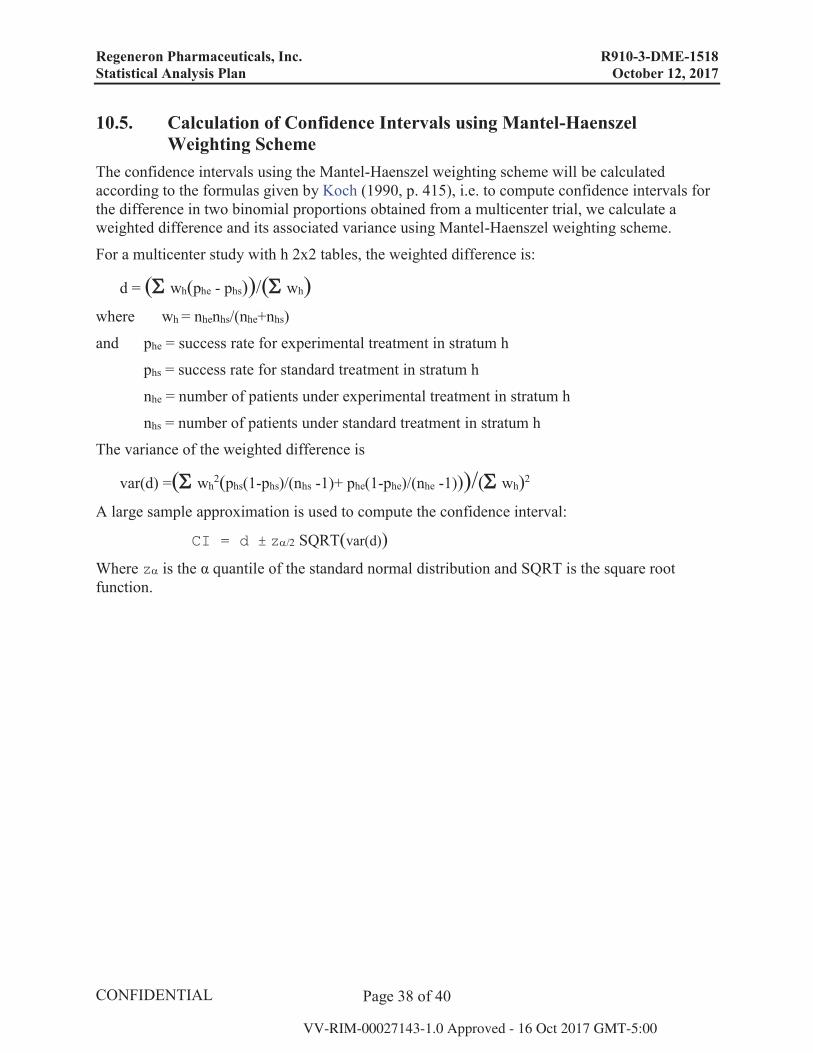
10.5. Calculation of Confidence Intervals using Mantel-Haenszel Weighting Scheme
The confidence intervals using the Mantel-Haenszel weighting scheme will be calculated according to the formulas given by Koch (1990, p. 415), i.e. to compute confidence intervals for the difference in two binomial proportions obtained from a multicenter trial, we calculate a weighted difference and its associated variance using Mantel-Haenszel weighting scheme.
For a multicenter study with h 2x2 tables, the weighted difference is:
d = ( wh(phe - phs))/( wh) where wh = nhenhs/(nhe+nhs)
and phe = success rate for experimental treatment in stratum h
phs = success rate for standard treatment in stratum h
nhe = number of patients under experimental treatment in stratum h
nhs = number of patients under standard treatment in stratum h
The variance of the weighted difference is
var(d) =( wh2(phs(1-phs)/(nhs -1)+ phe(1-phe)/(nhe -1)))/( wh)2
A large sample approximation is used to compute the confidence interval:
CI = d ± z SQRT(var(d))Where z is the α quantile of the standard normal distribution and SQRT is the square root function.
Regeneron Pharmaceuticals, Inc. R910-3-DME-1518 Statistical Analysis Plan October 12, 2017
Page 39 of 40
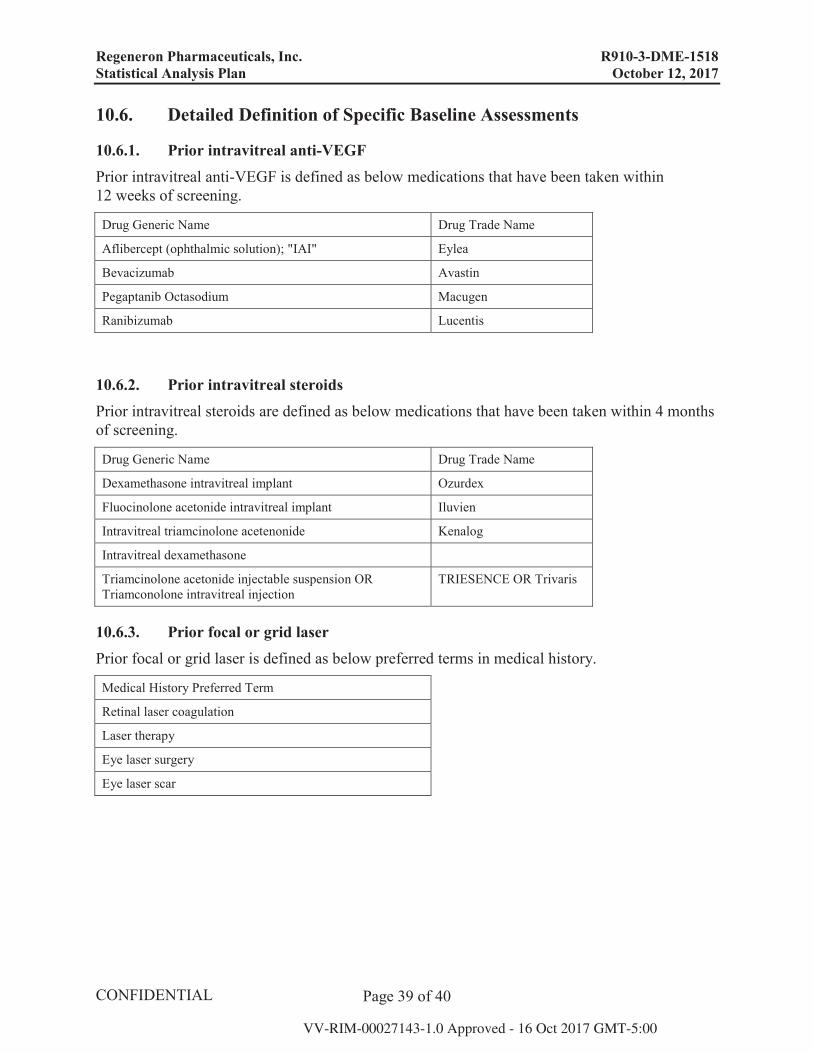
10.6. Detailed Definition of Specific Baseline Assessments
10.6.1. Prior intravitreal anti-VEGF Prior intravitreal anti-VEGF is defined as below medications that have been taken within 12 weeks of screening.
Drug Generic Name Drug Trade Name
Aflibercept (ophthalmic solution); "IAI" Eylea
Bevacizumab Avastin
Pegaptanib Octasodium Macugen
Ranibizumab Lucentis
10.6.2. Prior intravitreal steroids Prior intravitreal steroids are defined as below medications that have been taken within 4 months of screening.
Drug Generic Name Drug Trade Name
Dexamethasone intravitreal implant Ozurdex
Fluocinolone acetonide intravitreal implant Iluvien
Intravitreal triamcinolone acetenonide Kenalog
Intravitreal dexamethasone
Triamcinolone acetonide injectable suspension OR Triamconolone intravitreal injection
TRIESENCE OR Trivaris
10.6.3. Prior focal or grid laser Prior focal or grid laser is defined as below preferred terms in medical history.
Medical History Preferred Term
Retinal laser coagulation
Laser therapy
Eye laser surgery
Eye laser scar
Regeneron Pharmaceuticals, Inc. R910-3-DME-1518 Statistical Analysis Plan October 12, 2017
Page 40 of 40
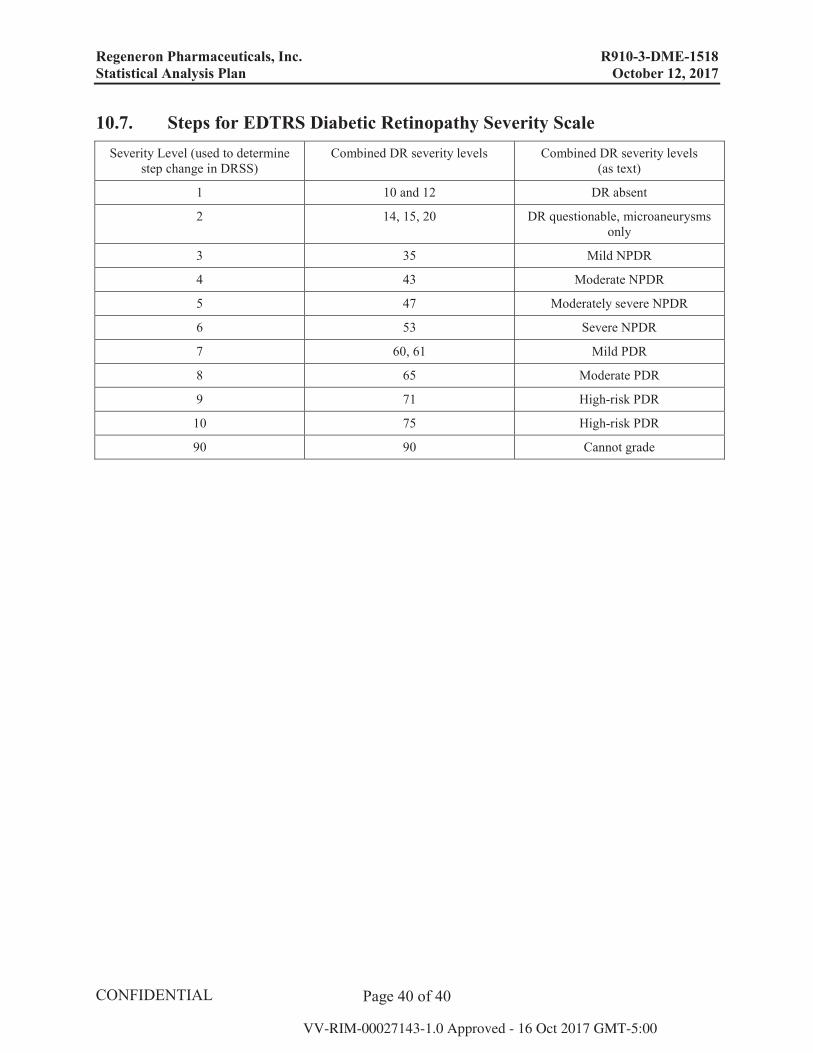
10.7. Steps for EDTRS Diabetic Retinopathy Severity Scale Severity Level (used to determine
step change in DRSS)Combined DR severity levels Combined DR severity levels
(as text)
1 10 and 12 DR absent
2 14, 15, 20 DR questionable, microaneurysms only
3 35 Mild NPDR
4 43 Moderate NPDR
5 47 Moderately severe NPDR
6 53 Severe NPDR
7 60, 61 Mild PDR
8 65 Moderate PDR
9 71 High-risk PDR
10 75 High-risk PDR
90 90 Cannot grade