Statistic for Management
20
Descriptive Statistics Mean Median Variance Standard Deviation Skewness Coefficient of Correlation Simple Regression University of Colombo Institute of Human Recourse Advancement Individual Assignment 1
-
Upload
madhusha-weerasekara -
Category
Education
-
view
90 -
download
0
Transcript of Statistic for Management
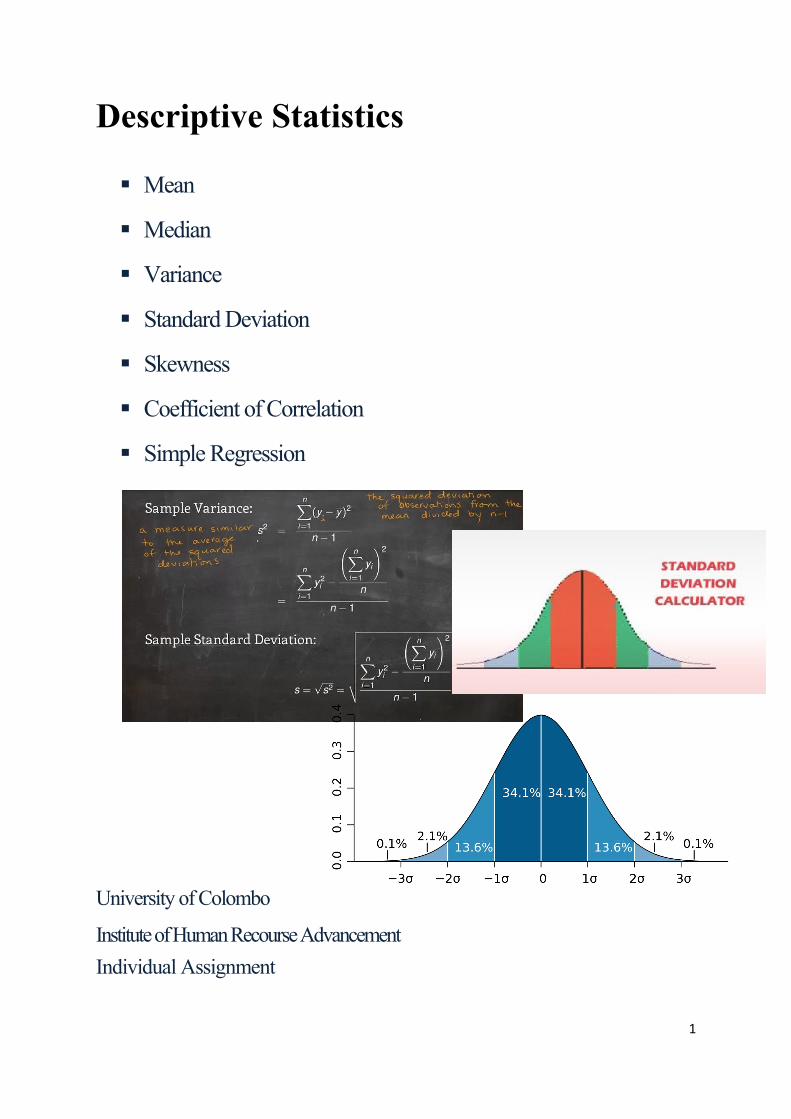
Descriptive Statistics
Mean
Median
Variance
Standard Deviation
Skewness
Coefficient of Correlation
Simple Regression
University of Colombo
Institute of Human Recourse Advancement
Individual Assignment
1
ABSTRACT
The assignment would be a cushion to learn about the descriptive statistics of mean, median,
variance, standard deviation, skewness, coefficient of correlation and simple regression
model.
I selected a reputed manufacturing company which is one of the fastest growing and largest
conglomerates in Sri Lanka that manufactures and markets many leading brands in biscuits,
confectionery, cereal, organic fruit products and many other categories globally.
“CBL” Ceylon Biscuits Limited, most of people known as “Munchee” which is the largest
confectionery, cereal, organic fruit products, etc company in Sri Lanka. CBL’s export quality
food products have been marketed around the world more than 55 countries through a solid
network of international partners.
INTRODUCTION
Ceylon Biscuits Limited (CBL) is one of the fastest growing and largest FMCG
conglomerates in Sri Lanka that manufactures and markets many leading brands in biscuits,
confectionery, cereal, organic fruit products and many other categories globally.
Vision
“Our vision of becoming the No.1 biscuit, chocolate and confectionary manufacturer and
marketer in Asia, while developing a global presence and recognition.”
2
Story Line – In retrospect
Company Name - William’s Biscuit factory
Company Scale - Small scale handmade biscuit venture
Chairman - Mr. Williams
Acquired company - Mr. Simon Arthur Wickramasingha (1939)
Company Name - Williams Confectionery
Employees - 10 Nos.
In 1960 - The Joint Venture with the Sri Lankan Government and CARE
of USA for national welfare
Purpose - Improve the nutritional standard of Sri Lankan children
Factory - Was built in Pannipitiya (1968), Eight acres
Chairman - Mr. Mineka Wickramasingha
In 1980 - CBL expanded to international market by venturing India,
Established CBL Foods
In 2015 - Market leader in all CBL Brands
Company Portfolio
3
1. CBL Foods International (Pvt) Ltd
Manufacture - Chocolates, cakes, biscuits, wafers and jelly
Company squire feet - 200,000
2. CBL Natural Foods (Pvt) Ltd
An export oriented company
Manufacture - Natural & certified organic fruit products, cashew nuts and coconut products.
3. Convenience Foods (Lanka) PLC
A largest - Textured soya company
Manufacture - Textured soya nuggets, jelly crystals, instant soup mixes and snacks.
4. Plenty Foods (Pvt) Limited
Manufacturers of Sri Lanka’s most consumed cereal product and herbal porridges made from
100% locally sourced raw material.
5. CBL Exports (Pvt) Ltd
A state-of-the-art manufacturing facility, this company was established at Seethawaka.
Export Processing Zone with the aim of catering to the ever growing global market.
6. CBL Bangladesh (Pvt) Ltd
Ceylon Biscuits Bangladesh (Pvt) Ltd, a wholly owned enterprise of Ceylon Biscuits Limited
was inaugurated in 2014. This is the first Sri Lankan owned confectionery Company in
Bangladesh producing quality Biscuits, Wafers and Chocolate coated biscuits for the large
consumer base of the country.
7. Retail Alliance Limited
4
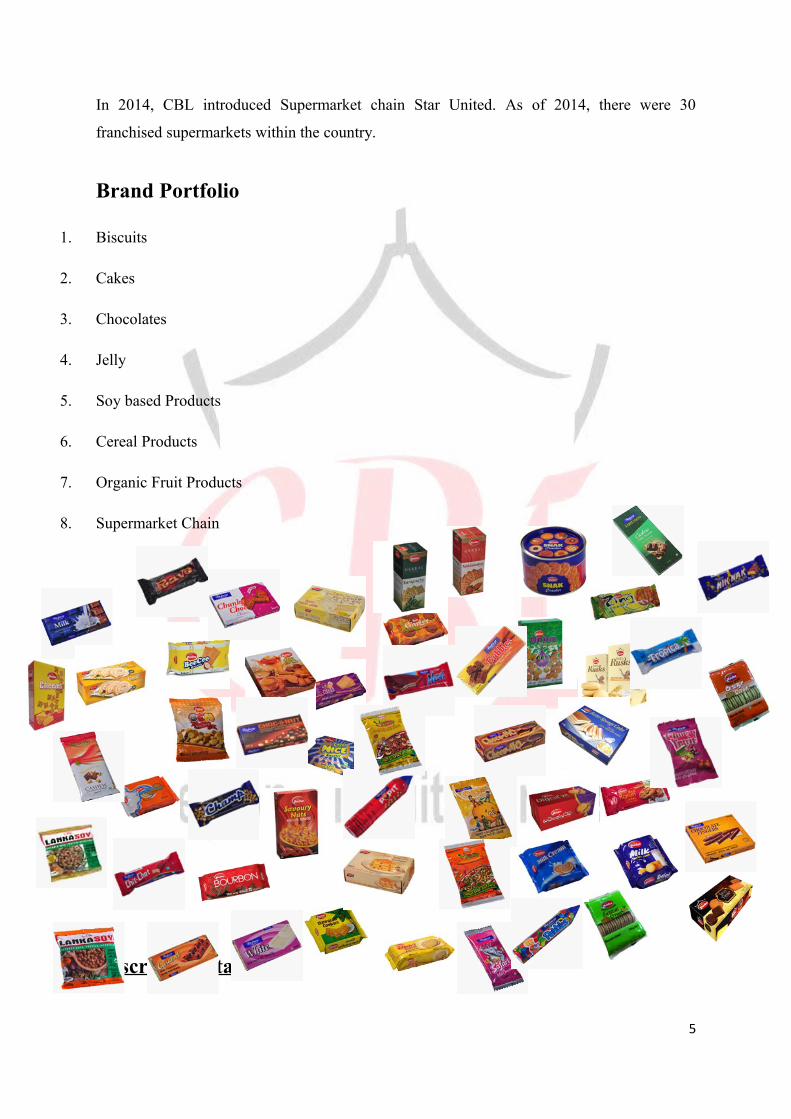
In 2014, CBL introduced Supermarket chain Star United. As of 2014, there were 30
franchised supermarkets within the country.
Brand Portfolio
1. Biscuits
2. Cakes
3. Chocolates
4. Jelly
5. Soy based Products
6. Cereal Products
7. Organic Fruit Products
8. Supermarket Chain
Descriptive Statistics
5
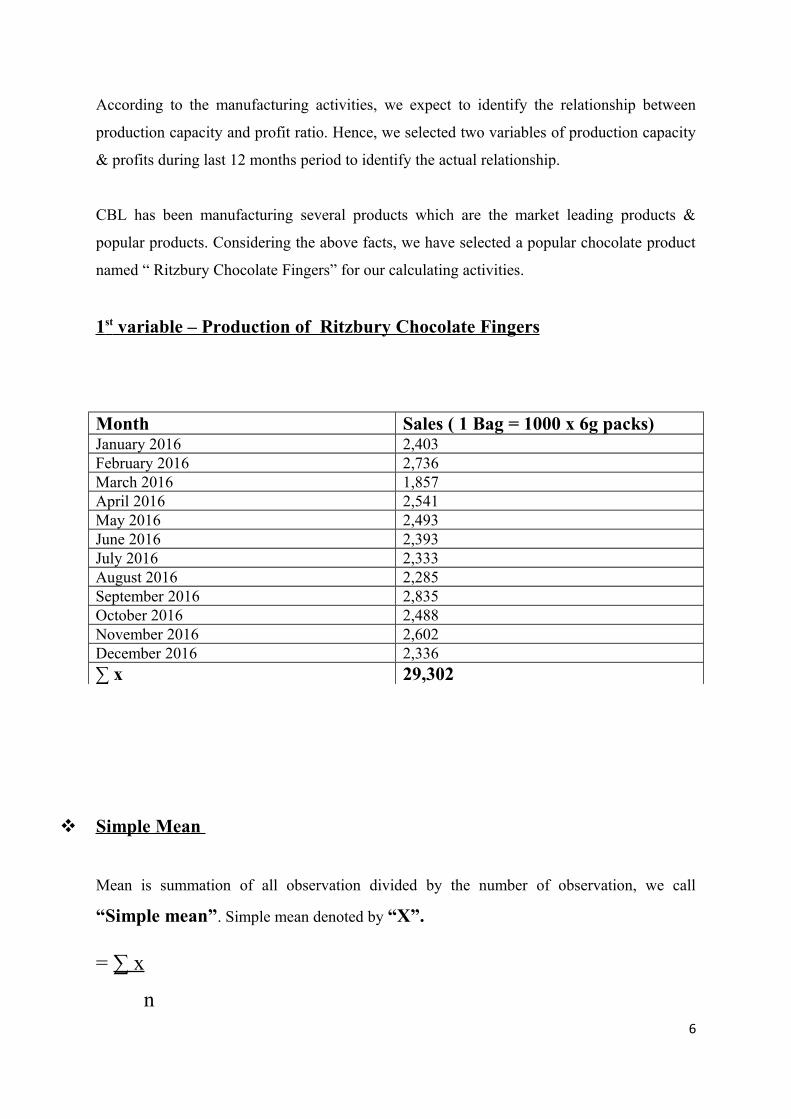
According to the manufacturing activities, we expect to identify the relationship between
production capacity and profit ratio. Hence, we selected two variables of production capacity
& profits during last 12 months period to identify the actual relationship.
CBL has been manufacturing several products which are the market leading products &
popular products. Considering the above facts, we have selected a popular chocolate product
named “ Ritzbury Chocolate Fingers” for our calculating activities.
1 st variable – Production of Ritzbury Chocolate Fingers
Month Sales ( 1 Bag = 1000 x 6g packs)January 2016 2,403February 2016 2,736March 2016 1,857April 2016 2,541May 2016 2,493June 2016 2,393July 2016 2,333August 2016 2,285September 2016 2,835October 2016 2,488November 2016 2,602December 2016 2,336∑ x 29,302
Simple Mean
Mean is summation of all observation divided by the number of observation, we call
“Simple mean”. Simple mean denoted by “X”.
= ∑ x
n 6
X = Simple Mean
∑X = Summation of all Observation
n = Number of observation
Then according to the above formulation, we can calculate simple mean (X) as below,
∑ x = 29,302
n = 12
29,302
12
2,441.83
Hence, simple mean value (X) is 2,441.83.
Median
Median is a middle point of the number observation after the arrange Ascending or
Descending order.
7
According to above our set of observations, we can calculate the median after arranging the
same in ascending order.
1875, 2285, 2333, 2336, 2393, 2403, 2488, 2493, 2541, 2602, 2736, 2835
Location = (n+1)
2
n = Number of Observation
Calculation
n = 12
Location = (12+1) = 6.5
2
Hence, median location of the above data set is 6.5th location.
Median = 2403 + (85*0.5)
= 2403 + 42.5
= 2,445.50
8
Variance
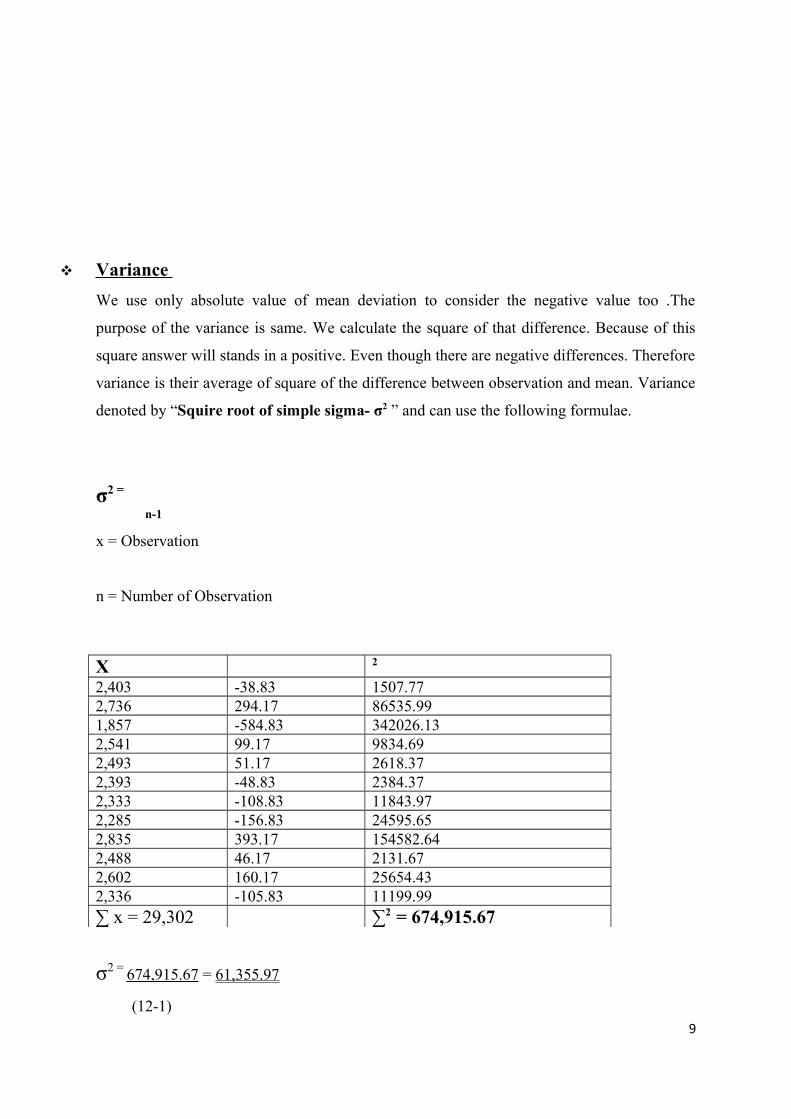
We use only absolute value of mean deviation to consider the negative value too .The
purpose of the variance is same. We calculate the square of that difference. Because of this
square answer will stands in a positive. Even though there are negative differences. Therefore
variance is their average of square of the difference between observation and mean. Variance
denoted by “Squire root of simple sigma- σ2 ” and can use the following formulae.
σ2 =
n-1
x = Observation
n = Number of Observation
X 2
2,403 -38.83 1507.772,736 294.17 86535.991,857 -584.83 342026.132,541 99.17 9834.692,493 51.17 2618.372,393 -48.83 2384.372,333 -108.83 11843.972,285 -156.83 24595.652,835 393.17 154582.642,488 46.17 2131.672,602 160.17 25654.432,336 -105.83 11199.99∑ x = 29,302 ∑2 = 674,915.67
σ2 = 674,915.67 = 61,355.97
(12-1) 9
Standard Deviation
Square Root (√) of the variance is called as “Standard deviation”. This is denoted by .
SD = √variance
Hence, standard deviation =√ 61,355.97 = 247.70
Skewness
After construct the frequency curve by using mean, median and Standard deviation create
shape of curve called “Skewness”.
According to the shape of curve, skewness can be categorized in three types.
Positive Skewness
Negative Skewness
Zero skewness
Skewness can construct by using following formulae.
Skewness = 3 (Mean – Median)
Standard Deviation
Calculation
Skewness = 3(2441.83-2445.50)
10
247.70
= 3 x -3.67 = - 0.044
247.70
Skewness is (-) value. Therefore, we can decide, Skewness is negative skewness.
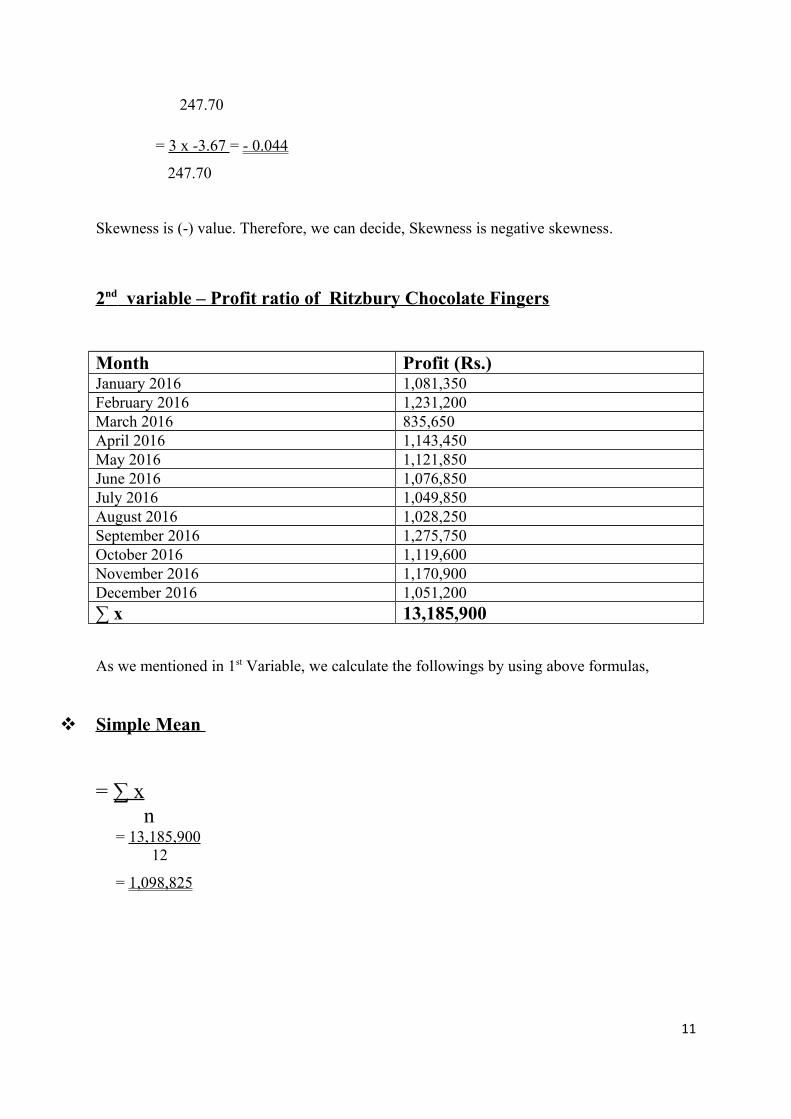
2 nd variable – Profit ratio of Ritzbury Chocolate Fingers
Month Profit (Rs.)January 2016 1,081,350February 2016 1,231,200March 2016 835,650April 2016 1,143,450May 2016 1,121,850June 2016 1,076,850July 2016 1,049,850August 2016 1,028,250September 2016 1,275,750October 2016 1,119,600November 2016 1,170,900December 2016 1,051,200∑ x 13,185,900
As we mentioned in 1st Variable, we calculate the followings by using above formulas,
Simple Mean
= ∑ x n = 13,185,900 12
= 1,098,825
11
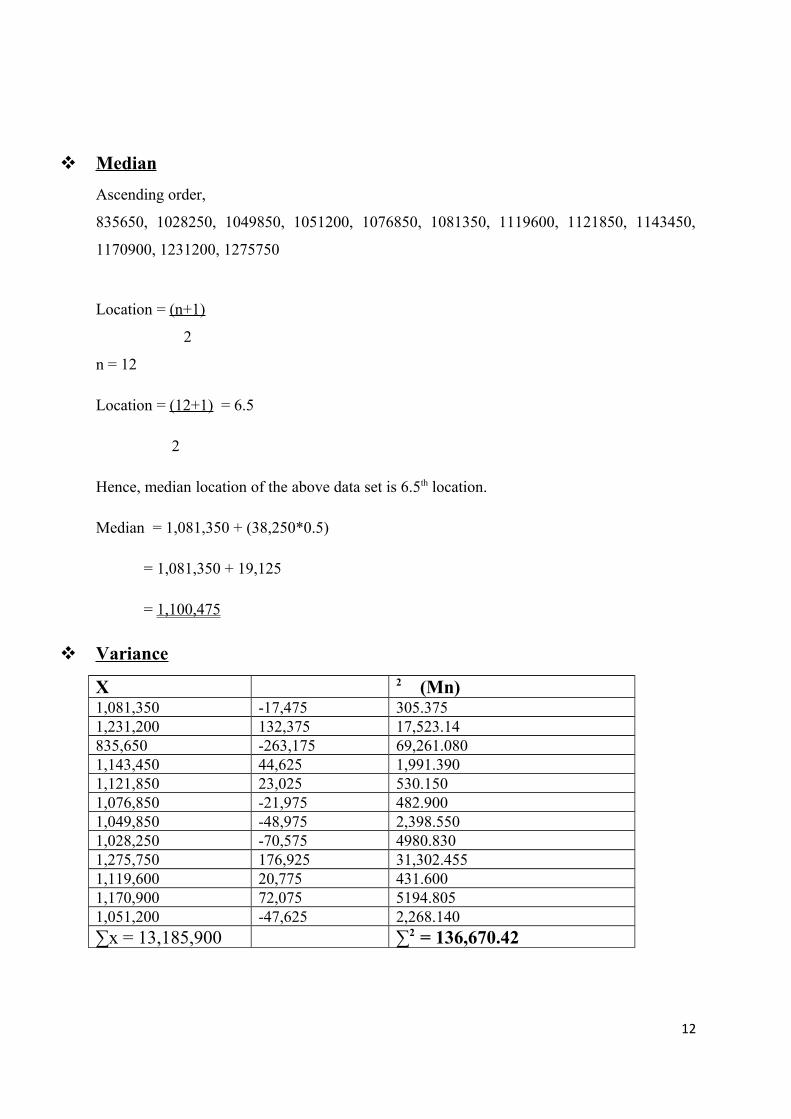
Median
Ascending order,
835650, 1028250, 1049850, 1051200, 1076850, 1081350, 1119600, 1121850, 1143450,
1170900, 1231200, 1275750
Location = (n+1)
2
n = 12
Location = (12+1) = 6.5
2
Hence, median location of the above data set is 6.5th location.
Median = 1,081,350 + (38,250*0.5)
= 1,081,350 + 19,125
= 1,100,475
Variance
X 2 (Mn)1,081,350 -17,475 305.3751,231,200 132,375 17,523.14835,650 -263,175 69,261.0801,143,450 44,625 1,991.3901,121,850 23,025 530.1501,076,850 -21,975 482.9001,049,850 -48,975 2,398.5501,028,250 -70,575 4980.8301,275,750 176,925 31,302.4551,119,600 20,775 431.6001,170,900 72,075 5194.8051,051,200 -47,625 2,268.140∑x = 13,185,900 ∑2 = 136,670.42
12
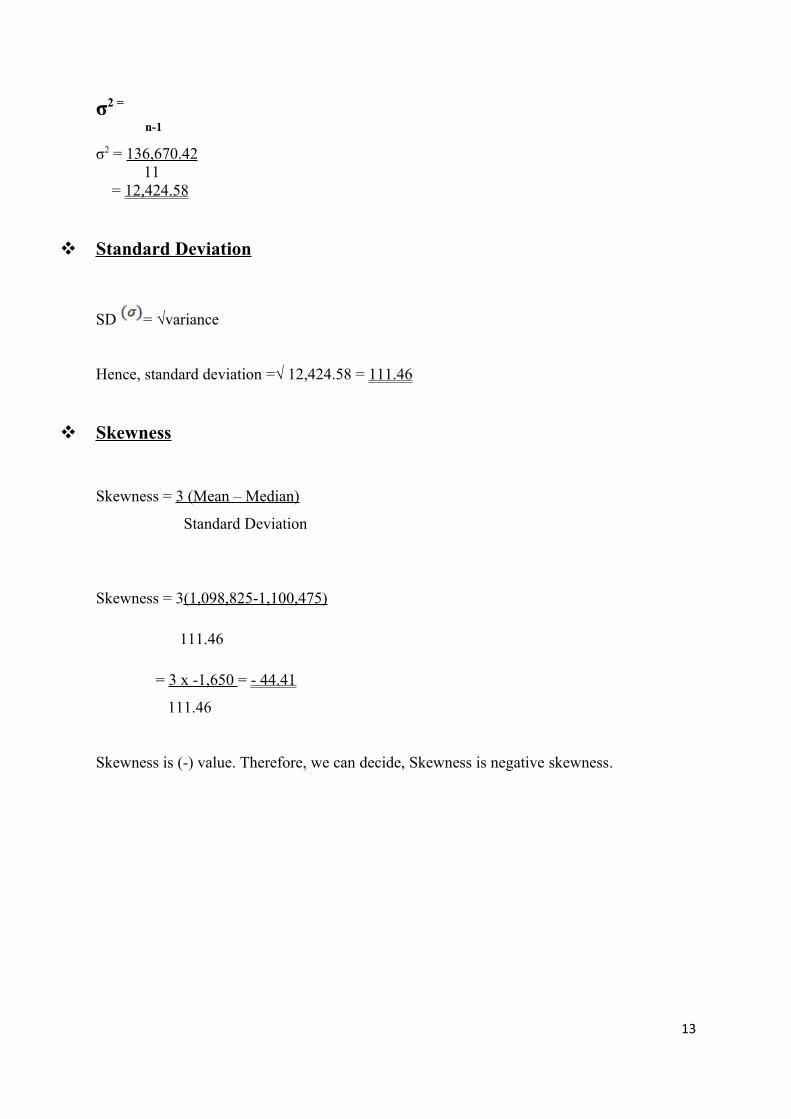
σ2 =
n-1
σ2 = 136,670.42 11 = 12,424.58
Standard Deviation
SD = √variance
Hence, standard deviation =√ 12,424.58 = 111.46
Skewness
Skewness = 3 (Mean – Median)
Standard Deviation
Skewness = 3(1,098,825-1,100,475)
111.46
= 3 x -1,650 = - 44.41
111.46
Skewness is (-) value. Therefore, we can decide, Skewness is negative skewness.
13
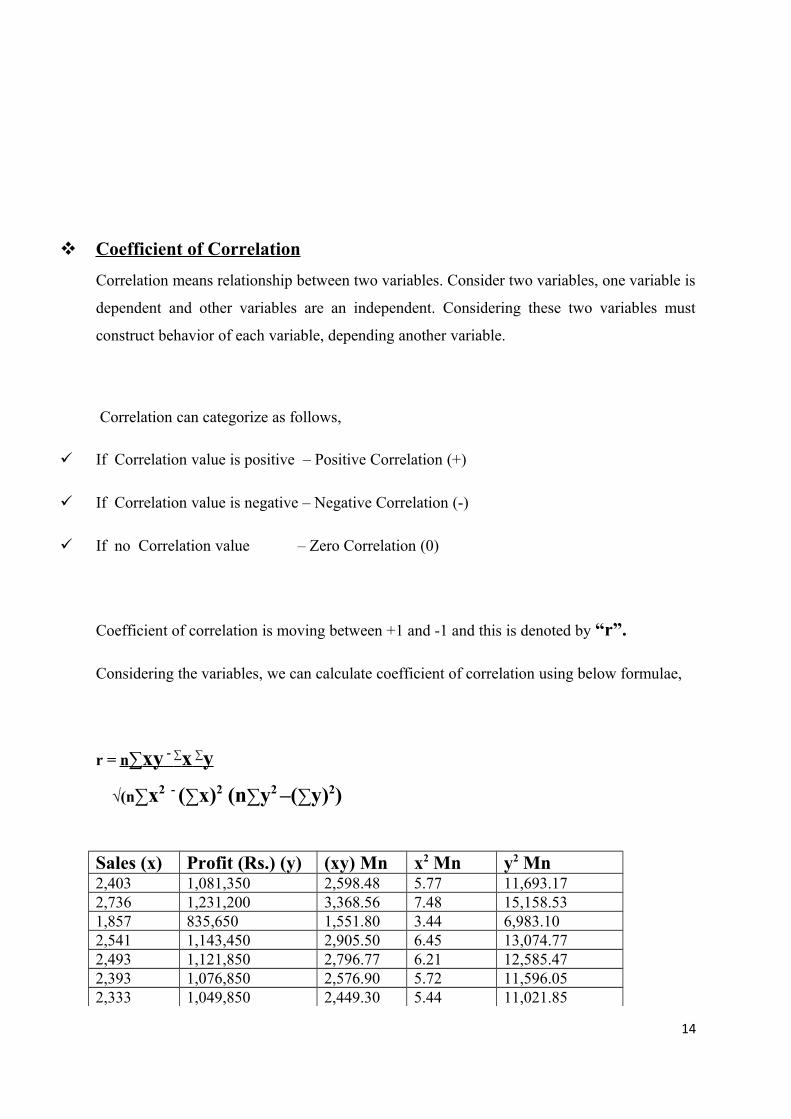
Coefficient of Correlation
Correlation means relationship between two variables. Consider two variables, one variable is
dependent and other variables are an independent. Considering these two variables must
construct behavior of each variable, depending another variable.
Correlation can categorize as follows,
If Correlation value is positive – Positive Correlation (+)
If Correlation value is negative – Negative Correlation (-)
If no Correlation value – Zero Correlation (0)
Coefficient of correlation is moving between +1 and -1 and this is denoted by “r”.
Considering the variables, we can calculate coefficient of correlation using below formulae,
r = n ∑ xy - ∑ x ∑ y
√(n∑x2 - (∑x)2 (n∑y2 –(∑y)2)
Sales (x) Profit (Rs.) (y) (xy) Mn x2 Mn y2 Mn2,403 1,081,350 2,598.48 5.77 11,693.172,736 1,231,200 3,368.56 7.48 15,158.531,857 835,650 1,551.80 3.44 6,983.102,541 1,143,450 2,905.50 6.45 13,074.772,493 1,121,850 2,796.77 6.21 12,585.472,393 1,076,850 2,576.90 5.72 11,596.052,333 1,049,850 2,449.30 5.44 11,021.85
14
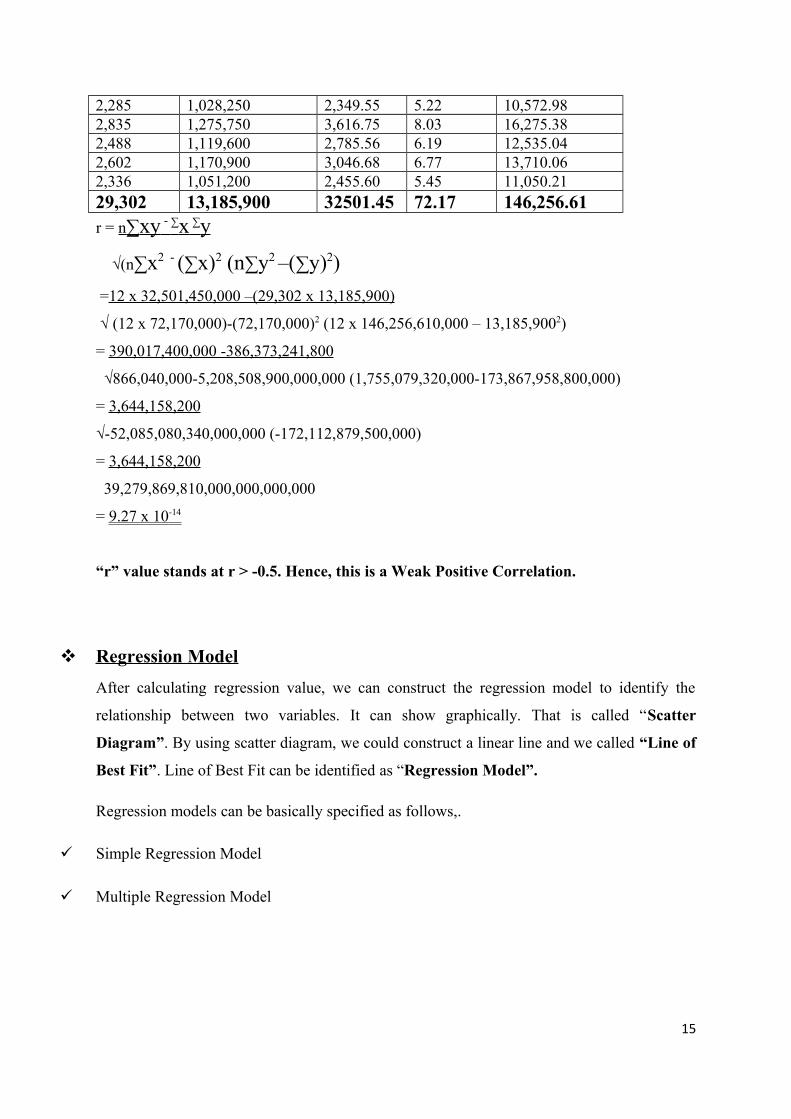
2,285 1,028,250 2,349.55 5.22 10,572.982,835 1,275,750 3,616.75 8.03 16,275.382,488 1,119,600 2,785.56 6.19 12,535.042,602 1,170,900 3,046.68 6.77 13,710.062,336 1,051,200 2,455.60 5.45 11,050.2129,302 13,185,900 32501.45 72.17 146,256.61r = n ∑ xy - ∑ x ∑ y
√(n∑x2 - (∑x)2 (n∑y2 –(∑y)2)
=12 x 32,501,450,000 –(29,302 x 13,185,900)
√ (12 x 72,170,000)-(72,170,000)2 (12 x 146,256,610,000 – 13,185,9002)
= 390,017,400,000 -386,373,241,800
√866,040,000-5,208,508,900,000,000 (1,755,079,320,000-173,867,958,800,000)
= 3,644,158,200
√-52,085,080,340,000,000 (-172,112,879,500,000)
= 3,644,158,200
39,279,869,810,000,000,000,000
= 9.27 x 10 -14
“r” value stands at r > -0.5. Hence, this is a Weak Positive Correlation.
Regression Model
After calculating regression value, we can construct the regression model to identify the
relationship between two variables. It can show graphically. That is called “Scatter
Diagram”. By using scatter diagram, we could construct a linear line and we called “Line of
Best Fit”. Line of Best Fit can be identified as “Regression Model”.
Regression models can be basically specified as follows,.
Simple Regression Model
Multiple Regression Model
15
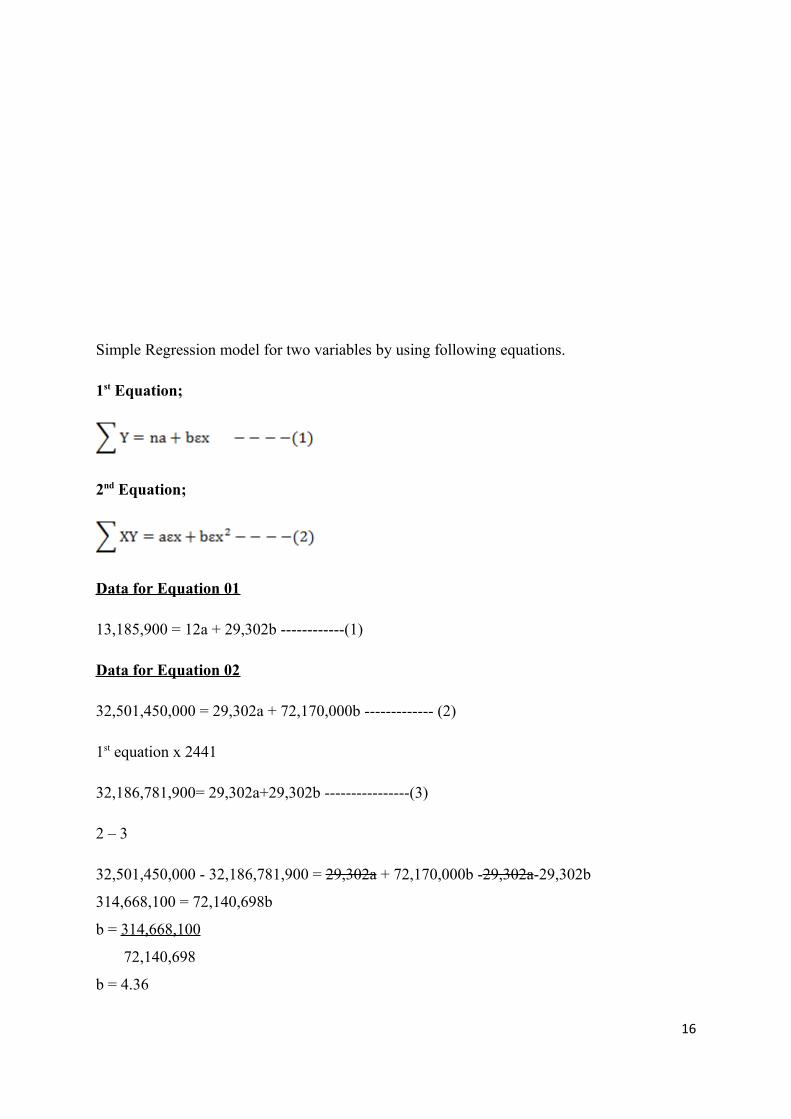
Simple Regression model for two variables by using following equations.
1st Equation;
2nd Equation;
Data for Equation 01
13,185,900 = 12a + 29,302b ------------(1)
Data for Equation 02
32,501,450,000 = 29,302a + 72,170,000b ------------- (2)
1st equation x 2441
32,186,781,900= 29,302a+29,302b ----------------(3)
2 – 3
32,501,450,000 - 32,186,781,900 = 29,302a + 72,170,000b -29,302a-29,302b
314,668,100 = 72,140,698b
b = 314,668,100
72,140,698
b = 4.36
16
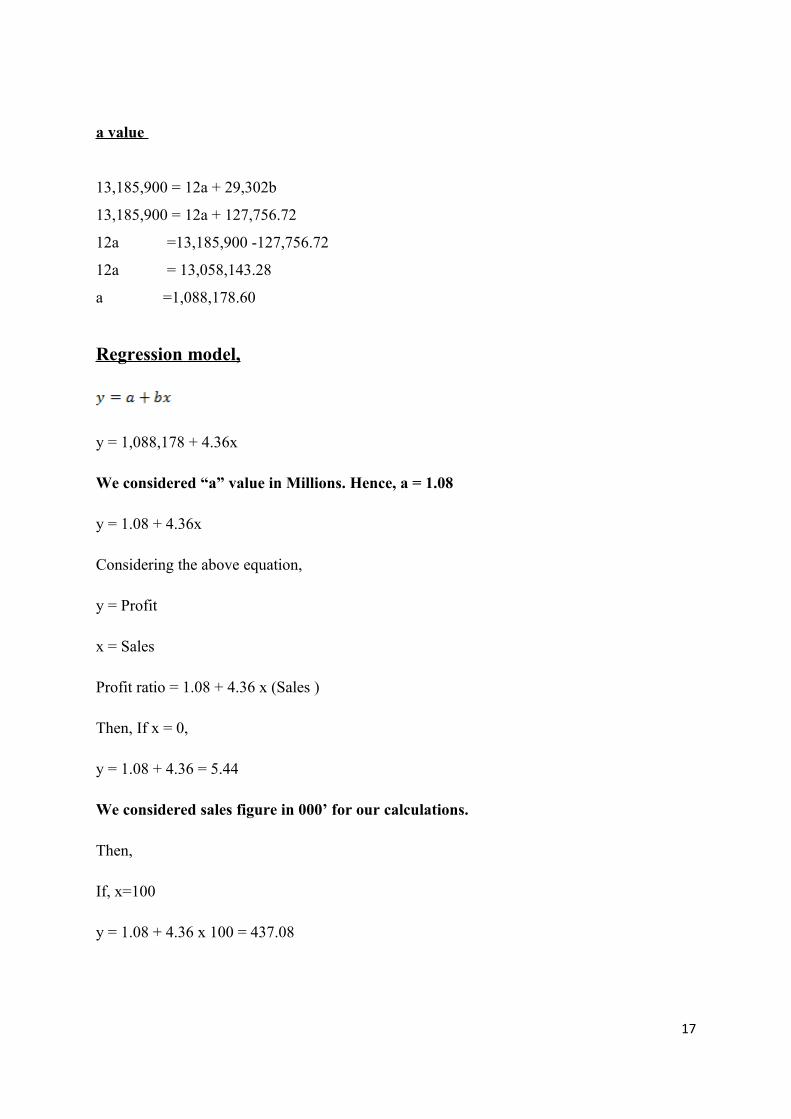
a value
13,185,900 = 12a + 29,302b
13,185,900 = 12a + 127,756.72
12a =13,185,900 -127,756.72
12a = 13,058,143.28
a =1,088,178.60
Regression model,
y = 1,088,178 + 4.36x
We considered “a” value in Millions. Hence, a = 1.08
y = 1.08 + 4.36x
Considering the above equation,
y = Profit
x = Sales
Profit ratio = 1.08 + 4.36 x (Sales )
Then, If x = 0,
y = 1.08 + 4.36 = 5.44
We considered sales figure in 000’ for our calculations.
Then,
If, x=100
y = 1.08 + 4.36 x 100 = 437.08
17
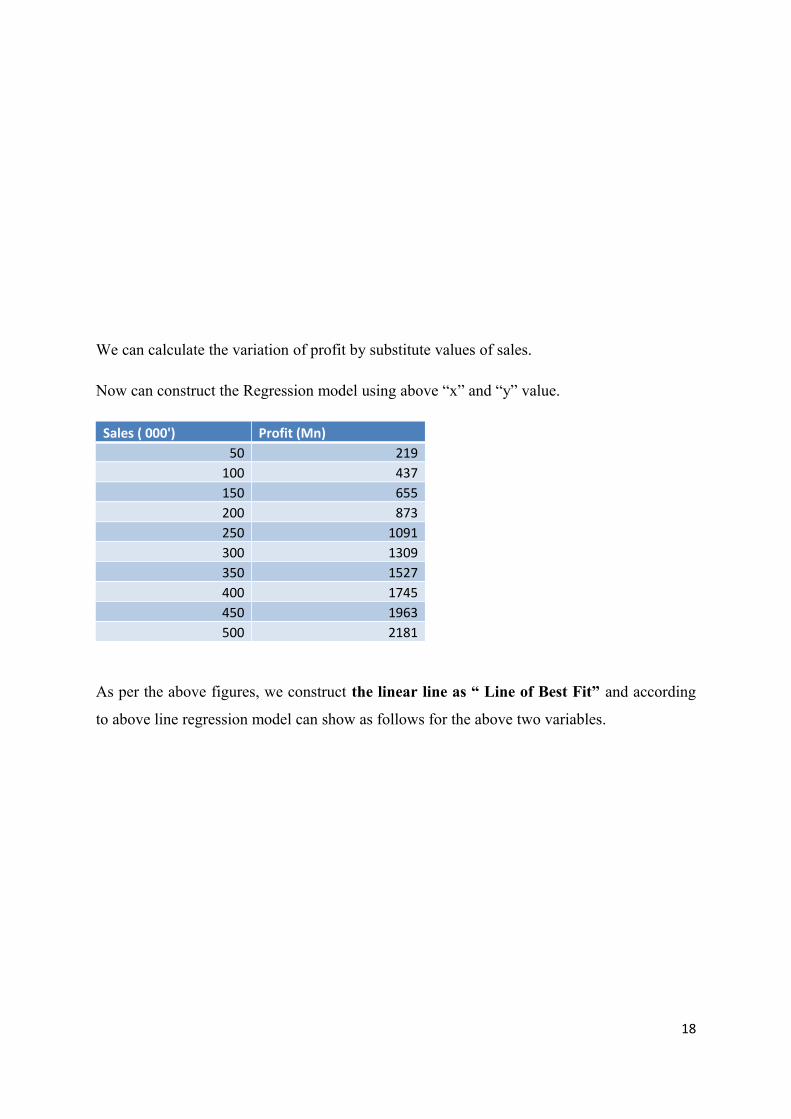
We can calculate the variation of profit by substitute values of sales.
Now can construct the Regression model using above “x” and “y” value.
Sales ( 000') Profit (Mn)50 219
100 437150 655200 873250 1091300 1309350 1527400 1745450 1963500 2181
As per the above figures, we construct the linear line as “ Line of Best Fit” and according
to above line regression model can show as follows for the above two variables.
18
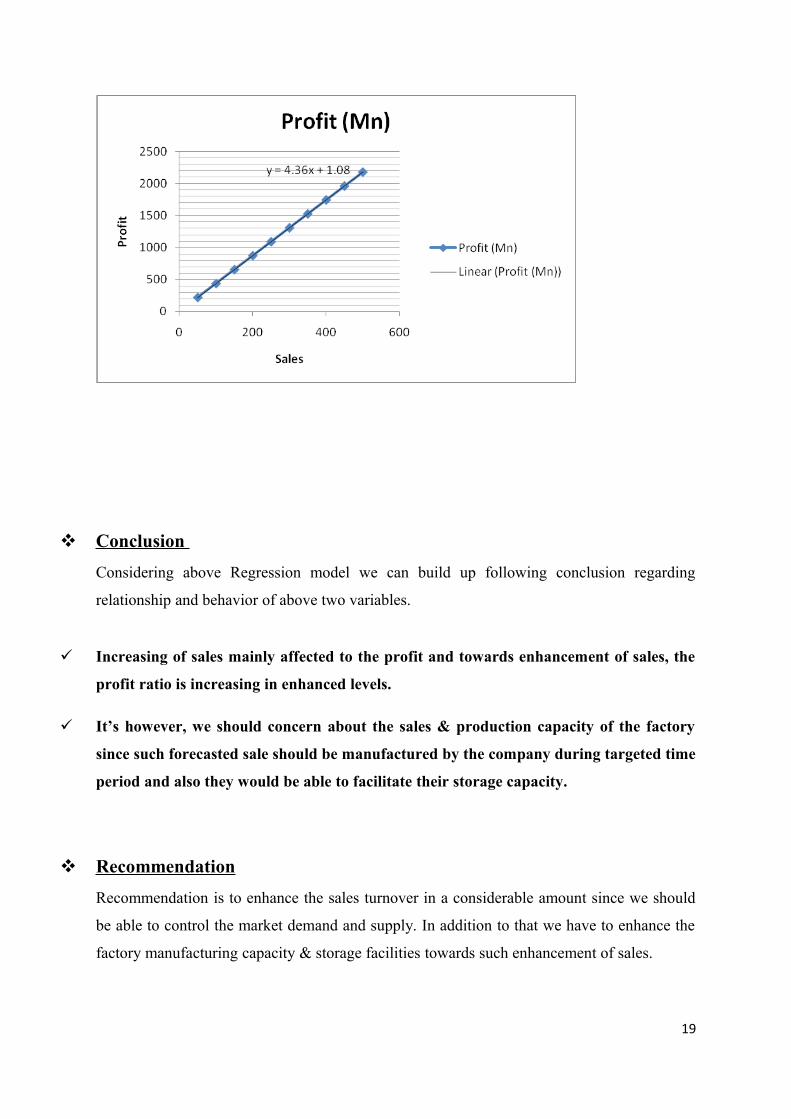
Conclusion
Considering above Regression model we can build up following conclusion regarding
relationship and behavior of above two variables.
Increasing of sales mainly affected to the profit and towards enhancement of sales, the
profit ratio is increasing in enhanced levels.
It’s however, we should concern about the sales & production capacity of the factory
since such forecasted sale should be manufactured by the company during targeted time
period and also they would be able to facilitate their storage capacity.
Recommendation
Recommendation is to enhance the sales turnover in a considerable amount since we should
be able to control the market demand and supply. In addition to that we have to enhance the
factory manufacturing capacity & storage facilities towards such enhancement of sales.
19
REFERENCE
Data of sales and other details - Manuka Weerasekara – Sales Executive of CBL
Though internet
20