
Statewide Homeless Point-in-Time Count 2013 …humanservices.hawaii.gov/bessd/files/2013/05/2013...3...
72
Statewide Homeless Point-in-Time Count 2013 Methodology and Results Prepared By: The State of Hawaii, Department of Human Services, Homeless Programs Office The City & County of Honolulu, Department of Community Services May 2013
Transcript of Statewide Homeless Point-in-Time Count 2013 …humanservices.hawaii.gov/bessd/files/2013/05/2013...3...

Statewide Homeless Point-in-Time Count 2013 Methodology and Results
Prepared By:
The State of Hawaii, Department of Human Services, Homeless Programs Office
The City & County of Honolulu,
Department of Community Services
May 2013

2
Table of Contents Acknowledgements.....................................................................................................................3
Background and Project Overview ..............................................................................................5
Overview for 2013 ......................................................................................................................9
Statewide Sheltered Homeless Counts.......................................................................................13
Sheltered Homeless Demographic Characteristics .....................................................................14
Homeless Subpopulations .........................................................................................................17
Statewide Unsheltered Homeless...............................................................................................19
Regional Changes of Unsheltered Homelessness .......................................................................22
Demographic Characteristics of the Unsheltered Adult Population ............................................25
Unsheltered Chronically Homeless............................................................................................27
Recommendations for Future PIT Counts..................................................................................31
Appendix 1: Shelter Utilization .................................................................................................35
Appendix 2: HDX Summaries...................................................................................................38
Appendix 3: Site of Interview Analysis .....................................................................................42
Appendix 4: Single Unsheltered Chronically Homeless.............................................................54
Appendix 5: 2013 PIT Count Household Survey .......................................................................64
Appendix 6: 2013 PIT Count Single Survey ..............................................................................67
Appendix 7: 2013 Overview......................................................................................................69
Appendix 8: Contact and Confidentiality Form .........................................................................71

3
Acknowledgements Mahalo to the agencies and individuals who contributed their time, expertise, gifts for persons experiencing homelessness, and other resources to conduct the 2013 Statewide Homeless Point-in-Time Count (PIT). The City & County of Honolulu and the Department of Human Services would like to recognize the following persons, organizations, and public and private agencies for participating in this project: Partners in Care Point in Time Planning Members Gabriel Naeole – City & County of Honolulu, Department of Community Services Lori Tsuhako – State of Hawaii, Department of Human Services, Homeless Programs Office Paul Oshiro – Waikiki Health Center Tien Lum – Hybrid International, LLC Carlos Peraro – C. Peraro Consulting, LLC Partners in Care is a coalition of representatives on Oahu and Bridging the Gap a coalition representing the rural counties. Both coalitions include service providers, state and local government, community groups, and homeless and formerly homeless individuals that are providing a comprehensive collaborative response to the diverse needs of individuals and families experiencing homelessness. Bridging the Gap Point in Time Planning Members Rita Sandi-Palma, Chair – Community Alliance Partners (Big Island CoC) Jeremy McComber – HOPE Services Hawaii Debra deLuis, Chair – Kauai Community Alliance (Kauai CoC) Sharon Woodward– Kauai Housing Agency Maude Cumming, Chair – Maui Homeless Alliance (Maui CoC) Jan Shishido and Tina Krau – Maui County Department of Housing and Human Concerns Thank you to the numerous individuals and agencies donating gifts for persons and families experiencing homelessness that were distributed during the Point-in-Time Count and to the many volunteers that helped coordinate and carry out the interviews and count. Affordable Housing and Homeless Alliance Coordinators: Doran Porter, Catherine Datuin Family Life Center Coordinator: Maude Cumming Hale Kipa, Inc. Coordinator: Alika Campbell IHS, the Institute for Human Services, Inc. Coordinator: Connie Mitchell

4
Kalihi-Palama Health Center Coordinator: Aaron Whyne Kauai Economic Opportunity Coordinator: Stephanie Fernandes Ka Hale A Ke Ola Coordinator: Mike Davis HOPE Services Hawaii Coordinator: Brandee Menino Salvation Army, Maui Coordinators: Captains Kathy and Mark Merritt United States Veterans Initiative Coordinator: Kim Cook Waianae Coast Comprehensive Health Center Coordinator: Theresa Gonsalves Waianae Community Outreach Coordinators: Tulu Toa and Laura Pitolo Waikiki Health Center Coordinators: Paul Oshiro, Michelle Ip, and Vanessa Vallejos Feed My Sheep Gregory House Programs Hale Kau Kau Hawaii Helping the Hungry Have Hope Hawaii Pacific University – School of Nursing Hawaiian Hope Helping Hands Hawaii Mental Health Kokua Steadfast Housing Development Corporation University of Hawaii – School of Nursing Veterans Administration – Homeless Programs

5
Background and Project Overview The U.S. Department of Housing and Urban Development’s (HUD) annual grant application for Continuum of Care (CoC) Homeless Assistance Programs funding requires the Honolulu and Balance of State Continua to produce “statistically reliable, unduplicated counts or estimates of homeless persons in sheltered and unsheltered locations on a one-day point in time.” The 2013 Statewide PIT Count date was January 22nd, 2013. The City & County of Honolulu, Department of Community Services (DCS), the State of Hawaii, Department of Human Services (DHS), Homeless Programs Office, Bridging the Gap CoC, and Partners in Care CoC collaborated to develop the methodology for the count and worked diligently with homeless service providers to plan the logistics and develop the survey instruments in accordance with HUD’s guidelines. Objectives The objective of the 2013 PIT Count was to obtain an accurate estimate of Oahu’s sheltered and unsheltered homeless populations on January 22, 2013 in conjunction with: Obtaining an overall count of homeless individuals and households in specific
subpopulations in the City & County of Honolulu; Obtaining an estimate of the number of homeless singles and persons in households with
children; Obtaining an estimate of the number of chronically homeless individuals and families
according to HUD’s definition of “chronically homeless.” As in the 2012 PIT Count, the State of Hawaii Homeless Management Information System (HMIS) was utilized to extract data for both the sheltered and unsheltered counts. The HMIS is a statewide database that was established in 2002 for recording homeless client and service data in an accurate and uniform manner in order to track program outputs and outcomes for reporting and funding purposes. All homeless service providers receiving funding at the federal, state, or local level are required to participate in the HMIS. Some privately funded agencies voluntarily use the HMIS, which is highly encouraged. The City received HUD’s permission to deviate from the conventional one-night unsheltered PIT Count methodology and to instead conduct a seven-day physical count from Wednesday, January 23, 2013 to Tuesday, January 29, 2013. These dates fell within the last ten days of January 2013 as mandated by HUD. All unsheltered persons encountered by field staff were asked “Where did you sleep this past Tuesday, January 22nd?” as well as other survey questions. The unsheltered homeless count used survey instruments based on criteria from HUD’s Guide to Counting Unsheltered Homeless for use by field staff to document unsheltered responses. The surveys for unsheltered persons on the night of January 22, 2013 were entered into the PIT Count module of the HMIS, which has response fields for all of the survey questions. The surveyed participant’s name was first queried in the HMIS to determine whether the person had ever been entered into the HMIS database. Surveyed respondents in the HMIS had some of their

6
demographic information populated by corresponding response fields to streamline the data entry process. Staff performing data entry had the opportunity to edit the populated fields if the information was not current. After all surveys were entered into the PIT module, the data were analyzed to obtain the statistics needed by HUD and referenced in this report. The following unsheltered encounters were not included in the unsheltered homeless count: 1) persons who stated that they had been sheltered on the night of January 22, 2013, 2) persons who were approached to complete a survey, but indicated that they had already been surveyed and 3) persons who did not indicate where they had slept on January 22, 2013. A relatively small number of unknown/refused surveys were omitted to account for duplication. These numbers are presented in Exhibits 14A-D. The vast majority of sheltered homeless statistics were derived from HMIS client and intake data in the sheltered programs section of the HMIS. Emergency, transitional, and safe haven housing programs were contacted prior to the 22nd and instructed that all clients sleeping in their facility on the night of the count needed to have active intakes in the HMIS. Agencies were advised to make sure that all client data were current so that subpopulation data could be as reliable as possible. Follow-up with specific service providers was also conducted to verify that HMIS listings matched the nightly census. Shelters not participating in the HMIS (such as domestic violence shelters) were contacted individually to provide the number of homeless individuals and families residing at their shelters on the night of the count, in addition to providing specific subpopulation data. PIT Count planning meetings were conducted prior to the night of the count and were attended by staff from HUD, DCS, DHS, PIT Team Coordinators; homeless service providers, and interested PIC members. The purpose of these meetings was to refine the count’s methodology, provide instructions, and obtain feedback regarding the survey instruments used for the unsheltered counts. The survey instruments are attached as appendices five and six. Separate trainings took place for field staff conducting the unsheltered PIT. These trainings provided an overview of the purpose and methodology for the PIT, safety tips, recommended materials to bring during the field work, and practice regarding the use of the survey instruments. Additionally, PIT Team Coordinators provided training in the field before the count to ensure that all volunteers understood how to use the survey. The unsheltered PIT materials provided to surveyors are displayed in appendices seven and eight. Point-in-Time Count Teams PIT teams were composed of outreach workers from service agencies that regularly perform outreach to unsheltered individuals and families experiencing homelessness. Teams were assigned to a region where they regularly provide outreach services so field staff could use their familiarity with the region to ensure all of the areas frequented by unsheltered homeless populations were surveyed. Because outreach workers had already established rapport with many of the consumers they encountered, consumers were more likely to participate in the surveys and provide accurate information. Feeding programs were also covered during the PIT to reach additional unsheltered persons.

7
Oahu Regions: 1. Downtown Honolulu: Salt Lake to Piikoi Street; 2. East Honolulu: Piikoi Street to Hawaii Kai, including Waikiki; 3. Ewa: Aiea to Kapolei; 4. Kaneohe to Waimanalo; 5. Wahiawa to North Shore; 6. Upper Windward: Kahaluu to Kahuku; and 7. Waianae Coast. Maui Regions: 1. Central Maui 2. Lower Waiehu 3. Up Country 4. Lahaina 5. Kihei 6. Hana Kauai Regions: 1. West 2. South 3. South Central 4. East 5. North Hawaii Regions: 1. Kohala 2. Honokaa 3. Laupahoehoe 4. Hilo 5. Waiakea 6. Keaau 7. Pahoa 8. Kau 9. Konawaena 10. Kealakehe Implementation The sheltered count was conducted on the evening of Tuesday January 22nd and the unsheltered from January 23rd until the 29th. A “Super Wednesday” unsheltered count was conducted with all participating agencies on the 23rd, aimed at reaching as many unsheltered persons as possible. For the subsequent six days of the unsheltered count, each outreach agency independently scheduled days and times when field staff would visit known sites, balancing safety with timing in an effort to maximize the number of unsheltered persons counted.

8
While the 2005 and 2007 PIT Counts used a sampling method to survey the encountered homeless, the 2009 through 2013 HMIS PIT Count Methodology required that all unsheltered persons identified be asked to complete a survey. Service providers agreed this was the best way to get an accurate count of homeless persons and an improved chronically homeless and subpopulation tally. This also allowed field staff to obtain identifying info for each person being counted so that the surveyed could be unduplicated. Unduplicating the data is important to ensure clients or families that mistakenly appear multiple times in the counts are only counted once. The duration of the count was increased so that outreach teams would be able to survey each person encountered and to give field staff more time to reach as many unsheltered persons as possible.

9
Overview for 2013 On January 22, 2013 the Honolulu and Balance of State CoC conducted a one-day sheltered count of homeless persons on Oahu and the rural counties of Maui, Kauai, and Hawaii. The sheltered count preceded a seven-day unsheltered count of homeless persons that took place from January 23rd to the 29th, and spanned the islands of Oahu, Maui, Kauai, and Hawaii. Exhibit 1A summarizes the Oahu count. The sheltered count included persons staying in emergency, transitional, or safe haven programs. The total number of homeless on the island of Oahu was estimated to be 4,556. There were 3,091 sheltered homeless and 1,465 unsheltered homeless, representing 68% and 32% of the homeless population respectively. Individuals were defined to be singles or adult households. 29% of the sheltered were individuals, while the remaining 71% were persons in families. Persons in families were defined as members of a household with at least one adult and one child under the age of 18. 88% of the unsheltered were individuals while 12% were persons in families. Sheltered homeless on Oahu comprised 68% of the total homeless, while unsheltered persons roughly 32%. The ratio of sheltered family households to unsheltered family households was just over 12:1. Exhibit 1A – 2013 Oahu Homeless Composition Number of Homeless % of Total Total People
Sheltered Unsheltered Total
3,091 1,465 4,556
67.8% 32.2%
100.0% Individuals
Sheltered Unsheltered Total
901 1,295 2,196
41.0% 59.0%
100.0% Persons in Families
Sheltered Unsheltered Total
2,190 170
2,360
92.8% 7.2%
100.0% Total Family Households
Sheltered Unsheltered Total
525 43 568
92.4% 7.6%
100.0% Exhibit 1B summarizes the rural county homeless composition. The total number of homeless was estimated to be 1,779, which declined 6% from the prior year. Sheltered homeless represented 37% of the total, while unsheltered comprised 63%. These figures are a stark contrast from the percentages of Oahu’s sheltered and unsheltered homeless. 37% of the sheltered were individuals, while the remaining 63% were persons in families. The proportion of individuals who were sheltered was eight points higher than Oahu. 82% of the unsheltered were individuals while 18% were persons in families. The proportion of unsheltered homeless that were persons in families for the rural counties was 6% higher than that of Oahu.

10
Exhibit 1B – 2013 Rural Counties Homeless Composition Number of Homeless % of Total Total People
Sheltered Unsheltered Total
654 1,125 1,779
36.8% 63.2% 100.0%
Individuals Sheltered Unsheltered Total
241 918
1,159
20.8% 79.2% 100.0%
Persons in Families Sheltered Unsheltered Total
413 207 620
66.6% 33.4% 100.0%
Total Family Households Sheltered Unsheltered Total
118 50 168
70.2% 29.8% 100.0%
Exhibit 2A-D illustrates the change in homelessness over the last five years. The tables span the last five years and breakout the number of homeless by sheltered status and household type. The last column calculates the percentage change in each row over the last two counts. Exhibit 2A – Changes in Oahu Counts of Homeless Persons 2009 2010 2011 2012 2013 % Change
2012-2013 Sheltered Status
Sheltered Unsheltered
2,445 1,193
2,797 1,374
2,912 1,322
3,035 1,318
3,091 1,465
1.8% 11.2%
Household Type Individuals Persons in Families
1,812 1,826
1,954 2,217
1,999 2,235
2,009 2,344
2,196 2,360
9.3% 0.6%
Total 3,638 4,171 4,234 4,353 4,556 4.7% Exhibit 2B – Changes in Maui Counts of Homeless Persons 2009 2010 2011 2012 2013 % Change
2012-2013 Sheltered Status
Sheltered Unsheltered
422 581
392 399
394 658
420 454
421 455
0.2% 0.2%
Household Type Individuals Persons in Families
580 423
473 318
640 412
524 350
555 321
5.9% -8.3%
Total 1,003 791 1,052 874 876 0.2%

11
Exhibit 2C – Changes in Kauai Counts of Homeless Persons 2009 2010 2011 2012 2013 % Change
2012-2013 Sheltered Status
Sheltered Unsheltered
80
125
60
213
97
239
101 301
73
273
-27.7% -9.3%
Household Type Individuals Persons in Families
121 84
166 107
191 145
229 173
220 126
-3.9%
-27.2% Total 205 273 336 402 346 -13.9% Exhibit 2D – Changes in Hawaii Counts of Homeless Persons 2009 2010 2011 2012 2013 % Change
2012-2013 Sheltered Status
Sheltered Unsheltered
321 615
286 313
229 337
170 447
160 397
-5.9%
-11.2% Household Type
Individuals Persons in Families
428 508
296 303
345 221
368 249
384 173
4.3%
-30.5% Total 936 599 566 617 557 -9.7% The number of sheltered homeless on Oahu has risen each of the last five years. From 2012 to 2013 Oahu’s sheltered programs saw a 2% increase in the total number of sheltered homeless. When comparing the 2011 to 2013 sheltered counts, the percentage increase was 6%. Over the four-year period from 2010 to 2013, the percentage change was 11%. Maui was the only rural county that saw an increase (0.2%) in the total number of homeless from 2012 to 2013. Kauai and Hawaii both realized large decreases in the total number of homeless. Sheltered utilization rates for Oahu and the rural counties are presented in Appendix 1. The transitional and emergency program occupancy rates for the rural counties were significantly lower than Oahu for the night of the count. All islands should strive to have their sheltered programs operating at or near capacity, especially transitional housing programs.

12
Figure 1 denotes the total homelessness by island over the last five years. Total homelessness has risen on Oahu each year, while the totals for the rural counties have fluctuated over the five year period.

13
Statewide Sheltered Homeless Counts The table below is similar to Exhibits 2A-D above; however, focuses on filtering the sheltered row of the aforementioned tables. The statewide sheltered figure increased slightly when compared to 2012, while Kauai and Hawaii saw decreases in there sheltered occupancy on the night of the 22nd. Hawaii has shown a continuous decline in the total number of sheltered homeless over the five-year period. Oahu is trending positively, while Maui and Kauai show fluctuations from year to year. Statewide shelter utilization demonstrates steady increases over the last five years. The statewide sheltered homeless total was 3,745 people, with Oahu contributing to 83% of the total. Persons in families continue to comprise a high percentage of the sheltered total, averaging just below 71% over the last five years. Exhibit 3 – Sheltered Homeless Persons by County 2009 2010 2011 2012 2013 Oahu
Households with Children Persons in Families Individuals Total
447 1,673 772
2,445
527 2,041 756
2,797
514 2,058 854
2,912
534 2,170 865
3,035
568 2,190 901
3,091 Maui
Households with Children Persons in Families Individuals Total
98 306 116 422
80 283 109 392
77 267 127 394
88 289 131 420
77 271 150 421
Kauai Households with Children Persons in Families Individuals Total
20 67 13 80
13 44 16 60
22 78 19 97
24 84 17
101
14 48 25 73
Hawaii Households with Children Persons in Families Individuals Total
56 213 108 321
55 223 63
286
37 152 77
229
35 108 62
170
27 94 66
160 Statewide
Households with Children Persons in Families Individuals Total
621 2,259 1,009 3,268
675 2,591 944
3,535
650 2,555 1,077 3,632
681 2,651 1,075 3,726
686 2,603 1,142 3,745

14
Sheltered Homeless Demographic Characteristics Exhibit 4A presents various demographic data for HMIS participating adult individuals in emergency, transitional, and safe haven programs on Oahu. The emergency data is taken from a sample of 370 adult individuals; transitional data is taken from a sample of 409, and safe haven 25. The non-HMIS data are excluded from the table below as the manual survey does not ask for the demographic data presented below. The Homeless Utilization Report produced by the University of Hawaii gives a much broader demographic profile of sheltered homeless over an entire year. The Homeless Service Utilization Report analyzes HMIS data and presents demographic information about people who are receiving homeless services funded through government contracts. The report is prepared by the Center on the Family at the University of Hawaii in conjunction with the Homeless Programs Office of the Hawaii Department of Human Services (DHS). It can be downloaded from the site: http://uhfamily.hawaii.edu/ Ex 4A – Demographic Characteristics of Sheltered Adult Individuals (HI-501) ES (n=370) TH (n=409) SH (n=25) Gender Male Female Transgender Total
258 (69.7%) 109 (29.5%)
3 (0.8%) 370 (100.0%)
288 (70.4%) 118 (28.9%)
3 (0.7%) 409 (100.0%)
16 (64.0%) 9 (36.0%) 0 (0.0%)
25 (100.0%) Ethnicity Non-Hispanic/Non-Latino Hispanic/Latino Unknown/Refused Total
323 (87.3%) 34 (9.2%) 13 (3.5%)
370 (100.0%)
348 (85.1%) 47 (11.5%) 14 (3.4%)
409 (100.0%)
20 (80.0%) 2 (8.0%) 3 (12.0%)
25 (100.0%) Racial Groupings per HUD Data Standards American Indian/Alaska Native Asian African American Hawaiian/Pacific Islander White Refused Total
4 (1.1%) 58 (15.7%) 34 (9.2%)
110 (29.7%) 162 (43.8%)
2 (0.5%) 370 (100.0%)
5 (1.2%) 55 (13.4%) 50 (12.2%)
143 (35.0%) 153 (37.4%)
1 (0.2%) 409 (100.0%)
0 (0.0%) 9 (36.0%) 2 (8.0%) 9 (36.0%) 5 (20.0%) 0 (0.0%)
25 (100.0%) Age 18 to 30 31 to 50 51 to 61 62 and older Unknown Total
30 (8.1%) 175 (47.3%) 131 (35.4%)
34 (9.2%) 0 (0.0%)
370 (100.0%)
56 (13.7%) 186 (45.5%) 112 (27.4%) 55 (13.4%)
0 (0.0%) 409 (100.0%)
3 (12.0%) 14 (56.0%) 7 (28.0%) 1 (4.0%) 0 (0.0%)
25 (100.0%) Veteran Status Veterans 43 (11.6%) 131 (32.0%) 4 (16.0%)

15
Ex 4A – Demographic Characteristics of Sheltered Adult Individuals (HI-501) Non Veterans Unknown/Refused Total
305 (82.4%) 22 (5.9%)
370 (100.0%)
278 (68.0%) 0 (0.0%)
409 (100.0%)
21 (84.0%) 0 (0.0%)
25 (100.0%) Employment Status Upon Entry Unemployed Employed Part or Full Time Unknown Total
316 (85.4%) 53 (14.3%)
1 (0.3%) 370 (100.0%)
286 (69.9%) 122 (29.8%)
1 (0.2%) 409 (100.0%)
22 (88.0%) 3 (12.0%) 0 (0.0%)
25 (100.0%) Exhibit 4B presents demographic data for HMIS participating adult individuals in emergency and transitional programs on the rural counties. Adults in families are not included in exhibits 4A-B. The emergency and transitional demographic data is gathered from 114 and 111 adult individuals respectively. The non-HMIS survey data are excluded from the table below as the manual survey does not ask for the demographic data presented below. Ex 4B – Demographic Characteristics of Sheltered Adult Individuals (HI-500) ES (n=114) TH (n=111) Gender Male Female Transgender Total
79 (69.3%) 35 (30.7%)
0 (0.0%) 114 (100.0%)
78 (70.3%) 33 (29.7%)
0 (0.0%) 111 (100.0%)
Ethnicity Non-Hispanic/Non-Latino Hispanic/Latino Unknown/Refused Total
96 (84.2%) 13 (11.4%)
5 (4.4%) 114 (100.0%)
94 (84.7%) 16 (14.4%)
1 (0.9%) 111 (100.0%)
Racial Groupings per HUD Data Standards American Indian/Alaska Native Asian Black/African American Hawaiian/Pacific Islander White Unknown/Refused Total
7 (6.1%) 14 (12.3%)
4 (3.5%) 19 (16.7%) 70 (61.4%)
0 (0.0%) 114 (100.0%)
3 (2.7%) 11 (9.9%) 10 (9.0%) 21 (18.9%) 64 (57.7%)
2 (1.8%) 111 (100.0%)
Age 18 to 30 31 to 50 51 to 61 62 and older Unknown Total
20 (17.5%) 55 (48.2%) 28 (24.6%) 11 (9.6%) 0 (0.0%)
114 (100.0%)
12 (10.8%) 48 (43.2%) 32 (28.8%) 19 (17.1%)
0 (0.0%) 111 (100.0%)
Veteran Status Veterans 13 (11.4%) 12 (10.8%)

16
Non Veterans Unknown/Refused Total
98 (86.0%) 3 (2.6%)
114 (100.0%)
98 (88.3%) 1 (0.9%)
111 (100.0%) Employment Status Upon Entry Unemployed Employed Part or Full Time Unknown Total
94 (82.5%) 20 (17.5%)
0 (0.0%) 114 (100.0%)
50 (45.0%) 61 (55.0%)
0 (0.0%) 111 (100.0%)

17
Homeless Subpopulations PIT count data also provides estimates for various subpopulations. In 2013, the Honolulu CoC was required to collect sheltered subpopulation information in eight different areas, and unsheltered subpopulation data in seven. These data estimated the number of homeless persons or households that had characteristics defined in Exhibit 5A below. The exhibit outlines information collected over the last five years. Some information is listed as N/A if it was not collected at the time. For 2013, the table below reflects the total number of sheltered and unsheltered chronically homeless. The sheltered number was pulled from all unaccompanied adults in either emergency or safe haven programs. The total number equaled 187, and also includes 36 identified through manual surveys of non-HMIS participating providers. The unsheltered total of 505 was derived from the population of all unsheltered unaccompanied adults. It is important to note that unsheltered information was largely self-reported, which may account for fluctuations over previous years’ data. A primary focus for this year’s sheltered count was to update the intake records to reflect accurate subpopulation info. This may be one of the key reasons why subpopulation data has risen in all sheltered categories. Unsheltered SMI, CSA, and HIV data was not required prior to 2013. Unsheltered unaccompanied youth data remains lacking. Exhibit 5A – Oahu Subpopulation Data 2009 2010 2011 2012 2013 Chronically Homeless Persons
Sheltered Unsheltered
96
390
74
478
75
481
101 485
187 505
Chronically Homeless Families Sheltered Unsheltered
N/A N/A
N/A N/A
1 12
8 10
11 15
Veterans Sheltered Unsheltered
183 123
156 143
185 147
202 165
207 191
Severely Mentally Ill Sheltered Unsheltered
272 N/A
256 N/A
353 N/A
369 N/A
413 429
Chronic Substance Abuse Sheltered Unsheltered
305 N/A
253 N/A
194 N/A
144 N/A
322 299
Persons with HIV/AIDS Sheltered Unsheltered
18
N/A
17
N/A
19
N/A
18
N/A
32 22
Victims of Domestic Violence* 161 153 128 105 280 Unaccompanied Youth
Sheltered
9
10
3
2 3
18
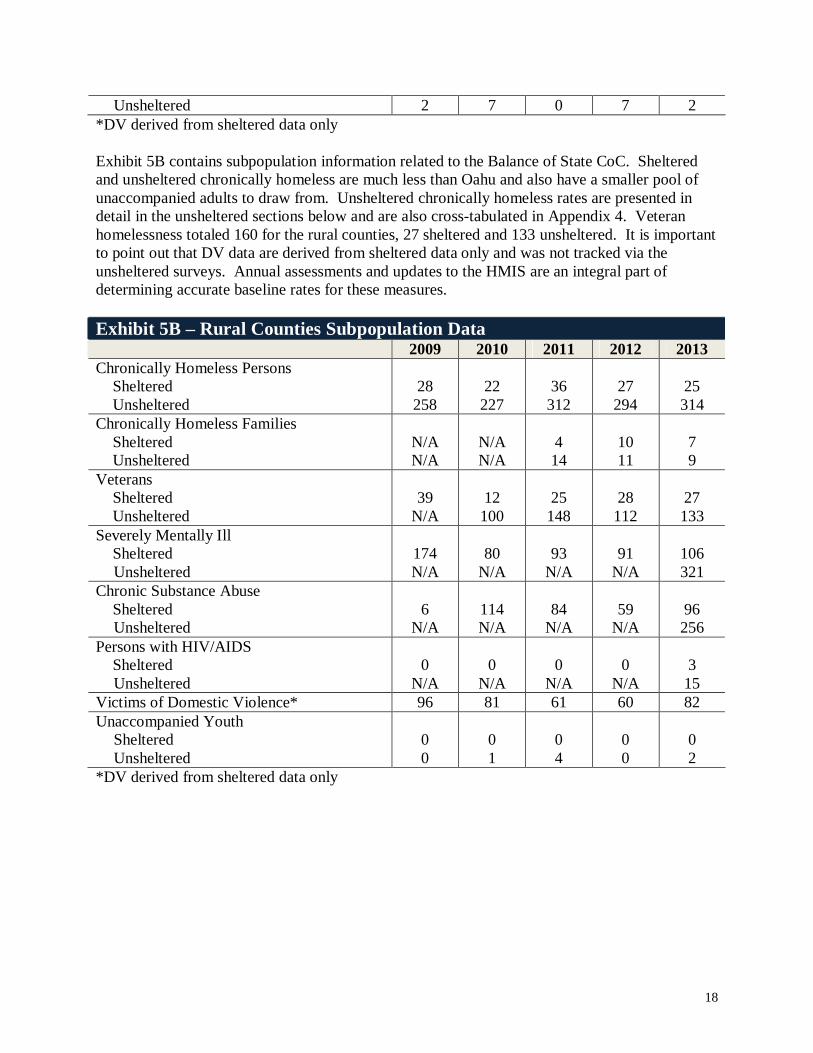
Unsheltered 2 7 0 7 2 *DV derived from sheltered data only Exhibit 5B contains subpopulation information related to the Balance of State CoC. Sheltered and unsheltered chronically homeless are much less than Oahu and also have a smaller pool of unaccompanied adults to draw from. Unsheltered chronically homeless rates are presented in detail in the unsheltered sections below and are also cross-tabulated in Appendix 4. Veteran homelessness totaled 160 for the rural counties, 27 sheltered and 133 unsheltered. It is important to point out that DV data are derived from sheltered data only and was not tracked via the unsheltered surveys. Annual assessments and updates to the HMIS are an integral part of determining accurate baseline rates for these measures. Exhibit 5B – Rural Counties Subpopulation Data 2009 2010 2011 2012 2013 Chronically Homeless Persons
Sheltered Unsheltered
28
258
22
227
36
312
27
294
25 314
Chronically Homeless Families Sheltered Unsheltered
N/A N/A
N/A N/A
4 14
10 11
7 9
Veterans Sheltered Unsheltered
39
N/A
12
100
25
148
28
112
27 133
Severely Mentally Ill Sheltered Unsheltered
174 N/A
80
N/A
93
N/A
91
N/A
106 321
Chronic Substance Abuse Sheltered Unsheltered
6
N/A
114 N/A
84
N/A
59
N/A
96 256
Persons with HIV/AIDS Sheltered Unsheltered
0
N/A
0
N/A
0
N/A
0
N/A
3
15 Victims of Domestic Violence* 96 81 61 60 82 Unaccompanied Youth
Sheltered Unsheltered
0 0
0 1
0 4
0 0
0 2
*DV derived from sheltered data only

19
Statewide Unsheltered Homeless The total number of unsheltered homeless was based on persons encountered during the seven-day count stating that they were unsheltered on the night of the 22nd. People included in the count were surveyed and usually provided unique identifying information that could be used to unduplicate survey records and perform other detailed analysis with unsheltered HMIS data. Persons congregating in places known to have homeless persons but who indicated that they were sheltered on the night of the count were not included in the count. Unsheltered persons known to outreach workers but who were not present at the sites during the count were not included in the total unsheltered number. Outreach workers were also aware of persons residing in specific locations in mountains, caves, and bushes but determined based on experience that it was unsafe to reach persons in these areas. Since these persons could not be surveyed, they were not included in the count. The 2013 summary of unsheltered homeless persons is shown in Exhibits 7A-D. The PIT estimate of unsheltered homeless on Oahu was 1,465. 170 persons were part of the 43 households with children identified during the count. The remaining 1,295 persons were either single or groups of adults (usually couples). There were 47 multi-adult households representing 102 people. The remaining 1,193 unsheltered homeless were singles. The PIT estimates for all of the rural counties are also shown. Throughout these counties there were decreases in the number of households with children and the number of persons in these households over the last year. When comparing the last two counts, there were increases in the numbers of unsheltered individuals on the islands of Hawaii and Maui, and a decrease in Kauai. Appendix 2 contains a detailed breakdown and demographic profile of the sheltered and unsheltered homeless for each CoC. The summary has also been submitted to HUD’s Homeless Data Exchange (HDX) as part of the annual required documentation. Household composition analysis was a function of how the household survey data was entered into the PIT module of the HMIS. It is important to survey and enter the data correctly, and also to review the survey data that has been entered into the PIT module in an effort to enhance the integrity of the reporting. Exhibit 7A: Oahu Unsheltered Homeless Changes 2011 Count 2012 Count 2013 Count % Change 12 - 13 Households with Children
Adults in Families Children in Families Persons in Families
Individuals Total People
44 83 94 177
1,145 1,322
41 82 92 174
1,144 1,318
43 80 90 170
1,295 1,465
4.9% -2.4% -2.2% -2.3% 13.2% 11.2%
Exhibit 7B: Maui Unsheltered Homeless Changes 2011 Count 2012 Count 2013 Count % Change 12 - 13 Households with Children
Adults in Families 43 88
18 30
15 25
-16.7% -16.7%

20
Children in Families Persons in Families
Individuals Total People
57 145 513 658
31 61 393 454
25 50 405 455
-19.4% -18.0% 3.1% 0.2%
Exhibit 7C: Kauai Unsheltered Homeless Changes 2011 Count 2012 Count 2013 Count % Change 12 - 13 Households with Children
Adults in Families Children in Families Persons in Families
Individuals Total People
19 29 38 67 172 239
24 40 49 89 212 301
19 30 48 78 195 273
-20.8% -25.0% -2.0% -12.4% -8.0% -9.3%
Exhibit 7D: Hawaii Unsheltered Homeless Changes 2011 Count 2012 Count 2013 Count % Change 12 - 13 Households with Children
Adults in Families Children in Families Persons in Families
Individuals Total People
19 29 40 69 268 337
28 52 89 141 306 447
16 30 49 79 318 397
-42.9% -42.3% -44.9% -44.0% 3.9%
-11.2% A comparison between the last four unsheltered counts is comparable in theory because the counts were performed using the same general methodology. This doesn’t preclude a disparity in numbers reported annually due to differences in resources and execution. Exhibit 8 presents the statewide data obtained during the last four unsheltered counts. Oahu increased by 11%, Maui was nearly identical to 2012, while Kauai and Hawaii decreased significantly. Overall, the statewide count rose by 70 people (2.8%). Exhibit 8: Unsheltered Homeless by County County 2010 2011 2012 2013 % Change 2012-2013 Oahu 1,374 1,322 1,318 1,465 11.2% Maui 399 658 454 455 0.2% Kauai 213 239 301 273 -9.3% Hawaii 313 337 447 397 -11.2% Total 2,299 2,556 2,520 2,590 2.8% Figure 2 on the following page displays a pie graph that outlines the total number of unsheltered enumerated throughout the state of Hawaii for 2013. Oahu had the largest proportion of unsheltered homeless (57%), followed by Maui (18%), Hawaii (15%), and Kauai (11%).

21

22
Regional Changes of Unsheltered Homelessness A comparison of the 2011 to 2013 regional unsheltered counts is presented in exhibits 10A-D. The totals in these exhibits agree with the totals in the exhibits above, however, in the below the unsheltered totals are broken down into the regions that partitioned each of the islands. The figures following exhibits 10A-D compare the regional changes graphically. Exhibit 10A: Oahu Regional Changes of Unsheltered Homeless
2011 2012 2013 Region Count (% of Total) Count (% of Total) Count (% of Total) 1: Downtown Honolulu 448 (33.9%) 403 (30.6%) 609 (41.6%) 2: East Honolulu 235 (17.8%) 304 (23.1%) 263 (18.0%) 3: Ewa 70 (5.3%) 50 (3.8%) 73 (5.0%) 4: Kaneohe to Waimanalo 96 (7.3%) 113 (8.6%) 52 (3.5%) 5: Wahiawa to North Shore 130 (9.8%) 138 (10.5%) 99 (6.8%) 6: Upper Windward 47 (3.6%) 30 (2.3%) 21 (1.4%) 7: Waianae Coast 296 (22.4%) 280 (21.2%) 348 (23.8%) Totals 1,322 1,318 1,465
Exhibit 10B: Maui Regional Changes of Unsheltered Homeless
2011 2012 2013 Region Count (% of Total) Count (% of Total) Count (% of Total) 1: Central Maui 273 (41.5%) 172 (37.9%) 140 (30.8%) 2: Lower Waiehu 130 (19.8%) 54 (11.9%) 34 (7.5%) 3: Up Country 43 (6.5%) 52 (11.5%) 18 (4.0%) 4: Lahaina 44 (6.7%) 60 (13.2%) 134 (29.5%) 5: Kihei 163 (24.8%) 109 (24.0%) 125 (27.5%) 6: Hana 5 (0.8%) 7 (1.5%) 4 (0.9%) Totals 658 (100.0%) 454 (100.0%) 455 (100.0%)

23
Exhibit 10C: Kauai Regional Changes of Unsheltered Homeless
2011 2012 2013 Region Count (% of Total) Count (% of Total) Count (% of Total) 1: West 66 (27.6%) 57 (18.9%) 67 (24.5%) 2: South 0 (0.0%) 12 (4.0%) 0 (0.0%) 3: South Central 60 (25.1%) 80 (26.6%) 88 (32.2%) 4: East 56 (23.4%) 95 (31.6%) 55 (20.1%) 5: North 57 (23.8%) 57 (18.9%) 63 (23.1%) Totals 239 (100.0%) 301 (100.0%) 273 (100.0%)

24
Exhibit 10D: Hawaii Regional Changes of Unsheltered Homeless 2011 2012 2013
Region Count (% of Total) Count (% of Total) Count (% of Total) 1: Kohala N/A N/A 1 (0.3%) 2: Honokaa N/A N/A 4 (1.0%) 3: Laupahoehoe N/A N/A 0 (0.0%) 4: Hilo N/A N/A 96 (24.2%) 5: Waiakea N/A N/A 0 (0.0%) 6. Keaau N/A N/A 51 (12.8%) 7. Pahoa N/A N/A 32 (8.1%) 8. Kau N/A N/A 71 (17.9%) 9. Konawaena N/A N/A 122 (30.7%) 10. Kealakehe N/A N/A 20 (5.0%) Totals N/A N/A 397 (100.0%) Figure 6 below presents a one-year graphic of the unsheltered homeless on the island of Hawaii. During 2013, Hawaii elected to alter the delineation of regions – effectively increasing the regions from six to ten. Please refer to prior counts for previous years’ analysis. Regions with low turnout could most likely be grouped in the future, but it is important to illustrate this year’s delineation for evaluative purposes.

25
Demographic Characteristics of the Unsheltered Adult Population Exhibits 11A-B displays demographic characteristics of the adult unsheltered population from the 2013 count. The table is divided to reflect the difference between adult individuals and adults in families. The data also includes the unaccompanied youth from the Oahu and rural counts. Exhibit 11A – Characteristics of Adult Unsheltered Individuals (HI-501) Adult Individuals
n = 1,295 Adults in Families
n = 80 Age
Under 18 18 to 30 31 to 50 51 to 61 62 and older Unknown Total
2 (0.2%) 147 (11.4%) 538 (41.5%) 396 (30.6%)
89 (6.9%) 123 (9.5%)
1,295 (100.0%)
0 (0.0%) 24 (30.0%) 47 (58.8%)
4 (5.0%) 1 (1.3%) 4 (5.0%)
80 (100.0%) Veteran Status
Yes No Unknown Refused Total
188 (14.5%) 839 (64.8%) 149 (11.5%) 119 (9.2%)
1,295 (100.0%)
3 (3.8%) 75 (93.8%)
1 (1.3%) 1 (1.3%)
80 (100.0%) Gender
Male Female Transgender Unknown Refused Total
906 (70.0%) 364 (28.1%)
3 (0.2%) 10 (0.8%) 12 (0.9%)
1,295 (100.0%)
34 (42.5%) 46 (57.5%)
0 (0.0%) 0 (0.0%) 0 (0.0%)
80 (100.0%) Length of Homelessness
Less than one year One year or longer Unknown Refused Total
243 (18.8%) 862 (66.6%)
72 (5.6%) 118 (9.1%)
1,295 (100.0%)
33 (41.3%) 47 (58.8%)
0 (0.0%) 0 (0.0%)
80 (100.0%) Number of Times Homeless
One to three times Four or more times Unknown Refused Total
784 (60.5%) 303 (23.4%)
88 (6.8%) 120 (9.3%)
1,295 (100.0%)
73 (91.3%) 4 (5.0%) 3 (3.8%) 0 (0.0%)
80 (100.0%) Disabling Condition

26
Yes No/Unk/Refused Total
694 (53.6%) 601 (46.4%)
1,295 (100.0%)
27 (33.8%) 53 (66.3%)
80 (100.0%) Exhibit 11B – Characteristics of Adult Unsheltered Individuals (HI-500) Adult Individuals
n = 918 Adults in Families
n = 85 Age
Under 18 18 to 30 31 to 50 51 to 61 62 and older Unknown Total
2 (0.2%) 162 (17.6%) 403 (43.9%) 261 (28.4%)
80 (8.7%) 10 (1.1%)
918 (100.0%)
0 (0.0%) 18 (21.2%) 54 (63.5%) 11 (12.9%)
1 (1.2%) 1 (1.2%)
85 (100.0%) Veteran Status
Yes No Unknown Refused Total
126 (13.7%) 720 (78.4%)
58 (6.3%) 14 (1.5%)
918 (100.0%)
7 (8.2%) 77 (90.6%)
1 (1.2%) 0 (0.0%)
85 (100.0%) Gender
Male Female Transgender Unknown Refused Total
663 (72.2%) 254 (27.7%)
1 (0.1%) 0 (0.0%) 0 (0.0%)
918 (100.0%)
39 (45.9%) 46 (54.1%)
0 (0.0%) 0 (0.0%) 0 (0.0%)
85 (100.0%) Length of Homelessness
Less than one year One year or longer Unknown Refused Total
341 (37.1%) 565 (61.5%)
3 (0.3%) 9 (1.0%)
918 (100.0%)
42 (49.4%) 35 (41.2%)
8 (9.4%) 0 (0.0%)
85 (100.0%) Number of Times Homeless
One to three times Four or more times Unknown Refused Total
667 (72.7%) 229 (24.9%)
9 (1.0%) 13 (1.4%)
918 (100.0%)
68 (80.0%) 11 (12.9%)
6 (7.1%) 0 (0.0%)
85 (100.0%) Disabling Condition
Yes No Unknown/Refused Total
528 (57.5%) 390 (42.5%)
0 (0.0%) 918 (100.0%)
29 (34.1%) 56 (65.9%)
0 (0.0%) 85 (100.0%)

27
Unsheltered Chronically Homeless Chronic homeless analysis used survey data to identify unsheltered chronically homeless individuals and families using HUD’s definitions. The estimated number of unsheltered chronically homeless individuals statewide is shown in Exhibits 12A-D. 2012 data are also presented to compare how the data has changed since the last count. The exhibits below display the overall change in the number of chronically homeless individuals over the last two counts for each of the four islands. The denominators used in the percent chronic calculation reflect the total cohort of unsheltered singles in both years. Members of families and couples have been excluded to adhere to HUD’s definition of a chronically homeless individual. Percent changes in the 2012 and 2013 counts are also displayed in the last column of each exhibit. Figures 7-9 illustrate the percent chronic in each region. Exhibit 12A: Oahu Chronically Homeless Singles by Region 2012 2013 % Change
Region Chronic (%) Chronic (%) 2012 - 2013 1. Downtown Honolulu 158/377 (41.9%) 231/545 (42.4%) 46.2% 2. East Honolulu 120/290 (41.4%) 103/253 (40.7%) -14.2% 3. Ewa 19/48 (39.6%) 21/42 (50.0%) 10.5% 4. Kaneohe to Waimanalo 36/69 (52.2%) 13/41 (31.7%) -63.9% 5. Wahiawa to North Shore 63/123 (51.2%) 44/91 (48.4%) -30.2% 6. Upper Windward 13/30 (43.3%) 7/21 (33.3%) -46.2% 7. Waianae Coast 76/207 (36.7%) 86/200 (43.0%) 13.2% Total 485/1,144 (42.4%) 505/1,193 (42.3%) 4.1%

28
Exhibit 12B: Maui Chronically Homeless Singles by Region 2012 2013 % Change
Region Chronic (%) Chronic (%) 2012 - 2013 1: Central Maui 33/142 (23.2%) 44/101 (43.6%) 33.3% 2: Lower Waiehu 11/35 (31.4%) 6/24 (25.0%) -45.5% 3: Up Country 6/46 (13.0%) 8/15 (53.3%) 33.3% 4: Lahaina 12/58 (20.7%) 45/120 (37.5%) 275.0% 5: Kihei 22/105 (21.0%) 45/111 (40.5%) 104.5% 6: Hana 1/7 (14.3%) 2/4 (50.0%) 100.0% Total 85/393 (21.6%) 150/375 (40.0%) 76.5%
Exhibit 12C: Kauai Chronically Homeless Singles by Region 2012 2013 % Change
Region Chronic (%) Chronic (%) 2012 - 2013 1: West 15/28 (53.6%) 12/29 (41.4%) -20.0% 2: South 3/8 (37.5%) 0/0 (0.0%) N/A 3: South Central 25/63 (39.7%) 24/53 (45.3%) -4.0% 4: East 23/61 (37.7%) 16/43 (37.2%) -30.4% 5: North 13/50 (26%) 9/44 (20.5%) -30.8% Total 79/210 (37.6%) 61/169 (36.1%) -22.8%

29
Exhibit 12D: Hawaii Chronically Homeless Singles by Region 2012 2013 % Change
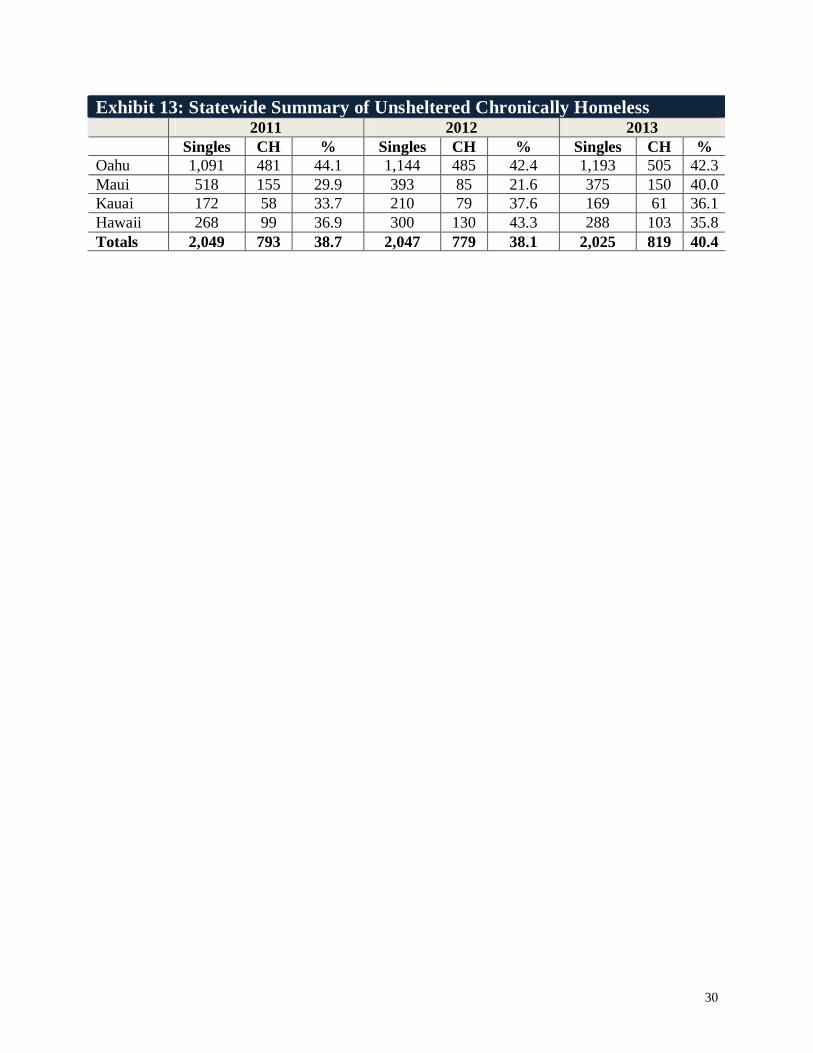
Region Chronic (%) Chronic (%) 2012 - 2013 1: Kohala N/A 0/1 (0.0%) N/A 2: Honokaa N/A 2/4 (50.0%) N/A 3: Laupahoehoe N/A 0/0 (0.0%) N/A 4: Hilo N/A 36/81 (44.4%) N/A 5: Waiakea N/A 0/0 (0.0%) N/A 6. Keaau N/A 7/21 (33.3%) N/A 7. Pahoa N/A 3/21 (14.3%) N/A 8. Kau N/A 8/34 (23.5%) N/A 9. Konawaena N/A 41/111 (36.9%) N/A 10. Kealakehe N/A 6/15 (40.0%) N/A Total N/A 103/288 (35.8%) N/A The percent change in Oahu chronically homeless from 2012 to 2013 was 4.1%. Maui had a huge spike in chronically homeless, while Kauai and Hawaii realized decreases. Apparent in the data are the large percentage changes in the regional chronically homeless. Large percentage changes from 2012 to 2013 are evident in several of the tables and are almost expected in areas with small numbers of chronically homeless. It should be noted that the chronically homeless factors such as disability, mental illness, substance abuse, HIV/AIDS status, and length and number of times homeless are all self-reported. Exhibit 13 displays aggregate chronic homeless data for the last three years. Roughly 40% of the unsheltered singles in 2013 were identified as chronic. Total chronically homeless across the state rose 2.3% when compared to 2012.
30
Exhibit 13: Statewide Summary of Unsheltered Chronically Homeless 2011 2012 2013 Singles CH % Singles CH % Singles CH % Oahu 1,091 481 44.1 1,144 485 42.4 1,193 505 42.3 Maui 518 155 29.9 393 85 21.6 375 150 40.0 Kauai 172 58 33.7 210 79 37.6 169 61 36.1 Hawaii 268 99 36.9 300 130 43.3 288 103 35.8 Totals 2,049 793 38.7 2,047 779 38.1 2,025 819 40.4

31
Recommendations for Future PIT Counts Exhibits 14A-D display tables expressing the data quality for all of the adults surveyed before data was boiled down to the unsheltered totals above. The tables display the total numbers of duplicate records, records with personal identifying information, corresponding duplication rates, unknown records from each county, and unknown and sheltered records omitted from all of the above unsheltered analysis. It is recommended that providers not enter surveys into the HMIS PIT module that they know were sheltered on the night of the count. The rate of unknown surveys should also decrease if outreach staff is accompanying volunteers and are knowledgeable with the clientele in each of the areas. Specific locations slept on the night of the count would be much more useful than responses such as car, outside, tent, streets, or beach. Coupled with improvements to the encounters survey data in the HMIS, substantial analysis can be done to capture “real time” movement of homeless persons if specific locations were denoted. Unknown/missing gender rates should be zero each year. Effectively adding zip code locations to outreach encounter surveys in the future could enable GIS reporting and analysis by legislative district, which many appear to be interested in. This could aid in more effectively targeting outreach resources and providing services to the chronically homeless. Data quality reports exist in the unsheltered section of the HMIS to determine missing/unknown rates for many universal data element fields. Ancillary analysis may be forthcoming utilizing past data sets to determine frequency of occurrence in each of the counts. Names of clients occurring in each of the counts could be isolated and used to identify chronic individuals. Identifying literally homeless clients with an encounter within an interval of the PIT date that did not appear in the count can also supplement the reporting and may indicate that the current methodology undercounts the total unsheltered. Providers may also find the tables in appendices three and four useful in helping to determine where large percentages of chronic individuals tend to congregate. Names and locations from the dataset for particular regions are also available if requested. Analysis can also be presented that is based on client ID’s from the PIT dataset with that of the unsheltered database. Requiring that shelters operate close to 100% occupancy could potentially reduce the numbers of unsheltered homelessness. Providing incentives for agencies that place and retain homeless in permanent housing situations could also improve the rate of unsheltered homelessness. Altering the mix of transitional to permanent units could also effect change. Exhibit 14A: Oahu Unsheltered Data Quality
Area Duplicate Records
Unique Records
Duplication Rate (%)
Unknown Records
Unknown Records Omitted
Sheltered Records Omitted
1 36 460 7.83 181 14 77 2 7 211 3.32 58 2 5 3 16 71 22.54 11 2 101 4 0 43 0.00 3 0 1

32
5 1 88 1.14 11 0 0 6 0 12 0.00 9 0 0 7 46 338 13.61 4 1 1
Exhibit 14B: Maui Unsheltered Data Quality
Area Duplicate Records
Unique Records
Duplication Rate (%)
Unknown Records
Unknown Records Omitted
Sheltered Records Omitted
1 11 127 8.66% 0 0 0 2 1 31 3.23% 0 0 0 3 0 13 0.00% 3 0 0 4 9 129 6.98% 0 0 0 5 5 119 4.20% 4 0 1 6 0 4 0.00% 0 0 0
Exhibit 14C: Kauai Unsheltered Data Quality
Area Duplicate Records
Unique Records
Duplication Rate (%)
Unknown Records
Unknown Records Omitted
Sheltered Records Omitted
1 1 43 2.33% 0 0 2 2 0 0 0.00% 0 0 0 3 0 74 0.00% 4 0 6 4 0 46 0.00% 2 0 2 5 0 45 0.00% 11 0 3
Exhibit 14D: Hawaii Unsheltered Data Quality
Area Duplicate Records
Unique Records
Duplication Rate (%)
Unknown Records
Unknown Records Omitted
Sheltered Records Omitted
1 1 1 100.00% 0 0 0 2 6 4 150.00% 4 4 0 3 0 0 0.00% 0 0 0 4 15 88 17.05% 7 1 19 5 0 0 0.00% 0 0 0 6 6 28 21.43% 6 1 0 7 8 18 44.44% 14 6 1 8 9 50 18.00% 6 1 0 9 97 118 82.20% 8 7 1 10 10 16 62.50% 0 0 0
Several other recommendations include: Obtaining the most current agency contact information and provide designated point of
contact for each agency. This will ensure communicating instructions and deadlines for exiting clients and updating the shelter data in the HMIS. The designated point-of-contact

33
will help data analysts get questions answered more quickly and can provide troubleshooting to streamline the shelter count process.
Improving matching between HMIS and census counts. Some providers are still having trouble making sure that all of their clients are in the HMIS system by the set deadline, which delays the sheltered analysis. All HMIS participating providers should be using the HMIS and not the manual survey instruments.
Updating homelessness and disability information in the HMIS. This information is often entered at intake and not updated by staff as disabling and length of homeless information becomes clearer. Updating records increases the accuracy and reliability of subpopulation information.
Cross reference unsheltered surveys with HMIS listings to help unduplicate clients. A number of individuals and families were deleted from the unsheltered count because they were duplicates that appeared in both the sheltered and unsheltered data. As a rule, clients appearing in both are omitted from the unsheltered count.
Agencies should not enter shelter surveys in the PIT section of the HMIS, which is used for counting unsheltered people. The data was better this year than in prior years, but could still be improved as referenced in the data quality tables above. Admin personnel should go through and weed out duplicate surveys before entering into the PIT module. Hawaii had a huge amount of duplication. In some cases this cannot be avoided if multiple agencies are responsible for data entry.
Attempt to get more detailed survey responses. Of extreme importance are the exact locations of the interview and the exact locations of where the client slept on the night of the count. This year’s count did a good job of getting distinct versus generic interview site responses; however, the location where the homeless persons slept was sometimes general in nature. Many times respondents reported sleeping in a car, tent, at the beach, on the streets, etc. This information becomes a key piece in the analysis because one can pinpoint the exact location of the chronically homeless on that specific night if that data is available. Surveyors did an excellent job of reporting the region numbers on the night of January 22, 2013, but it would be helpful to have more precise locations. This information could be used in a number of cross tabulations that outreach teams could use in the future to locate veterans, chronically homeless, families, unaccompanied youth, etc. Some descriptions lacked information about the respondent’s gender categorization and had to be marked as unknown.
Ensure there are enough appropriately trained regional coordinators. PIT Count
Coordinators improved on the execution of the count from the previous year. However, since effective coordination is imperative when carrying out an unsheltered PIT Count, it is important that enough regional coordinators are assigned to oversee specific areas and that they are aware of their roles and responsibilities to organize the field staff in their areas, provide training on completing the surveys, and to monitor coverage of sites that unsheltered persons are known to congregate.

34
Adjust surveys and training after the first day. Screening surveys that were done on the first day of the count can provide recommendations for improvement that can be implemented during the remaining days of the count. This would assist in increasing the number of surveys providing enough data to be included in the count.
According to survey coordinators and outreach workers, the overall coordination and execution of the count improved from 2012 to 2013. This year’s count made greater efforts to cover places where unsheltered persons are known to congregate, including increasing coverage of places that serve no-cost meals, which may have contributed to more unsheltered persons counted. The implementation of a coordinated “Super Wednesday” count along with continuing the count for the rest of the week provided field staff with more opportunities to encounter unsheltered persons and to revisit sites that are known to be inhabited but may have been sparsely occupied during initial visits. Additionally, the survey instruments were improved and shortened from the previous year, which made it easier for field staff to ask and receive survey responses. The methodology used in the 2013 PIT was effective for establishing accurate data for the sheltered homeless count; and volunteers and provider staff should be commended for their ability to produce another successful count of the homeless throughout the State of Hawaii.

35
Appendix 1 HI-501 Emergency, Transitional, and Safe Haven Listings as of 1/22/13 Type Organization Name Program Name DV Actual
Total Total Bed Capacity*
Utilization Rate
Area
ES Child and Family Service
Honolulu Shelter Yes 26 26 100% 1
ES Child and Family Service
Leeward Shelter Yes 32 32 100% 3
ES Family Promise of Hawaii
Windward Shelter No 12 14 86% 4
ES Family Promise of Hawaii
Honolulu Shelter No 14 14 100% 1
ES Hale Kipa Inc. Boys' Emergency Shelter
No 1 5 20% 3
ES Hale Kipa Inc. Girls' Emergency Shelter
No 2 8 25% 3
ES H5 Evans Project No 22 26 85% 1 ES IHS Kaaahi No 150 190 79% 1 ES IHS Sumner Men's Shelter No 146 200 73% 1 ES Ohana Family of the
Living God Pu`u Honua Yes 40 40 100% 6
ES Parents and Children Together
Ohia Shelter Yes 20 20 100% 4
ES River of Life Mission Lighthouse Shelter No 73 87 84% 3 ES Shelter of Wisdom Great Joy 1 No 8 8 100% 1 ES Shelter of Wisdom Great Joy 2 No 9 9 100% 1 ES Shelter of Wisdom Great Joy 3 No 7 9 78% 1 ES Shelter of Wisdom Streams of Joy 1 No 6 6 100% 1 ES Shelter of Wisdom Streams of Joy 2 No 9 9 100% 1 ES US VETS US VETS BP
HOPTEL No 5 5 100% 3
ES US VETS Respite Beds No 5 6 83% 3 ES Waianae Community
Outreach Hope for a New Beginning
No 212 317 67% 3
ES Waikiki Health Center Next Step No 173 200 87% 1 ES Windward Spouse
Abuse Shelter Hale Ola Yes 10 18 56% 4
Total 982 1,249 79% TH Alternative Structures
International Ulu Ke Kukui No 332 332 100% 7
TH Alternative Structures International
Ohana Ola O Kahumana
No 200 200 100% 7
TH Catholic Charities Hawaii
Ma`ili Land No 166 166 100% 7
TH Child and Family Service
Transitional Apartments
Yes 32 32 100% 1
TH Gregory House Programs
Comm. Residential Program
No 14 15 93% 3
TH Gregory House Programs
Gregory House No 9 11 82% 1
TH Hale Kipa Inc. TLP-Keeaumoku No 3 4 75% 1

36
Men's Shelter TH Hale Kipa Inc. TLP-Makaaloa Men's
Shelter No 3 4 75% 3
TH Hale Kipa Inc. TLP-Apaa Women's Shelter
No 3 6 50% 3
TH Ho`omau Ke Ola Lahilahi No 3 6 50% 7 TH Holonua Na `Ohana Onemalu Transitional
Shelter No 208 208 100% 3
TH Holonua Na `Ohana Weinberg Village Waimanalo
No 149 149 100% 4
TH HCAP Kumuhonua No 87 87 100% 3 TH Housing Solutions Inc. Kulaokahua No 31 31 100% 1 TH Housing Solutions Inc. Loliana No 159 159 100% 1 TH Housing Solutions Inc. Na Kolea No 63 64 98% 1 TH Housing Solutions Inc. Vancouver House No 129 129 100% 1 TH Kahikolu Ohana Hale
O Waianae KOHOW Transitional Shelter
No 96 226 42% 7
TH Steadfast Ahukini No 5 5 100% 2 TH Steadfast Hale Ulu Pono No 15 28 54% 3 TH The Salvation Army
ATS Waokanaka No 12 12 100% 1
TH The Salvation Army FTS
Ka Ohu Hou O Manoa
No 30 30 100% 2
TH U.S. Veterans Initiative Barbers Point VIP Program
No 91 98 93% 3
TH U.S. Veterans Initiative Waianae Civic Center/Pai`olu
No 232 260 89% 7
TH Women in Need Family House – Kaneohe
No 5 10 50% 4
TH Women in Need Bridge to Success - Waianae
No 7 8 88% 7
Total 2,084 2,280 91% SH Mental Health Kokua Safe Haven No 25 25 100.0% 1
Total 25 25 100.0% *Total bed capacity includes beds for households with and without children. If the actual count exceeded the total bed capacity stated on the Housing Inventory Count (HIC), the total bed capacity was adjusted to equal that of the actual count. If the actual count was less than the HIC total inventory, the total bed capacity was left unchanged. Bed capacity reflects 2012 inventory.

37
HI-500 Emergency and Transitional Listings as of 1/22/13 Type Organization Name Program Name DV Actual
Total Total Bed Capacity*
Utilization Rate
Island
ES Child and Family Services West Hawaii Domestic Abuse Shelter
Yes 11 21 52.4% Hawaii
ES Child and Family Services Hale Ohana Yes 18 19 94.7% Hawaii ES Family Life Center Ho'olalani No 34 50 68.0% Maui ES Kauai Economic
Opportunity Mana'olana Emergency
No 30 30 100.0% Kauai
ES KHAKO KHAKO Central ES No 34 69 49.3% Maui ES KHAKO KHAKO Westside ES No 34 40 85.0% Maui ES HOPE Services Hawaii Friendly Place No 25 31 80.6% Hawaii ES HOPE Services Hawaii Kihei Pua Emergency No 30 72 41.7% Hawaii ES Women Helping Women Hale Lokomaikai Yes 18 30 60.0% Maui ES YWCA of Kauai Family Violence
Shelter Yes 10 18 55.6% Kauai
Total 244 380 64.2% TH Child and Family Services Hale Kahua Paa Yes 8 20 40.0% Hawaii TH HOPE Services Hawaii Kaloko No 18 60 30.0% Hawaii TH HOPE Services Hawaii Beyond Shelter No 14 55 25.5% Hawaii TH HOPE Services Hawaii HOPE Resource
Center No 8 14 57.1% Hawaii
TH HOPE Services Hawaii Wilder House No 4 10 40.0% Hawaii TH HOPE Services Hawaii Kuleana House No 5 10 50.0% Hawaii TH Kauai Economic
Opportunity Mana'olana No 5 25 20.0% Kauai
TH Kauai Economic Opportunity
Komohana Group Home
No 4 6 66.7% Kauai
TH Kauai Economic Opportunity
Lihue Court Apartments
No 24 38 63.2% Kauai
TH KHAKO KHAKO Westside No 100 125 80.0% Maui TH KHAKO KHAKO Central No 201 201 100.0% Maui TH Hawaii Island Home for
Recovery Hawaii Island Home for Recovery
No 19 19 100.0% Hawaii
Total 410 567 72.3% *Total bed capacity includes beds for households with and without children. If the actual count exceeded the total bed capacity stated on the Housing Inventory Count (HIC), the total bed capacity was adjusted to equal that of the actual count. If the actual count was less than the HIC total inventory, the total bed capacity was left unchanged. Bed capacity reflects 2012 inventory.

38
Appendix 2: Point in Time Summary for HI-501 – Honolulu CoC Persons in Households with at least one Adult and one Child Sheltered Unsheltered Total Emergency Transitional Safe
Haven
Total Number of Households 136 389 N/A 43 568 Total Number of persons (Adults & Children)
515 1,675 N/A 170 2,360
Number of Persons (under age 18) 301 931 N/A 90 1,322 Number of Persons (18-24) 51 132 N/A 16* 199 Number of Persons (over age 24) 163 612 N/A 64* 839 * After weighting, one person was added to the 18-24 age group, three added to the over age 24 age group to account for unknown data. Persons in Households with only Children (Under Age 18) Sheltered Unsheltered Total Emergency Transitional Safe
Haven
Total Number of Households 3 0 N/A 2 5 Number of one-child Households 3 0 N/A 2 5 Number of multi-child Households 0 0 N/A 0 0 Total number of persons (under 18)
3 0 N/A 2 5
Number of children in multi-child households
0 0 N/A 0 0
Persons in Households without Children Sheltered Unsheltered Total Emergency Transitional Safe Haven Total number of Households 452 364 25 1,238 2,079 Total number of persons (Adults) 464 409 25 1,293 2,191 Number of Persons (age 18-24) 17 27 1 65* 110 Number of Persons (over age 24) 447 382 24 1,228* 2,081 * After weighting, six people were added to the 18-24 age group, 117 added to the over age 24 age group to account for unknown data. Total Households and Persons Sheltered Unsheltered Total Emergency Transitional Safe Haven Total Number of Households 591 753 25 1,283 2,652 Total number of persons 982 2,084 25 1,465 4,556 Number of children (under 18) 304 931 N/A 92 1,327 Number of Persons (18-24) 68 159 1 81 309

39
Number of Persons (over age 24) 610 994 24 1,292 2,920 Chronically Homeless Subpopulations Sheltered Unsheltered Total Emergency
Shelters Safe
Havens
Chronically Homeless Individuals 166 21 505 692 Chronically Homeless Families (Total number of families)
11 N/A 15 26
Chronically Homeless Families (Total persons in households)
41 N/A 52 93
Other Homeless Subpopulations Sheltered Unsheltered Total Persons in emergency shelters,
transitional housing, and safe havens
Total number of veterans (including female veterans)
207 191 398
Number of female veterans (subset of all vets)
16 11 27
Severely Mentally Ill 413 429 842 Chronic Substance Abuse 322 299 621 Persons with HIV/AIDS 32 22 54 DV victims 280 N/A 280

40
Point in Time Summary for HI-500 – Hawaii Balance of State CoC Persons in Households with at least one Adult and one Child Sheltered Unsheltered Total Emergency Transitional Safe
Haven
Total Number of Households 37 81 N/A 50 168 Total Number of persons (Adults & Children)
115 298 N/A 207 620
Number of Persons (under age 18) 68 172 N/A 122 362 Number of Persons (18-24) 8 21 N/A 7 36 Number of Persons (over age 24) 39 105 N/A 78* 222 * After weighting, one person was added to the over age 24 age group. Persons in Households with only Children (Under Age 18) Sheltered Unsheltered Total Emergency Transitional Safe
Haven
Total Number of Households 0 0 N/A 2 2 Number of one-child Households 0 0 N/A 2 2 Number of multi-child Households 0 0 N/A 0 0 Total number of persons (under 18)
0 0 N/A 2 2
Number of children in multi-child households
0 0 N/A 0 0
Persons in Households without Children Sheltered Unsheltered Total Emergency Transitional Safe Haven Total number of Households 125 109 0 871 1,105 Total number of persons (Adults) 129 112 0 916 1,157 Number of Persons (age 18-24) 9 5 0 78* 92 Number of Persons (over age 24) 120 107 0 838* 1,065 * After weighting, one person was added to the 18-24 age group, nine people were added to the over age 24 age group to account for unknown data. Total Households and Persons Sheltered Unsheltered Total Emergency Transitional Safe Haven Total Number of Households 162 190 0 923 1,277 Total number of persons 244 410 0 1,125 1,779 Number of children (under 18) 68 172 N/A 124 364 Number of Persons (18-24) 17 26 0 85 128 Number of Persons (over age 24) 159 212 0 916 1,287

41
Chronically Homeless Subpopulations Sheltered Unsheltered Total Emergency
Shelters Safe
Havens
Chronically Homeless Individuals 25 0 314 339 Chronically Homeless Families (Total number of families)
7 N/A 9 16
Chronically Homeless Families (Total persons in households)
20 N/A 36 56
Other Homeless Subpopulations Sheltered Unsheltered Total Persons in emergency shelters,
transitional housing, and safe havens
Total number of veterans (including female veterans)
27 133 160
Number of female veterans (subset of all vets)
4 12 16
Severely Mentally Ill 106 121 227 Chronic Substance Abuse 96 256 352 Persons with HIV/AIDS 3 15 18 DV victims 82 N/A 82

42
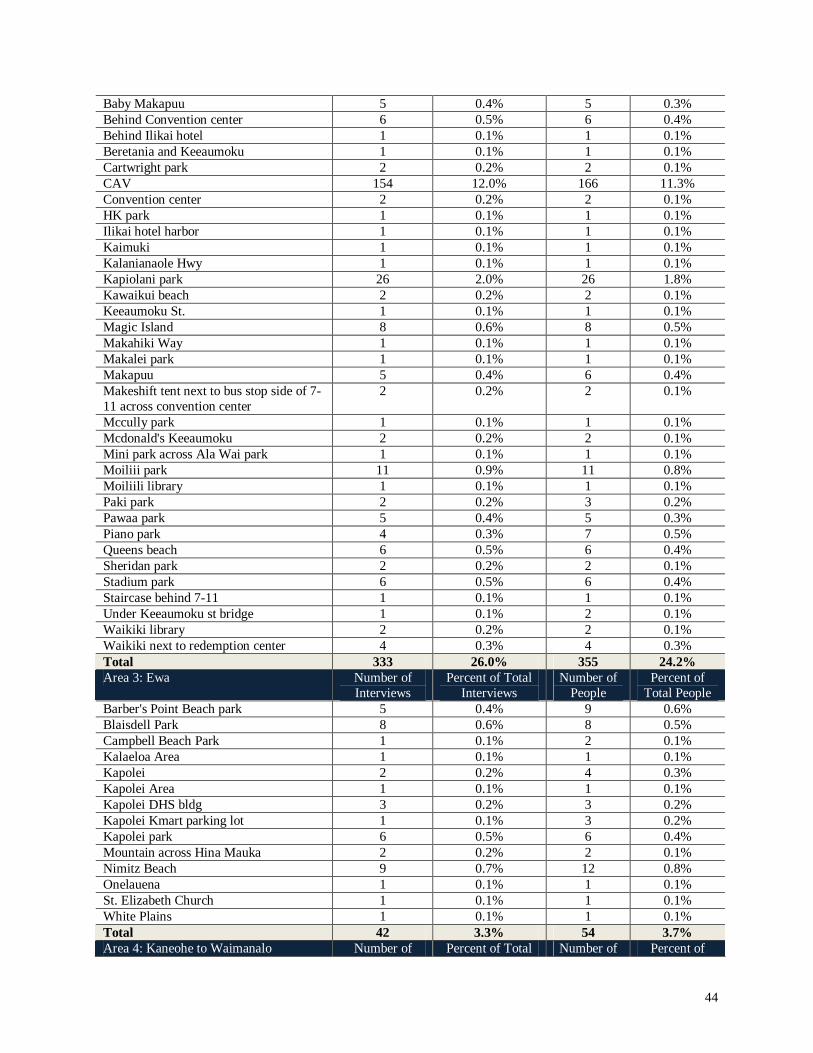
Appendix 3: Site of Interview Analysis 2013 Oahu Site of Interview Analysis
Area 1: Downtown Honolulu Number of Interviews
Percent of Total Interviews
Number of People
Percent of Total People
Aala Park 30 2.3% 31 2.1% Across from the Chevy dealership Honolulu
1 0.1% 1 0.1%
Ahui St. 2 0.2% 2 0.1% Airport 9 0.7% 9 0.6% Beretania St. 4 0.3% 4 0.3% Bishop St. 1 0.1% 1 0.1% Central Pacific Bank parking lot 1 0.1% 1 0.1% Chinatown 10 0.8% 10 0.7% Cooke & Ala Moana 1 0.1% 1 0.1% Cooke St. 3 0.2% 3 0.2% Corner of Ward & Beretania St 1 0.1% 1 0.1% Corner Of Ward Ave 1 0.1% 1 0.1% Democrat St. 1 0.1% 1 0.1% Dillingham 1 0.1% 1 0.1% Dole Park 3 0.2% 3 0.2% Downbeat Diner 1 0.1% 1 0.1% Downtown 1 0.1% 1 0.1% Downtown in front of a church 1 0.1% 1 0.1% Ft. Street mall 3 0.2% 3 0.2% Halekauwila St. 1 0.1% 1 0.1% HCC 1 0.1% 1 0.1% HCC bus stop 1 0.1% 1 0.1% Homerule St. 1 0.1% 1 0.1% Honolulu 36 2.8% 42 2.9% Honolulu by Sam Choys 1 0.1% 1 0.1% Hotel & Smith St. 1 0.1% 2 0.1% Hotel St. 21 1.6% 21 1.4% IHS 50 3.9% 51 3.5% Ilalo St 2 0.2% 2 0.1% Iwilei 6 0.5% 6 0.4% Kaaahi St. 2 0.2% 2 0.1% Kakaako 14 1.1% 21 1.4% Kakaako Park 2 0.2% 2 0.1% Kakaako Side Walk 1 0.1% 1 0.1% Kakaako Water Front 1 0.1% 1 0.1% Kapiolani St. 1 0.1% 1 0.1% Keawe St. 2 0.2% 2 0.1% Keehi Lagoon 18 1.4% 18 1.2% Kekowili St. 1 0.1% 1 0.1% King St. 15 1.2% 16 1.1% King St. behind Reno Bar 1 0.1% 1 0.1% King St. bus stop 1 0.1% 1 0.1% King St. Tesoro gas station 1 0.1% 1 0.1% Kmart Iwilei 2 0.2% 2 0.1% Kohou St. 5 0.4% 5 0.3% Koula & Ilalo 2 0.2% 2 0.1%

43
Koula St. 4 0.3% 4 0.3% Kukui & King 1 0.1% 2 0.1% Kukui St. 1 0.1% 2 0.1% Kuwili St. 2 0.2% 2 0.1% Living the Word 4 0.3% 4 0.3% Mapunapuna 2 0.2% 2 0.1% Maunakea St. 3 0.2% 3 0.2% Mccoy Pavillion 2 0.2% 2 0.1% Mokauea St. 1 0.1% 1 0.1% Mother Waldron Park 6 0.5% 7 0.5% Nimitz 12 0.9% 14 1.0% Nimitz bridge 11 0.9% 17 1.2% Nuuanu 2 0.2% 2 0.1% Pacific St 1 0.1% 1 0.1% Paintball field 2 0.2% 2 0.1% Palama settlement 1 0.1% 1 0.1% Park by Down to Earth 1 0.1% 1 0.1% Pauahi & Smith 1 0.1% 3 0.2% Pauahi St. 4 0.3% 4 0.3% Pine & Kuwili 2 0.2% 2 0.1% Pine & Sumner 1 0.1% 1 0.1% Pine St. 2 0.2% 2 0.1% Puuhale Rd. 1 0.1% 3 0.2% Queen & Keawe 1 0.1% 1 0.1% Queen & Punchbowl 1 0.1% 1 0.1% Queen & South 1 0.1% 1 0.1% Queen St 1 0.1% 1 0.1% River Of Life 55 4.3% 55 3.8% River St. 25 1.9% 25 1.7% Safe Haven 13 1.0% 13 0.9% Salvation Army Iwilei 2 0.2% 2 0.1% Sand Island 13 1.0% 13 0.9% Sand island beach park 2 0.2% 2 0.1% Sand Island Boat harbor 1 0.1% 2 0.1% School and Stillman 3 0.2% 4 0.3% Smith St. 3 0.2% 3 0.2% South St. 1 0.1% 1 0.1% State Capital 2 0.2% 2 0.1% Sumner St. 49 3.8% 49 3.3% Thomas Square Park 6 0.5% 6 0.4% Under nimitz bridge 4 0.3% 4 0.3% Ward 1 0.1% 1 0.1% Ward Ave Park 1 0.1% 1 0.1% Ward/Beretania St 1 0.1% 1 0.1% Worldwide Furnishings 1 0.1% 1 0.1% Total 519 40.5% 553 37.7% Area 2: East Honolulu Number of
Interviews Percent of Total
Interviews Number of
People Percent of
Total People Ala Moana 32 2.5% 33 2.3% Ala Moana Beach park 21 1.6% 24 1.6% Ala Wai boat harbor 3 0.2% 3 0.2% Ala Wai bridge 2 0.2% 2 0.1% Ala Wai park 4 0.3% 4 0.3% Atkinson Dr. 1 0.1% 1 0.1%
44
Baby Makapuu 5 0.4% 5 0.3% Behind Convention center 6 0.5% 6 0.4% Behind Ilikai hotel 1 0.1% 1 0.1% Beretania and Keeaumoku 1 0.1% 1 0.1% Cartwright park 2 0.2% 2 0.1% CAV 154 12.0% 166 11.3% Convention center 2 0.2% 2 0.1% HK park 1 0.1% 1 0.1% Ilikai hotel harbor 1 0.1% 1 0.1% Kaimuki 1 0.1% 1 0.1% Kalanianaole Hwy 1 0.1% 1 0.1% Kapiolani park 26 2.0% 26 1.8% Kawaikui beach 2 0.2% 2 0.1% Keeaumoku St. 1 0.1% 1 0.1% Magic Island 8 0.6% 8 0.5% Makahiki Way 1 0.1% 1 0.1% Makalei park 1 0.1% 1 0.1% Makapuu 5 0.4% 6 0.4% Makeshift tent next to bus stop side of 7-11 across convention center
2 0.2% 2 0.1%
Mccully park 1 0.1% 1 0.1% Mcdonald's Keeaumoku 2 0.2% 2 0.1% Mini park across Ala Wai park 1 0.1% 1 0.1% Moiliii park 11 0.9% 11 0.8% Moiliili library 1 0.1% 1 0.1% Paki park 2 0.2% 3 0.2% Pawaa park 5 0.4% 5 0.3% Piano park 4 0.3% 7 0.5% Queens beach 6 0.5% 6 0.4% Sheridan park 2 0.2% 2 0.1% Stadium park 6 0.5% 6 0.4% Staircase behind 7-11 1 0.1% 1 0.1% Under Keeaumoku st bridge 1 0.1% 2 0.1% Waikiki library 2 0.2% 2 0.1% Waikiki next to redemption center 4 0.3% 4 0.3% Total 333 26.0% 355 24.2% Area 3: Ewa Number of
Interviews Percent of Total
Interviews Number of
People Percent of
Total People Barber's Point Beach park 5 0.4% 9 0.6% Blaisdell Park 8 0.6% 8 0.5% Campbell Beach Park 1 0.1% 2 0.1% Kalaeloa Area 1 0.1% 1 0.1% Kapolei 2 0.2% 4 0.3% Kapolei Area 1 0.1% 1 0.1% Kapolei DHS bldg 3 0.2% 3 0.2% Kapolei Kmart parking lot 1 0.1% 3 0.2% Kapolei park 6 0.5% 6 0.4% Mountain across Hina Mauka 2 0.2% 2 0.1% Nimitz Beach 9 0.7% 12 0.8% Onelauena 1 0.1% 1 0.1% St. Elizabeth Church 1 0.1% 1 0.1% White Plains 1 0.1% 1 0.1% Total 42 3.3% 54 3.7% Area 4: Kaneohe to Waimanalo Number of Percent of Total Number of Percent of

45
Interviews Interviews People Total People Kailua Library 1 0.1% 1 0.1% Kaneohe bay shopping center bus stop 1 0.1% 1 0.1% Kaneohe civic park 2 0.2% 2 0.1% Kaneohe district park 7 0.5% 7 0.5% Kaneohe in front of Sprint 1 0.1% 1 0.1% Kaneohe library park 5 0.4% 5 0.3% Kaneohe playground 2 0.2% 2 0.1% Kaneohe welfare office 2 0.2% 2 0.1% Lauwaa beach park 4 0.3% 4 0.3% McDonalds Parking Lot 3 0.2% 3 0.2% Waimanalo Beach Park 18 1.4% 24 1.6% Waimanalo Gym 1 0.1% 1 0.1% Total 47 3.7% 53 3.6% Area 5: Wahiawa to North Shore Number of
Interviews Percent of Total
Interviews Number of
People Percent of
Total People Ali'i Beach park 14 1.1% 14 1.0% Behind Wahiawa Hospital 1 0.1% 1 0.1% Cane Rd. 1 0.1% 1 0.1% Haleiwa 5 0.4% 7 0.5% Haleiwa Beach Park 10 0.8% 10 0.7% Haleiwa bus stop in front of Pizza Hut 1 0.1% 1 0.1% Haleiwa Bypass 2 0.2% 2 0.1% Haleiwa Gym 10 0.8% 10 0.7% Haleiwa Park 4 0.3% 4 0.3% Haleiwa Rec Center 3 0.2% 3 0.2% Haleiwa Town 1 0.1% 1 0.1% Kaiaka Beach Park 8 0.6% 8 0.5% Laniakea 2 0.2% 2 0.1% Mokuleia 1 0.1% 1 0.1% Northshore 2 0.2% 5 0.3% Paalaa Rd 2 0.2% 2 0.1% Pupukea Beach Park 3 0.2% 3 0.2% Wahiawa 7 0.5% 7 0.5% Wahiawa Welfare Office 1 0.1% 1 0.1% Wahiawa/Center St 3 0.2% 3 0.2% Wahiawa/Store Front 2 0.2% 2 0.1% Waialua Rec Center 9 0.7% 10 0.7% Total 92 7.2% 98 6.7% Area 6: Upper Windward Number of
Interviews Percent of Total
Interviews Number of
People Percent of
Total People Hauula beach park 1 0.1% 1 0.1% Hauula masa's liquor store 2 0.2% 2 0.1% Heeia state park 1 0.1% 1 0.1% Hygenic store Area 6 2 0.2% 2 0.1% Kahaluu beach park 1 0.1% 1 0.1% Rainbow Castle 1 0.1% 1 0.1% Total 8 0.6% 8 0.5% Area 7: Waianae Coast Number of
Interviews Percent of Total
Interviews Number of
People Percent of
Total People Avilla's Property 13 1.0% 13 0.9% Behind Hawaii Seders church 2 0.2% 2 0.1% Behind Kaiser Nanakuli 10 0.8% 12 0.8% Black Rock 5 0.4% 6 0.4%

46
Depots 5 0.4% 6 0.4% Guardrails 1 0.1% 1 0.1% Juanito's Property 15 1.2% 20 1.4% Kahe Point 2 0.2% 2 0.1% Kea'au Beach Park 12 0.9% 23 1.6% Maili Beach Park 7 0.5% 11 0.8% Makaha Beach 3 0.2% 3 0.2% Mt. Lahilahi 2 0.2% 2 0.1% Pokai Bay 4 0.3% 4 0.3% Puhawai Rd. 8 0.6% 8 0.5% Puka Pants 10 0.8% 12 0.8% Riverside 1 0.1% 1 0.1% Sewers Beach 2 0.2% 2 0.1% Tracks 7 0.5% 7 0.5% Ulehawa Beach Park 13 1.0% 13 0.9% Uluwehi beach 2 0.2% 2 0.1% Waianae 11 0.9% 16 1.1% Waianae Boat Harbor 85 6.6% 146 10.0% Waianae Valley 1 0.1% 3 0.2% Waikomo 5 0.4% 5 0.3% WCCHC 13 1.0% 21 1.4% Zablan Beach 3 0.2% 3 0.2% Total 242 18.9% 344 23.5%

47
2013 Maui Site of Interview Analysis Area 1: Central Maui Number of
Interviews Percent of Total
Interviews Number of
People Percent of Total
People Baldwin Park 1 0.2% 1 0.2% Central Maui 11 2.7% 12 2.6% Central Office 1 0.2% 1 0.2% Christ the King Church
5 1.2% 8 1.8%
Farm 7 1.7% 7 1.5% FLC 38 9.4% 46 10.1% Harbor 1 0.2% 1 0.2% Kahului 7 1.7% 9 2.0% Kahului McDonalds 1 0.2% 1 0.2% Kahului Safeway 1 0.2% 1 0.2% Kanaha 1 0.2% 1 0.2% Kea St Wailuku 1 0.2% 1 0.2% KHAKO Central 4 1.0% 7 1.5% Paia beach park 1 0.2% 1 0.2% Pii Hana 2 0.5% 2 0.4% SA Kahului Safehaven 46 11.4% 47 10.3% Wailuku 6 1.5% 6 1.3% Wailuku Farm 4 1.0% 16 3.5% Total 138 34.2% 168 36.9% Area 2: Lower Waiehu Number of
Interviews Percent of Total
Interviews Number of
People Percent of Total
People Kahekili Hwy Waihee 1 0.2% 2 0.4% Lower Waiehu 5 1.2% 5 1.1% Lower Waiehu River Mouth
6 1.5% 9 2.0%
Puuohala & Kahekili Hwy
7 1.7% 7 1.5%
Waiehu Beach Rd 2 0.5% 3 0.7% Waihee Kahekili Hwy 1 0.2% 1 0.2% Total 22 5.4% 27 5.9% Area 3: Upcountry Number of
Interviews Percent of Total
Interviews Number of
People Percent of Total
People Haiku 1 0.2% 1 0.2% Makawao 3 0.7% 3 0.7% Makawao behind church
1 0.2% 1 0.2%
Upcountry 1 0.2% 1 0.2% Total 6 1.5% 6 1.3% Area 4: Lahaina Number of
Interviews Percent of Total
Interviews Number of
People Percent of Total
People Banyan Tree Front St Lahaina
7 1.7% 9 2.0%
Empty lot across Longs loading dock
1 0.2% 1 0.2%
Front St beach park 1 0.2% 1 0.2% Kahana FMS 1 0.2% 2 0.4% KHAKO Westside 1 0.2% 1 0.2% Lahaina 5 1.2% 7 1.5% Lahaina Banyan Tree 2 0.5% 2 0.4% Lahaina Camp 1 0.2% 1 0.2%

48
Lahaina FMS 10 2.5% 10 2.2% Lahaina train station parking lot
1 0.2% 1 0.2%
Launiapoko Beach 1 0.2% 1 0.2% Library Park Front St Lahaina
1 0.2% 1 0.2%
Olowalu camp 6 1.5% 6 1.3% Open area behind Shell gas station
1 0.2% 1 0.2%
Puamana Park 1 0.2% 4 0.9% SA Lahaina Drop In Center
80 19.8% 80 17.6%
Total 120 29.7% 128 28.1% Area 5: Kihei Number of
Interviews Percent of Total
Interviews Number of
People Percent of Total
People Hale Kau Kau 2 0.5% 4 0.9% Kalama Park 5 1.2% 7 1.5% Kam 3 4 1.0% 4 0.9% Kiawe forest Kihei 1 0.2% 1 0.2% Kiawe wood dive spot 1 0.2% 1 0.2% Kihei 30 7.4% 31 6.8% Kihei Canoe Club 10 2.5% 11 2.4% South Kihei 1 0.2% 1 0.2% St Theresa's Church 54 13.4% 56 12.3% Waipuilani 7 1.7% 7 1.5% Total 115 28.5% 123 27.0% Area 6: Hana Number of
Interviews Percent of Total
Interviews Number of
People Percent of Total
People Field 1 0.2% 1 0.2% Hana 2 0.5% 2 0.4% Total 3 0.7% 3 0.7%
49
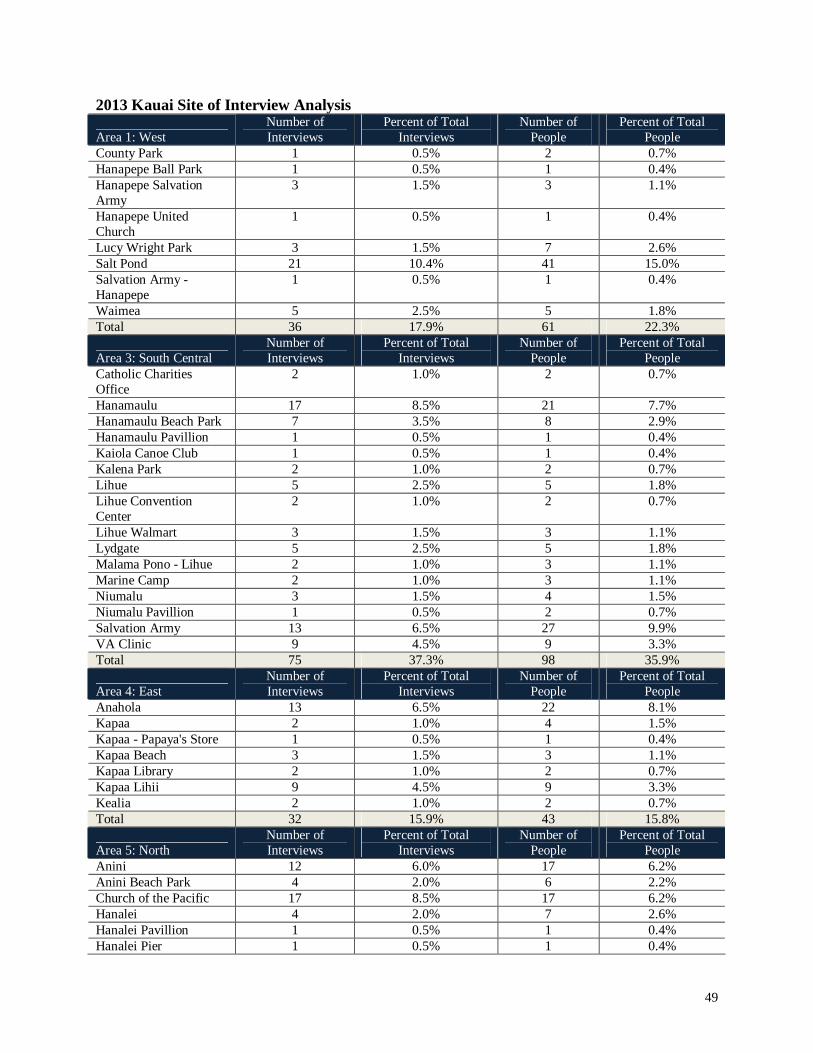
2013 Kauai Site of Interview Analysis
Area 1: West Number of Interviews
Percent of Total Interviews
Number of People
Percent of Total People
County Park 1 0.5% 2 0.7% Hanapepe Ball Park 1 0.5% 1 0.4% Hanapepe Salvation Army
3 1.5% 3 1.1%
Hanapepe United Church
1 0.5% 1 0.4%
Lucy Wright Park 3 1.5% 7 2.6% Salt Pond 21 10.4% 41 15.0% Salvation Army - Hanapepe
1 0.5% 1 0.4%
Waimea 5 2.5% 5 1.8% Total 36 17.9% 61 22.3%
Area 3: South Central Number of Interviews
Percent of Total Interviews
Number of People
Percent of Total People
Catholic Charities Office
2 1.0% 2 0.7%
Hanamaulu 17 8.5% 21 7.7% Hanamaulu Beach Park 7 3.5% 8 2.9% Hanamaulu Pavillion 1 0.5% 1 0.4% Kaiola Canoe Club 1 0.5% 1 0.4% Kalena Park 2 1.0% 2 0.7% Lihue 5 2.5% 5 1.8% Lihue Convention Center
2 1.0% 2 0.7%
Lihue Walmart 3 1.5% 3 1.1% Lydgate 5 2.5% 5 1.8% Malama Pono - Lihue 2 1.0% 3 1.1% Marine Camp 2 1.0% 3 1.1% Niumalu 3 1.5% 4 1.5% Niumalu Pavillion 1 0.5% 2 0.7% Salvation Army 13 6.5% 27 9.9% VA Clinic 9 4.5% 9 3.3% Total 75 37.3% 98 35.9%
Area 4: East Number of Interviews
Percent of Total Interviews
Number of People
Percent of Total People
Anahola 13 6.5% 22 8.1% Kapaa 2 1.0% 4 1.5% Kapaa - Papaya's Store 1 0.5% 1 0.4% Kapaa Beach 3 1.5% 3 1.1% Kapaa Library 2 1.0% 2 0.7% Kapaa Lihii 9 4.5% 9 3.3% Kealia 2 1.0% 2 0.7% Total 32 15.9% 43 15.8%
Area 5: North Number of Interviews
Percent of Total Interviews
Number of People
Percent of Total People
Anini 12 6.0% 17 6.2% Anini Beach Park 4 2.0% 6 2.2% Church of the Pacific 17 8.5% 17 6.2% Hanalei 4 2.0% 7 2.6% Hanalei Pavillion 1 0.5% 1 0.4% Hanalei Pier 1 0.5% 1 0.4%

50
Hanalei pine trees 1 0.5% 1 0.4% Kilauea 7 3.5% 7 2.6% Kilauea Farm 3 1.5% 3 1.1% St. William's Church 7 3.5% 10 3.7% Wainiha 1 0.5% 1 0.4% Total 58 28.9% 71 26.0%

51
2013 Hawaii Site of Interview Analysis
Area 1: Kohala Number of Interviews
Percent of Total Interviews
Number of People
Percent of Total People
Mahukona 1 0.3% 1 0.3% Total 1 0.3% 1 0.3%
Area 2: Honokaa Number of Interviews
Percent of Total Interviews
Number of People
Percent of Total People
Spencer Beach 3 0.9% 3 0.8% Waipio valley 5 1.6% 5 1.3% Total 8 2.5% 8 2.0%
Area 4: Hilo Number of Interviews
Percent of Total Interviews
Number of People
Percent of Total People
Bandstand Hilo 2 0.6% 2 0.5% Bayfront 7 2.2% 8 2.0% Bayfront beach lighthouse 2 0.6% 2 0.5% Bayfront behind Shell gas station
1 0.3% 1 0.3%
Bayfront parking lot 2 0.6% 2 0.5% Bus terminal 9 2.8% 9 2.3% Hilo 116 Kapiolani 1 0.3% 1 0.3% Hilo food court 1 0.3% 1 0.3% Hilo hotel 1 0.3% 1 0.3% Hilo lagoon 1 0.3% 1 0.3% Hilo town 2 0.6% 2 0.5% HRC 4 1.3% 7 1.8% Kapaka St Hilo 1 0.3% 3 0.8% Kawamoto Swimming Pool 1 0.3% 2 0.5% KTA Puainako Hilo 1 0.3% 1 0.3% Lincoln Park 6 1.9% 6 1.5% Lincoln park gazibo 4 1.3% 4 1.0% Lincoln park tennis courts 3 0.9% 3 0.8% Mooheau park 1 0.3% 1 0.3% Mooheau terminal 2 0.6% 4 1.0% Ponohawai & Manono 1 0.3% 1 0.3% Power Self Storage 1 0.3% 1 0.3% Salvation Army Hilo 8 2.5% 8 2.0% Shell Gas Station Hilo 2 0.6% 2 0.5% Soccer Field 4 1.3% 4 1.0% Starfire Sanctuary 3 0.9% 3 0.8% Suisan Bridge 1 0.3% 1 0.3% Suisan Fishmarket 1 0.3% 1 0.3% Under His Wings 7 2.2% 7 1.8% Wailoa river by the bridge 1 0.3% 1 0.3% Wailoa State park 10 3.1% 11 2.8% Total 91 28.6% 101 25.4%
Area 5: Waiakea Number of Interviews
Percent of Total Interviews
Number of People
Percent of Total People
Waiakea Starbucks 1 0.3% 1 0.3% Total 1 0.3% 1 0.3%
Area 6: Keaau Number of Interviews
Percent of Total Interviews
Number of People
Percent of Total People
Eden Rock 8 2.5% 17 4.3% Eden Rock Rd 12 1 0.3% 1 0.3% Eden Rock Rd 14 2 0.6% 3 0.8%

52
Eden Rock Rd 15 2 0.6% 2 0.5% Eden Rock Rd 9 1 0.3% 3 0.8% Enos Rd bushes 1 0.3% 1 0.3% Hawaiian Acres 4 1.3% 8 2.0% Kurtistown Assembly of God 1 0.3% 7 1.8% Methodist Church 1 0.3% 1 0.3% Mountain View 1 0.3% 1 0.3% Puna Baptist 1 0.3% 1 0.3% South Kopua 1 0.3% 1 0.3% Total 24 7.5% 46 11.6%
Area 7: Pahoa Number of Interviews
Percent of Total Interviews
Number of People
Percent of Total People
Cinderland Eco Village 7 2.2% 11 2.8% Ed's Farm 1 0.3% 1 0.3% Hot Ponds 2 0.6% 2 0.5% Pahoa Community Center 8 2.5% 8 2.0% Papaya Farms Rd. 7 2.2% 7 1.8% Pohiki Road 1 0.3% 5 1.3% Total 26 8.2% 34 8.6%
Area 8: Kau Number of Interviews
Percent of Total Interviews
Number of People
Percent of Total People
Beach 1 0.3% 1 0.3% HOVE 9 2.8% 15 3.8% HOVE Community Center 1 0.3% 1 0.3% HOVE Malama Mart 2 0.6% 2 0.5% Kau Paradise Parkway 1 0.3% 1 0.3% Kawaihae Harbor 1 0.3% 1 0.3% Ocean View 5 1.6% 14 3.5% Ocean View Community Center 2 0.6% 8 2.0% On the beach 1 0.3% 1 0.3% Paradise & Lei 1 0.3% 5 1.3% Paradise Parkway 2 0.6% 5 1.3% Punaluu Campground 3 0.9% 3 0.8% Total 29 9.1% 57 14.4%
Area 9: Konawaena Number of Interviews
Percent of Total Interviews
Number of People
Percent of Total People
Alii Dr. Kona 2 0.6% 2 0.5% Alii Drive Seawall 5 1.6% 5 1.3% Beach 2 0.6% 2 0.5% Behind Jack in the Box 1 0.3% 1 0.3% Downtown McDonalds 1 0.3% 1 0.3% Food Pantry 2 0.6% 2 0.5% Friendly Place 43 13.5% 47 11.8% Hale Halawai 6 1.9% 6 1.5% Hilo Hatties 3 0.9% 3 0.8% Honokahau Harbor 4 1.3% 4 1.0% Horseshoe pits 1 0.3% 1 0.3% Industrial Area 1 0.3% 1 0.3% Kahaluu Beach 5 1.6% 5 1.3% Kailua pier 1 0.3% 1 0.3% Kama'aina hotel 1 0.3% 1 0.3% Keauhou Pier 1 0.3% 1 0.3% Keei 1 0.3% 1 0.3% Keei beach 2 0.6% 3 0.8%

53
Kona 1 0.3% 1 0.3% Kona McDonalds 5 1.6% 5 1.3% Kona Old Industrial 1 0.3% 1 0.3% Kona Pawai Place 1 0.3% 1 0.3% Kona Pool 1 0.3% 1 0.3% Kona town 1 0.3% 5 1.3% Mokuaikaua 9 2.8% 10 2.5% Mokuaikaua church 7 2.2% 7 1.8% Old Airport 13 4.1% 14 3.5% Old Airport beach area 1 0.3% 1 0.3% Old Airport park 2 0.6% 2 0.5% Old Airport tavern 2 0.6% 2 0.5% Old Industrial Area 1 0.3% 1 0.3% Painted Church Napoopoo 4 1.3% 4 1.0% Salvation Army Kona 3 0.9% 3 0.8% Shell Gas Station Kona 1 0.3% 1 0.3% Streets by HOPE 1 0.3% 1 0.3% Swimming pool 1 0.3% 1 0.3% Total 137 43.1% 148 37.3%
Area 10: Kealakehe Number of Interviews
Percent of Total Interviews
Number of People
Percent of Total People
Puako Beach 1 0.3% 1 0.3% Total 1 0.3% 1 0.3%

54
Appendix 4: Single Unsheltered Chronically Homeless
2013 Oahu Unsheltered Chronic Homeless by Region Location of CH Adults
Region 1
Region 2
Region 3
Region 4
Region 5
Region 6
Region 7 Total % of
Total Aala Park 13 0 0 0 0 0 0 13 2.6% Ahui St. 1 0 0 0 0 0 0 1 0.2% Aiea 0 0 2 0 0 0 0 2 0.4% Ala Moana 0 5 0 0 0 0 0 5 1.0% Ala Moana area 0 1 0 0 0 0 0 1 0.2% Ala Moana beach park
0 4 0 0 0 0 0 4 0.8%
Ala Moana blvd streets
0 3 0 0 0 0 0 3 0.6%
Ala Moana bus stop 0 2 0 0 0 0 0 2 0.4% Ala Wai 0 1 0 0 0 0 0 1 0.2% Ala Wai boat harbor 0 3 0 0 0 0 0 3 0.6% Ala Wai park 0 1 0 0 0 0 0 1 0.2% Alii Beach 0 0 0 0 4 0 0 4 0.8% Aloha Tower 1 0 0 0 0 0 0 1 0.2% Baby Makapuu tent 0 3 0 0 0 0 0 3 0.6% Barber's Point beach 0 0 1 0 0 0 0 1 0.2% Bathroom 0 0 0 0 0 1 0 1 0.2% Beach 0 1 0 0 0 0 0 1 0.2% Beach in Waianae 0 0 0 0 0 0 2 2 0.4% Behind Convention Center
0 1 0 0 0 0 0 1 0.2%
Behind Kaiser Nanakuli
0 0 0 0 0 0 4 4 0.8%
Bench 0 1 0 0 0 0 0 1 0.2% Beretania St. 2 0 0 0 0 0 0 2 0.4% Black Rock 0 0 0 0 0 0 1 1 0.2% Blaisdell Park 0 0 1 0 0 0 0 1 0.2% Boat 1 0 0 0 0 0 0 1 0.2% Bus 40 1 0 0 0 0 0 0 1 0.2% Bus stop 1 0 0 0 0 0 0 1 0.2% By City Mill 1 0 0 0 0 0 0 1 0.2% By Satellite City Hall 1 0 0 0 0 0 0 1 0.2% Car 1 0 0 2 0 1 0 4 0.8% Center St. 0 0 0 0 2 0 0 2 0.4% Central Intermediate school
1 0 0 0 0 0 0 1 0.2%
Chinatown 11 0 0 0 0 0 0 11 2.2% Corner of furniture store across Alapai St.
1 0 0 0 0 0 0 1 0.2%
Corner of Ward & Beretania
1 0 0 0 0 0 0 1 0.2%
Democrat St. 1 0 0 0 0 0 0 1 0.2% Depots 0 0 0 0 0 0 1 1 0.2% Diamond Head 0 1 0 0 0 0 0 1 0.2% Dillingham bus stop 1 0 0 0 0 0 0 1 0.2% District park 0 0 0 1 0 0 0 1 0.2%

55
Dole Park 1 0 0 0 0 0 0 1 0.2% Downtown 5 0 0 0 0 0 0 5 1.0% Ewa 0 0 1 0 0 0 0 1 0.2% Forest area by Heeia state park
0 0 0 0 0 1 0 1 0.2%
Ft. St. mall 2 0 0 0 0 0 0 2 0.4% Halawa 0 0 1 0 0 0 0 1 0.2% Haleiwa 0 0 0 0 5 0 0 5 1.0% Haleiwa beach 0 0 0 0 5 0 0 5 1.0% Haleiwa beach in van 0 0 0 0 1 0 0 1 0.2% Haleiwa beach park 0 0 0 0 2 0 0 2 0.4% Haleiwa beach park bathroom
0 0 0 0 1 0 0 1 0.2%
Haleiwa boat harbor 0 0 0 0 1 0 0 1 0.2% Haleiwa by-pass 0 0 0 0 1 0 0 1 0.2% Haleiwa town 0 0 0 0 5 0 0 5 1.0% Hauula beach park 0 0 0 0 0 1 0 1 0.2% Honolulu 46 0 0 0 0 0 0 46 9.1% Honolulu streets 6 0 0 0 0 0 0 6 1.2% Hotel St. 11 0 0 0 0 0 0 11 2.2% Ilalo St. 1 0 0 0 0 0 0 1 0.2% In a bus on property 0 0 0 0 0 0 1 1 0.2% In a Matson container 0 0 0 0 0 0 1 1 0.2% In a tent 1 0 0 0 0 0 0 1 0.2% In bus on Avilla's property
0 0 0 0 0 0 1 1 0.2%
In car 0 0 0 1 0 0 1 2 0.4% Iwilei 3 0 0 0 0 0 0 3 0.6% Juanito's Property 0 0 0 0 0 0 1 1 0.2% Kailua 0 0 0 1 0 0 0 1 0.2% Kailua streets 0 0 0 1 0 0 0 1 0.2% Kaimuki 0 2 0 0 0 0 0 2 0.4% Kakaako 3 0 0 0 0 0 0 3 0.6% Kakaako in vehicle 1 0 0 0 0 0 0 1 0.2% Kakaako park 5 0 0 0 0 0 0 5 1.0% Kakaako park in van 1 0 0 0 0 0 0 1 0.2% Kalaeloa in car 0 0 1 0 0 0 0 1 0.2% Kalaeloa in tent 0 0 1 0 0 0 0 1 0.2% Kalihi 2 0 0 0 0 0 0 2 0.4% Kaneohe district park in tent
0 0 0 1 0 0 0 1 0.2%
Kapahulu Ave. 0 2 0 0 0 0 0 2 0.4% Kapiolani & Piikoi 0 1 0 0 0 0 0 1 0.2% Kapiolani park 0 7 0 0 0 0 0 7 1.4% Kapolei bank 0 0 1 0 0 0 0 1 0.2% Kapolei by DHS bldg 0 0 2 0 0 0 0 2 0.4% Kapolei in car 0 0 1 0 0 0 0 1 0.2% Kapolei park 0 0 4 0 0 0 0 4 0.8% Kapolei Water Park 0 0 1 0 0 0 0 1 0.2% Kapolei welfare bldg 0 0 1 0 0 0 0 1 0.2% Kawaikui beach 0 1 0 0 0 0 0 1 0.2% KCC 0 1 0 0 0 0 0 1 0.2% Kea'au beach park 0 0 0 0 0 0 3 3 0.6% Keeamouku St. 0 2 0 0 0 0 0 2 0.4%

56
Keeaumoku Wal Mart area
0 1 0 0 0 0 0 1 0.2%
Keehi Lagoon park 2 0 0 0 0 0 0 2 0.4% Keehi small boat harbor
1 0 0 0 0 0 0 1 0.2%
King St. 3 0 0 0 0 0 0 3 0.6% King St. bus stop 2 0 0 0 0 0 0 2 0.4% Kohou St. 4 0 0 0 0 0 0 4 0.8% Kuwili St 3 0 0 0 0 0 0 3 0.6% Laniakea 0 0 0 0 7 0 0 7 1.4% Laniakea in car 0 0 0 0 3 0 0 3 0.6% Living in bus on property
0 0 0 0 0 0 6 6 1.2%
Living in crate on property
0 0 0 0 0 0 1 1 0.2%
Living in van on property
0 0 0 0 0 0 3 3 0.6%
Maili beach 0 0 0 0 0 0 1 1 0.2% Makaha beach 0 0 0 0 0 0 4 4 0.8% Makahiki Way 0 1 0 0 0 0 0 1 0.2% Makalei park 0 1 0 0 0 0 0 1 0.2% Makiki area 0 1 0 0 0 0 0 1 0.2% Malaekahana 0 1 0 0 0 0 0 1 0.2% Manoa park 0 1 0 0 0 0 0 1 0.2% Maunakea St 2 0 0 0 0 0 0 2 0.4% Mccully park 0 1 0 0 0 0 0 1 0.2% Mckinley H.S. 2 0 0 0 0 0 0 2 0.4% Mini park across Ala Wai park
0 1 0 0 0 0 0 1 0.2%
Moiliii park 0 3 0 0 0 0 0 3 0.6% Moiliili library 0 1 0 0 0 0 0 1 0.2% Moiliili park 0 2 0 0 0 0 0 2 0.4% Mokauea St. 1 0 0 0 0 0 0 1 0.2% Monsarrat Ave. bus stop
0 1 0 0 0 0 0 1 0.2%
Mother Waldron Park 1 0 0 0 0 0 0 1 0.2% Mountain area 0 1 0 0 0 0 0 1 0.2% Mt. Lahilahi 0 0 0 0 0 0 1 1 0.2% Nimitz 1 0 0 0 0 0 0 1 0.2% Nimitz Beach 0 0 1 0 0 0 0 1 0.2% Nimitz Bridge 1 0 0 0 0 0 0 1 0.2% Nimitz Kmart 1 0 0 0 0 0 0 1 0.2% Nimitz under the bridge
2 0 0 0 0 0 0 2 0.4%
Outside 1 3 0 0 0 0 0 4 0.8% Paalaa Rd 0 0 0 0 2 0 0 2 0.4% Paki park 0 1 0 0 0 0 0 1 0.2% Park 13 3 0 2 0 0 0 18 3.6% Pauahi St. 1 0 0 0 0 0 0 1 0.2% Pawaa park 0 2 0 0 0 0 0 2 0.4% Pokai Bay 0 0 0 0 0 0 1 1 0.2% Puka Pants 0 0 0 0 0 0 4 4 0.8% Punchbowl by the cemetary
1 0 0 0 0 0 0 1 0.2%

57
Punchbowl St 1 0 0 0 0 0 0 1 0.2% Pupukea beach 0 0 0 0 1 0 0 1 0.2% Queen St 1 0 0 0 0 0 0 1 0.2% Queen St. under doorway
1 0 0 0 0 0 0 1 0.2%
Queens beach 0 1 0 0 0 0 0 1 0.2% River of Life outside 1 0 0 0 0 0 0 1 0.2% River St 14 0 0 0 0 0 0 14 2.8% Rode circle island bus all night
0 0 0 0 0 0 1 1 0.2%
Salvation Army in a box
1 0 0 0 0 0 0 1 0.2%
Sand Island 3 0 0 0 0 0 0 3 0.6% Sand island beach park
2 0 0 0 0 0 0 2 0.4%
Sand Island Boat Harbor
1 0 0 0 0 0 0 1 0.2%
Sewers Beach 0 0 0 0 0 0 2 2 0.4% Shack 0 0 0 1 0 0 0 1 0.2% Shack behind 7/11 0 0 0 0 0 0 1 1 0.2% Sidewalk by Washington middle school
0 1 0 0 0 0 0 1 0.2%
Smith St. 1 0 0 0 0 0 0 1 0.2% Smith St. in a box 1 0 0 0 0 0 0 1 0.2% St. Louis Heights 0 2 0 0 0 0 0 2 0.4% State office by the water fountain
1 0 0 0 0 0 0 1 0.2%
Streets 6 1 0 0 0 0 0 7 1.4% Sumner St. 6 0 0 0 0 0 0 6 1.2% Tent 0 1 0 0 0 2 0 3 0.6% Thomas Square Park 1 0 0 0 0 0 0 1 0.2% Tracks 0 0 0 0 0 0 2 2 0.4% UH area 0 2 0 0 0 0 0 2 0.4% Ulehawa Beach Park 0 0 0 0 0 0 6 6 1.2% Ulehawa in tent 0 0 0 0 0 0 1 1 0.2% Uluwehi beach 0 0 0 0 0 0 2 2 0.4% Under bridge 5 1 0 0 1 0 0 7 1.4% Under canoe 0 0 0 0 0 1 0 1 0.2% Under Nimitz bridge 3 0 0 0 0 0 0 3 0.6% Unknown 12 5 0 0 0 0 0 17 3.4% Vehicle 0 2 0 0 0 0 0 2 0.4% Vehicle in Pearl City 0 0 1 0 0 0 0 1 0.2% Wahiawa 0 0 0 0 1 0 0 1 0.2% Wahiawa Center St 0 0 0 0 1 0 0 1 0.2% Wahiawa outside welfare office
0 0 0 0 1 0 0 1 0.2%
Waialae 0 1 0 0 0 0 0 1 0.2% Waianae 0 0 0 0 0 0 1 1 0.2% Waianae boat harbor 0 0 0 0 0 0 26 26 5.1% Waianae valley 0 0 0 0 0 0 1 1 0.2% Waikiki 0 9 0 0 0 0 0 9 1.8% Waikiki Area 0 1 0 0 0 0 0 1 0.2% Waikiki beach 0 1 0 0 0 0 0 1 0.2%

58
Waikiki in van 0 1 0 0 0 0 0 1 0.2% Waikiki library 0 1 0 0 0 0 0 1 0.2% Waikiki next to redemption center
0 1 0 0 0 0 0 1 0.2%
Waikiki park bench 0 1 0 0 0 0 0 1 0.2% Waikiki streets 0 1 0 0 0 0 0 1 0.2% Waikomo 0 0 0 0 0 0 4 4 0.8% Waimanalo Beach Park
0 0 0 3 0 0 0 3 0.6%
White Plains 0 0 1 0 0 0 0 1 0.2% Young & Kaheka 0 1 0 0 0 0 0 1 0.2% YWCA 1 0 0 0 0 0 0 1 0.2% Zablan Beach 0 0 0 0 0 0 2 2 0.4% Zoo 0 1 0 0 0 0 0 1 0.2% Total 231 103 21 13 44 7 86 505 100.0%

59
2013 Maui Unsheltered Chronic Homeless by Region
Location of CH Singles Region 1
Region 2
Region 3
Region 4
Region 5
Region 6
Total % of Total
Armory in tent 1 0 0 0 0 0 1 0.7% Baldwin Beach 0 0 1 0 0 0 1 0.7% Baseball Field 0 0 0 3 0 0 3 2.0% Beach 1 0 2 14 15 0 32 21.3% Beach dugout 0 0 0 0 1 0 1 0.7% Beach in tent 1 0 0 0 3 0 4 2.7% Beach in vehicle 0 0 0 0 1 0 1 0.7% Beach Park 0 0 0 1 1 0 2 1.3% Behind Aquatic Center 0 0 0 1 0 0 1 0.7% Behind Denny's 0 0 0 0 1 0 1 0.7% Behind Kahului Safeway 1 0 0 0 0 0 1 0.7% Behind public pool 0 0 0 2 0 0 2 1.3% Behind Safeway 1 0 0 0 0 0 1 0.7% Between Cove & Young on beach
0 0 0 0 1 0 1 0.7%
Bushes 0 0 0 2 0 0 2 1.3% Camp 0 0 0 2 0 0 2 1.3% Camping 0 0 0 1 0 0 1 0.7% Canoe Hale 2 0 0 0 0 0 2 1.3% Carport 0 0 1 0 0 0 1 0.7% Field 2 0 0 0 1 0 3 2.0% Grassy area 0 0 0 0 1 0 1 0.7% Hale Nanea Beach Park 1 0 0 0 0 0 1 0.7% Hoaloha Beach Park 3 0 0 0 0 0 3 2.0% Industrial area side walk 0 1 0 0 0 0 1 0.7% Industrial center in vehicle 0 0 0 1 0 0 1 0.7% Kahului 2 0 0 0 0 0 2 1.3% Kahului behind bank 1 0 0 0 0 0 1 0.7% Kahului dairy road 1 0 0 0 0 0 1 0.7% Kahului harbor 1 0 0 0 0 0 1 0.7% Kahului Harbor beach 1 0 0 0 0 0 1 0.7% Kahului library 1 0 0 0 0 0 1 0.7% Kahului post office bushes 1 0 0 0 0 0 1 0.7% Kalama park 0 0 0 0 2 0 2 1.3% Kam 3 beach 0 0 0 0 3 0 3 2.0% Kanaha beach park 6 0 0 0 0 0 6 4.0% Kanaha in vehicle 1 0 0 0 0 0 1 0.7% Kanaha park in tent 1 0 0 0 0 0 1 0.7% Kea St Wailuku 1 0 0 0 0 0 1 0.7% Kiawe woods behind maui dive shope
0 0 0 0 1 0 1 0.7%
Kihei 0 0 0 0 1 0 1 0.7% Kihei beach 0 0 0 0 1 0 1 0.7% Kihei kiawe forest 0 0 0 0 2 0 2 1.3% La Paruse in vehicle 0 0 0 0 1 0 1 0.7% Lahaina Luna Rd outside family property
0 0 0 1 0 0 1 0.7%
Library Park 0 0 0 2 0 0 2 1.3% Lower Waiehu River 0 3 0 0 0 0 3 2.0%

60
Mouth Makena 0 0 0 0 1 0 1 0.7% Maui sugar field 1 0 0 0 0 0 1 0.7% McDonald's parking lot 1 0 0 0 0 0 1 0.7% Nahiko tent 0 0 0 0 0 1 1 0.7% Olowalu beach in vehicle 0 0 0 1 0 0 1 0.7% Outside 0 0 1 1 0 0 2 1.3% Park 0 0 1 4 0 0 5 3.3% Parking lot 1 0 0 0 0 0 1 0.7% Piihana farm land 1 0 0 0 0 0 1 0.7% Pipe Thread 0 0 0 0 1 0 1 0.7% Puamana park 0 0 0 1 0 0 1 0.7% Pukalani in vehicle 0 0 1 0 0 0 1 0.7% Safeway in vehicle 1 0 0 0 0 0 1 0.7% Shack 1 0 0 0 0 0 1 0.7% Spreckelsville 0 0 1 0 0 0 1 0.7% Streets 1 0 0 4 0 0 5 3.3% Tent 1 0 0 0 0 1 2 1.3% Tesoro in bushes 0 0 0 0 1 0 1 0.7% Truck at the beach 1 0 0 0 0 0 1 0.7% Unknown 0 0 0 1 0 0 1 0.7% Vehicle 1 1 0 1 2 0 5 3.3% Vehicle at the beach 0 0 0 2 0 0 2 1.3% Waiehu Beach Rd 0 1 0 0 0 0 1 0.7% Wailuku by church 1 0 0 0 0 0 1 0.7% Wailuku in tent 1 0 0 0 0 0 1 0.7% Wailuku Piihana farm 1 0 0 0 0 0 1 0.7% Walakahou St in vehicle 0 0 0 0 1 0 1 0.7% Wind surf beach 0 0 0 0 1 0 1 0.7% Woods 0 0 0 0 2 0 2 1.3% Yhata's Bush 1 0 0 0 0 0 1 0.7% Total 44 6 8 45 45 2 150 100.0%

61
2013 Kauai Unsheltered Chronic Homeless by Region Location of CH Singles Region 1 Region 3 Region 4 Region 5 Total % of Total Anahola beach 0 0 2 0 2 3.3% Anahola in tent 0 0 4 0 4 6.6% Anahola in vehicle 0 0 4 0 4 6.6% Anini in tent 0 0 0 1 1 1.6% Beach 0 0 1 0 1 1.6% Car 0 3 1 0 4 6.6% Haena 0 0 0 1 1 1.6% Hanamaulu in tent 0 4 0 0 4 6.6% Hanamaulu in vehicle 0 3 0 0 3 4.9% Hanamaulu pavillion 0 1 0 0 1 1.6% Hanapepe vehicle 1 0 0 0 1 1.6% Kapaa beach 0 0 2 0 2 3.3% Kapaa in tent 0 0 1 0 1 1.6% Kapaa park 0 0 1 0 1 1.6% Kilauea in tent 0 0 0 2 2 3.3% Lihue behind bowling alley 0 1 0 0 1 1.6% Lihue bushes 0 1 0 0 1 1.6% Lihue in tent 0 2 0 0 2 3.3% Lihue park 0 3 0 0 3 4.9% Lihue streets 0 1 0 0 1 1.6% Lihue Wehe Rd 0 1 0 0 1 1.6% Niumalu in vehicle 0 1 0 0 1 1.6% Polihale State Park 0 1 0 0 1 1.6% Princeville in tent 0 0 0 1 1 1.6% Salt Pond in tent 4 0 0 0 4 6.6% Salt Pond pavillion 2 0 0 0 2 3.3% Tent 2 2 0 3 7 11.5% Van 0 0 0 1 1 1.6% Waimea in tent 1 0 0 0 1 1.6% Waimea in vehicle 2 0 0 0 2 3.3% Total 12 24 16 9 61 100.0%

62
2013 Hawaii Unsheltered Chronic Homeless by Region
Location of CH Singles Area 2
Area 4
Area 6
Area 7
Area 8
Area 9
Area 10
Total % of Total
7th road in vehicle 0 0 1 0 0 0 0 1 1.0% Across Manono market by the Japanese church
0 1 0 0 0 0 0 1 1.0%
Banyon trees behind soccer field
0 1 0 0 0 0 0 1 1.0%
Bayfront Parking Lot 0 4 0 0 0 0 0 4 3.9% Beach 0 0 0 0 1 0 0 1 1.0% Beach across Mokuaikaua church
0 0 0 0 0 1 0 1 1.0%
Beach at Honaunau 0 0 0 0 0 1 0 1 1.0% Beach by Old Airport 0 0 0 0 0 1 0 1 1.0% Behind Hilo Hatties 0 0 0 0 0 1 0 1 1.0% Behind McDonalds in Kona 0 0 0 0 0 1 0 1 1.0% Behind West Hawaii building 0 0 0 0 0 1 0 1 1.0% Big Island Grill under roof 0 0 0 0 0 1 0 1 1.0% Bus Stop 0 1 0 0 0 1 0 2 1.9% Bushes by bowling alley 0 0 0 0 0 1 0 1 1.0% Camp Harbor 0 0 0 0 0 0 1 1 1.0% Cinderland Eco Village 0 0 0 2 0 0 0 2 1.9% Ed's farm 0 0 0 1 0 0 0 1 1.0% Eden Rock 0 0 2 0 0 0 0 2 1.9% Enos Rd bushes 0 0 1 0 0 0 0 1 1.0% Front yard 0 1 0 0 0 0 0 1 1.0% Gates beach 0 0 0 0 0 1 0 1 1.0% Grassy field 0 1 0 0 0 0 0 1 1.0% Harbor beach 0 0 0 0 0 0 1 1 1.0% Hilo airport bushes 0 1 0 0 0 0 0 1 1.0% Hilo Bus Terminal 0 3 0 0 0 0 0 3 2.9% Hilo food court 0 1 0 0 0 0 0 1 1.0% Hilo Hatties Kona 0 0 0 0 0 2 0 2 1.9% Hilo lagoon 0 1 0 0 0 0 0 1 1.0% Hilo soccer field 0 2 0 0 0 0 0 2 1.9% Honaunau 0 0 0 0 0 1 0 1 1.0% Honokahau Harbor 0 0 0 0 0 1 0 1 1.0% Hualalai near Old Theater 0 0 0 0 0 1 0 1 1.0% Kahaluu beach 0 0 0 0 0 1 0 1 1.0% Kama'aina hotel 0 0 0 0 0 1 0 1 1.0% Kawaihae 1 0 0 0 0 0 0 1 1.0% Kawaihae Harbor 0 0 0 0 1 0 0 1 1.0% Kona 0 0 0 0 0 1 0 1 1.0% Kona above the post office 0 0 0 0 0 1 0 1 1.0% Kona airport 0 0 0 0 0 0 1 1 1.0% Kona American Savings Bank 0 0 0 0 0 1 0 1 1.0% Kona beach 0 0 0 0 0 2 0 2 1.9% Kona harbor 0 0 0 0 0 1 0 1 1.0% Kona Palace downtown 0 0 0 0 0 1 0 1 1.0% Kona streets 0 0 0 0 0 1 0 1 1.0% Lincoln Park bleachers 0 1 0 0 0 0 0 1 1.0% Lincoln park tennis court area 0 1 0 0 0 0 0 1 1.0%

63
Manono Mini Mart 0 1 0 0 0 0 0 1 1.0% McDonalds 0 0 0 0 0 1 0 1 1.0% Mokuaikaua church area 0 0 0 0 0 1 0 1 1.0% Mooheau park on the grass 0 1 0 0 0 0 0 1 1.0% Ocean View 0 0 0 0 1 0 0 1 1.0% Ocean View in shack 0 0 0 0 1 0 0 1 1.0% Off Grid Shack 0 0 0 0 3 0 0 3 2.9% Off highway in harbor area 0 0 0 0 0 0 1 1 1.0% Old Airport 0 0 0 0 0 6 0 6 5.8% Old Hilo Hotel area 0 1 0 0 0 0 0 1 1.0% Old Industrial Area 0 0 0 0 0 1 0 1 1.0% Outside 0 0 0 0 0 3 0 3 2.9% Outside Friendly Place 0 0 0 0 0 1 0 1 1.0% Outside Kona area 0 0 0 0 0 1 0 1 1.0% Pier 0 0 0 0 0 0 1 1 1.0% Ponohawai in alley 0 1 0 0 0 0 0 1 1.0% Puako Beach 0 0 0 0 0 0 1 1 1.0% Puna 0 0 1 0 0 0 0 1 1.0% Rd 15 0 0 1 0 0 0 0 1 1.0% Rd 2 0 0 1 0 0 0 0 1 1.0% Salvation Army Porch 0 3 0 0 0 0 0 3 2.9% Spencer Beach 1 0 0 0 0 0 0 1 1.0% St. Joseph Church 0 1 0 0 0 0 0 1 1.0% State Property Beach 0 0 0 0 0 1 0 1 1.0% Streets near Hope 0 0 0 0 0 1 0 1 1.0% Suisan boat ramp 0 1 0 0 0 0 0 1 1.0% Wailoa bathroom 0 1 0 0 0 0 0 1 1.0% Wailoa park 0 1 0 0 0 0 0 1 1.0% Wailoa State park 0 6 0 0 0 0 0 6 5.8% Water treatment facility 0 0 0 0 1 0 0 1 1.0% Total 2 36 7 3 8 41 6 103 100.0%

64
Appendix 5: 2013 PIT Count Household Survey ******************************************************************************
USE THIS FORM IF THE CLIENT IS PART OF A HOUSEHOLD (For our purposes households are defined as: an adult with at least one child under 18, adult
couples with no children, groups of adults, and children-only household configurations)
2013 Homeless Point-in-Time Count Survey Interviewer’s Name: ____________________________Agency/Group: ___________________ Site of Interview (Actual Location): ______________________________ Date: ____________ Introduction Example: “Hello, my name is _____, and I am an outreach worker/volunteer. We are doing a short survey for an annual homeless count, and your responses will help fund homeless services throughout Hawaii. All of your answers will be confidential. Can I ask you a few questions?”
“Are you living alone or with others?” To determine whether to use SINGLE or HOUSEHOLD form
“Where did you sleep this past Tuesday, JANUARY 22nd?” ___________________
If answer is sheltered (e.g. house, shelter, hospital, jail), End Survey. Please try to be as specific as possible.
“What area of the island did you sleep?” ______________________________
Enter Area/Region # (1–7) [Map on back]
1. Including yourself, how many ADULTS are in your household? _____ 2. How many CHILDREN UNDER 18 are in your household? _____ 3. How long have you been continuously homeless this time?
Less than 1 year 1 year or longer* Unknown Refused 4. How many times have you been homeless in the past 3 years?
1–3 times 4 or more times* Unknown Refused 5. HEAD OF HOUSEHOLD First Name: ___________________________Last Name: Date of Birth: ________/_________/_________OR if DOB refused, Age: _____ Gender: Male Female Transgender Unknown/Refused Have you served in the U.S. Armed Forces? Yes No Unknown Refused Were you activated, into active duty, as a National Guard member or Reservist?
Yes No Unknown Refused Do you have a mental health disability that limits your ability to work or perform activities of daily living?
Yes* No Unknown Refused

65
Do you have an alcohol or drug problem that limits your ability to work or perform activities of daily living? Yes* No Unknown Refused Are you currently living with HIV/AIDS? Yes* No Unknown Refused Do you have a physical, developmental, or other disability that limits your ability to work or perform activities of daily living? Yes* No Unknown Refused 6. OTHER ADULT IN HOUSEHOLD #1: First Name: ___________________________Last Name: _______________ Date of Birth: ________/_________/_________ OR if DOB refused, Age: _____ Gender: Male Female Transgender Unknown/Refused Have you served in the U.S. Armed Forces? Yes No Unknown Refused Were you activated, into active duty, as a National Guard member or Reservist?
Yes No Unknown Refused
Do you have a mental health disability that limits your ability to work or perform activities of daily living? Yes* No Unknown Refused
Do you have an alcohol or drug problem that limits your ability to work or perform activities of daily living? Yes* No Unknown Refused Are you currently living with HIV/AIDS? Yes* No Unknown Refused Do you have a physical, developmental, or other disability that limits your ability to work or perform activities of daily living? Yes* No Unknown Refused 7. OTHER ADULT IN HOUSEHOLD #2: First Name: ___________________________ Last Name: ______________________ Date of Birth: ________/_________/_________ OR if DOB refused, Age: _____ Gender: Male Female Transgender Unknown/Refused Have you served in the U.S. Armed Forces? Yes No Unknown Refused Were you activated, into active duty, as a National Guard member or Reservist?
Yes No Unknown Refused
Do you have a mental health disability that limits your ability to work or perform activities of daily living? Yes* No Unknown Refused
Do you have an alcohol or drug problem that limits your ability to work or perform activities of daily living? Yes* No Unknown Refused Are you currently living with HIV/AIDS? Yes* No Unknown Refused Do you have a physical, developmental, or other disability that limits your ability to work or perform activities of daily living? Yes* No Unknown Refused

66
(If there are more adults in the Household attach a blank copy of this page to this survey)
THANK and END SURVEY
Outreach Workers Only: Check Box if information was filled out by you because client refused to fill out the survey due to Severe Mental Illness and or Substance Abuse. In addition please provide specific location where the person was found AND identifying descriptors – hair color and length, body build, tattoos, scars, wounds, disabilities, etc.) Check if survey was filled out by Outreach Worker Description:

67
Appendix 6: 2013 PIT Count Single Survey ******************************************************************************
USE THIS FORM IF THE CLIENT IS SINGLE (Unaccompanied)
2013 Homeless Point-in-Time Count Survey Interviewer’s Name: ____________________________Agency/Group: ________________________ Site of Interview (Actual Location): ______________________________ Date: _________________ Introduction Example: “Hello, my name is _____, and I am an outreach worker/volunteer. We are doing a short survey for an annual homeless count, and your responses will help fund homeless services throughout Hawaii. All of your answers will be confidential. Can I ask you a few questions?”
“Are you living alone or with others?” (If living with others including a child under 18 use HOUSEHOLD form)
“Where did you sleep this past Tuesday, JANUARY 22?” ___________________
If answer is sheltered (e.g. house, shelter, hospital, jail), End Survey. Please try to be as specific as possible.
“What area of the island did you sleep?” ______________________________ Enter Area/Region # (1–7) [Map on back]
1. First Name: ___________________________ Last Name: ____________________________ 2. Date of Birth: ________/_________/_________ OR if DOB refused, Age: _____ 3. Gender: Male Female Transgender Unknown/Refused 4. Have you served in the U.S. Armed Forces? Yes No Unknown Refused 5. Were you activated, into active duty, as a National Guard member or Reservist?
Yes No Unknown Refused 6. How long have you been continuously homeless this time?
Less than 1 year 1 year or longer* Unknown Refused 7. How many times have you been homeless in the past 3 years?
1–3 times 4 or more times* Unknown Refused 8. Were you on the street, beach, park, or in an emergency shelter each time?
Yes* No Unknown Refused 9. Do you have a mental health disability that limits your ability to work or perform activities of daily living? Yes*
No Unknown Refused 10. Do you have an alcohol or drug problem that limits your ability to work or perform activities of daily living?
Yes* No Unknown Refused 11. Are you currently living with HIV/AIDS? Yes* No Unknown Refused 12. Do you have a physical, developmental, or other disability that limits your ability to work or perform activities of daily living? Yes* No Unknown Refused
THANK and END SURVEY

68
CHECK BOX WHEN THIS SURVEY HAS BEEN ENTERED INTO HMIS
Outreach Workers Only: Check Box if information was filled out by you because client refused to fill out the survey due to Severe Mental Illness and or Substance Abuse. In addition please provide specific location where the person was found AND identifying descriptors – hair color and length, body build, tattoos, scars, wounds, disabilities, etc.) Check if survey was filled out by Outreach Worker Description:
69
Appendix 7: 2013 Overview POINT IN TIME (PIT) COUNT January 2013 Overview
Proposed Count Dates Sheltered Date for the Count is Tuesday, January 22: Individuals and families staying in
a shelter on this night will be counted. All sheltered intakes for clients residing in ES, TH, or SH programs should be entered into the HMIS by Friday, February 8, 2013. All Non-HMIS summary surveys for providers not participating in the HMIS (e.g. DV shelters) should be amassed for the night of the 22nd and submitted to [email protected] by February 8, 2013.
Unsheltered Dates for the Count are Wednesday, January 23 to Tuesday January 29. ONLY people who responded that they DID NOT stay indoors on Tuesday January 22nd should be surveyed. If a person responds by stating that they were sheltered or stayed indoors on the 22nd, discontinue the survey and do not enter into the PIT module of the HMIS. Surveying should be done at a variety of times including very early in the morning and late at night. Feedings should also be utilized as sites for surveys. All unsheltered surveys should be entered into the HMIS by Friday, February 22, 2013.
Kick Off Evening is Wednesday, January 23 from 5:00 to 9:30 pm for a concentrated outreach effort to count unsheltered individuals and families and to start off the count which will continue until Tuesday, January 29.
Agency Assistance Needed Volunteers: Any assistance with having staff, students or volunteers help with the count will be appreciated. All volunteers must be register prior to the count. Volunteers will be assigned to Lead Coordinators as needed. Lead Coordinators must make sure that all volunteers working in their areas are adequately trained.
Survey Instrument: The survey instruments will be slightly different than last year and a copy will be provided. The form for singles will be on white paper, the survey instrument for families will be on colored paper. Survey Instructions: Instruction forms will be provided for Agencies, Lead Coordinators, and Surveyors Surveyors: All surveyors must register prior to the Point In Time Count and must sign the Contact Information and Confidentiality Form. A sign up form for volunteers is available and will be sent out along with the Contact Information and Confidentiality Form to the PIC email list.

70
Surveyor Training: The training for those working the Kick Off Count will happen from 5:00 to 5:30 pm just prior to the start of the count at each of the coordinating sites. All surveyors are required to attend. All coordinators should ensure that all surveyors are properly trained before each shift. Data Input: Data entry will be done by agencies already using the HMIS. An instruction sheet on inputting this information will be provided prior to the count. Methodology will be very similar to last year.

71
Appendix 8: Contact and Confidentiality Form Contact Information and Confidentiality Form 2013 HOMELESS POINT-IN-TIME COUNT
Name: Phone #: Position: Agency: E-mail: Emergency Name and Contact #: Preferred Geographic Area:
2013 Point In Time Count Statement of Confidentiality Must be signed by all Surveyors
All outreach staff and volunteers associated with the collection of homeless population data during the 2013 Unsheltered Point in Time Count are subject to certain confidentiality guidelines. These guidelines apply to all data collected during the seven day period from January 23rd – January 29th and to any data that may subsequently be entered into the HMIS from this period. The State of Hawaii’s HMIS contains an appreciable amount of client information that must be confidentially maintained. As the administrator of the HMIS, there are several guidelines that the State of Hawaii would like to address regarding the upcoming collection of client data and the entering of this data into the HMIS for applicable outreach staff.
All client information gathered will be held strictly confidential. All completed surveys will be kept out of public view. Personal HMIS user identifications and passwords will be kept secure and will not be
shared. Private information obtained from the HMIS is to remain confidential, even if an
employee’s job is terminated or concludes for any reason. Entering known, inaccurate information about any client is prohibited.
Your signature below indicates your agreement to comply with this statement of confidentiality.
Outreach Agency if Applicable_____________________________________________

72
Print Name_________________________________ Signature __________________________________ Date____________________ Please fax all completed forms to Vanessa at 732-0735 or turn in at the training.


![[XLS] · Web view1 2013 2 2013 3 2013 4 2013 5 2013 6 2013 7 2013 8 2013 9 2013 10 2013 11 2013 12 2013 13 2013 14 2013 15 2013 16 2013 17 2013 18 2013 19 2013 20 2013 21 2013 22](https://static.fdocuments.net/doc/165x107/5b8a3d977f8b9a82418bc06d/xls-web-view1-2013-2-2013-3-2013-4-2013-5-2013-6-2013-7-2013-8-2013-9-2013.jpg)


