Statewide Groundwater Vulnerability Map of … Groundwater Vulnerability Map of Oklahoma By Noël I....
79
Statewide Groundwater Vulnerability Map of Oklahoma By Noël I. Osborn and Ray H. Hardy Oklahoma Water Resources Board Technical Report 99-1 January 1999
Transcript of Statewide Groundwater Vulnerability Map of … Groundwater Vulnerability Map of Oklahoma By Noël I....
Statewide Groundwater Vulnerability Map of Oklahoma
By Noël I. Osborn and Ray H. Hardy
Oklahoma Water Resources Board Technical Report 99-1
January 1999
ii
Second Printing June 1999 This publication is prepared, issued and printed by the Oklahoma Water Resources Board. One hundred copies were prepared at a cost of $1,128. Copies have been deposited with the Publications Clearinghouse at the Oklahoma Department of Libraries. Any use of trade names in this publication is for descriptive purposes and does not imply endorsement by the State of Oklahoma.
iii
Contents Summary ..........................................................................................................................................1 Introduction......................................................................................................................................1
Purpose.................................................................................................................................1 Background..........................................................................................................................1
Hydrogeologic Basins......................................................................................................................3 Vulnerability Assessment ................................................................................................................8
Vulnerability ........................................................................................................................8 DRASTIC ............................................................................................................................8 Methodology......................................................................................................................10
Results and Discussion ..................................................................................................................19
Results................................................................................................................................19 Map Limitations.................................................................................................................24
References......................................................................................................................................29 Appendix A: Description of Hydrogeologic Basins . . . . . . . . . . . . . . . . . . . . . . . . . . . . . . . . . A-1 Appendix B: DRASTIC Ranges and Ratings . . . . . . . . . . . . . . . . . . . . . . . . . . . . . . . . . . . . . B-1 Appendix C: DRASTIC Ranges, Ratings, Numbers, and Indices for Each Hydrogeologic Basin . . . . . . . . . . . . . . . . . . . . . . . . . . . . . . . . . . . . . . . . . . . . . . . . . . . . . . . . . . . . . . . . . . . . . C-1
Tables Table 1. List of hydrogeologic basins . . . . . . . . . . . . . . . . . . . . . . . . . . . . . . . . . . . . . . . . . . . . . 5 Table 2. DRASTIC ranges, ratings, numbers, and index calculation for the Ogallala hydrogeologic basin . . . . . . . . . . . . . . . . . . . . . . . . . . . . . . . . . . . . . . . . . . . . . . . . . . . . . . . . . . 10 Table 3. Soil surface texture classifications from STATSGO data and assigned DRASTIC ratings for soil media . . . . . . . . . . . . . . . . . . . . . . . . . . . . . . . . . . . . . . . . . . . . . . . . . . . . . . . . . 17 Table 4. Vulnerability classification and corresponding DRASTIC indices . . . . . . . . . . . . . . . 19 Table 5. DRASTIC numbers, indices, and vulnerability classifications, by hydrogeologic basin . . . . . . . . . . . . . . . . . . . . . . . . . . . . . . . . . . . . . . . . . . . . . . . . . . . . . . . . . . . . . . . . . . . . . . . 23
iv
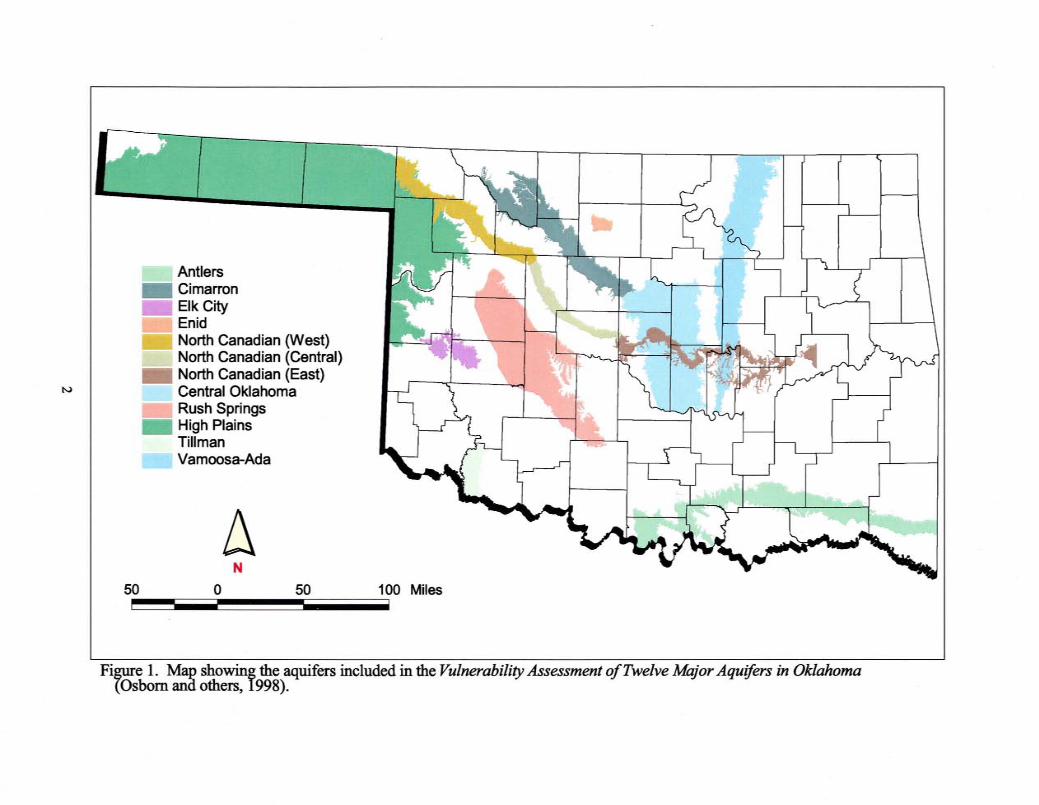
Figures Figure 1. Map showing the aquifers included in the Vulnerability Assessment of Twelve Major
Aquifers in Oklahoma (Osborn and others, 1998). ..............................................................2 Figure 2. Generalized map showing the hydrogeologic basins. .....................................................6 Figure 3. Map showing alluvium and terrace deposits in Oklahoma (modified from
Cederstrand, 1996b,c,d,e,f,g,h,i,j,k,l; 1:250,000-scale maps)..............................................7 Figure 4. Map showing DRASTIC ratings for depth to water (D), by hydrogeologic basin. ......11 Figure 5. Map showing DRASTIC ratings for net recharge (R), by hydrogeologic basin...........13 Figure 6. Map showing DRASTIC ratings for aquifer media (A), by hydrogeologic basin. .......14 Figure 7. Map showing DRASTIC ratings for impact of the vadose zone (I), by hydrogeologic
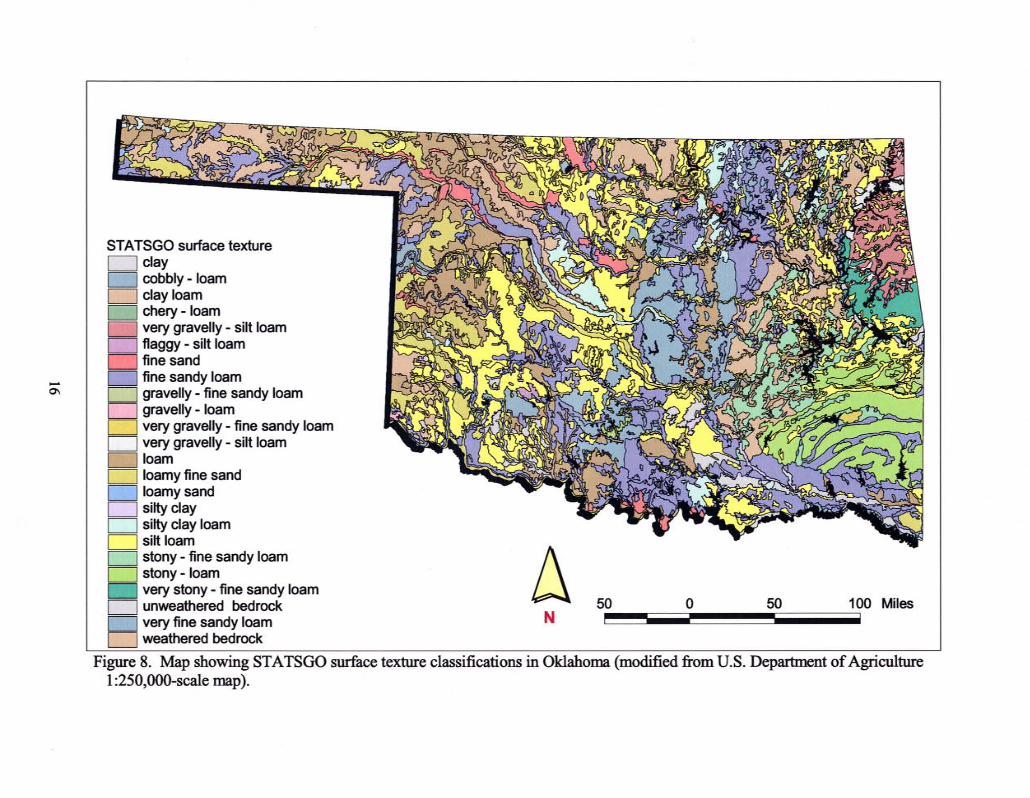
basin. ..................................................................................................................................15 Figure 8. Map showing STATSGO surface texture classifications in Oklahoma (modified
from U.S. Department of Agriculture 1:250,000-scale map). ...........................................16 Figure 9. DRASTIC soil media rating for the Boone hydrogeologic basin. ................................18 Figure 10. Map showing DRASTIC ratings for soil media (S), by hydrogeologic basin. ...........20 Figure 11. Map showing DRASTIC ratings for topography (T), by hydrogeologic basin...........21 Figure 12. Map showing DRASTIC ratings for hydraulic conductivity (C), by hydrogeologic
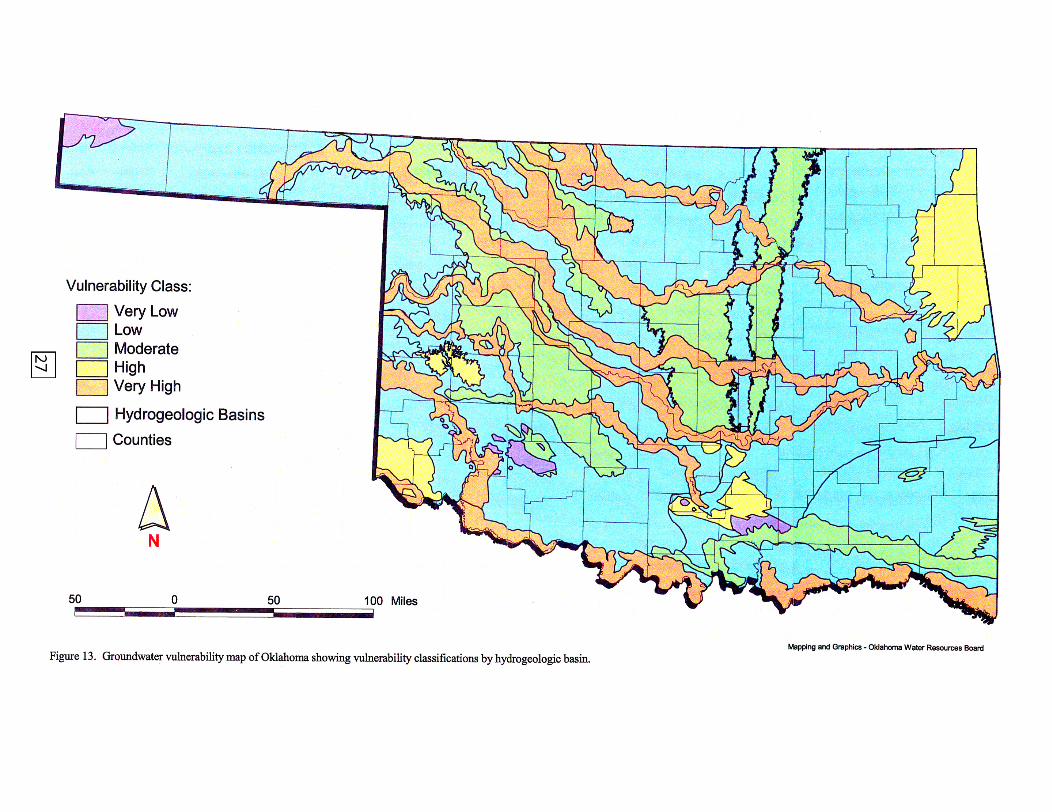
basin. ..................................................................................................................................22 Figure 13. Groundwater vulnerability map of Oklahoma showing vulnerability classifications
by hydrogeologic basin. .....................................................................................................27
1
Summary
All groundwater is vulnerable to contamination from surface sources of pollution; however, some areas are more vulnerable than others. The Oklahoma Water Resources Board (OWRB) developed a map showing the relative vulnerability of groundwater in 30 hydrogeologic basins in Oklahoma that are exposed at land surface, and are thus more likely to be susceptible to pollution. Vulnerability was computed with the DRASTIC index method, developed by the U.S. Environmental Protection Agency (EPA). Based on the DRASTIC indices, the hydrogeologic basins were classified in five groups of relative vulnerability: very low, low, moderate, high, and very high. The vulnerability map shows that the alluvium and terrace deposits are most susceptible to pollution of groundwater; the igneous and low yielding bedrock basins are the least susceptible.
Introduction
PURPOSE The purpose of this investigation was to develop a statewide map showing the relative vulnera-bility of groundwater to surficial contamination that could be incorporated into Oklahoma's water quality standards. BACKGROUND The OWRB and the U.S. Geological Survey (USGS) conducted a vulnerability assessment of 12 major Oklahoma aquifers using the DRASTIC index method. Twelve major aquifers, for which adequate data were available from previous studies, were selected for the assessment. These aquifers are listed below and are displayed in Figure 1: Bedrock Aquifers:
Central Oklahoma Vamoosa-Ada Rush Springs Antlers Elk City High Plains
Alluvium and Terrace Deposits: Enid Isolated Terrace Tillman Terrace Cimarron River North Canadian River: ------ western reach from the Panhandle to Canton Lake ------ central reach from Canton Lake to Lake Overholser ------ eastern reach from Oklahoma City to Eufaula Lake
3
The USGS created, documented, and published digital geospatial data sets that describe the aquifer characteristics and created the grid layers used to calculate the DRASTIC index. The OWRB used the grid layers created by the USGS to compute the final DRASTIC indices and to produce the aquifer vulnerability maps. The maps are based on a cell size of 960 x 960 meters, or about 228 acres. The resulting aquifer vulnerability maps indicate that of the 12 major aquifers included in the assessment, the bedrock aquifers are the least vulnerable to contamination from pollutants introduced at the ground surface, and the alluvium and terrace deposits are the most vulnerable. The High Plains aquifer is only moderately vulnerable, largely due to its great depth to water. For more information on this study, refer to the OWRB technical report 98-5: Vulnerability Assessment of Twelve Major Aquifers in Oklahoma by Osborn and others, 1998. The report is also available on the OWRB website (www.state.ok.us/~owrb). The vulnerability maps provide valuable information on the relative vulnerability within the 12 major aquifers. However, the assessment represents only a portion of the groundwater in the state, and is not, in itself, adequate to be incorporated into Oklahoma's water quality standards. Recognizing that the quality and resolution of data available for the 12 major aquifers are not currently available for the remainder of the state, and that collecting such data would be expensive and time-consuming, the OWRB developed a regional approach to produce a statewide vulnerability map.
Hydrogeologic Basins
Groundwater is water that has percolated downward from the surface, filling voids or open spaces in the rock formations. An aquifer is a subsurface unit that can yield useful quantities of water. Oklahoma's aquifers may be divided into two general groups: bedrock and alluvium and terrace deposits. The bedrock aquifers include sandstone aquifers; interbedded sandstone, limestone, and shale aquifers; soluble carbonate and evaporite (limestone, dolomite, and gypsum) aquifers; and the semi-consolidated sand and gravel that comprise the Ogallala aquifer. The alluvium and terrace deposits consist of unconsolidated deposits of sand and gravel along rivers and streams. The OWRB considers major aquifers, or groundwater basins, to be those bedrock aquifers that can yield on average at least 50 gallons per minute (gpm), and those alluvium and terrace deposits that can yield at least 150 gpm. Minor aquifers yield less water. Oklahoma is underlain by 23 major aquifers containing an estimated 320 million acre-feet of water in storage. Many minor aquifers also yield significant amounts of fresh water. To develop a statewide groundwater vulnerability map, the OWRB subdivided the state into 30 hydrogeologic basins. As used in this report, a hydrogeologic basin is a mappable geologic unit that is exposed at land surface and that has common hydrogeologic characteristics such as lithology, topography, and well yield.
4
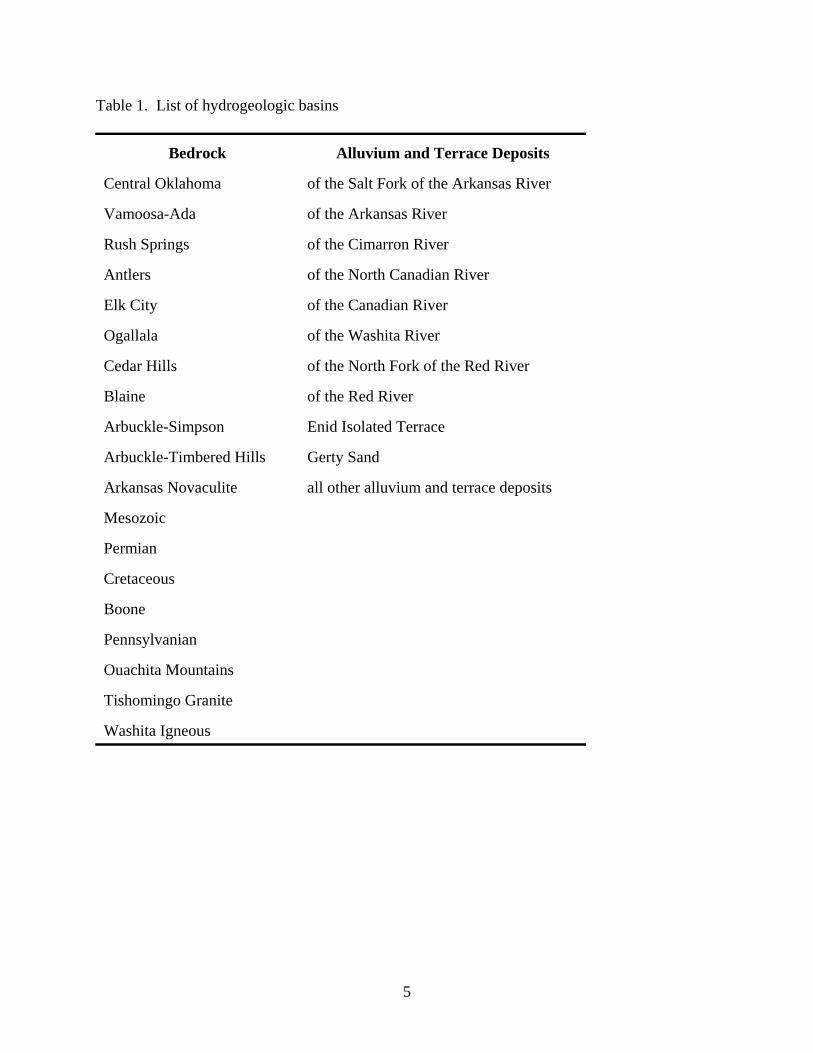
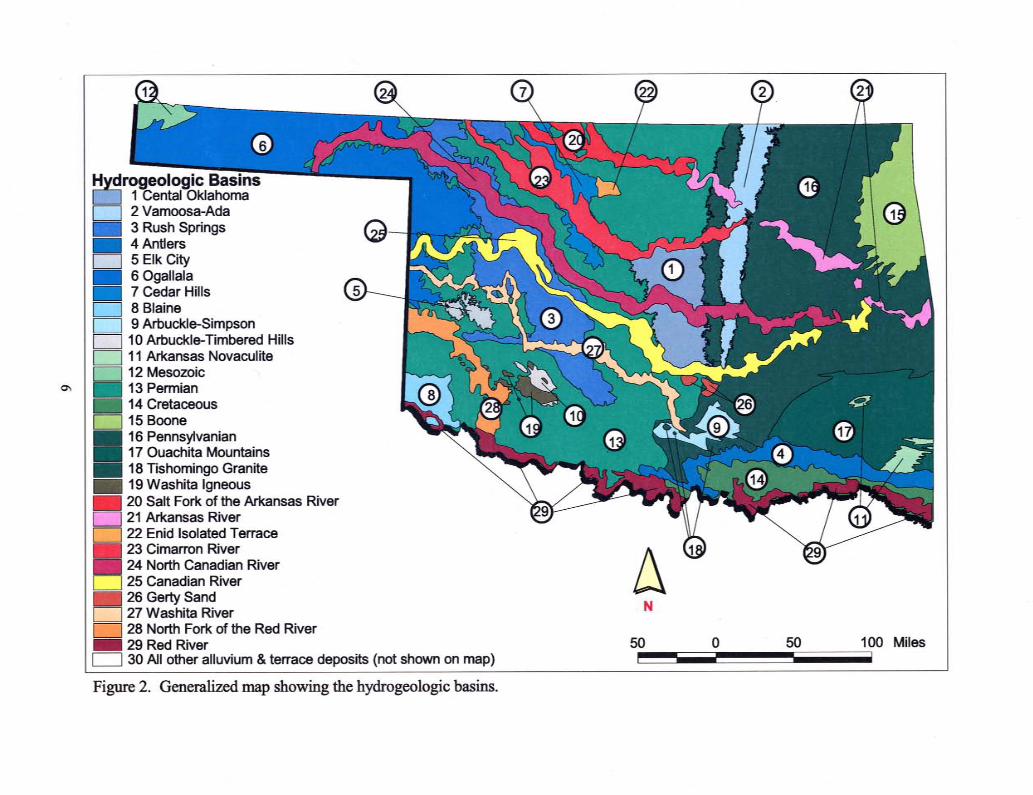
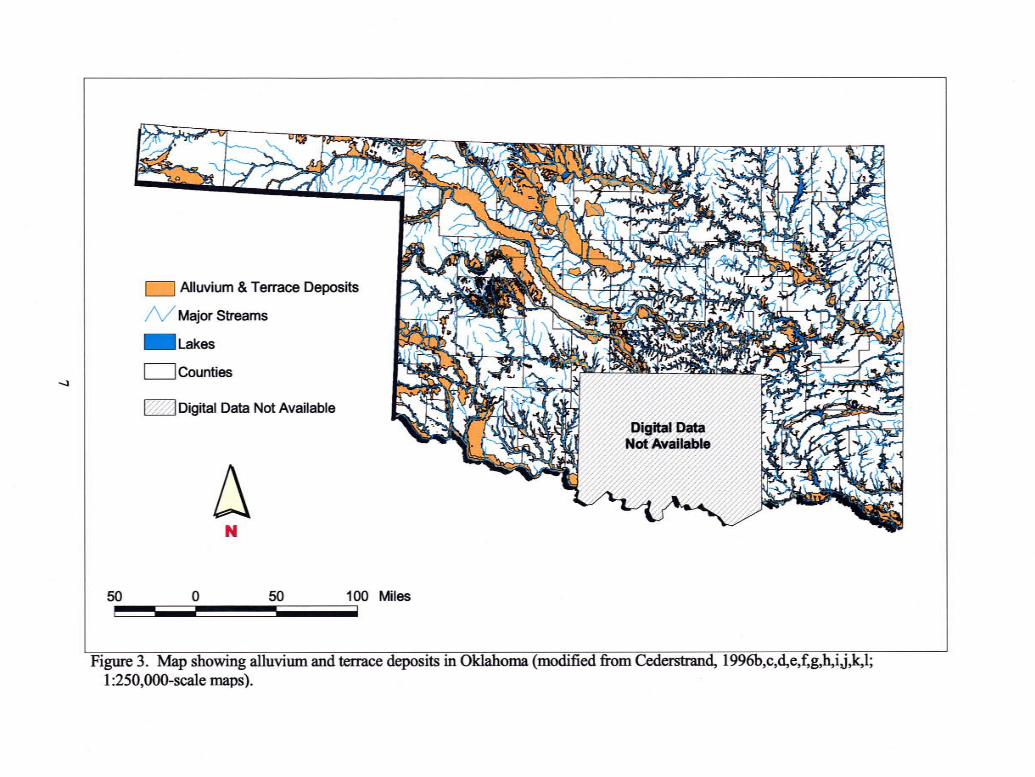
Because only geologic formations exposed at the surface are included in the hydrogeolgic basins, portions of aquifers (such as the Central Oklahoma, Rush Springs, Antlers, Arbuckle-Simpson, and the Arbuckle-Timbered Hills) overlain by shallower formations are not included in the basins. The Roubidoux aquifer, in northeastern Oklahoma, is not included in the vulnerability assessment because it is entirely in the subsurface, underlying the Boone and Pennsylvanian hydrogeologic basins. Of the 30 hydrogeologic basins, 19 consist of bedrock; 10 are major alluvium and terrace aquifers; and one includes all the remaining alluvium and terrace deposits. The hydrogeologic basins are listed in Table 1 and are displayed in Figure 2. Each basin is described in Appendix A. Boundaries for the hydrogeologic basins shown in Figure 2 were extracted from existing digital maps of varying levels of resolution. Most of the bedrock basin boundaries were derived from the USGS regional geology map of Oklahoma, which is part of a map showing the surficial geology of the United States at a 1:2,500,000 scale (Schruben and others, 1994). Boundaries for the Rush Springs, Blaine, and Cedar Hills basins and the major alluvium and terrace basins were derived from OWRB maps showing major groundwater basins. The OWRB maps were digitized from various 1:250,000 scale-maps. The boundaries for the Vamoosa-Ada, Enid Isolated Terrace, Elk City, and Central Oklahoma basins were derived from USGS digital data sets, based on a scale of 1:250,000 (Abbott and others, 1997; Becker and others, 1997a,b; Runkle and Rea, 1997). Figure 2 is a generalized map showing the hydrogeologic basins. To determine site-specific boundaries, refer to the basin descriptions in Appendix A, and locate the site on the surficial geology maps published in the hydrologic atlases of Oklahoma (Bingham and Bergman, 1980; Bingham and Moore, 1975; Carr and Bergman, 1976; Hart, 1974; Havens, 1977; Marcher, 1969; Marcher and Bergman, 1983; Marcher and Bingham, 1971; Morton, 1980; Morton and Goemaat, 1973; Sapik and Goemaat, 1973; Wood and Hart, 1967). The digital surficial geology sets from the hydrologic atlases are available on the Internet at http://wwwok.cr.usgs.gov/gis/geology/ index.html (Cederstrand, 1996a,b,c,d,e,f,g,h,i,j,k,l). The hydrogeologic basin that includes all other alluvium and terrace deposits is not shown in Figure 2 because a digital map is not available for all of the alluvium and terrace deposits in the state, and because the density of detail of the alluvium and terrace deposits is too high to be represented on a generalized map. Alluvium, terrace deposits, and dune sands for which digital data sets were available are displayed in Figure 3. This map was created from the digital surficial geology sets. Digital data sets for the alluvium and terrace deposits in the Ardmore and Sherman quadrangles were not available. To identify the alluvium and terrace deposits in this area, refer to Sheet 1 in Hydrologic Atlas 3 (Hart, 1974).
5
Table 1. List of hydrogeologic basins
Bedrock
Alluvium and Terrace Deposits Central Oklahoma
of the Salt Fork of the Arkansas River
Vamoosa-Ada
of the Arkansas River
Rush Springs
of the Cimarron River
Antlers
of the North Canadian River
Elk City
of the Canadian River
Ogallala
of the Washita River
Cedar Hills
of the North Fork of the Red River
Blaine
of the Red River
Arbuckle-Simpson
Enid Isolated Terrace
Arbuckle-Timbered Hills
Gerty Sand
Arkansas Novaculite
all other alluvium and terrace deposits
Mesozoic
Permian
Cretaceous
Boone
Pennsylvanian
Ouachita Mountains
Tishomingo Granite
Washita Igneous
8
Vulnerability Assessment
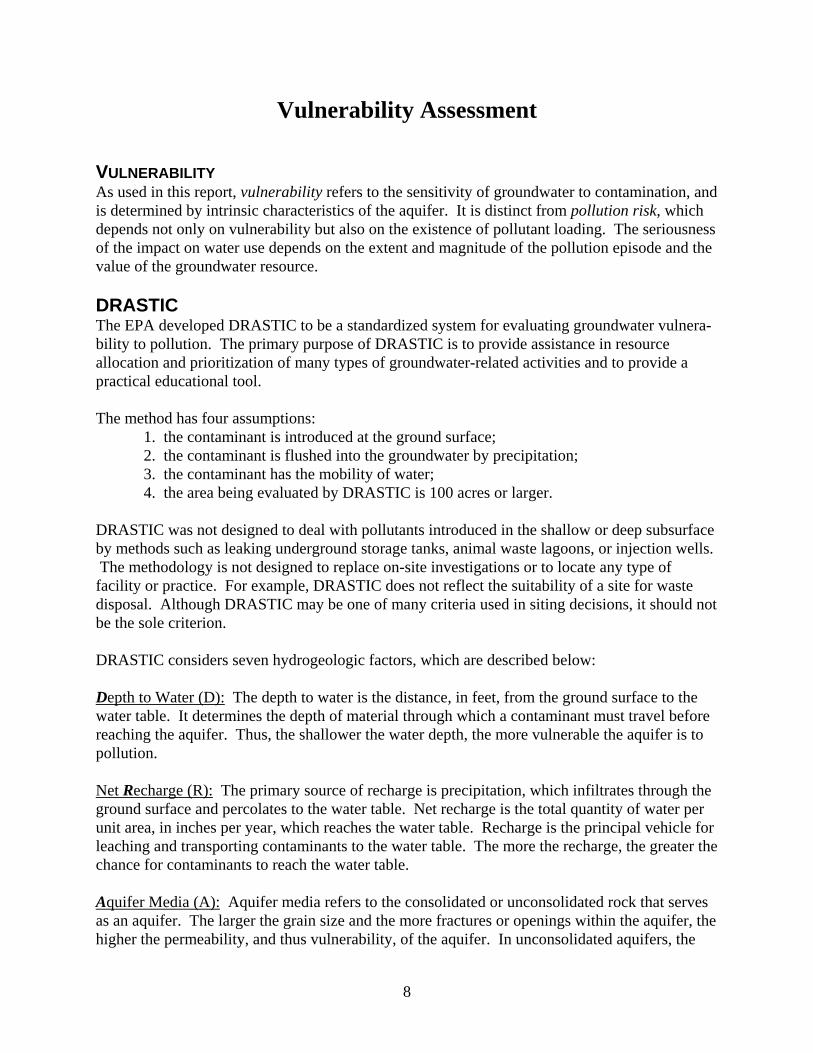
VULNERABILITY As used in this report, vulnerability refers to the sensitivity of groundwater to contamination, and is determined by intrinsic characteristics of the aquifer. It is distinct from pollution risk, which depends not only on vulnerability but also on the existence of pollutant loading. The seriousness of the impact on water use depends on the extent and magnitude of the pollution episode and the value of the groundwater resource. DRASTIC The EPA developed DRASTIC to be a standardized system for evaluating groundwater vulnera-bility to pollution. The primary purpose of DRASTIC is to provide assistance in resource allocation and prioritization of many types of groundwater-related activities and to provide a practical educational tool. The method has four assumptions:
1. the contaminant is introduced at the ground surface; 2. the contaminant is flushed into the groundwater by precipitation; 3. the contaminant has the mobility of water; 4. the area being evaluated by DRASTIC is 100 acres or larger.
DRASTIC was not designed to deal with pollutants introduced in the shallow or deep subsurface by methods such as leaking underground storage tanks, animal waste lagoons, or injection wells. The methodology is not designed to replace on-site investigations or to locate any type of facility or practice. For example, DRASTIC does not reflect the suitability of a site for waste disposal. Although DRASTIC may be one of many criteria used in siting decisions, it should not be the sole criterion. DRASTIC considers seven hydrogeologic factors, which are described below: Depth to Water (D): The depth to water is the distance, in feet, from the ground surface to the water table. It determines the depth of material through which a contaminant must travel before reaching the aquifer. Thus, the shallower the water depth, the more vulnerable the aquifer is to pollution. Net Recharge (R): The primary source of recharge is precipitation, which infiltrates through the ground surface and percolates to the water table. Net recharge is the total quantity of water per unit area, in inches per year, which reaches the water table. Recharge is the principal vehicle for leaching and transporting contaminants to the water table. The more the recharge, the greater the chance for contaminants to reach the water table. Aquifer Media (A): Aquifer media refers to the consolidated or unconsolidated rock that serves as an aquifer. The larger the grain size and the more fractures or openings within the aquifer, the higher the permeability, and thus vulnerability, of the aquifer. In unconsolidated aquifers, the
9
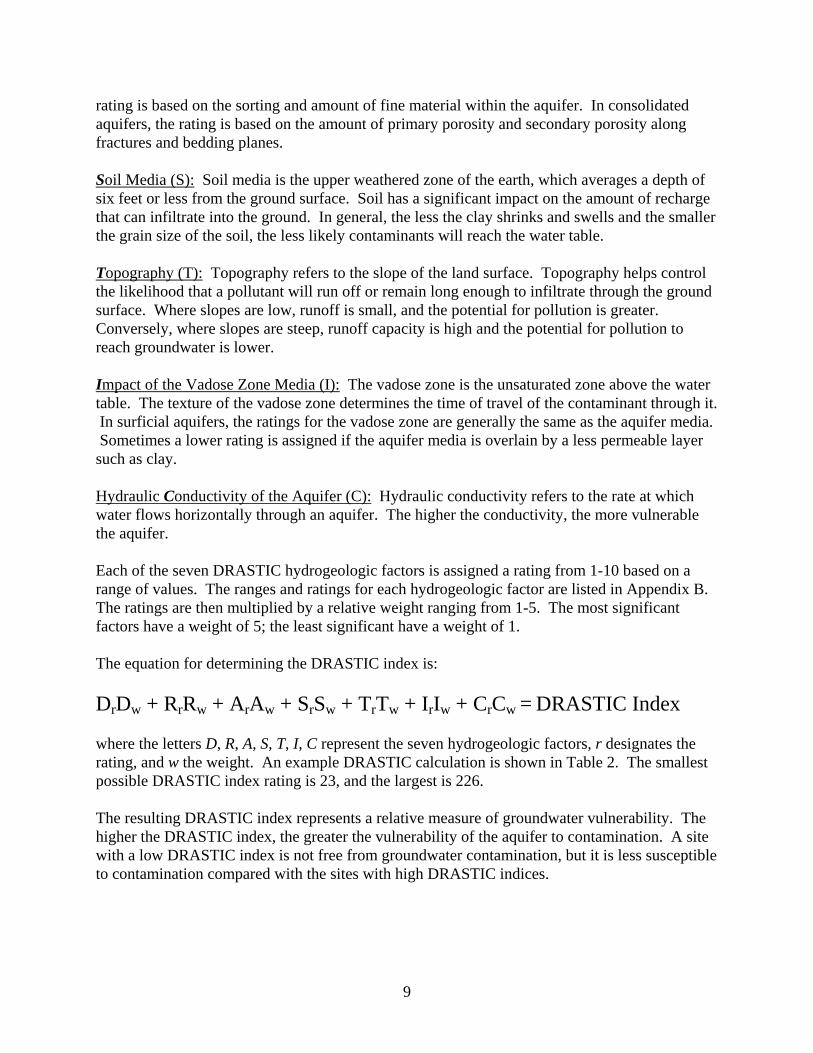
rating is based on the sorting and amount of fine material within the aquifer. In consolidated aquifers, the rating is based on the amount of primary porosity and secondary porosity along fractures and bedding planes. Soil Media (S): Soil media is the upper weathered zone of the earth, which averages a depth of six feet or less from the ground surface. Soil has a significant impact on the amount of recharge that can infiltrate into the ground. In general, the less the clay shrinks and swells and the smaller the grain size of the soil, the less likely contaminants will reach the water table. Topography (T): Topography refers to the slope of the land surface. Topography helps control the likelihood that a pollutant will run off or remain long enough to infiltrate through the ground surface. Where slopes are low, runoff is small, and the potential for pollution is greater. Conversely, where slopes are steep, runoff capacity is high and the potential for pollution to reach groundwater is lower. Impact of the Vadose Zone Media (I): The vadose zone is the unsaturated zone above the water table. The texture of the vadose zone determines the time of travel of the contaminant through it. In surficial aquifers, the ratings for the vadose zone are generally the same as the aquifer media. Sometimes a lower rating is assigned if the aquifer media is overlain by a less permeable layer such as clay. Hydraulic Conductivity of the Aquifer (C): Hydraulic conductivity refers to the rate at which water flows horizontally through an aquifer. The higher the conductivity, the more vulnerable the aquifer. Each of the seven DRASTIC hydrogeologic factors is assigned a rating from 1-10 based on a range of values. The ranges and ratings for each hydrogeologic factor are listed in Appendix B. The ratings are then multiplied by a relative weight ranging from 1-5. The most significant factors have a weight of 5; the least significant have a weight of 1. The equation for determining the DRASTIC index is: DrDw + RrRw + ArAw + SrSw + TrTw + IrIw + CrCw = DRASTIC Index where the letters D, R, A, S, T, I, C represent the seven hydrogeologic factors, r designates the rating, and w the weight. An example DRASTIC calculation is shown in Table 2. The smallest possible DRASTIC index rating is 23, and the largest is 226. The resulting DRASTIC index represents a relative measure of groundwater vulnerability. The higher the DRASTIC index, the greater the vulnerability of the aquifer to contamination. A site with a low DRASTIC index is not free from groundwater contamination, but it is less susceptible to contamination compared with the sites with high DRASTIC indices.
10
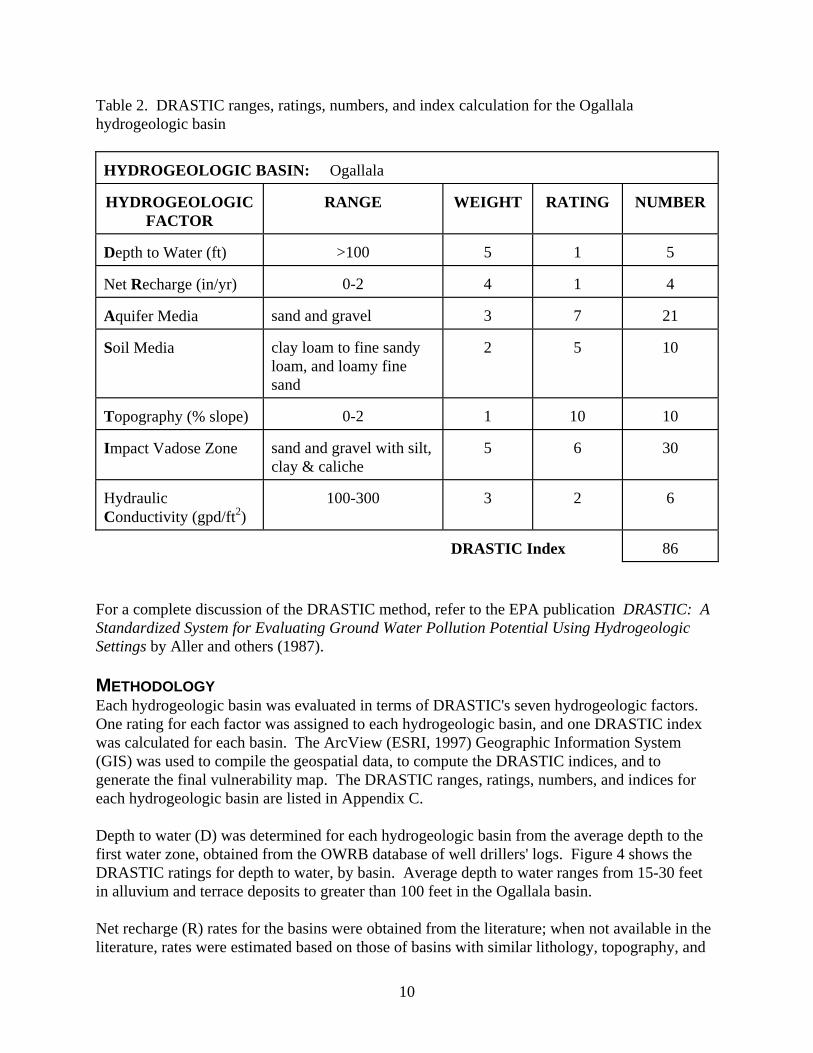
Table 2. DRASTIC ranges, ratings, numbers, and index calculation for the Ogallala hydrogeologic basin HYDROGEOLOGIC BASIN: Ogallala HYDROGEOLOGIC
FACTOR
RANGE
WEIGHT
RATING
NUMBER
Depth to Water (ft)
>100
5
1
5
Net Recharge (in/yr)
0-2
4
1
4
Aquifer Media
sand and gravel
3
7
21
Soil Media
clay loam to fine sandy loam, and loamy fine sand
2
5
10
Topography (% slope)
0-2
1
10
10
Impact Vadose Zone
sand and gravel with silt, clay & caliche
5
6
30
Hydraulic Conductivity (gpd/ft2)
100-300
3
2
6
DRASTIC Index
86
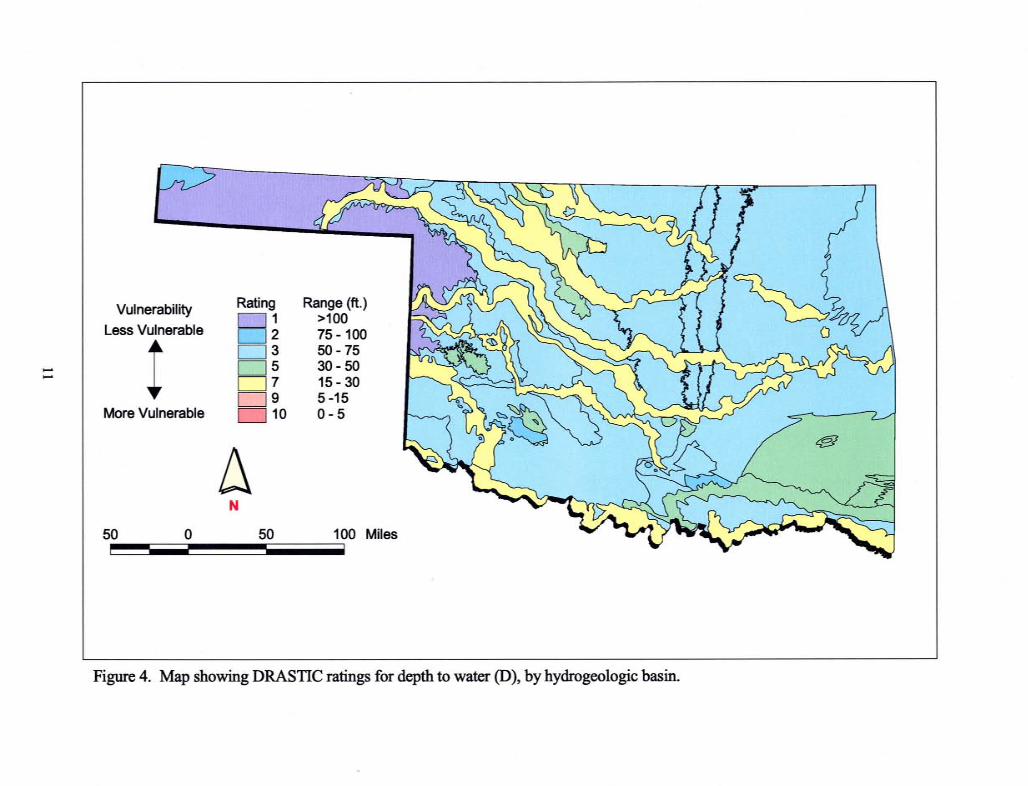
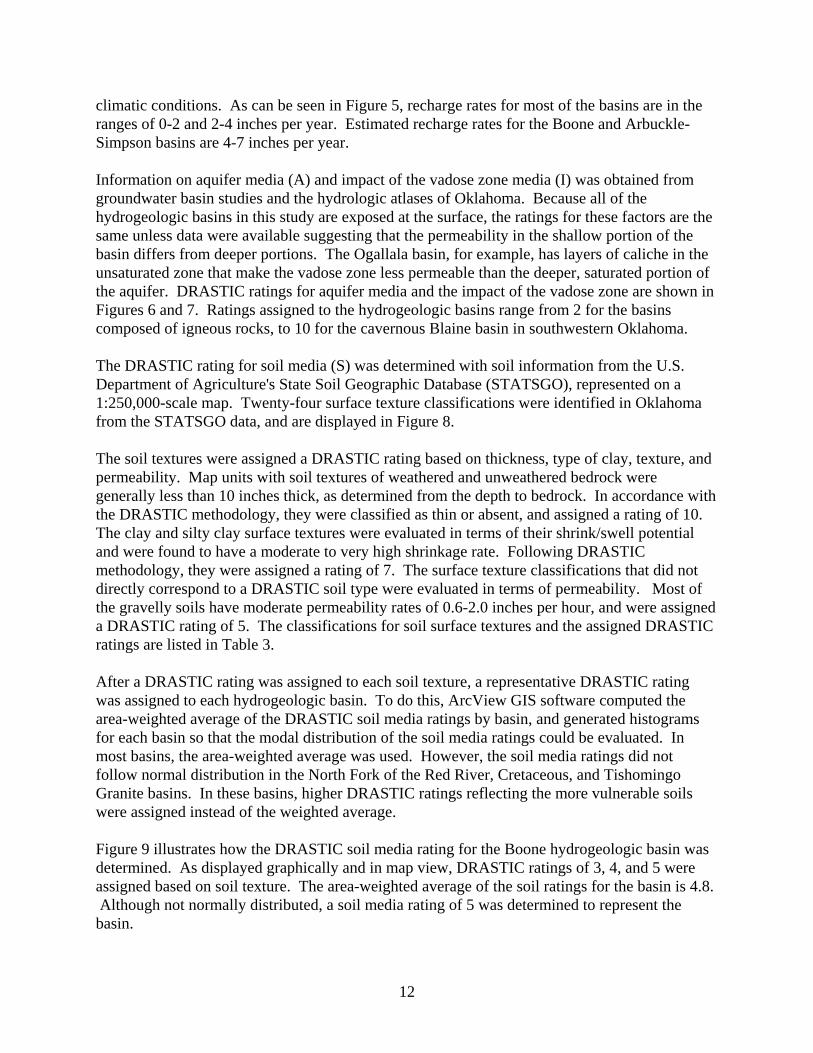
For a complete discussion of the DRASTIC method, refer to the EPA publication DRASTIC: A Standardized System for Evaluating Ground Water Pollution Potential Using Hydrogeologic Settings by Aller and others (1987). METHODOLOGY Each hydrogeologic basin was evaluated in terms of DRASTIC's seven hydrogeologic factors. One rating for each factor was assigned to each hydrogeologic basin, and one DRASTIC index was calculated for each basin. The ArcView (ESRI, 1997) Geographic Information System (GIS) was used to compile the geospatial data, to compute the DRASTIC indices, and to generate the final vulnerability map. The DRASTIC ranges, ratings, numbers, and indices for each hydrogeologic basin are listed in Appendix C. Depth to water (D) was determined for each hydrogeologic basin from the average depth to the first water zone, obtained from the OWRB database of well drillers' logs. Figure 4 shows the DRASTIC ratings for depth to water, by basin. Average depth to water ranges from 15-30 feet in alluvium and terrace deposits to greater than 100 feet in the Ogallala basin. Net recharge (R) rates for the basins were obtained from the literature; when not available in the literature, rates were estimated based on those of basins with similar lithology, topography, and
12
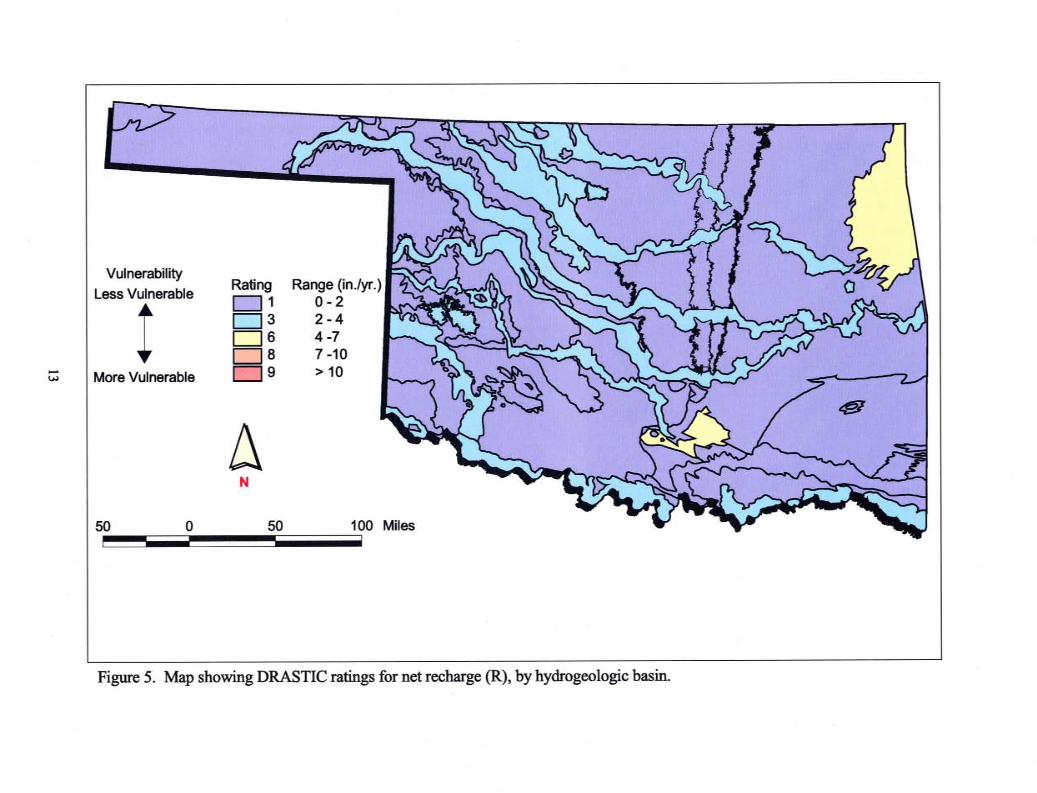
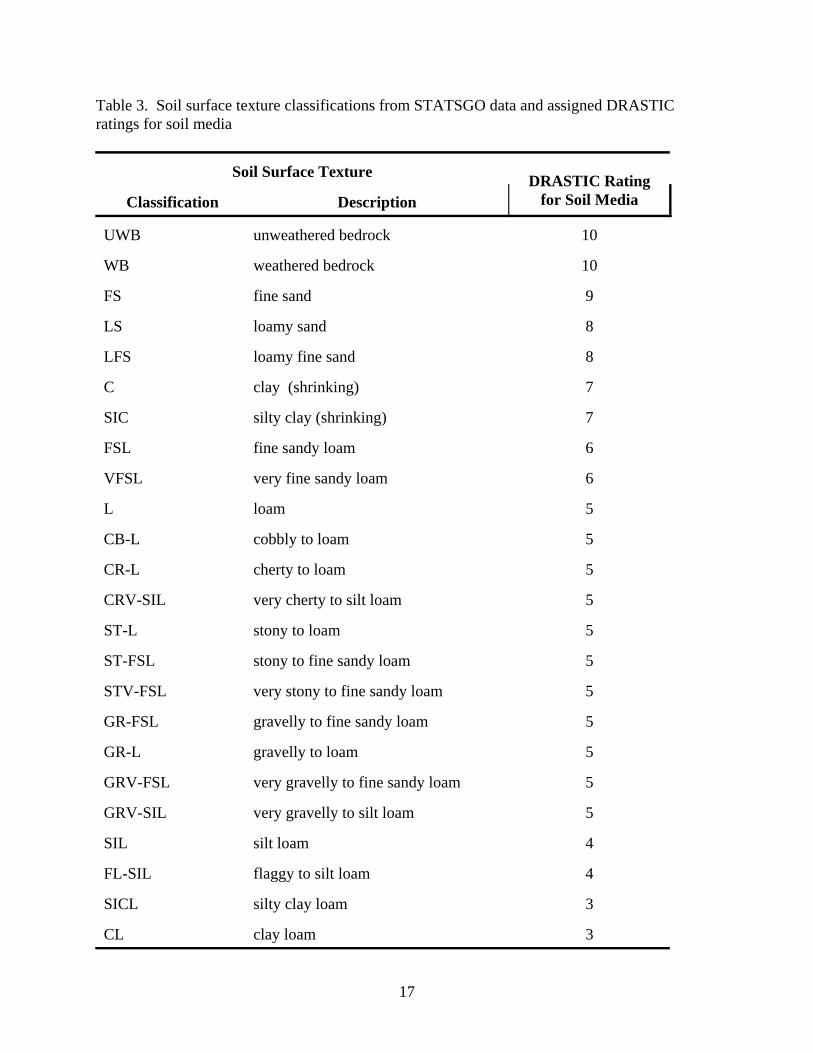
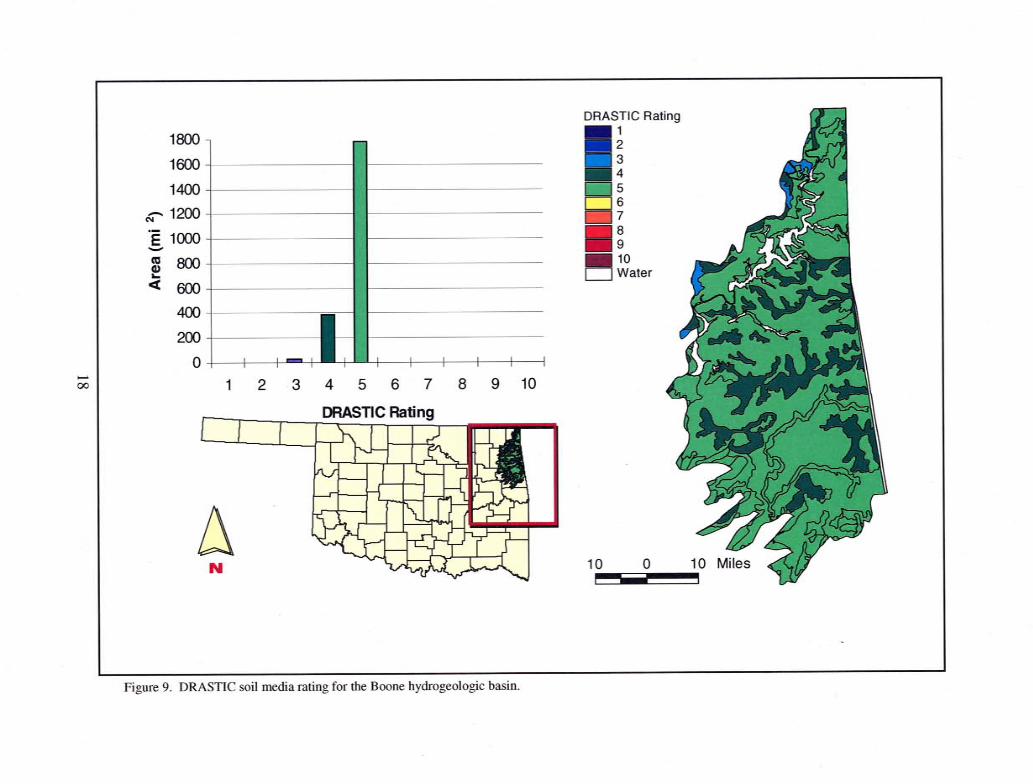
climatic conditions. As can be seen in Figure 5, recharge rates for most of the basins are in the ranges of 0-2 and 2-4 inches per year. Estimated recharge rates for the Boone and Arbuckle-Simpson basins are 4-7 inches per year. Information on aquifer media (A) and impact of the vadose zone media (I) was obtained from groundwater basin studies and the hydrologic atlases of Oklahoma. Because all of the hydrogeologic basins in this study are exposed at the surface, the ratings for these factors are the same unless data were available suggesting that the permeability in the shallow portion of the basin differs from deeper portions. The Ogallala basin, for example, has layers of caliche in the unsaturated zone that make the vadose zone less permeable than the deeper, saturated portion of the aquifer. DRASTIC ratings for aquifer media and the impact of the vadose zone are shown in Figures 6 and 7. Ratings assigned to the hydrogeologic basins range from 2 for the basins composed of igneous rocks, to 10 for the cavernous Blaine basin in southwestern Oklahoma. The DRASTIC rating for soil media (S) was determined with soil information from the U.S. Department of Agriculture's State Soil Geographic Database (STATSGO), represented on a 1:250,000-scale map. Twenty-four surface texture classifications were identified in Oklahoma from the STATSGO data, and are displayed in Figure 8. The soil textures were assigned a DRASTIC rating based on thickness, type of clay, texture, and permeability. Map units with soil textures of weathered and unweathered bedrock were generally less than 10 inches thick, as determined from the depth to bedrock. In accordance with the DRASTIC methodology, they were classified as thin or absent, and assigned a rating of 10. The clay and silty clay surface textures were evaluated in terms of their shrink/swell potential and were found to have a moderate to very high shrinkage rate. Following DRASTIC methodology, they were assigned a rating of 7. The surface texture classifications that did not directly correspond to a DRASTIC soil type were evaluated in terms of permeability. Most of the gravelly soils have moderate permeability rates of 0.6-2.0 inches per hour, and were assigned a DRASTIC rating of 5. The classifications for soil surface textures and the assigned DRASTIC ratings are listed in Table 3. After a DRASTIC rating was assigned to each soil texture, a representative DRASTIC rating was assigned to each hydrogeologic basin. To do this, ArcView GIS software computed the area-weighted average of the DRASTIC soil media ratings by basin, and generated histograms for each basin so that the modal distribution of the soil media ratings could be evaluated. In most basins, the area-weighted average was used. However, the soil media ratings did not follow normal distribution in the North Fork of the Red River, Cretaceous, and Tishomingo Granite basins. In these basins, higher DRASTIC ratings reflecting the more vulnerable soils were assigned instead of the weighted average. Figure 9 illustrates how the DRASTIC soil media rating for the Boone hydrogeologic basin was determined. As displayed graphically and in map view, DRASTIC ratings of 3, 4, and 5 were assigned based on soil texture. The area-weighted average of the soil ratings for the basin is 4.8. Although not normally distributed, a soil media rating of 5 was determined to represent the basin.

17
Table 3. Soil surface texture classifications from STATSGO data and assigned DRASTIC ratings for soil media
Soil Surface Texture
Classification
Description
DRASTIC Rating
for Soil Media UWB
unweathered bedrock
10
WB
weathered bedrock
10
FS
fine sand
9
LS
loamy sand
8
LFS
loamy fine sand
8
C
clay (shrinking)
7
SIC
silty clay (shrinking)
7
FSL
fine sandy loam
6
VFSL
very fine sandy loam
6
L
loam
5
CB-L
cobbly to loam
5
CR-L
cherty to loam
5
CRV-SIL
very cherty to silt loam
5
ST-L
stony to loam
5
ST-FSL
stony to fine sandy loam
5
STV-FSL
very stony to fine sandy loam
5
GR-FSL
gravelly to fine sandy loam
5
GR-L
gravelly to loam
5
GRV-FSL
very gravelly to fine sandy loam
5
GRV-SIL
very gravelly to silt loam
5
SIL
silt loam
4
FL-SIL
flaggy to silt loam
4
SICL
silty clay loam
3
CL
clay loam
3
19
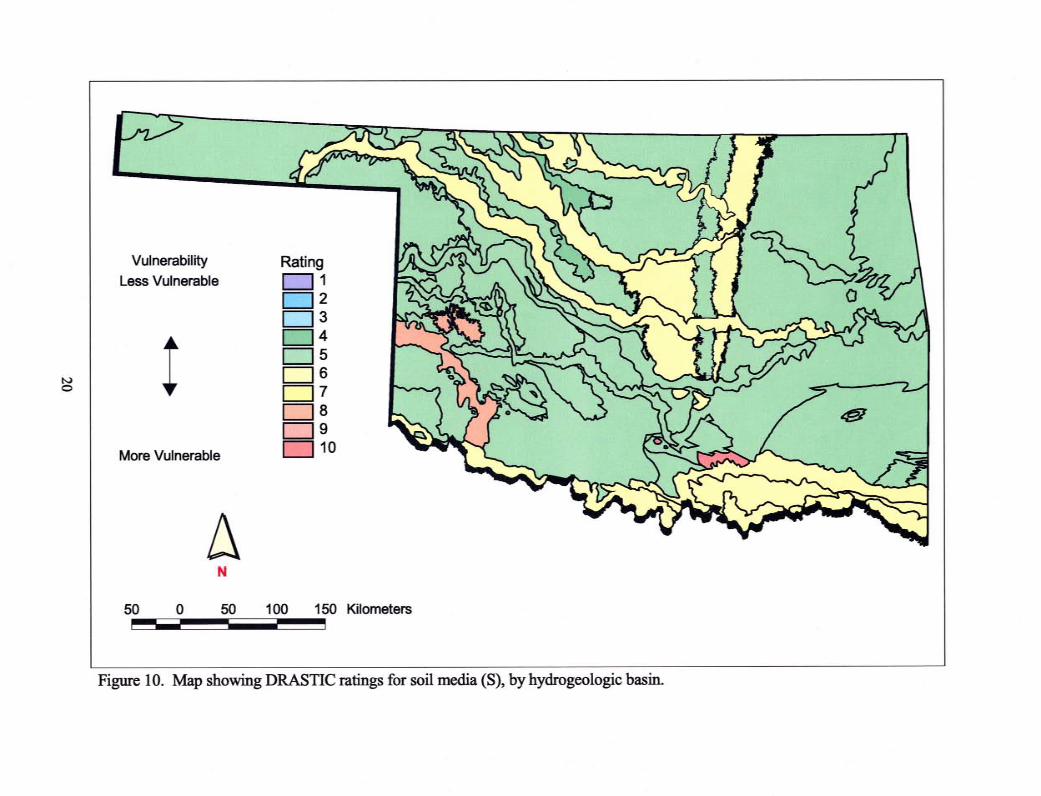
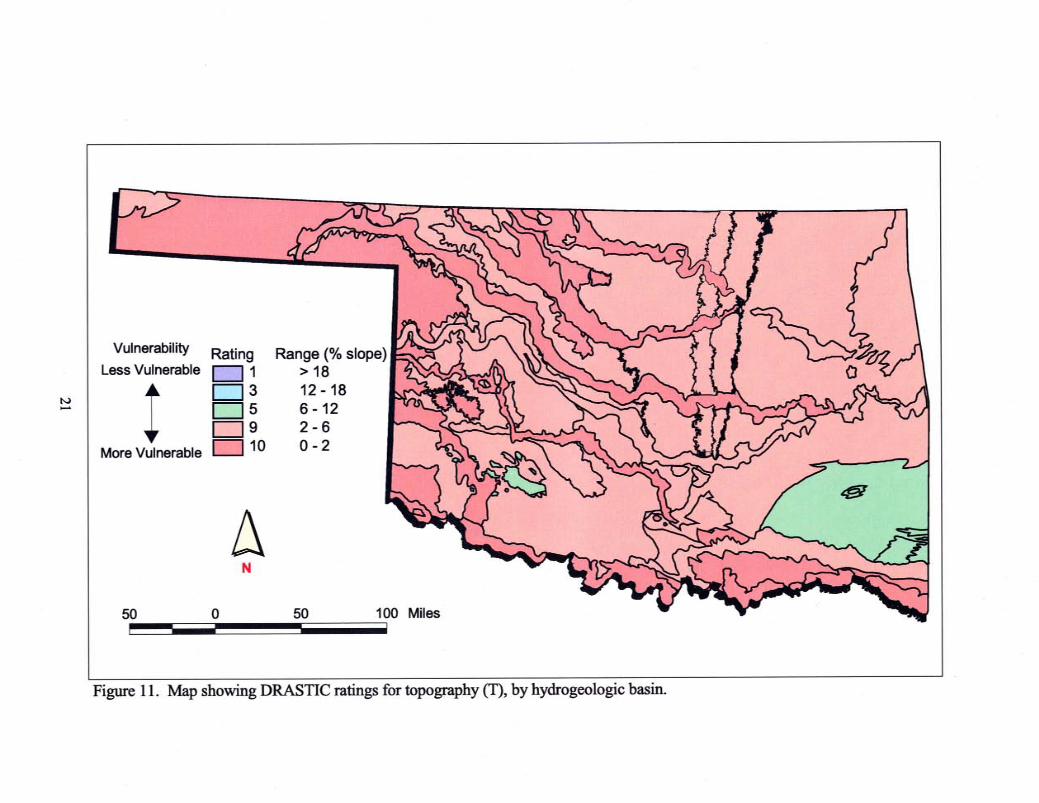
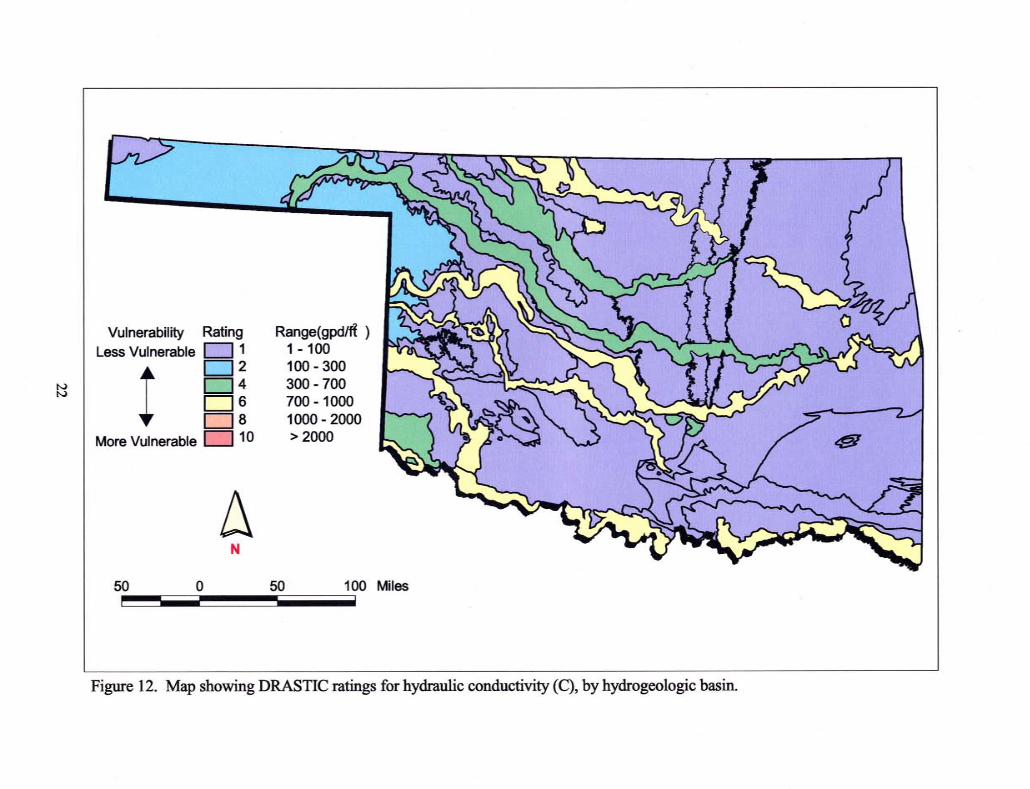
Figure 10 shows the DRASTIC ratings for soil media by basin. Ratings range from 4 to 10, with most between 5 and 6. The highest (most vulnerable) rating of 10 was assigned to the Tishomingo granite, where the soil is thin or absent. The DRASTIC ratings for topography (T) are based on percent slope. The GIS software calculated the average slope for each basin from the USGS's Digital Elevation Model (DEM), with a 60-meter cell resolution. As can be seen in Figure 11, most basins have average slopes in the ranges of 0-2 and 2-6 percent. The greatest degree of slope occurs in the Ouachita and Wichita mountains, with a range of 6-12 percent. Hydraulic conductivity (C) values for the basins were derived from literature; when not available, values were estimated based on those basins with similar lithology. Figure 12 shows the DRASTIC ratings for hydraulic conductivity. Values range from 1-100 gpd/ft2 for many bedrock basins to 700-1,000 gpd/ft2 for the alluvium and terrace basins.
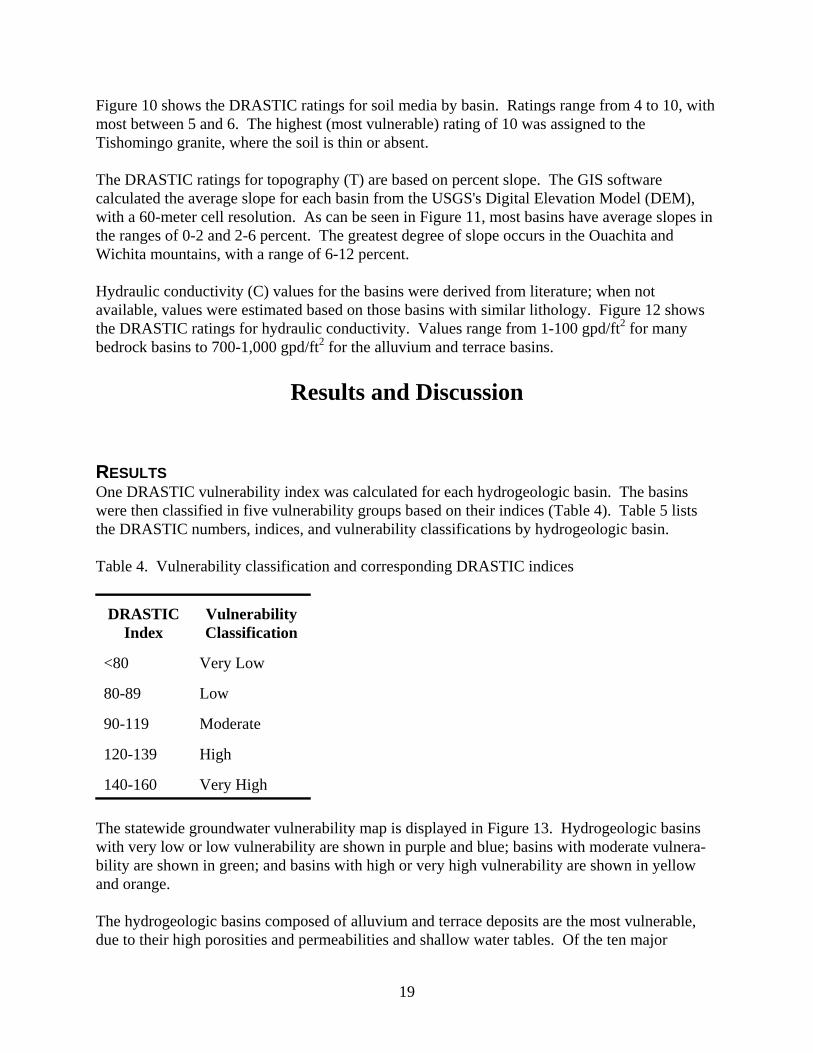
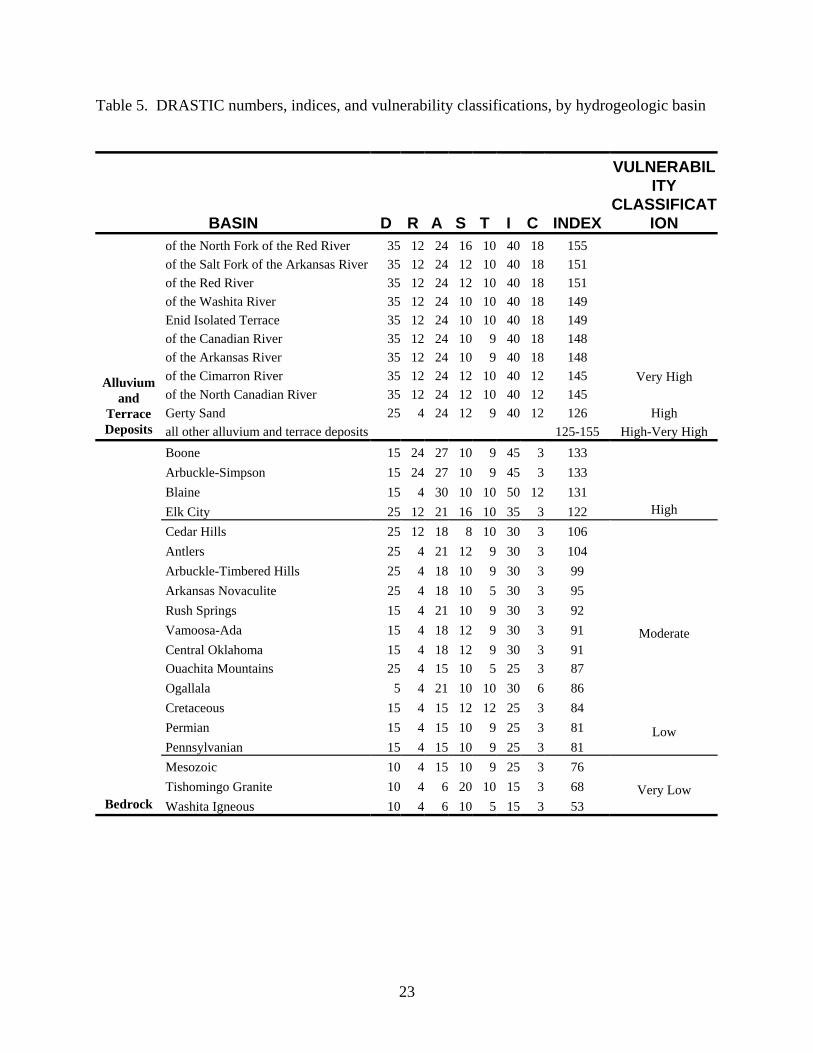
Results and Discussion RESULTS One DRASTIC vulnerability index was calculated for each hydrogeologic basin. The basins were then classified in five vulnerability groups based on their indices (Table 4). Table 5 lists the DRASTIC numbers, indices, and vulnerability classifications by hydrogeologic basin. Table 4. Vulnerability classification and corresponding DRASTIC indices DRASTIC
Index
Vulnerability Classification
<80
Very Low
80-89
Low
90-119
Moderate
120-139
High
140-160
Very High
The statewide groundwater vulnerability map is displayed in Figure 13. Hydrogeologic basins with very low or low vulnerability are shown in purple and blue; basins with moderate vulnera-bility are shown in green; and basins with high or very high vulnerability are shown in yellow and orange. The hydrogeologic basins composed of alluvium and terrace deposits are the most vulnerable, due to their high porosities and permeabilities and shallow water tables. Of the ten major
23
Table 5. DRASTIC numbers, indices, and vulnerability classifications, by hydrogeologic basin
BASIN
D
R
A
S
T
I
C
INDEX
VULNERABIL
ITY CLASSIFICAT
ION of the North Fork of the Red River
35
12
24
16
10
40
18
155
of the Salt Fork of the Arkansas River
35
12
24
12
10
40
18
151 of the Red River
35
12
24
12
10
40
18
151
of the Washita River
35
12
24
10
10
40
18
149 Enid Isolated Terrace
35
12
24
10
10
40
18
149
of the Canadian River
35
12
24
10
9
40
18
148 of the Arkansas River
35
12
24
10
9
40
18
148
of the Cimarron River
35
12
24
12
10
40
12
145 of the North Canadian River
35
12
24
12
10
40
12
145
Very High
Gerty Sand
25
4
24
12
9
40
12
126
High
Alluvium
and Terrace Deposits
all other alluvium and terrace deposits
125-155
High-Very High
Boone
15
24
27
10
9
45
3
133 Arbuckle-Simpson
15
24
27
10
9
45
3
133
Blaine
15
4
30
10
10
50
12
131 Elk City
25
12
21
16
10
35
3
122
High
Cedar Hills
25
12
18
8
10
30
3
106
Antlers
25
4
21
12
9
30
3
104 Arbuckle-Timbered Hills
25
4
18
10
9
30
3
99
Arkansas Novaculite
25
4
18
10
5
30
3
95 Rush Springs
15
4
21
10
9
30
3
92
Vamoosa-Ada
15
4
18
12
9
30
3
91 Central Oklahoma
15
4
18
12
9
30
3
91
Moderate
Ouachita Mountains
25
4
15
10
5
25
3
87
Ogallala
5
4
21
10
10
30
6
86 Cretaceous
15
4
15
12
12
25
3
84
Permian
15
4
15
10
9
25
3
81 Pennsylvanian
15
4
15
10
9
25
3
81
Low
Mesozoic
10
4
15
10
9
25
3
76
Tishomingo Granite
10
4
6
20
10
15
3
68 Bedrock
Washita Igneous
10
4
6
10
5
15
3
53
Very Low
24
alluvium and terrace aquifers, nine were classified as very highly vulnerable, and one (the Gerty) as highly vulnerable. The DRASTIC indices for all other alluvium and terrace deposits are not displayed on the vulnerability map, but are assumed to range from 125-155, with a high to very high vulnerability. Most bedrock basins are overlain in part by alluvium and terrace deposits. Where overlain by these deposits, the vulnerability rating for the alluvium and terrace deposits should be used. Four bedrock basins were considered highly vulnerable. The Boone, Arbuckle-Simpson, and Blaine basins are composed of cavernous limestone or gypsum. These basins contain karst features, such as caves, sinkholes, and disappearing streams, which provide direct conduits for precipitation and runoff to transport contaminants to the water table. The Elk City basin has a shallow water table and consists of porous sandstone overlain by permeable sand. Seven bedrock basins were classified as moderately vulnerable. The Cedar Hills, Antlers, and Rush Springs basins consist of sandstone; the Vamoosa-Ada, and Central Oklahoma basins consist of sandstone interbedded with shale; the Arbuckle-Timbered Hills is a carbonate aquifer; and the Arkansas Novaculite produces water from highly fractured chert. Although the basins are composed of different types of aquifer media, all contain high-yielding aquifers. Five basins with DRASTIC indices between 80 and 89 were considered to have low vulnerabil-ity. The Ogallala basin, although consisting of porous, semi-consolidated sand and gravel, has a low vulnerability rating because of its deep water table. The Ouachita Mountains, Cretaceous, Permian, and Pennsylvanian basins consist of interbedded sandstone, limestone, and shale. The porosities and permeabilities of these low-yielding rock formations are low, making them less vulnerable than others. The Mesozoic, Tishomingo Granite, and Washita Igneous hydrogeologic basins have DRASTIC indices less than 80, and have a very low vulnerability. These basins are composed of igneous or sedimentary material of low permeability. MAP LIMITATIONS Groundwater vulnerability was assessed for the 30 hydrogeologic basins described in this report. The hydrogeologic basins include both major and minor aquifers, but are not always the same as an aquifer. Because the basins include only geologic formations exposed at the surface, portions of some bedrock aquifers (such as the Central Oklahoma, Rush Springs, Antlers, Arbuckle-Simpson, and the Arbuckle-Timbered Hills) that are overlain by shallower formations are not included in the vulnerability assessment. The vulnerability map shows the relative vulnerability of the hydrogeologic basins, and is based on average values for each entire basin. The map is acceptable for evaluating relative vulnerabil-ity of the basins, but it should not be used in place of site-specific assessments. The map does not show areas that will be contaminated or areas that cannot be contaminated. Whether a specific site will ever have groundwater contamination depends on the likelihood of contaminant release, the type and quantity of contaminant released, and the hydrogeologic characteristics at that location.

25
The vulnerability assessment was based on available data. The DRASTIC indices and vulnera-bility map can be updated as additional or new information becomes available. The OWRB welcomes any additional data, references, or interpretations that may be used in determining the vulnerability of groundwater. Results from this study can be used in combination with other information (such as land use, potential sources of contamination, water quality, OWRB aquifer classifications, population density, and beneficial uses of the aquifer) to identify areas where special attention or protection efforts are warranted.

26
tjadkisson
27

28

29
References Abbott, M.M., Runkle, Donna, and Rea, Alan, 1997, Digital Data Sets That Describe Aquifer
Characteristics of the Vamoosa-Ada Aquifer in East-central Oklahoma: U.S. Geological Survey Open-File Report 96-444, based on a scale of 1:250,000, 2 diskettes.
Adams, G.P., and Bergman, D.L., 1996, Geohydrology of Alluvium and Terrace Deposits of the
Cimarron River from Freedom to Guthrie, Oklahoma: U.S. Geological Survey Water-Resources Investigations Report 95-4066, 57 p.
Aller, L., Bennett, T., Lehr, J.H., Petty, R.J. and Hackett, G., 1987, DRASTIC: A Standardized
System for Evaluating Groundwater Pollution Potential Using Hydrogeologic Settings: U.S. Environmental Protection Agency Report 600/2-87/035, 622 p.
Barclay, J.E., and Burton, L.C., 1953, Ground-Water Resources of the Terrace Deposits and
Alluvium of Western Tillman County, Oklahoma: Oklahoma Planning and Resources Board, Bulletin No. 12, 71 p, 6 plates.
Becker, C.J., Runkle, Donna, and Rea, Alan, 1997a, Digital Data Sets That Describe Aquifer
Characteristics of the Elk City Aquifer in Western Oklahoma: U.S. Geological Survey Open-File Report 96-449, based on a scale of 1:63,360, 1 diskette.
------1997b, Digital Data Sets That Describe Aquifer Characteristics of the Enid Isolated Terrace
Aquifer in Northwestern Oklahoma: U.S. Geological Survey Open-File Report 96-450, based on a scale of 1:62,500, 1 diskette.
Becker, M.F., 1998, Steady-State Simulation of Ground-Water Flow in the Rush Springs
Aquifer, Western Oklahoma: U.S. Geological Survey Water-Resources Investigations Report 98-4082.
Becker, M.F. and Runkle, D.L., 1998, Hydrogeology, Water Quality, and Geochemistry of the
Rush Springs Aquifer, Western Oklahoma: U.S. Geological. Survey Water-Resources Investigations Report 98-4081.
Bingham, R.H., and Moore, R.L., 1975, Reconnaissance of the Water Resources of the Okla-
homa City Quadrangle, Central Oklahoma: Oklahoma Geological Survey Hydrologic Atlas 4, 4 sheets, scale 1:250,000.
Bingham, R.H., and Bergman, D.L., 1980, Reconnaissance of the Water Resources of the Enid
Quadrangle, North-Central Oklahoma: Oklahoma Geological Survey Hydrologic Atlas 7, 4 sheets, scale 1:250,000.
30
Carr, J.E., and Bergman, D.L., 1976, Reconnaissance of the Water Resources of the Clinton Quadrangle, West-Central Oklahoma: Oklahoma Geological Survey Hydrologic Atlas 5, 4 sheets, scale 1:250,000.
Cederstrand, J.R., 1996a, Digital Geologic Map of Ardmore-Sherman Quadrangles, South-
Central Oklahoma: U.S. Geological Survey Open-File Report 96-370, based on a scale of 1:250,000, 3 diskettes.
------1996b, Digital Geologic Map of Beaver County, Oklahoma: U.S. Geological Survey Open-
File Report 96-371, based on a scale of 1:250,000, 1 diskette. ----- 1996c, Digital Geologic Map of Cimarron County, Oklahoma: U.S. Geological Survey
Open-File Report 96-372, based on a scale of 1:250,000, 1 diskette. ----- 1996d, Digital Geologic Map of Clinton Quadrangle, West-Central Oklahoma: U.S.
Geological Survey Open-File Report 96-373, based on a scale of 1:250,000, 2 diskettes. ----- 1996e, Digital Geologic Map of Enid Quadrangle, North-Central Oklahoma: U.S. Geologi-
cal Survey Open-File Report 96-374, based on a scale of 1:250,000, 4 diskettes. ----- 1996f, Digital Geologic Map of Fort Smith Quadrangle, East-Central Oklahoma: U.S.
Geological Survey Open-File Report 96-375, based on a scale of 1:250,000, 2 diskettes. ----- 1996g, Digital Geologic Map of Lawton Quadrangle, Southwestern Oklahoma: U.S.
Geological Survey Open-File Report 96-376, based on a scale of 1:250,000, 3 diskettes. ----- 1996h, Digital Geologic Map of McAlester-Texarkana Quadrangles, Southeastern Okla-
homa: U.S. Geological Survey Open-File Report 96-377, based on a scale of 1:250,000, 3 diskettes.
----- 1996i, Digital Geologic Map of Oklahoma City Quadrangle, Central Oklahoma: U.S.
Geological Survey Open-File Report 96-378, based on a scale of 1:250,000, 2 diskettes. ----- 1996j, Digital Geologic Map of Texas County, Oklahoma: U.S. Geological Survey Open-
File Report 96-379, based on a scale of 1:250,000, 1 diskette. ----- 1996k, Digital Geologic Map of Tulsa Quadrangle, Northeastern Oklahoma: U.S. Geologi-
cal Survey Open-File Report 96-380, based on a scale of 1:250,000, 2 diskettes. ----- 1996l, Digital Geologic Map of Woodward Quadrangle, Northwestern Oklahoma: U.S.
Geological Survey Open-File Report 96-381, based on a scale of 1:250,000, 2 diskettes. Christenson, S.C., 1983, Numerical Simulation of the Alluvium and Terrace Aquifer Along the
North Canadian River from Canton Lake to Lake Overholser, Central Oklahoma: U.S. Geological Survey Water Resources Investigations Report 83-4076, 36 p.
31
Christenson, S.C., Parkhurst, D.L., and Fairchild, R.W., 1994, Geohydrology and Water Quality of the Roubidoux Aquifer, Northeastern Oklahoma: Oklahoma Geological Survey Circular 96, 70 p.
D'Lugosz, J.J., McClaflin, R.G., and Marcher, M.V., 1986, Geohydrology of the Vamoosa-Ada
Aquifer East-Central Oklahoma: Oklahoma Geological Survey Circular 87, 42 p. Davis, L. V., 1960, Geology and Ground-Water Resources of Southern McCurtain
County, Oklahoma: Oklahoma Geological Survey Bulletin 86, 108 p. Davis, R.E., and Christenson, S.C., 1981, Geohydrology and Numerical Simulation of the
Alluvium and Terrace Aquifer along the Beaver-North Canadian River from the Panhan-dle to Canton Lake, Northwestern Oklahoma: U.S. Geological Survey Open-file Report 81-483, 42 p., 15 pl.
ESRI (Environmental Systems Research Institute, Inc.), 1997, ArcView Version 3.0a:
Redlands, CA. Fairchild, R.W., Hanson, R.L., and Davis, R.E., 1990, Hydrology of the Arbuckle
Mountains Area, South-Central Oklahoma: Oklahoma Geological Survey Circular 91, 111 p. Hart, D.L., Jr., 1974, Reconnaissance of the Water Resources of the Ardmore and Sherman
Quadrangles, Southern Oklahoma: Oklahoma Geological Survey Hydrologic Atlas 3, 4 sheets, scale 1:250,000.
Hart, D.L., Jr., and Davis, R.E., 1981, Geohydrology of the Antlers Aquifer (Cretaceous),
Southeastern Oklahoma: Oklahoma Geological Survey Circular 81, 33 p. Hart, D.L., Jr., Hoffman, G.L., and Goemaat, R.L., 1976, Geohydrology of the Oklahoma
Panhandle, Beaver, Cimarron, and Texas Counties: U.S. Geological Survey Water-Resources Investigations 75-25, 62 p.
Havens, J.S., 1977, Reconnaissance of the Water Resources of the Lawton Quadrangle, South-
western Oklahoma: Oklahoma Geological Survey Hydrologic Atlas HA-6, 4 sheets, scale 1:250,000.
Havens, J.S., 1983, Reconnaissance of Ground Water in Vicinity of Wichita Mountains,
Southwestern Oklahoma: Oklahoma Geological Survey Circular 85, 13 p. Havens, J.S., 1989, Geohydrology of the Alluvial and Terrace Deposits of the North Canadian
River from Oklahoma City to Eufaula Lake, Central Oklahoma: U.S. Geological Survey Water-Resources Investigations Report 88-4234, 32 p., 12 pl.
32
Havens, J.S., and Christenson, S.C., 1984, Numerical Simulation of the High Plains Regional Aquifer, Northwestern Oklahoma: U.S. Geological Survey Water-Resources Investiga-tions Open-File Report 83-4269, 27 p.
Imes, J.L., and Emmett, L.F., 1994, Geohydrology of the Ozark Plateaus Aquifer System in Parts
of Missouri, Arkansas, Oklahoma, and Kansas: U.S. Geological Survey Professional Paper 1414-D, 127 p.
Johnson, K. S.,1990a, Standard Outcrop Section of the Blaine Formation and Associated Strata
in Southwestern Oklahoma: Oklahoma Geology Notes, v. 50, n.5, p. 144-168. _____1990b, Hydrogeology and Karst of the Blaine Gypsum-Dolomite Aquifer, Southwestern
Oklahoma: Oklahoma Geological Survey Special Publication 90-5, 31 p. Kent, D.C., 1980, Evaluation of Aquifer Performance and Water Supply Capabilities of Alluvial
and Terrace Deposits of the North Fork of the Red River in Beckham, Greer, Kiowa and Jackson Counties, Oklahoma: Final Report submitted to the Oklahoma Water Resources Board, Oklahoma State University, 132 p.
Kent, D.C., Beausoleil, Y.J., and Witz, F.E., 1982, Evaluation of Aquifer Performance and Water
Supply Capabilities of the Enid Isolated Terrace Aquifer in Garfield County, Oklahoma: Final Report submitted to the Oklahoma Water Resources Board, Oklahoma State University, 58 p., 19 figs.
Kent, D.C., and Naney, J.W., 1978, Results of Computer Modeling of Alluvium and Terrace
Deposits in Western Tillman County and Along the Washita River, Southwestern Oklahoma, for Water Supply Capability: Stillwater, OK, final report submitted to the Oklahoma Water Resources Board, administrative report by Oklahoma State University and Scientific and Education Administration, 52 p., 35 figs.
Kent, D.C., Duckwitz, L., and LeMaster, L., 1987, Evaluation of the Aquifer Performance and
Water Supply Capabilities of the Isolated Terrace (Gerty Sand) in Garvin, McClain, and Pontotoc Counties: Final Report to the Oklahoma Water Resources Board, Oklahoma State University, 77 p.
Kent, D.C., Neafus, R.J., Patterson, J.W., Jr., Schipper, M.R., 1984, Evaluation of the Aquifer
Performance and Water Supply Capabilities of the Washita River Alluvium in Oklahoma: Final Report to the Oklahoma Water Resources Board, Oklahoma State University, 49 p.
Lindberg, F.A., ed., 1987, Correlation of Stratigraphic Units of North America (COSUNA)
Project, Texas-Oklahoma Tectonic Region: American Association of Petroleum Geologists, 1 sheet.
Lyons, T.D., 1981, A Ground-Water Management Model for the Elk City Aquifer in Washita,
Beckham, Custer and Roger Mills Counties, Oklahoma: Stillwater, OK, Oklahoma State University, master's thesis, 88 p., 2 pls., 43 figs.
33
Marcher, M.V., 1969, Reconnaissance of the Water Resources of the Fort Smith Quadrangle, East-Central Oklahoma: Oklahoma Geological Survey Hydrologic Atlas 1, 4 sheets, scale 1:250,000.
Marcher, M.V., and Bingham, R.H., 1971, Reconnaissance of the Water Resources of the Tulsa
Quadrangle, Northeastern Oklahoma: Oklahoma Geological Survey Hydrologic Atlas 2, 4 sheets, scale 1:250,000.
Marcher, M.V., and Bergman, D.L., 1983, Reconnaissance of the Water Resources of the
McAlester and Texarkana Quadrangles, Southeastern Oklahoma: Oklahoma Geological Survey Hydrologic Atlas HA-9, 4 sheets, scale 1:250,000.
Morton, R.B., 1980, Reconnaissance of the Water Resources of the Woodward Quadrangle,
Northwestern Oklahoma: Oklahoma Geological Survey Hydrologic Atlas 8, 4 sheets, scale 1:250,000.
Morton, R.B., 1992, Simulation of Ground-Water Flow in the Antlers Aquifer in Southeastern
Oklahoma and Northeastern Texas: U.S. Geological Survey Water Resources Investigations Report 88-4208, 22 p.
Morton, R.B., and Goemaat, R.L., 1973, Reconnaissance of the Water Resources of Beaver
County, Oklahoma: U.S. Geological Survey Hydrologic Investigations Atlas HA-450, 3 sheets, scale 1:125,000.
Osborn, N.I., Eckenstein, E., and Koon, K.Q., 1998, Vulnerability Assessment of Twelve Major
Aquifers in Oklahoma: Oklahoma Water Resources Board Technical Report 98-5, 29 p. OSDH (Oklahoma State Department of Health), 1983, Maps Showing Principal Ground-Water
Resources and Recharge Areas in Oklahoma: 2 sheets, scale 1:500,000. OWRB, 1993, Statistical Summary of Groundwater Quality Data: 1986-1991 for the Major
Groundwater Basins in Oklahoma: unpublished report for the U.S. EPA for FY 93 106 Groundwater, Task 400, 23 p.
OWRB, 1995, Update of the Oklahoma Comprehensive Water Plan 1995: Publication Number
139, 148 p. Parkhurst, D.L., Christenson, Scott, and Breit, G.N., 1996, Ground-Water-Quality Assessment of
the Central Oklahoma Aquifer, Oklahoma--Geochemical and Geohydrologic Investiga-tions: U.S. Geological Survey Water-Supply Paper 2357-C, 98 p.
Reed, E.W., Schoff, S.L., and Branson, C.C., 1955, Groundwater Resources of Ottawa County,
Oklahoma: Oklahoma Geological Survey Bulletin 72, 203 p. Runkle, Donna, and Rea, Alan, 1997, with source data sets and supplemental information
provided by Scott Christenson, Digital Data Sets that Describe Aquifer Characteristics of
34
the Central Oklahoma Aquifer in Central Oklahoma: U.S. Geological Survey Open-File Report 96-454, based on a scale of 1:250,000, 2 diskettes.
Runkle, D.L., and McLean, J.S., 1995, Steady-State Simulation of Ground-Water Flow in the
Blaine Aquifer, Southwestern Oklahoma and Northwestern Texas: U.S. Geological Survey Open-File Report 94-387, 92 p., 1 diskette.
Sapik, D.B., and Goemaat, R.L., 1973, Reconnaissance of the Ground-Water Resources of
Cimarron County, Oklahoma: U.S. Geological Survey Hydrologic Investigations Atlas HA-373, 3 sheets, scale 1:125,000.
Schruben, P.G., Arndt, R.E., and Bawiec, W.J., and Abroxiak, R.A., 1994, Geology of the
Conterminous United States at 1:2,500,000 -- A Digital Representation of the 1974 P.B. King and H.M. Beikman Map: U.S. Geological Survey Digital Data Series DDS-11, 1 CD-ROM.
Wood, P.R., and Hart, D.L., Jr., 1967, Availability of Ground Water in Texas County, Okla-
homa: U.S. Geological Survey Hydrologic Investigations Atlas HA-250, 3 sheets, scale 1:125,000.
APPENDIX A
Description of Hydrogeologic Basins
A-1
Description of Hydrogeologic Basins A description of the basin definitions, boundaries, and hydrogeology for the hydrogeologic basins is presented below. Table A-1 lists for each basin the names, ages, and codes for the geologic units, as cited in the surficial geology maps in the hydrologic atlases of Oklahoma. The 12 hydrologic atlases are available from the Oklahoma Geological Survey. The digital surficial geology sets from the hydrologic atlases are available on the Internet at http://wwwok.cr.usgs.gov/gis/geology/index.html. The digital surficial geology map of Hydro-logic Atlas 3 does not include the alluvium and terrace deposits. To identify the alluvium and terrace deposits in the Ardmore and Sherman quadrangles, refer to Sheet 1 in Hydrologic Atlas 3 (Hart, 1974). Alluvium and Terrace Deposits Alluvium and terrace deposits are Quaternary in age, and occur along modern and ancient streams throughout the state. They encompass the outcrop of alluvium, terrace deposits, and dune sand. Alluvium and terrace deposits along the major rivers (Salt Fork of the Arkansas, Arkansas, Cimarron, Beaver-North Canadian, Canadian, Washita, North Fork of the Red, and the Red) extend from 1-15 miles from the river banks. Terraces represent older, higher stages of the rivers that have since cut their channels deeper (OWRB, 1995). Alluvium and terrace deposits consist mainly of unconsolidated deposits of gravel, sand, silt, and clay. Along large streams, these deposits consist of clay and silt at the surface, grading down-ward into coarse sand and gravel at the base (Carr and Bergman, 1976). The alluvium located along minor streams is composed of fine-grained sand containing varying amounts of silt and clay (Bingham and Bergman, 1980). Volcanic ash is found in some terrace deposits. The thickness of the alluvium and terrace deposits ranges from a few feet to about 200 feet. Terrace deposits on upland areas and alluvium along tributaries generally are thin, less than 50 feet. Deposits are sometimes overlain by sand dunes, sometimes as thick as 150 feet. Water is available from saturated layers of sand and gravel, and well yields are largest where the coarse sand and gravel layers are thickest (Carr and Bergman, 1976). Yields of wells generally range from 10-500 gpm, but can locally be greater than 1,000 gpm. The alluvium and terrace deposits are major sources of water for irrigation, public water, and industrial supply. Water obtained from shallow wells in the alluvium of local stream channels is used across the state for domestic purposes and to supply stock wells. Recharge rates and hydraulic conductivity values were obtained from groundwater basin studies on the alluvium and terrace deposits of the Cimarron River, North Canadian River, Washita River, and North Fork of the Red River; and the Enid Isolated Terrace, Tillman Terrace, and Gerty Sand (Adams and Bergman, 1996; Christenson, 1983; Davis and Christenson, 1981; Havens, 1989; Kent, 1980; Kent and Naney, 1978; Kent and others, 1982, 1984, 1987).
A-2
Recharge rates range from 0.9-3.7 in/yr, and hydraulic conductivity values generally range from 300-1,000 gpd/ft2. Antlers The Antlers hydrogeologic basin is the outcrop of the Early Cretaceous-age Antlers Sandstone, DeQueen Limestone, and Holly Creek Formation. The basin encompasses parts of Atoka, Bryan, Carter, Choctaw, Johnston, Love, Marshall, McCurtain, and Pushmataha counties in southeastern Oklahoma. In outcrop the Antlers Sandstone consists of sand, clay, conglomerate, and limestone. The upper part of the formation consists of beds of sand, poorly cemented sandstone, sandy shale, silt, and clay (Hart and Davis, 1981). Small portions of the Holly Creek Formation and DeQueen Limestone are exposed in eastern McCurtain County. The Holly Creek Formation consists of lenticular beds of gravel, clay, and sandy clay, and the DeQueen Limestone is limestone interbedded with silt and conglomerate (Marcher and Bergman, 1983). The Antler aquifer extends southward in the subsurface, where it is overlain by younger Cretaceous formations that comprise the Cretaceous hydrogeologic basin. The subsurface portion of the Antlers aquifer is not included in the vulnerability assessment. However, it should be noted that recharge to the subsurface portion of the aquifer is primarily from rainfall that percolates into the outcrop portion. Recharge rates ranging from 0.32-0.96 in/yr were used to simulate recharge in a calibrated groundwater flow model of the aquifer. Simulated aquifer hydraulic conductivity values range from 0.87-3.75 ft/day, or 6.5-28 gpd/ft2 (Morton, 1992). The Antlers aquifer is a major aquifer in Oklahoma. Large-capacity wells tapping the aquifer commonly yield 100-500 gpm, with reported production as high as 1,700 gpm. Morton (1992) estimated that 4,600 acre-feet of water was pumped in 1980 for public supply, irrigation, and industrial uses. Wells completed in the Holly Creek Formation generally yield 10-50 gpm (Marcher and Bergman, 1983). Arbuckle-Simpson The Arbuckle-Simpson hydrogeologic basin consists of the Arbuckle and Simpson groups of Late Cambrian to Middle Ordovician age and the Sylvan Shale, Fernvale Limestone, and Viola Limestone of Ordovician age, where they are exposed at the surface. Also included in the basin are the Woodford Shale and Hunton Group of Devonian and Silurian age. The basin overlies about 500 mi2 in Carter, Johnston, Murray, and Pontotoc counties in south-central Oklahoma. The western part of the basin, referred to as the Arbuckle Hills, is characterized by a series of ridges formed on intensely folded and faulted rocks. The eastern part of the basin, called the Arbuckle Plains, is characterized by a gently rolling topography formed on relatively flat-lying, intensely faulted limestone beds. A few small karst features have developed in the western part of the basin from solution of the underlying carbonate rocks (Fairchild and others, 1990).
A-3
The Arbuckle and Simpson groups comprise the Arbuckle-Simpson aquifer, which consists of limestone, dolomite, and sandstone. The rocks were subjected to intensive folding and faulting associated with major uplift of the area during Early to Late Pennsylvanian time. Sandstone beds in the Simpson Group have intergranular porosity, but the rocks of the Arbuckle Group have almost no intergranular porosity; all void space is in joints, fractures, and solution channels (Fairchild and others, 1990). Recharge to the aquifer, based on the total average annual base flow from streams that drain the area, is 4.7 in/yr, or 12% of the annual average precipitation (Fairchild and others, 1990). The average transmissivity of the aquifer is estimated at 15,000 ft2/day. Based on an average saturated thickness of about 3,500 feet in the outcrop area (Fairchild and others, 1990), the average hydraulic conductivity is about 4 ft/day, or 30 gpd/ft2. Wells in the Arbuckle-Simpson aquifer commonly yield 25-600 gpm of water that is of good quality, generally less than 500 mg/L dissolved solids (OSDH, 1983). Water is used for municipal, industrial, commercial, agricultural, and domestic purposes (Fairchild and others, 1990). Arbuckle-Timbered Hills The Arbuckle-Timbered Hills hydrogeologic basin in southwestern Oklahoma encompasses parts of Caddo, Comanche, and Kiowa counties. It contains rocks of the Late Cambrian to Middle Ordovician-age Arbuckle and Timbered Hills groups exposed at the surface. Also included in the basin are the Ordovician-age Viola Limestone and Bromide Formation that crop out in a few isolated areas near the Kiowa-Washita county line. South of the Wichita Mountains, part of the Arbuckle-Timbered Hills aquifer is overlain by as much as 2,000 feet of younger rocks (Havens, 1977). This portion of the aquifer is not included in the vulnerability assessment. Rocks of the Arbuckle and Timbered Hills groups consist of limestone, dolomite, siltstone, sandstone, conglomerate and shale (Havens, 1977). The outcrop area of the Arbuckle-Timbered Hills aquifer is known as the Limestone Hills or Slick Hills. The rocks are intensely folded and faulted; as a result, most groundwater movement is made possible by solution of the limestone and dolomite along bedding planes, fractures, and faults (Havens, 1983). Recharge to the Arbuckle-Timbered Hills aquifer probably is less than 2% of the average annual precipitation of about 30 inches (Havens, 1977). Availability of groundwater in the Limestone Hills is erratic because of faulting and folding. Most wells are 500 feet deep or more, and water generally is under artesian conditions. Flowing wells and springs yield as much as 100 gpm (Havens, 1983). Wells and springs provide water for domestic use and a rural water district (Havens, 1977). Arkansas Novaculite The Arkansas Novaculite hydrogeologic basin encompasses parts Latimer, McCurtain, and Pushmataha counties in southeastern Oklahoma. The basin is on two structural features in the Ouachita Mountains geologic province: the Potato Hills Anticlinorium, which straddles the Latimer-Pushmataha county line, and the Broken Bow uplift in south central McCurtain County. The Ouachita Mountains are characterized by broad synclines and narrow anticlines separated by
A-4
steep, southward-dipping thrust faults and broken by many small faults. Rocks of Mississippian, Devonian, Silurian, and Ordovician age comprise the basin. The primary water-yielding formations in the basin are the Bigfork Chert and the Arkansas Novaculite. These formations consist of novaculite and chert with some interbedded shale and sandstone. The highly broken and fractured rocks can potentially yield moderate to large amounts of water. However, because of their remoteness, few wells have been drilled into these formations, and their potential can only be inferred (Marcher and Bergman, 1983). Average annual precipitation is about 48 inches. The amount of groundwater recharge is unknown, but it probably does not exceed 1% of total precipitation due to the steep slopes, thin soils, and low permeability of the bedrock (Marcher and Bergman, 1983). Blaine The Blaine groundwater basin underlies approximately 850 mi2 of southwestern Oklahoma, and includes all or parts of Harmon, Jackson, and Greer counties. The basin consists of the Permian-age Blaine Formation and Dog Creek Shale. The basin is bounded on the east by the eastern limit of the outcrop of the Blaine Formation; on the south and west by the Oklahoma-Texas state border, and on the north by the Salt Fork of the Red River. The Blaine Formation consists of a cyclic series of interbedded gypsum, shale, and dolomite. Water is obtained from cavities, solution channels, and fractures present in the gypsum and dolomite beds. Solution openings are formed when percolating rain water and circulating groundwater dissolve beds of soluble gypsum (CaSO4@2H2O) and dolomite (CaMg(CO3)2) (Johnson, 1990b). The Dog Creek Shale overlies the Blaine Formation in much of the basin, and contributes limited amounts of water. The Dog Creek consists of up to 200 feet of red-brown shale with thin gypsum and dolomite beds in the lower 50 feet of the formation (Johnson, 1990a). Karst features, such as caves, sinkholes, disappearing streams, and springs, occur within the basin, making the basin very vulnerable to contamination. Karst features are most abundant near streams, where fresh water percolates into the gypsum. Karst development is generally highest in areas where the Blaine crops out and where the Dog Creek Shale is less than 60 feet thick; it is lowest where the Dog Creek Shale is greater than 100 feet (Johnson, 1990b; Runkle and McLean, 1995). Natural recharge to the basin occurs from infiltration of precipitation and from streams that flow across sinkholes. Recharge is greatest where the Dog Creek Shale is less than 60 feet. Average recharge to the aquifer is estimated to be 1.5 in/yr, or 6% of the average annual precipitation of 24 inches (Runkle and McLean, 1995). Hydraulic conductivity varies considerably in the basin. It is greatest where dissolution of gypsum and dolomite occurs, in areas of high recharge. Using a groundwater flow model of the aquifer, Runkle and McLean (1995) estimated the average hydraulic conductivity for areas of low recharge to be 4 ft/day (30 gpd/ft2) and the average value for areas of high recharge to be 71 ft/day (531 gpd/ft2). Hydraulic conductivity is suspected to be much higher in local areas where cavern development is extensive.
A-5
Water from the Blaine aquifer is of fair to poor quality, with the total dissolved solids (TDS) ranging from 1,500-5,000 mg/L. The water has high concentrations of calcium and sulfate, reflecting dissolution of the gypsum beds. Analysis of 26 groundwater samples from the OWRB monitoring network indicates the mean TDS concentration is 3,761 mg/L, and the mean sulfate concentration is 1,351 mg/L (OWRB, 1993). These concentrations are well above the secondary maximum contaminant levels of 500 and 250 mg/L, for TDS and sulfate, respectively. The highly mineralized aquifer is a potential source of drinking water, as defined by the EPA, but is not currently used as a drinking water supply. However, the aquifer is a major source of irrigation water in the basin. Irrigation wells are typically 50-300 feet deep and yield 300-2,000 gpm. Boone The Boone hydrogeologic basin in northeastern Oklahoma encompasses all of Delaware County and portions of Ottawa, Craig, Mayes, Cherokee, and Adair counties. It consists of the Missis-sippian, Devonian, and Ordovician strata exposed at the surface. The basin is in the Ozark Uplift geologic province, where erosion has cut deep, V-shaped valleys into a flat plateau. The Boone aquifer consists of the Mississippian Keokuk and Reeds Spring formations and the St. Joe Group, commonly called the Boone Chert or Boone Formation. The maximum thickness of the aquifer ranges from less than 5 feet in parts of Adair and Delaware counties to about 400 feet in Ottawa County. The Boone Formation consists of dense, fine-grained limestone and massive gray chert. Where the chert is fractured, the formations are permeable (Imes and Emmett, 1994; Marcher and Bingham, 1971). The Boone Formation contains lead and zinc ores that were mined extensively in the tri-state mining district of northeastern Oklahoma, southeastern Kansas, and southwestern Missouri from about 1890 to 1970 (Christenson and others, 1994). The Boone aquifer is absent from erosion in a few areas in Delaware, Cherokee, and Adair counties. In these areas the Chattanooga Shale of Devonian age and the Burgen Sandstone, Sylvan Shale, and Cotter Dolomite of Ordovician age are exposed at the surface. The Burgen Sandstone and Cotter Dolomite are part of the underlying Roubidoux aquifer. Younger Mississippian formations overlie the Boone Formation along the western and southern edges of the Boone hydrogeologic basin. Formations include the Mississippian-age Pitkin Limestone, Fayetteville Shale, Batesville Sandstone, Hindsville Limestone, and the Moorefield Formation. These units consist of alternating sequences of low-permeability shale and low-permeability to relatively permeable limestone, sandstone, and coal. Locally, these rocks contain permeable zones and aquifers (Imes and Emmett, 1994). Recharge to the Boone hydrogeologic basin is almost entirely from direct infiltration of precipita-tion. The factors that make the outcrop of the Boone Formation favorable to groundwater recharge also make it vulnerable to contamination. Precipitation may quickly infiltrate the unsaturated zone because soil and subsoil in the Ozarks is thin, near-surface faults and fracture systems are common, and dissolution of the carbonate rocks is widespread. Although slopes are often steep, the trees, grass and other vegetation hold the water, reducing the loss through runoff. Sinkholes in parts of the area are capable of large intakes from disappearing streams. In the
A-6
mining area, abandoned mine shafts, wells, and test holes can be conduits for water to enter the aquifer (Reed and others, 1955). Most of the wells in the Boone hydrogeologic basin are used for domestic purposes, although some are used for agriculture (such as poultry operations), commercial, and public supply purposes. An examination of more than 2,000 well drillers' logs indicated that estimated yields range from 0.3 to more than 100 gpm, with most wells yielding less than 25 gpm. Cedar Hills The Cedar Hills hydrogeologic basin is the outcrop area of the Permian-age Cedar Hills Sandstone. The basin encompasses parts of Alfalfa, Garfield, Major, and Woods counties in northwestern Oklahoma. The Cedar Hills Sandstone consists of fine-grained sandstone inter-bedded with layers of siltstone and shale. Wells commonly yield 150-300 gpm (OSDH, 1983). Central Oklahoma The Central Oklahoma hydrogeologic basin is the outcrop area of the Central Oklahoma aquifer, as delineated by the USGS (Parkhurst and others, 1996). The digital boundaries were obtained from Runkle and Rea (1997). The basin encompasses all or parts of Cleveland, Lincoln, Logan, Oklahoma, Payne, and Pottawatomie counties in central Oklahoma. The northern boundary of the basin is the Cimarron River, and the southern boundary is the Canadian River. The basin is bounded on the east by the eastern limit of the outcrop of the Oscar Group; and on the west by the western limit of the outcrop of the Garber Sandstone. The eastern part of the basin is characterized by low hills, and the western part by a gently rolling plain (Parkhurst and others, 1996). The basin consists primarily of the Permian-age Garber Sandstone and Wellington Formation. It also includes the Permian-age Chase, Council Grove, and Admire groups, as described by Parkhurst and others (1996). These groups are the same as the Pennsylvanian-age Oscar Group, described in the hydrologic atlases. The western third of the aquifer is overlain by younger rocks in the Hennessey Group, and is not included in the vulnerability assessment. The Garber Sandstone and Wellington formations consist of fine-grained sandstone interbedded with siltstone and mudstone, and the Oscar Group consists of beds of fine-grained sandstone, shale, and thin limestone. Values for hydraulic conductivity of sandstone, calculated from specific-capacity data on drillers' logs, range from 0.16 -120 ft/day (1.20-898 gpd/ft2), with a median of 4.5 ft/day (33.7 gpd/ft2). The median recharge rate of the basin, calculated from base-flow discharge measurements, is 1.61 in/yr (Parkhurst and others, 1996). The Central Oklahoma aquifer is used extensively for municipal, industrial, commercial, and domestic water supplies. Wells completed in the Garber Sandstone and Wellington Formation can yield as much as 600 gpm, but generally yield from 200-400 gpm. Wells completed in the Oscar Group generally yield 10-100 gpm (Parkhurst and others, 1996). Cretaceous The Cretaceous hydrogeologic basin is the outcrop of the Upper and Lower Cretaceous-age rocks that overly the Antlers Sandstone. The basin encompasses parts of Bryan, Choctaw, Love,
A-7
Marshall, and McCurtain counties in southeastern Oklahoma. The basin lies within the Gulf Coastal Plain, where relief is low, and topography is gently rolling to hilly. Soils are thick and permeable and can intercept considerable amounts of precipitation (Marcher and Bergman, 1983). The Lower Cretaceous units include the Goodland Limestone, Walnut Clay, Kiamichi Formation, Caddo Formation, Bokchito Formation, Bennington Limestone, and the Grayson Marlstone. The Upper Cretaceous units include the Woodbine Formation and the Eagle Ford Formation. Typical deposits in the basin consist of a sequence of shale, sandstone, siltstone, and limestone units (Marcher and Bergman, 1983). Water is derived in small quantities from thin sandstone units and from cracks and solution openings in limestone units (Davis, 1960). Groundwater is used primarily for household and stock water, and some is used for public water supply. Elk City The Elk City hydrogeologic basin is in western Oklahoma, and encompasses parts of Beckham, Custer, Roger Mills, and Washita counties. It is defined by the outcrop of the Elk City Sand-stone. The Elk City Sandstone is composed of very friable sandstone. The aquifer supplies groundwater for irrigation, domestic, and industrial purposes (Becker and others, 1997a). Wells commonly yield 25-300 gpm of water (OSDH, 1983). Lyons (1981) estimated hydraulic conductivity values of 6.7, 66.8, and 100.3 ft/day (50, 500, and 750 gpd/ft2) and recharge rates of 2.0, 3.92, and 4.0 in/yr by simulating groundwater flow in a computer model. Mesozoic The Mesozoic hydrogeologic basin is comprised primarily of Jurassic, Triassic, and Cretaceous-age rocks that crop out in the northwestern corner of Cimarron County, in the Oklahoma Panhandle. Also included in the basin is the Tertiary-age basalt that forms the cap rock of Black Mesa. Topography of the basin is characterized by many buttes capped by sandstone (Hart and others, 1976). The Mesozoic rocks in the basin consist of interbedded sandstone, limestone, shale, and dolomite. Minor quantities of water may be obtained from the Dakota Sandstone and the Cheyenne Sandstone Member of Cretaceous age; the Morrison Formation and the Exeter Sandstone of Jurassic age; and the Dockum Group of Triassic age (Sapik and Goemaat, 1973). Ouachita Mountains The Ouachita Mountains hydrogeologic basin encompasses parts of Atoka, Latimer, LeFlore, McCurtain, Pittsburg, and Pushmataha counties in southeastern Oklahoma. The northern edge of the basin is defined by the Carbon fault, the western edge by the Choctaw fault, and the southern edge by the outcrop of Cretaceous rocks in the Gulf Coastal Plain. The basin consists of intensely folded and faulted Pennsylvanian and Mississippian-age rocks. The basin is in the Ouachita Mountains geologic province, which is characterized by broad synclines and narrow anticlines separated by steep, southward-dipping thrust faults and broken by many small faults. The Ouachita Mountains have the most rugged topography in Oklahoma,
A-8
with an average relief of several hundred feet and local relief that exceeds 1,700 feet. The ridges are held up by hard, resistant sandstones; valleys are carved into soft, easily eroded shale (Marcher and Bergman, 1983). Bedrock in the Ouachita Mountains basin consists mainly of shale, siliceous shale, and sandstone. Geologic units include the Lynn Mountain Formation, Wapanucka Limestone, Johns Valley Shale, and Jackfork Group of Pennsylvanian age and the Stanley Group of Mississippian age. These rocks have been subjected to low-grade dynamic metamorphism that has increased their brittleness so that they have been broken by folding and faulting. The capability of the bedrock to store and transmit water depends almost entirely on fractures formed by folding and faulting. Well yields range from a few gallons per minute to as much as 50 gpm (Marcher and Bergman, 1983). Annual precipitation averages about 48 inches. The amount of groundwater recharge is unknown, but it probably does not exceed 1% of total precipitation due to steep slopes, thin soils, and low permeable bedrock (Marcher and Bergman, 1983). Ogallala The Ogallala basin encompasses Cimarron, Texas, and Beaver counties in the Oklahoma Panhandle, and parts of Harper, Ellis, Woodward, Dewey, and Roger Mills counties in western Oklahoma. The basin boundaries are defined by the outcrop of the Ogallala Formation. Also included in the basin are some isolated outcrops of Triassic, Jurassic, and Cretaceous-age rocks that are hydraulically connected to the aquifer. The Ogallala aquifer (also called the High Plains aquifer) is the principal source of water in the Oklahoma Panhandle, and is used extensively for irrigation. The aquifer commonly yields 500 to 1,000 gpm and can yield up to 2,000 gpm in thick, highly permeable areas (Hart and others, 1976; Havens and Christenson, 1984). An analysis of drillers' logs indicates the average depth to the first water zone in the basin is greater than 100 feet. Topography is moderately flat. The Ogallala basin is composed of semi-consolidated layers of sand, silt, clay, and gravel. Locally, deposits have been cemented with calcium carbonate to form impermeable beds of limestone and caliche near the surface (Hart and others, 1976; Havens and Christenson, 1984). Havens and Christenson (1984) developed a groundwater flow model of the High Plains aquifer in Oklahoma. In the calibrated model, they used recharge values of 0.23 and 0.45 in/yr in the western and eastern portions, respectively. They used hydraulic conductivity values of 8.28, 16.2, and 19.3 ft/day (62, 121, and 144 gpd/ft2) for the western, central, and eastern portions, respectively. Pennsylvanian The Pennsylvanian hydrogeologic basin encompasses much of the eastern half of the state. The basin consists of all the Pennsylvanian rocks that crop out in Oklahoma and that are not in the Vamoosa-Ada or Ouachita Mountains hydrogeologic basins. The basin is bordered on the west by the western extent of the Vanoss Formation, and does not include rocks in the Oscar Group. Although the hydrologic atlases assign a Pennsylvanian age to the Oscar Group, the more
A-9
recently assigned Permian age by Lindberg (1987) is used in this study. Also included in the basin are some Mississippian rocks exposed along the flanks of the Arbuckle-Simpson basin. The basin is composed of interbedded sandstone, shale, siltstone, and limestone. Water is obtained primarily from the sandstone layers. In areas where sandstone beds are thin or fine- grained, yields are less than 10 gpm; in many areas the yields are too small to supply enough water for household use. In areas where the fine-grained sandstone is thickest or where the rocks are broken by faults, wells can yield as much as 25 gpm (Bingham and Moore, 1975; Bingham and Bergman, 1980; Marcher and Bingham, 1971; Marcher, 1969). The Noxie Sandstone Member of the Chanute Formation, in the northern parts of Osage, Washington, and Nowata counties, may yield as much as 50 gpm (Marcher, 1969). In most of the basin, erosion has formed a gently rolling surface interrupted by east-facing escarpments and isolated buttes capped by resistant sandstone and limestone (Hart, 1974; Bingham and Bergman, 1980). The northeastern portion is along the western margin of the Ozark Plateau, where gently dipping rocks are broken by faults trending northeast-southwest (Marcher and Bingham, 1971). Average annual precipitation ranges from about 28 inches in the western part of the basin to about 42 inches in the southeastern part (Bingham and Moore, 1975; Hart, 1974). An estimated 1.5-3.5 inches are available to recharge the groundwater (Bingham and Moore, 1975). Permian The Permian hydrogeologic basin encompasses much of the central and western part of the state. The basin consists of all the Permian rocks that crop out in Oklahoma that are not in the Blaine, Cedar Hills, Central Oklahoma, Elk City, or Rush Springs hydrogeologic basins. It is bordered to the east by the eastern extent of the Oscar Group. As discussed above, the Oscar Group is considered to be of Permian age, and not Pennsylvanian, as reported in the hydrologic atlases. The Permian rocks consist mainly of red-brown shales, sandstones, and siltstones, with inter-bedded and disseminated gypsum in some formations (Bingham and Bergman, 1980; Carr and Bergman, 1976; Havens, 1977). In areas where sandstone beds are thin or fine-grained, yields are less than 10 gpm and, in many areas, the yields are too small to supply enough water for household use. In areas where the sandstone is thick or where the rocks are broken by faults, wells might yield as much as 25 gpm (Bingham and Moore, 1975; Bingham and Bergman, 1980; Hart, 1974; Marcher and Bingham, 1971; Marcher, 1969). The topography of the basin ranges from gently rolling to rugged. The predominant topography consists of rolling plains, moderate valley slopes, and upland slopes of 2-20%. Land forms range from steep-sloped cuestas to narrow box canyons along streams. Resistant gypsum beds cap the highlands in some areas (Carr and Bergman, 1976; Morton, 1980). Average annual precipitation ranges from about 21 inches in the west to about 33 inches in the east (Carr and Bergman, 1976; Morton, 1980).
A-10
Rush Springs The Rush Springs hydrogeologic basin is the Permian-age Rush Springs and Marlow formations of the White Horse Group, where they are exposed at the surface. Portions of the Rush Springs aquifer overlain by the less permeable Cloud Chief Formation are not included in the basin. The hydrogeologic basin is in western Oklahoma, and encompasses parts of Blaine, Caddo, Canadian, Comanche, Custer, Dewey, Ellis, Grady, Harper, Kiowa, Major, Stephens, Washita, Woods, and Woodward counties. The Rush Springs Formation is a massive, fine-grained, poorly-cemented sandstone with some interbedded dolomite, gypsum, and shale. The Marlow Formation is composed of interbedded sandstones, siltstones, mudstones, gypsum-anhydrite, and dolomite (OSDH, 1983; Becker and Runkle, 1998). The amount of shale increases in Dewey County and farther north (OSDH, 1983). The average recharge rate of the basin, calculated from base-flow discharge measurements, is about 2 in/yr, or about 7% of the average annual rainfall. Becker (1998) used hydraulic conduc-tivity values of 0.8-10 ft/day (6-74.8 gpd/ft2) to simulate groundwater flow in a groundwater flow model. The Rush Springs aquifer is an important source of water for irrigation, livestock, industrial, municipal, and domestic use. Wells commonly yield 25-300 gpm (OSDH, 1983); some irrigation wells in Caddo County are reported to yield as much as 1,000 gpm (Carr and Bergman, 1976). Tishomingo Granite The Tishomingo Granite hydrogeologic basin is the 150-square-mile exposure of Cambrian and Precambrian igneous rocks in parts of Atoka, Johnston, and Murray counties in south-central Oklahoma. The igneous rocks can be divided into the Colbert Porphyry of Cambrian age and the massive Precambrian granites. The Colbert Porphyry is a rhyolite that crops out in a few places in the western part of the Arbuckle Hills in Murray County. Precambrian Tishomingo and Troy Granites crop out east of the Arbuckle Hills in the Arbuckle Plains physiographic province, an area of gently rolling hills. The granites are 1.3 billion years old and about 10 miles thick (Hart, 1974). Hart (1974) speculates that the igneous rocks may yield small amounts of water. Vamoosa-Ada The Vamoosa-Ada hydrogeologic basin is the outcrop area of the Vamoosa-Ada aquifer as delineated by the USGS (Abbott and others, 1997). It is bounded to the south by the Canadian River. The basin extends over parts of Osage, Pawnee, Payne, Creek, Lincoln, Okfuskee, and Seminole counties in east-central Oklahoma. The aquifer consists of the rocks of the Late Pennsylvanian-age Vamoosa Formation and overlying Ada Group. The aquifer is a sequence of fine-to very fine-grained sandstone, siltstone, shale, and conglomerates interbedded with very thin limestones (D'Lugosz and others, 1986).
A-11
Hydraulic conductivity values of the aquifer, estimated from recovery tests, range from 2-4 ft/day (30-120 gpd/ft2), and average 3 ft/day (22 gpd/ft2). Base-flow measurements were used to estimate a recharge rate of 1.52 in/yr, which is about 4% of the total precipitation (D'Lugosz and others, 1986). Wells commonly yield 25-150 gpm, and locally yield as much as 300 gpm (OSDH, 1983). Washita Igneous The Washita Igneous hydrogeolgic basin consists of the Cambrian-age igneous rocks exposed in the Washita Mountains and scattered outcrops to the west. The basin encompasses parts of Comanche, Greer, Jackson, Kiowa, and Tillman counties in southwestern Oklahoma. The Washita Mountains consists of a block of igneous rocks bounded by steep faults. The igneous rocks include rhyolite flows, tuffs, conglomerate beds, and diabase sills of the Carton Rhyolite Group; granites in the Wichita Granite Group; and gabbros, anorthosites, and dirorites in the Raggedy Mountain Gabbro Group (Havens, 1977). No wells are known to obtain water from the igneous rocks. Barclay and Burton (1953) observed the granite outcrops to be intricately jointed and speculated that wells intersecting the joints below the water table might yield moderate quantities of water.
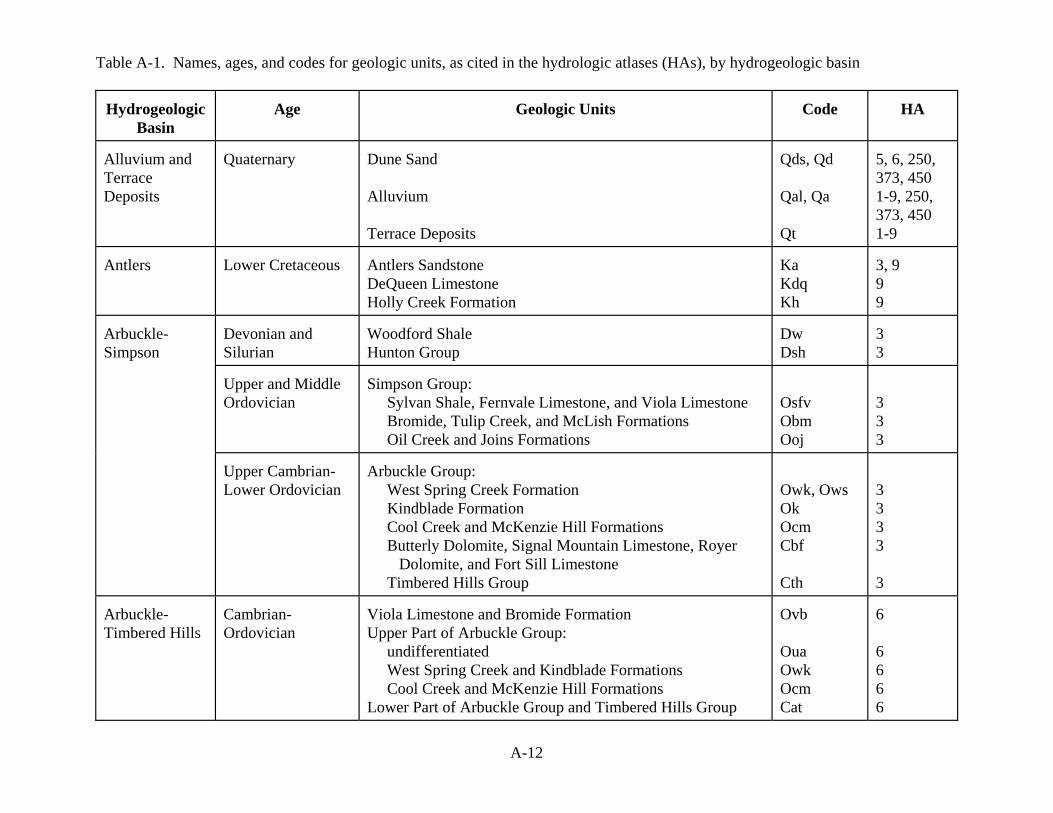
A-12
Table A-1. Names, ages, and codes for geologic units, as cited in the hydrologic atlases (HAs), by hydrogeologic basin Hydrogeologic
Basin
Age
Geologic Units
Code
HA
Alluvium and Terrace Deposits
Quaternary
Dune Sand Alluvium Terrace Deposits
Qds, Qd Qal, Qa Qt
5, 6, 250, 373, 450 1-9, 250, 373, 450 1-9
Antlers
Lower Cretaceous
Antlers Sandstone DeQueen Limestone Holly Creek Formation
Ka Kdq Kh
3, 9 9 9
Devonian and Silurian
Woodford Shale Hunton Group
Dw Dsh
3 3
Upper and Middle Ordovician
Simpson Group: Sylvan Shale, Fernvale Limestone, and Viola Limestone Bromide, Tulip Creek, and McLish Formations Oil Creek and Joins Formations
Osfv Obm Ooj
3 3 3
Arbuckle-Simpson
Upper Cambrian-Lower Ordovician
Arbuckle Group: West Spring Creek Formation Kindblade Formation Cool Creek and McKenzie Hill Formations Butterly Dolomite, Signal Mountain Limestone, Royer Dolomite, and Fort Sill Limestone Timbered Hills Group
Owk, Ows Ok Ocm Cbf Cth
3 3 3 3 3
Arbuckle-Timbered Hills
Cambrian-Ordovician
Viola Limestone and Bromide Formation Upper Part of Arbuckle Group: undifferentiated West Spring Creek and Kindblade Formations Cool Creek and McKenzie Hill Formations Lower Part of Arbuckle Group and Timbered Hills Group
Ovb Oua Owk Ocm Cat
6 6 6 6 6
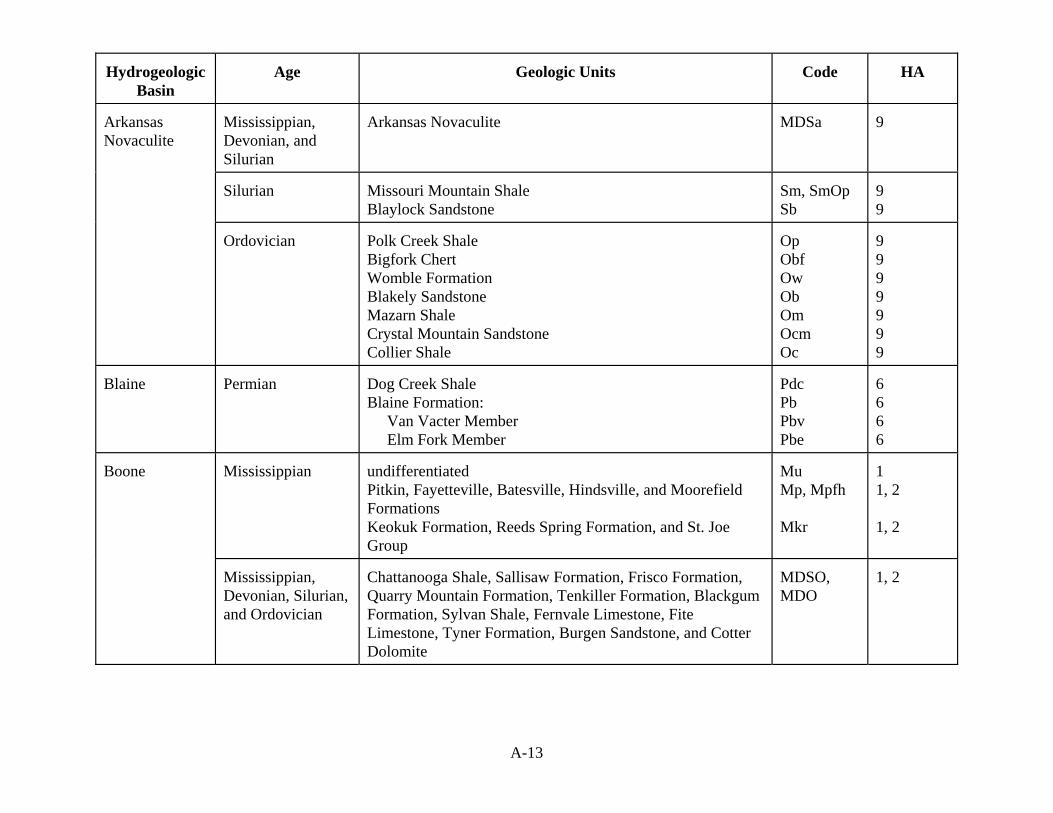
A-13
Hydrogeologic
Basin
Age
Geologic Units
Code
HA
Mississippian, Devonian, and Silurian
Arkansas Novaculite
MDSa
9
Silurian
Missouri Mountain Shale Blaylock Sandstone
Sm, SmOp Sb
9 9
Arkansas Novaculite
Ordovician
Polk Creek Shale Bigfork Chert Womble Formation Blakely Sandstone Mazarn Shale Crystal Mountain Sandstone Collier Shale
Op Obf Ow Ob Om Ocm Oc
9 9 9 9 9 9 9
Blaine
Permian
Dog Creek Shale Blaine Formation: Van Vacter Member Elm Fork Member
Pdc Pb Pbv Pbe
6 6 6 6
Mississippian
undifferentiated Pitkin, Fayetteville, Batesville, Hindsville, and Moorefield Formations Keokuk Formation, Reeds Spring Formation, and St. Joe Group
Mu Mp, Mpfh Mkr
1 1, 2 1, 2
Boone
Mississippian, Devonian, Silurian, and Ordovician
Chattanooga Shale, Sallisaw Formation, Frisco Formation, Quarry Mountain Formation, Tenkiller Formation, Blackgum Formation, Sylvan Shale, Fernvale Limestone, Fite Limestone, Tyner Formation, Burgen Sandstone, and Cotter Dolomite
MDSO, MDO
1, 2
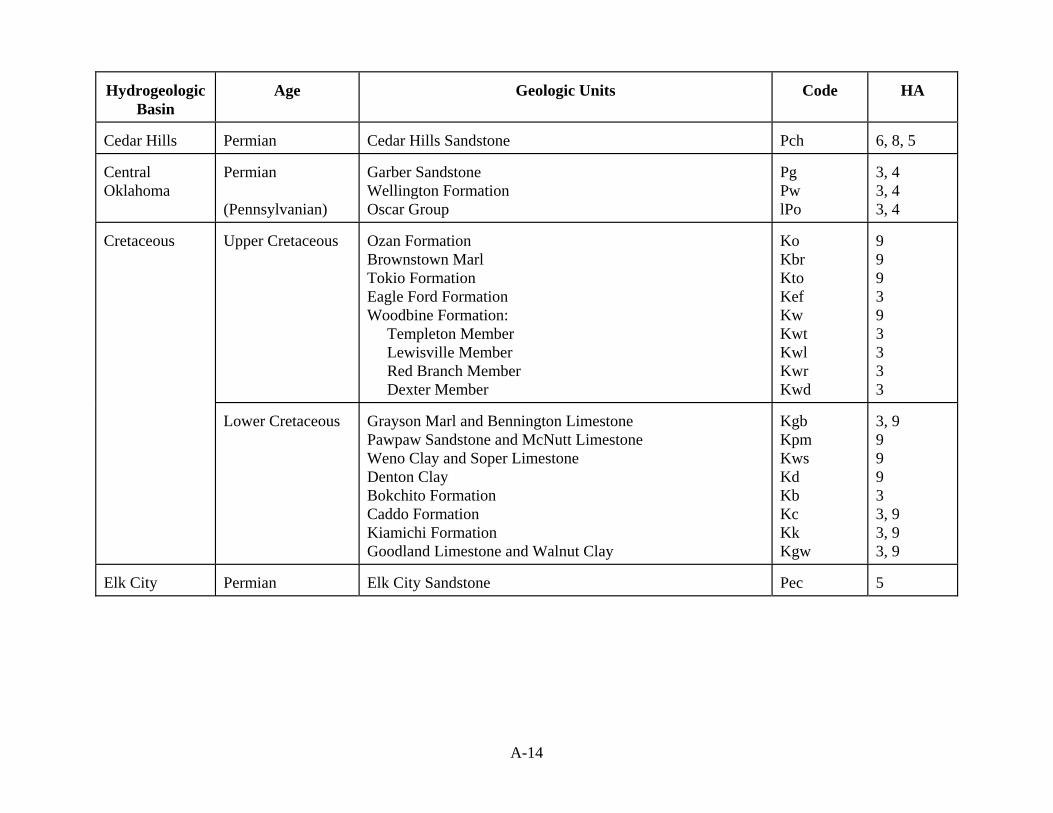
A-14
Hydrogeologic
Basin
Age
Geologic Units
Code
HA
Cedar Hills
Permian
Cedar Hills Sandstone
Pch
6, 8, 5
Central Oklahoma
Permian (Pennsylvanian)
Garber Sandstone Wellington Formation Oscar Group
Pg Pw lPo
3, 4 3, 4 3, 4
Upper Cretaceous
Ozan Formation Brownstown Marl Tokio Formation Eagle Ford Formation Woodbine Formation: Templeton Member Lewisville Member Red Branch Member Dexter Member
Ko Kbr Kto Kef Kw Kwt Kwl Kwr Kwd
9 9 9 3 9 3 3 3 3
Cretaceous
Lower Cretaceous
Grayson Marl and Bennington Limestone Pawpaw Sandstone and McNutt Limestone Weno Clay and Soper Limestone Denton Clay Bokchito Formation Caddo Formation Kiamichi Formation Goodland Limestone and Walnut Clay
Kgb Kpm Kws Kd Kb Kc Kk Kgw
3, 9 9 9 9 3 3, 9 3, 9 3, 9
Elk City
Permian
Elk City Sandstone
Pec
5
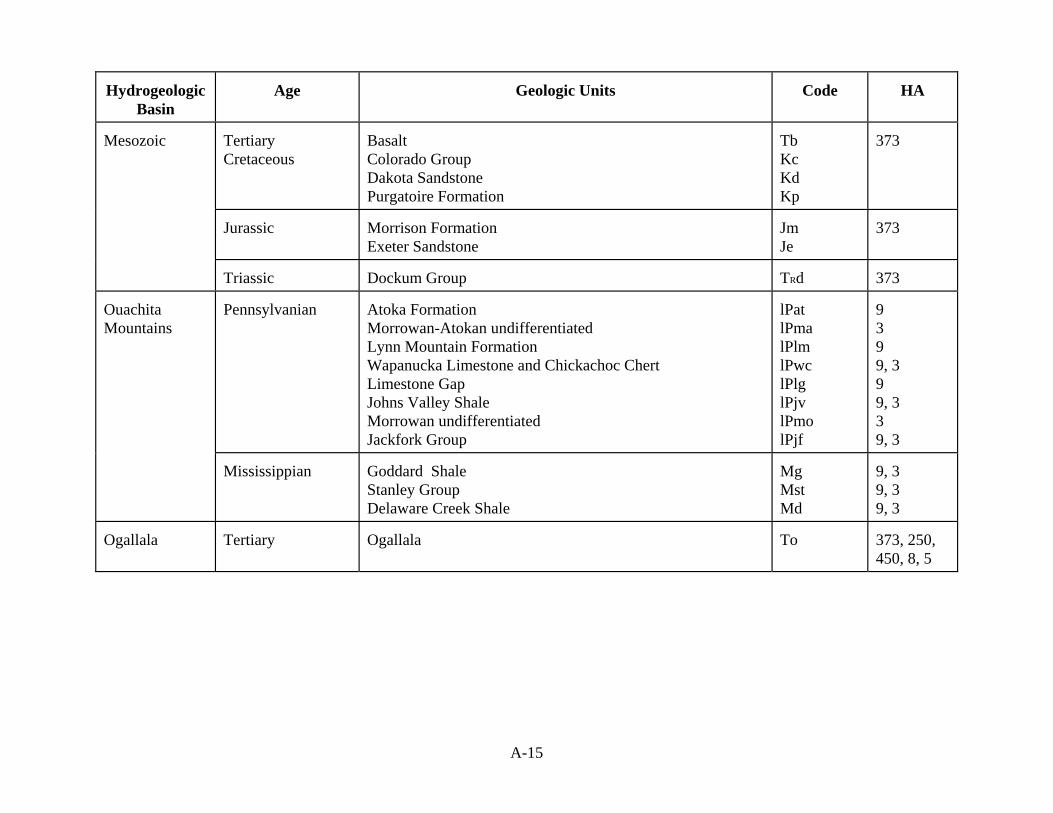
A-15
Hydrogeologic
Basin
Age
Geologic Units
Code
HA
Tertiary Cretaceous
Basalt Colorado Group Dakota Sandstone Purgatoire Formation
Tb Kc Kd Kp
373
Jurassic
Morrison Formation Exeter Sandstone
Jm Je
373
Mesozoic
Triassic
Dockum Group
TRd
373
Pennsylvanian
Atoka Formation Morrowan-Atokan undifferentiated Lynn Mountain Formation Wapanucka Limestone and Chickachoc Chert Limestone Gap Johns Valley Shale Morrowan undifferentiated Jackfork Group
lPat lPma lPlm lPwc lPlg lPjv lPmo lPjf
9 3 9 9, 3 9 9, 3 3 9, 3
Ouachita Mountains
Mississippian
Goddard Shale Stanley Group Delaware Creek Shale
Mg Mst Md
9, 3 9, 3 9, 3
Ogallala
Tertiary
Ogallala
To
373, 250, 450, 8, 5
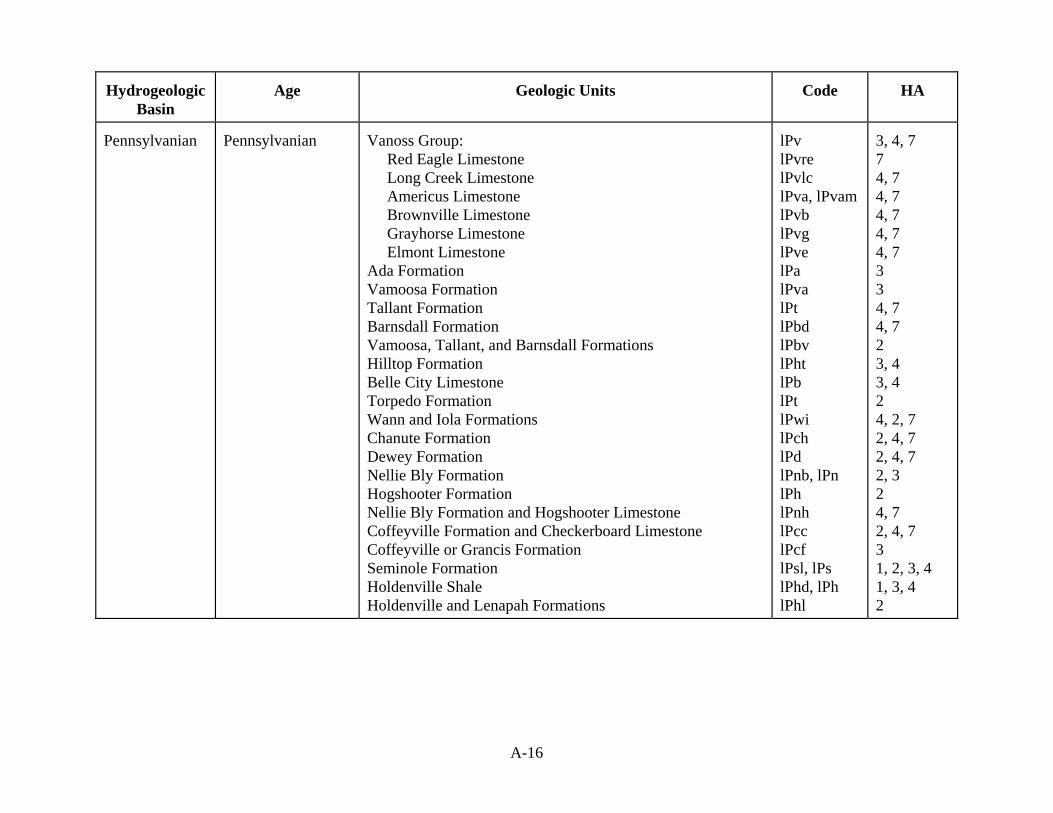
A-16
Hydrogeologic
Basin
Age
Geologic Units
Code
HA
Pennsylvanian
Pennsylvanian
Vanoss Group: Red Eagle Limestone Long Creek Limestone Americus Limestone Brownville Limestone Grayhorse Limestone Elmont Limestone Ada Formation Vamoosa Formation Tallant Formation Barnsdall Formation Vamoosa, Tallant, and Barnsdall Formations Hilltop Formation Belle City Limestone Torpedo Formation Wann and Iola Formations Chanute Formation Dewey Formation Nellie Bly Formation Hogshooter Formation Nellie Bly Formation and Hogshooter Limestone Coffeyville Formation and Checkerboard Limestone Coffeyville or Grancis Formation Seminole Formation Holdenville Shale Holdenville and Lenapah Formations
lPv lPvre lPvlc lPva, lPvam lPvb lPvg lPve lPa lPva lPt lPbd lPbv lPht lPb lPt lPwi lPch lPd lPnb, lPn lPh lPnh lPcc lPcf lPsl, lPs lPhd, lPh lPhl
3, 4, 7 7 4, 7 4, 7 4, 7 4, 7 4, 7 3 3 4, 7 4, 7 2 3, 4 3, 4 2 4, 2, 7 2, 4, 7 2, 4, 7 2, 3 2 4, 7 2, 4, 7 3 1, 2, 3, 4 1, 3, 4 2
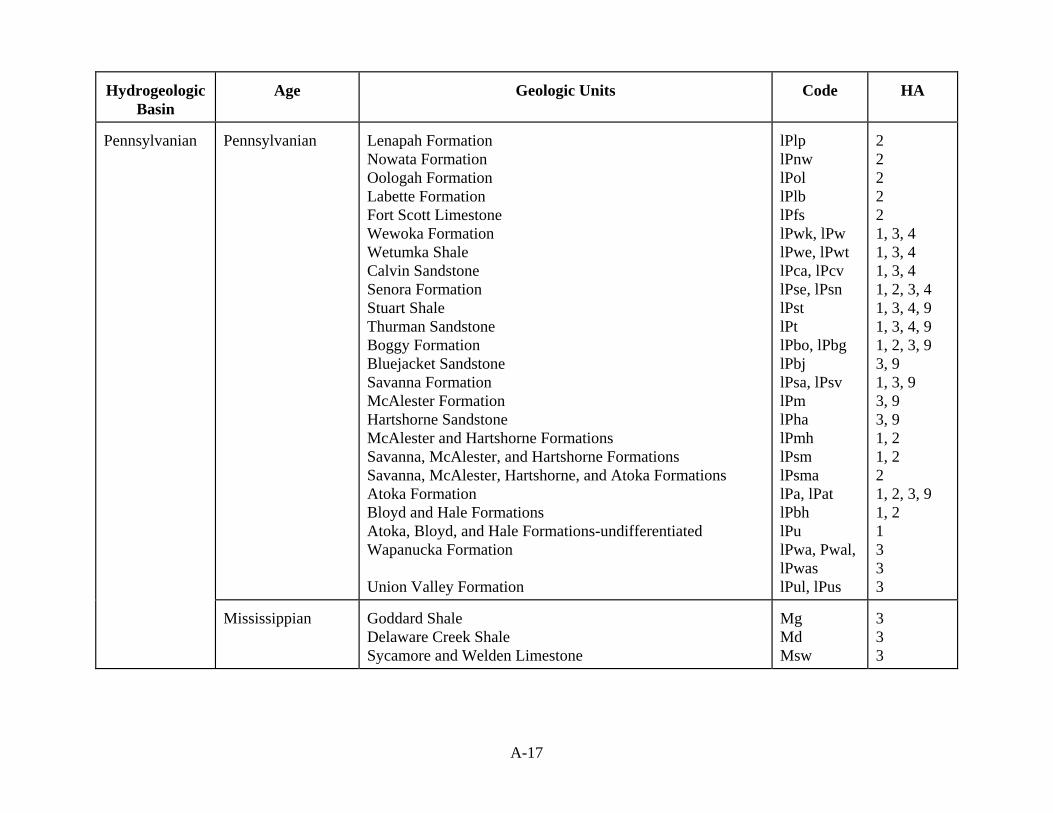
A-17
Hydrogeologic
Basin
Age
Geologic Units
Code
HA
Pennsylvanian
Lenapah Formation Nowata Formation Oologah Formation Labette Formation Fort Scott Limestone Wewoka Formation Wetumka Shale Calvin Sandstone Senora Formation Stuart Shale Thurman Sandstone Boggy Formation Bluejacket Sandstone Savanna Formation McAlester Formation Hartshorne Sandstone McAlester and Hartshorne Formations Savanna, McAlester, and Hartshorne Formations Savanna, McAlester, Hartshorne, and Atoka Formations Atoka Formation Bloyd and Hale Formations Atoka, Bloyd, and Hale Formations-undifferentiated Wapanucka Formation Union Valley Formation
lPlp lPnw lPol lPlb lPfs lPwk, lPw lPwe, lPwt lPca, lPcv lPse, lPsn lPst lPt lPbo, lPbg lPbj lPsa, lPsv lPm lPha lPmh lPsm lPsma lPa, lPat lPbh lPu lPwa, Pwal, lPwas lPul, lPus
2 2 2 2 2 1, 3, 4 1, 3, 4 1, 3, 4 1, 2, 3, 4 1, 3, 4, 9 1, 3, 4, 9 1, 2, 3, 9 3, 9 1, 3, 9 3, 9 3, 9 1, 2 1, 2 2 1, 2, 3, 9 1, 2 1 3 3 3
Pennsylvanian
Mississippian
Goddard Shale Delaware Creek Shale Sycamore and Welden Limestone
Mg Md Msw
3 3 3
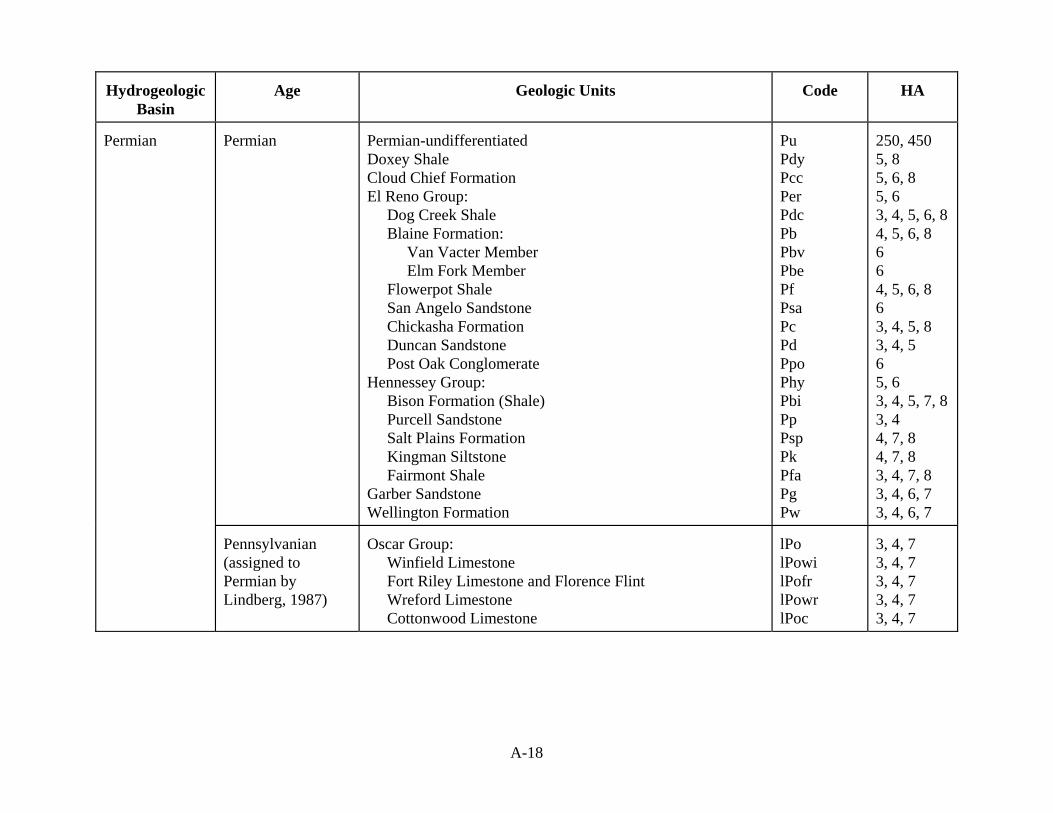
A-18
Hydrogeologic
Basin
Age
Geologic Units
Code
HA
Permian
Permian-undifferentiated Doxey Shale Cloud Chief Formation El Reno Group: Dog Creek Shale Blaine Formation: Van Vacter Member Elm Fork Member Flowerpot Shale San Angelo Sandstone Chickasha Formation Duncan Sandstone Post Oak Conglomerate Hennessey Group: Bison Formation (Shale) Purcell Sandstone Salt Plains Formation Kingman Siltstone Fairmont Shale Garber Sandstone Wellington Formation
Pu Pdy Pcc Per Pdc Pb Pbv Pbe Pf Psa Pc Pd Ppo Phy Pbi Pp Psp Pk Pfa Pg Pw
250, 450 5, 8 5, 6, 8 5, 6 3, 4, 5, 6, 8 4, 5, 6, 8 6 6 4, 5, 6, 8 6 3, 4, 5, 8 3, 4, 5 6 5, 6 3, 4, 5, 7, 8 3, 4 4, 7, 8 4, 7, 8 3, 4, 7, 8 3, 4, 6, 7 3, 4, 6, 7
Permian
Pennsylvanian (assigned to Permian by Lindberg, 1987)
Oscar Group: Winfield Limestone Fort Riley Limestone and Florence Flint Wreford Limestone Cottonwood Limestone
lPo lPowi lPofr lPowr lPoc
3, 4, 7 3, 4, 7 3, 4, 7 3, 4, 7 3, 4, 7
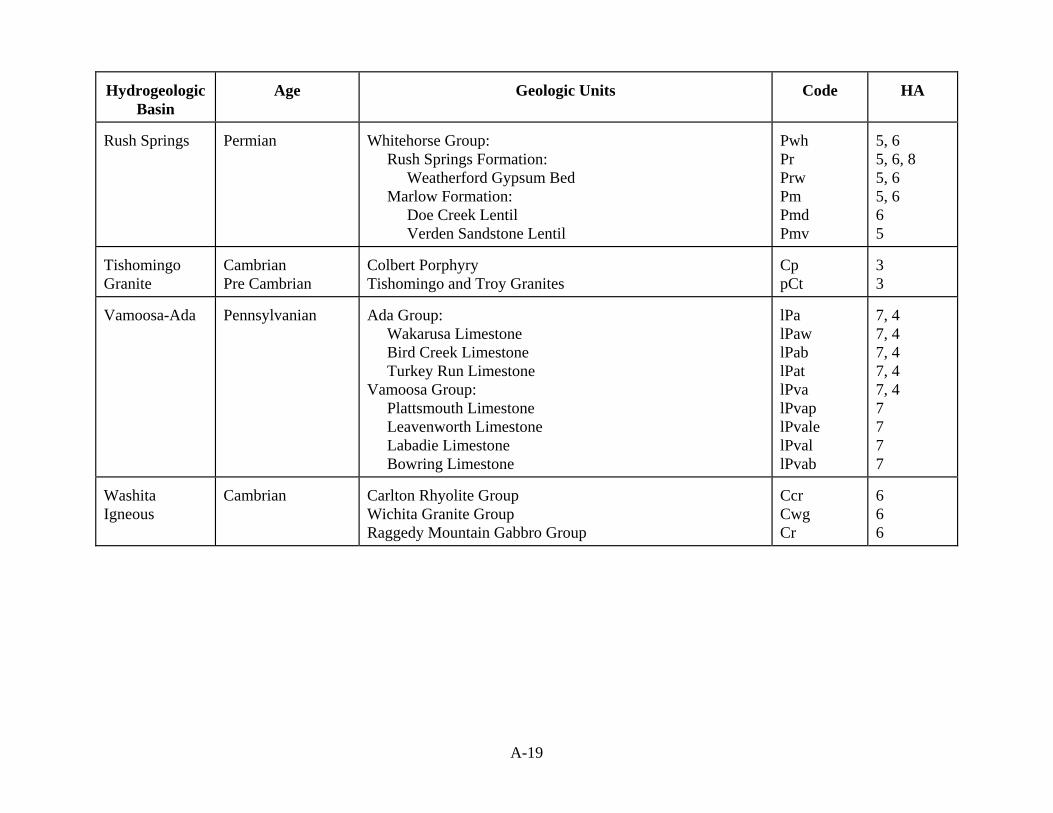
A-19
Hydrogeologic
Basin
Age
Geologic Units
Code
HA
Rush Springs
Permian
Whitehorse Group: Rush Springs Formation: Weatherford Gypsum Bed Marlow Formation: Doe Creek Lentil Verden Sandstone Lentil
Pwh Pr Prw Pm Pmd Pmv
5, 6 5, 6, 8 5, 6 5, 6 6 5
Tishomingo Granite
Cambrian Pre Cambrian
Colbert Porphyry Tishomingo and Troy Granites
Cp pCt
3 3
Vamoosa-Ada
Pennsylvanian
Ada Group: Wakarusa Limestone Bird Creek Limestone Turkey Run Limestone Vamoosa Group: Plattsmouth Limestone Leavenworth Limestone Labadie Limestone Bowring Limestone
lPa lPaw lPab lPat lPva lPvap lPvale lPval lPvab
7, 4 7, 4 7, 4 7, 4 7, 4 7 7 7 7
Washita Igneous
Cambrian
Carlton Rhyolite Group Wichita Granite Group Raggedy Mountain Gabbro Group
Ccr Cwg Cr
6 6 6

APPENDIX B
DRASTIC Ranges and Ratings
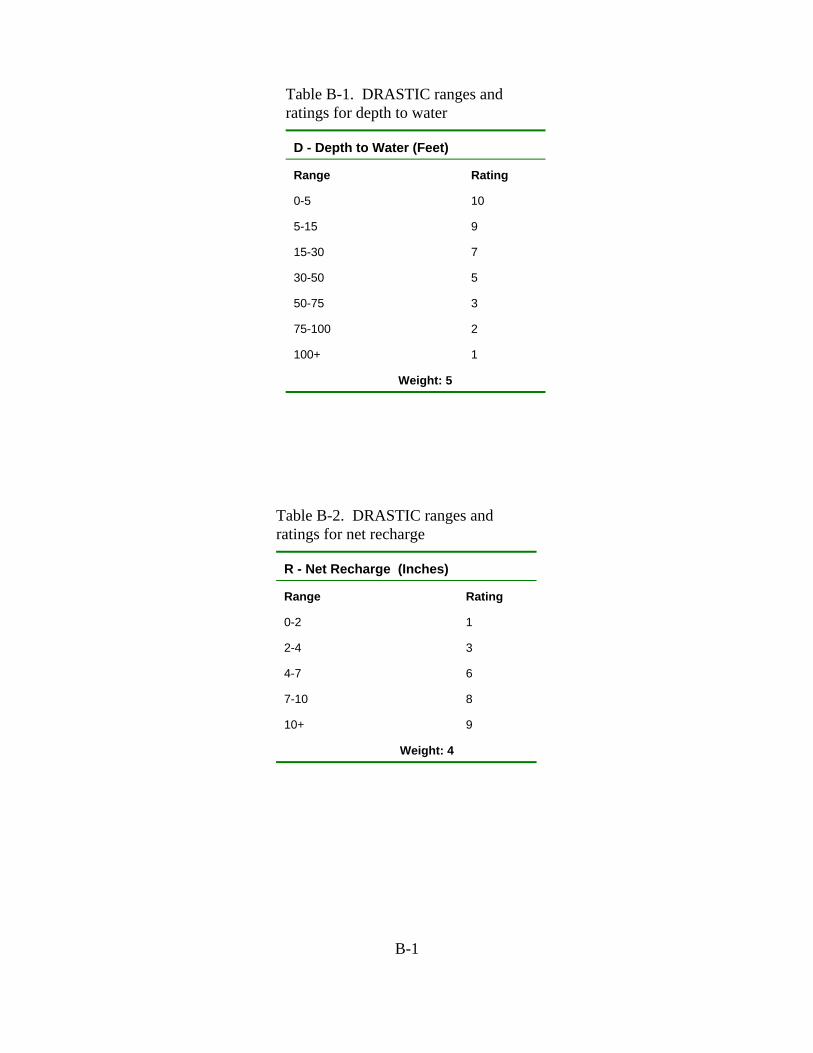
B-1
Table B-1. DRASTIC ranges and ratings for depth to water D - Depth to Water (Feet) Range
Rating
0-5
10
5-15
9
15-30
7
30-50
5
50-75
3
75-100
2
100+
1
Weight: 5
Table B-2. DRASTIC ranges and ratings for net recharge R - Net Recharge (Inches) Range
Rating
0-2
1
2-4
3
4-7
6
7-10
8
10+
9
Weight: 4
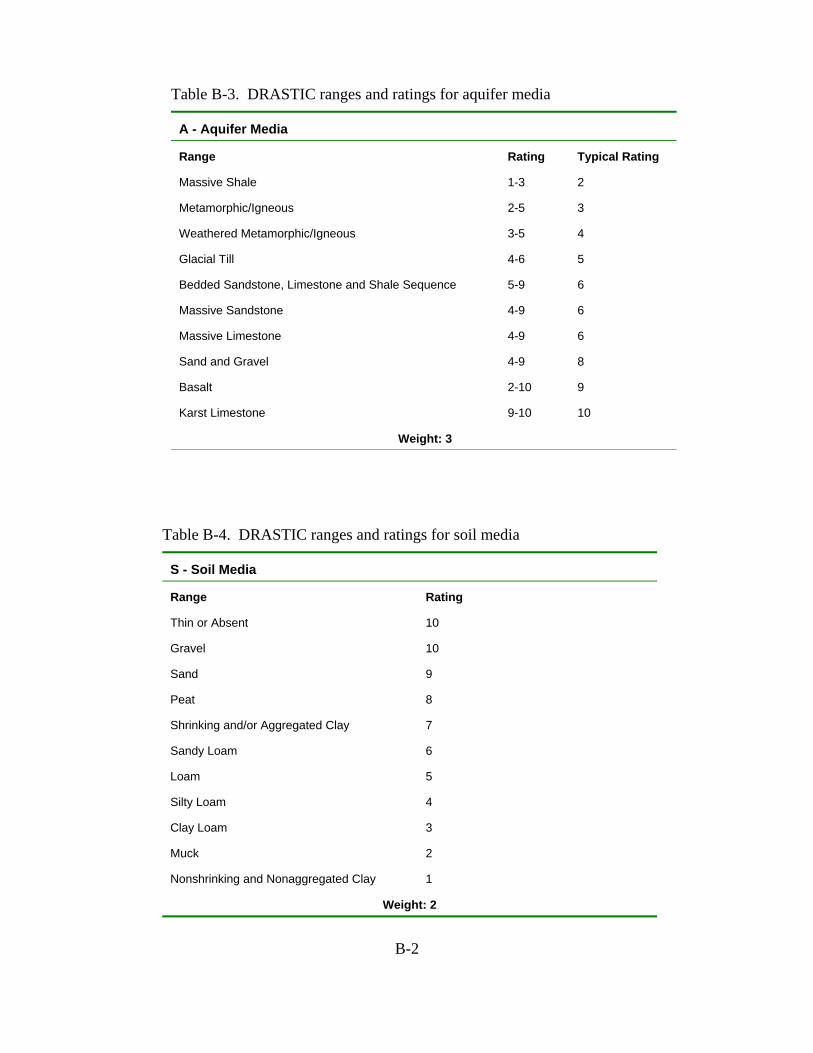
B-2
Table B-3. DRASTIC ranges and ratings for aquifer media A - Aquifer Media Range
Rating
Typical Rating
Massive Shale
1-3
2
Metamorphic/Igneous
2-5
3
Weathered Metamorphic/Igneous
3-5
4
Glacial Till
4-6
5
Bedded Sandstone, Limestone and Shale Sequence
5-9
6
Massive Sandstone
4-9
6
Massive Limestone
4-9
6
Sand and Gravel
4-9
8
Basalt
2-10
9
Karst Limestone
9-10
10
Weight: 3
Table B-4. DRASTIC ranges and ratings for soil media S - Soil Media Range
Rating
Thin or Absent
10
Gravel
10
Sand
9
Peat
8
Shrinking and/or Aggregated Clay
7
Sandy Loam
6
Loam
5
Silty Loam
4
Clay Loam
3
Muck
2
Nonshrinking and Nonaggregated Clay
1
Weight: 2

B-3
Table B-5. DRASTIC ranges and ratings for topography T- Topography (Percent Slope) Range
Rating
0-2
10
2-6
9
6-12
5
12-18
3
18+
1
Weight: 1
Table B-6. DRASTIC ranges and ratings for impact of the vadose zone media I - Impact of The Vadose Zone Media
Range Rating
Confining Layer
1
1
Silt/clay
2-6
3
Shale
2-5
3
Limestone
2-7
6
Sandstone
4-8
6
Bedded Limestone, Sandstone, Shale
4-8
6
Sand and Gravel with significant Silt and Clay
4-8
6
Metamorphic/Igneous
2-8
4
Sand and Gravel
6-9
8
Basalt
2-10
9
Karst Limestone
8-10
10
Weight: 5
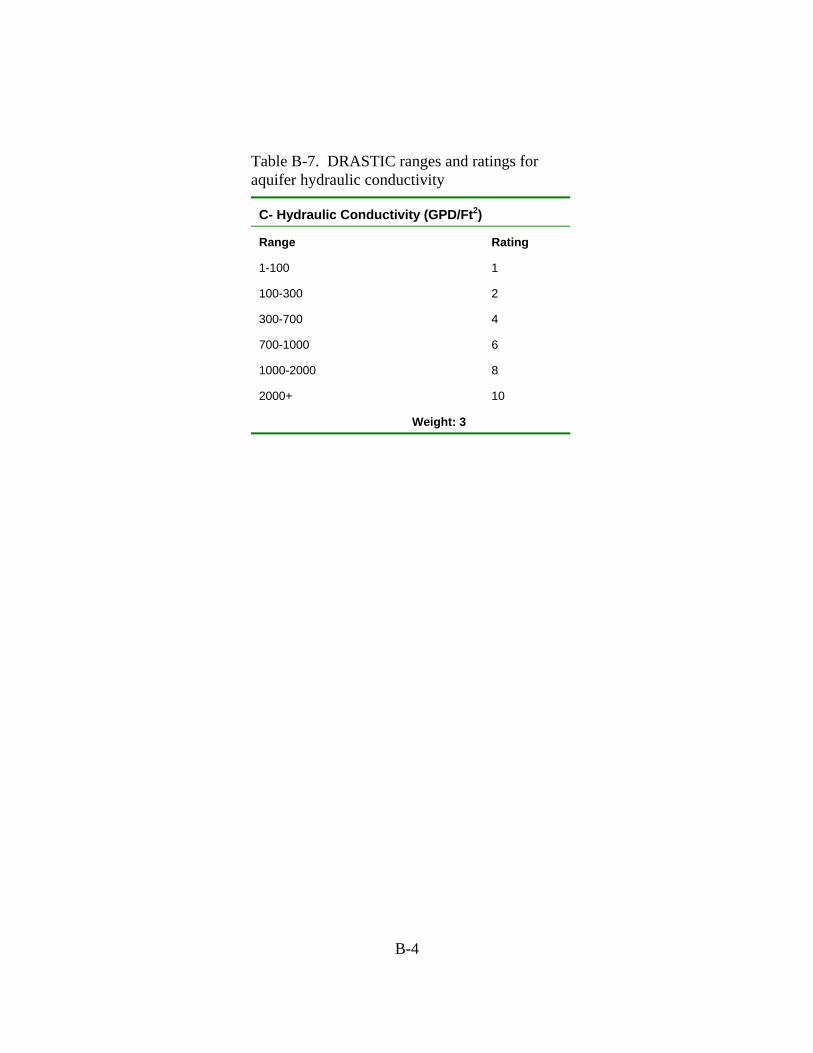
B-4
Table B-7. DRASTIC ranges and ratings for aquifer hydraulic conductivity C- Hydraulic Conductivity (GPD/Ft2) Range
Rating
1-100
1
100-300
2
300-700
4
700-1000
6
1000-2000
8
2000+
10
Weight: 3
APPENDIX C
DRASTIC Ranges, Ratings, Numbers, and Indices for Each Hydrogeologic Basin
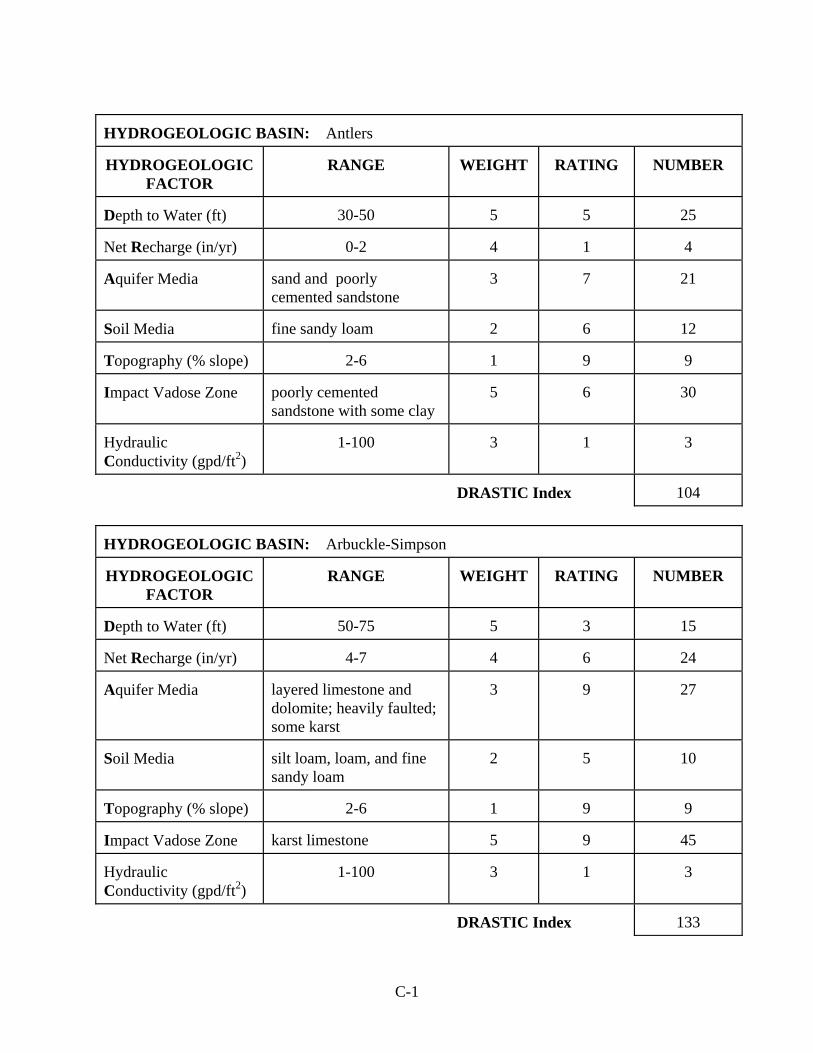
C-1
HYDROGEOLOGIC BASIN: Antlers HYDROGEOLOGIC
FACTOR
RANGE
WEIGHT
RATING
NUMBER
Depth to Water (ft)
30-50
5
5
25
Net Recharge (in/yr)
0-2
4
1
4
Aquifer Media
sand and poorly cemented sandstone
3
7
21
Soil Media
fine sandy loam
2
6
12
Topography (% slope)
2-6
1
9
9
Impact Vadose Zone
poorly cemented sandstone with some clay
5
6
30
Hydraulic Conductivity (gpd/ft2)
1-100
3
1
3
DRASTIC Index
104
HYDROGEOLOGIC BASIN: Arbuckle-Simpson HYDROGEOLOGIC
FACTOR
RANGE
WEIGHT
RATING
NUMBER
Depth to Water (ft)
50-75
5
3
15
Net Recharge (in/yr)
4-7
4
6
24
Aquifer Media
layered limestone and dolomite; heavily faulted; some karst
3
9
27
Soil Media
silt loam, loam, and fine sandy loam
2
5
10
Topography (% slope)
2-6
1
9
9
Impact Vadose Zone
karst limestone
5
9
45
Hydraulic Conductivity (gpd/ft2)
1-100
3
1
3
DRASTIC Index
133
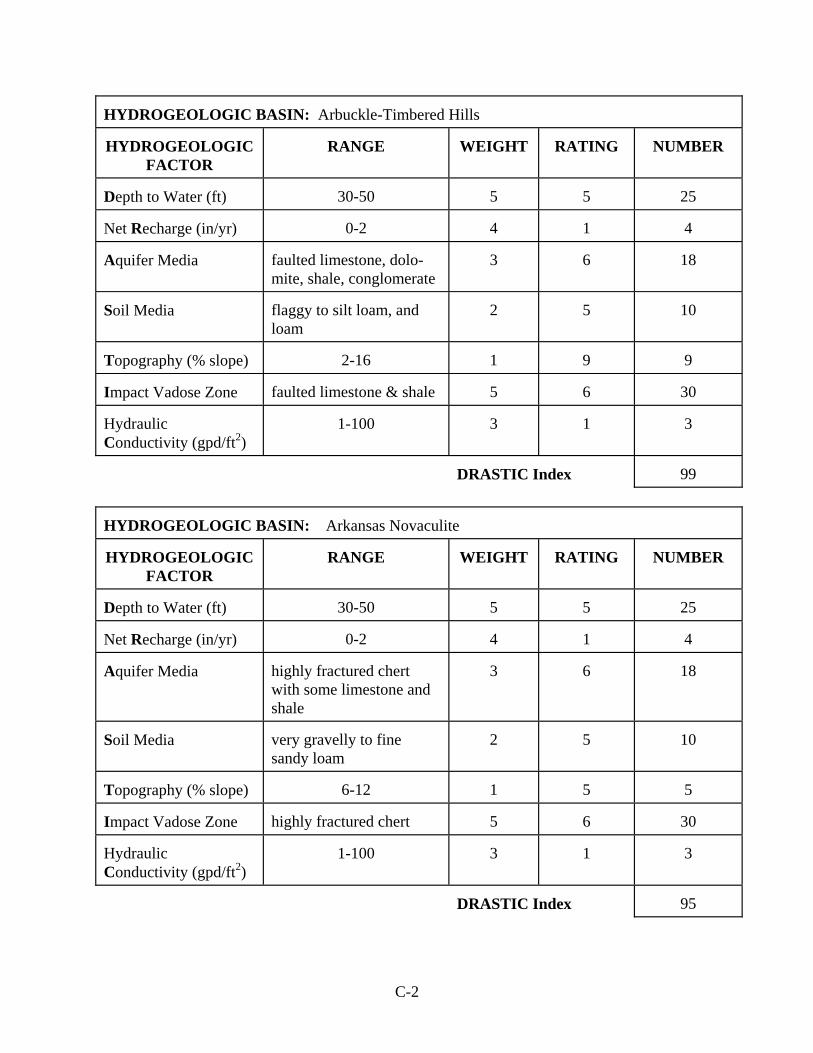
C-2
HYDROGEOLOGIC BASIN: Arbuckle-Timbered Hills HYDROGEOLOGIC
FACTOR
RANGE
WEIGHT
RATING
NUMBER
Depth to Water (ft)
30-50
5
5
25
Net Recharge (in/yr)
0-2
4
1
4
Aquifer Media
faulted limestone, dolo-mite, shale, conglomerate
3
6
18
Soil Media
flaggy to silt loam, and loam
2
5
10
Topography (% slope)
2-16
1
9
9
Impact Vadose Zone
faulted limestone & shale
5
6
30
Hydraulic Conductivity (gpd/ft2)
1-100
3
1
3
DRASTIC Index
99
HYDROGEOLOGIC BASIN: Arkansas Novaculite HYDROGEOLOGIC
FACTOR
RANGE
WEIGHT
RATING
NUMBER
Depth to Water (ft)
30-50
5
5
25
Net Recharge (in/yr)
0-2
4
1
4
Aquifer Media
highly fractured chert with some limestone and shale
3
6
18
Soil Media
very gravelly to fine sandy loam
2
5
10
Topography (% slope)
6-12
1
5
5
Impact Vadose Zone
highly fractured chert
5
6
30
Hydraulic Conductivity (gpd/ft2)
1-100
3
1
3
DRASTIC Index
95
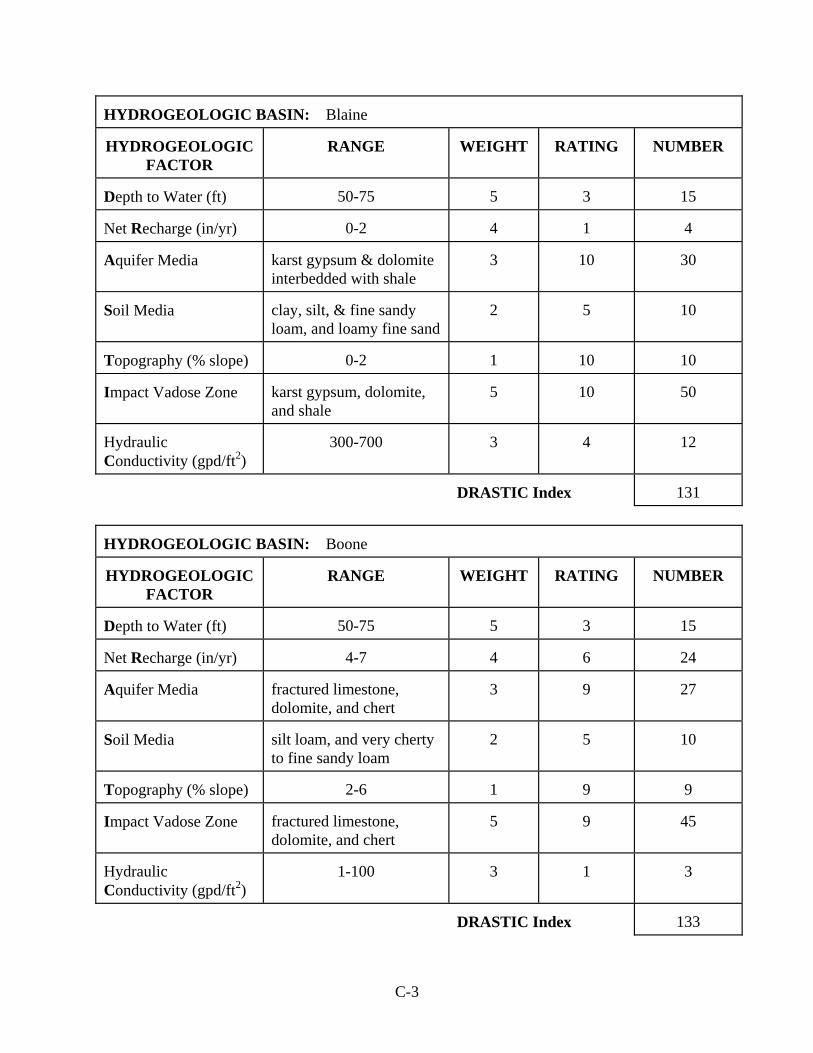
C-3
HYDROGEOLOGIC BASIN: Blaine HYDROGEOLOGIC
FACTOR
RANGE
WEIGHT
RATING
NUMBER
Depth to Water (ft)
50-75
5
3
15
Net Recharge (in/yr)
0-2
4
1
4
Aquifer Media
karst gypsum & dolomite interbedded with shale
3
10
30
Soil Media
clay, silt, & fine sandy loam, and loamy fine sand
2
5
10
Topography (% slope)
0-2
1
10
10
Impact Vadose Zone
karst gypsum, dolomite, and shale
5
10
50
Hydraulic Conductivity (gpd/ft2)
300-700
3
4
12
DRASTIC Index
131
HYDROGEOLOGIC BASIN: Boone HYDROGEOLOGIC
FACTOR
RANGE
WEIGHT
RATING
NUMBER
Depth to Water (ft)
50-75
5
3
15
Net Recharge (in/yr)
4-7
4
6
24
Aquifer Media
fractured limestone, dolomite, and chert
3
9
27
Soil Media
silt loam, and very cherty to fine sandy loam
2
5
10
Topography (% slope)
2-6
1
9
9
Impact Vadose Zone
fractured limestone, dolomite, and chert
5
9
45
Hydraulic Conductivity (gpd/ft2)
1-100
3
1
3
DRASTIC Index
133
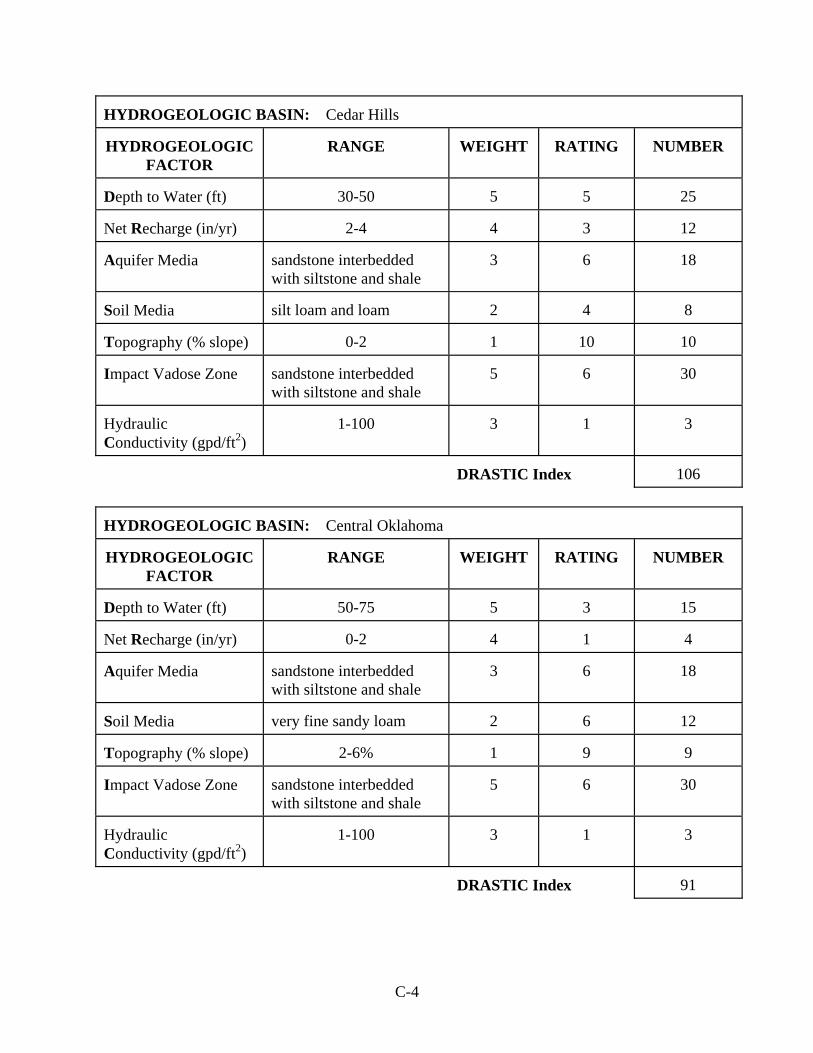
C-4
HYDROGEOLOGIC BASIN: Cedar Hills HYDROGEOLOGIC
FACTOR
RANGE
WEIGHT
RATING
NUMBER
Depth to Water (ft)
30-50
5
5
25
Net Recharge (in/yr)
2-4
4
3
12
Aquifer Media
sandstone interbedded with siltstone and shale
3
6
18
Soil Media
silt loam and loam
2
4
8
Topography (% slope)
0-2
1
10
10
Impact Vadose Zone
sandstone interbedded with siltstone and shale
5
6
30
Hydraulic Conductivity (gpd/ft2)
1-100
3
1
3
DRASTIC Index
106
HYDROGEOLOGIC BASIN: Central Oklahoma HYDROGEOLOGIC
FACTOR
RANGE
WEIGHT
RATING
NUMBER
Depth to Water (ft)
50-75
5
3
15
Net Recharge (in/yr)
0-2
4
1
4
Aquifer Media
sandstone interbedded with siltstone and shale
3
6
18
Soil Media
very fine sandy loam
2
6
12
Topography (% slope)
2-6%
1
9
9
Impact Vadose Zone
sandstone interbedded with siltstone and shale
5
6
30
Hydraulic Conductivity (gpd/ft2)
1-100
3
1
3
DRASTIC Index
91
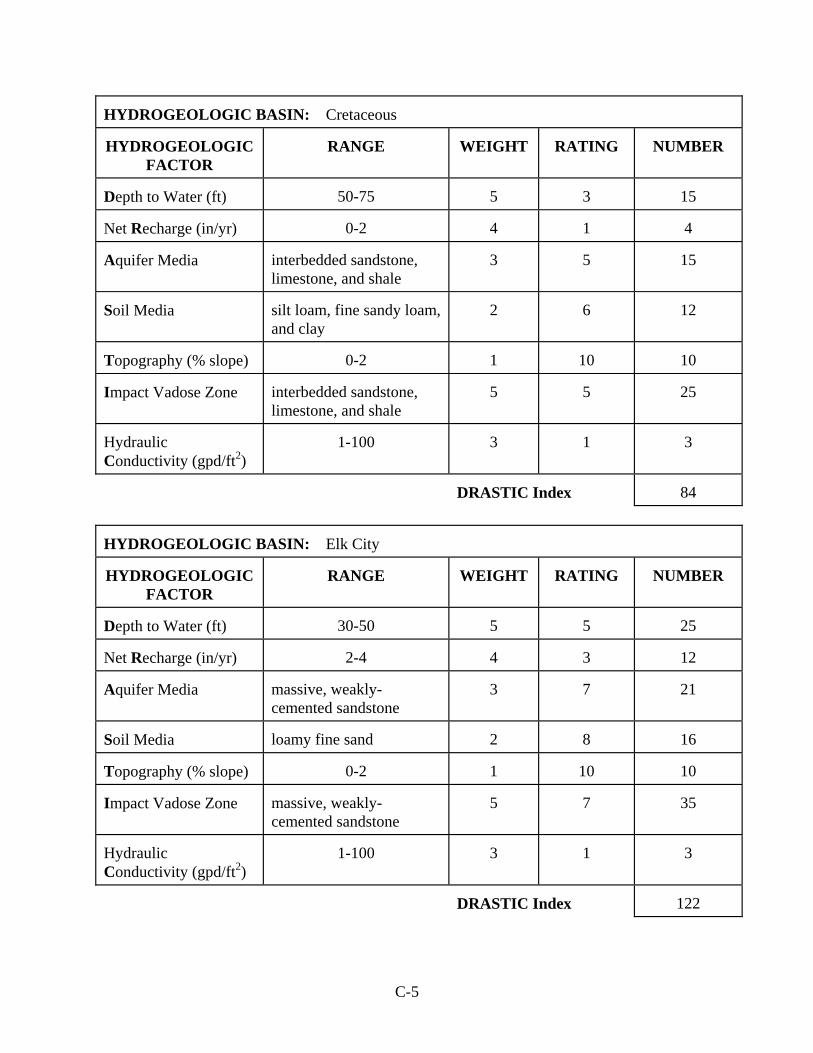
C-5
HYDROGEOLOGIC BASIN: Cretaceous HYDROGEOLOGIC
FACTOR
RANGE
WEIGHT
RATING
NUMBER
Depth to Water (ft)
50-75
5
3
15
Net Recharge (in/yr)
0-2
4
1
4
Aquifer Media
interbedded sandstone, limestone, and shale
3
5
15
Soil Media
silt loam, fine sandy loam, and clay
2
6
12
Topography (% slope)
0-2
1
10
10
Impact Vadose Zone
interbedded sandstone, limestone, and shale
5
5
25
Hydraulic Conductivity (gpd/ft2)
1-100
3
1
3
DRASTIC Index
84
HYDROGEOLOGIC BASIN: Elk City HYDROGEOLOGIC
FACTOR
RANGE
WEIGHT
RATING
NUMBER
Depth to Water (ft)
30-50
5
5
25
Net Recharge (in/yr)
2-4
4
3
12
Aquifer Media
massive, weakly-cemented sandstone
3
7
21
Soil Media
loamy fine sand
2
8
16
Topography (% slope)
0-2
1
10
10
Impact Vadose Zone
massive, weakly-cemented sandstone
5
7
35
Hydraulic Conductivity (gpd/ft2)
1-100
3
1
3
DRASTIC Index
122
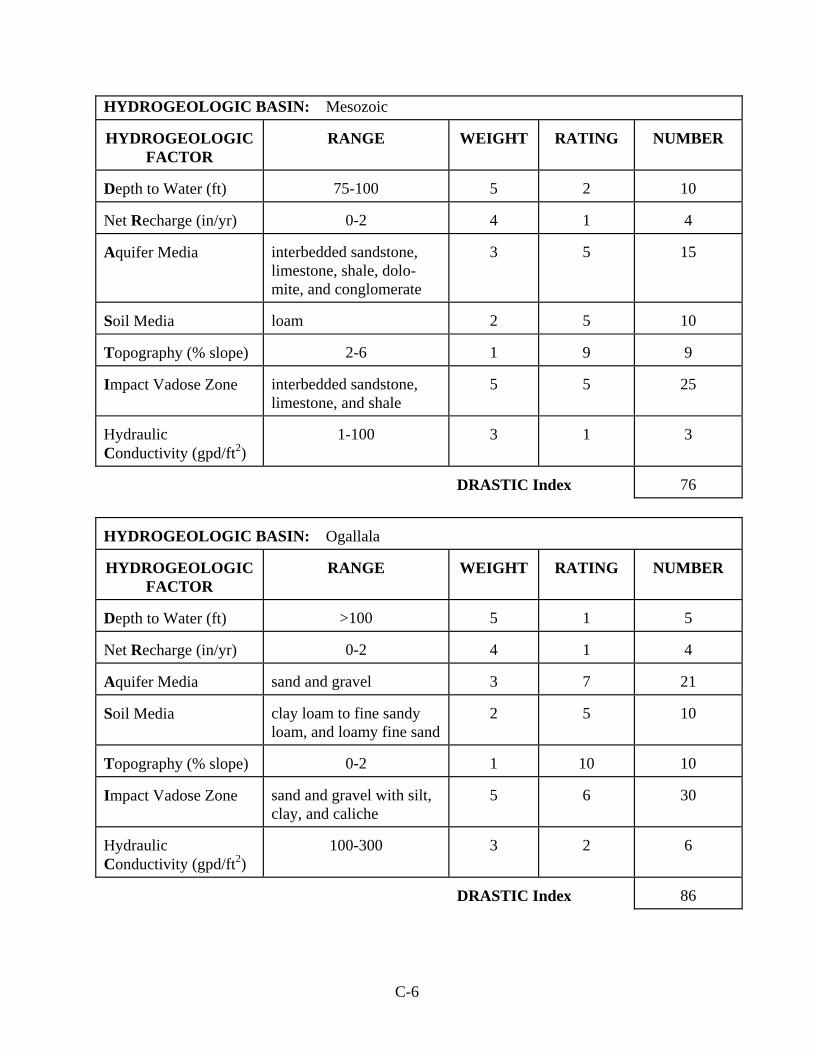
C-6
HYDROGEOLOGIC BASIN: Mesozoic HYDROGEOLOGIC
FACTOR
RANGE
WEIGHT
RATING
NUMBER
Depth to Water (ft)
75-100
5
2
10
Net Recharge (in/yr)
0-2
4
1
4
Aquifer Media
interbedded sandstone, limestone, shale, dolo-mite, and conglomerate
3
5
15
Soil Media
loam
2
5
10
Topography (% slope)
2-6
1
9
9
Impact Vadose Zone
interbedded sandstone, limestone, and shale
5
5
25
Hydraulic Conductivity (gpd/ft2)
1-100
3
1
3
DRASTIC Index
76
HYDROGEOLOGIC BASIN: Ogallala HYDROGEOLOGIC
FACTOR
RANGE
WEIGHT
RATING
NUMBER
Depth to Water (ft)
>100
5
1
5
Net Recharge (in/yr)
0-2
4
1
4
Aquifer Media
sand and gravel
3
7
21
Soil Media
clay loam to fine sandy loam, and loamy fine sand
2
5
10
Topography (% slope)
0-2
1
10
10
Impact Vadose Zone
sand and gravel with silt, clay, and caliche
5
6
30
Hydraulic Conductivity (gpd/ft2)
100-300
3
2
6
DRASTIC Index
86
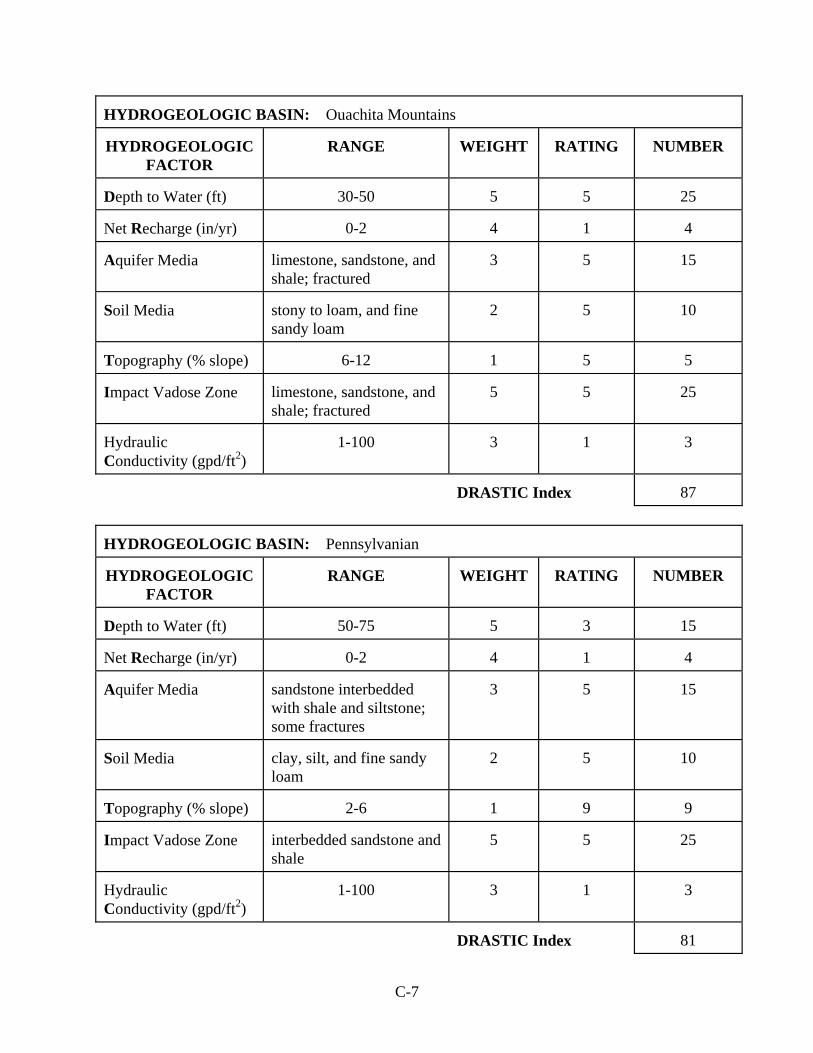
C-7
HYDROGEOLOGIC BASIN: Ouachita Mountains HYDROGEOLOGIC
FACTOR
RANGE
WEIGHT
RATING
NUMBER
Depth to Water (ft)
30-50
5
5
25
Net Recharge (in/yr)
0-2
4
1
4
Aquifer Media
limestone, sandstone, and shale; fractured
3
5
15
Soil Media
stony to loam, and fine sandy loam
2
5
10
Topography (% slope)
6-12
1
5
5
Impact Vadose Zone
limestone, sandstone, and shale; fractured
5
5
25
Hydraulic Conductivity (gpd/ft2)
1-100
3
1
3
DRASTIC Index
87
HYDROGEOLOGIC BASIN: Pennsylvanian HYDROGEOLOGIC
FACTOR
RANGE
WEIGHT
RATING
NUMBER
Depth to Water (ft)
50-75
5
3
15
Net Recharge (in/yr)
0-2
4
1
4
Aquifer Media
sandstone interbedded with shale and siltstone; some fractures
3
5
15
Soil Media
clay, silt, and fine sandy loam
2
5
10
Topography (% slope)
2-6
1
9
9
Impact Vadose Zone
interbedded sandstone and shale
5
5
25
Hydraulic Conductivity (gpd/ft2)
1-100
3
1
3
DRASTIC Index
81
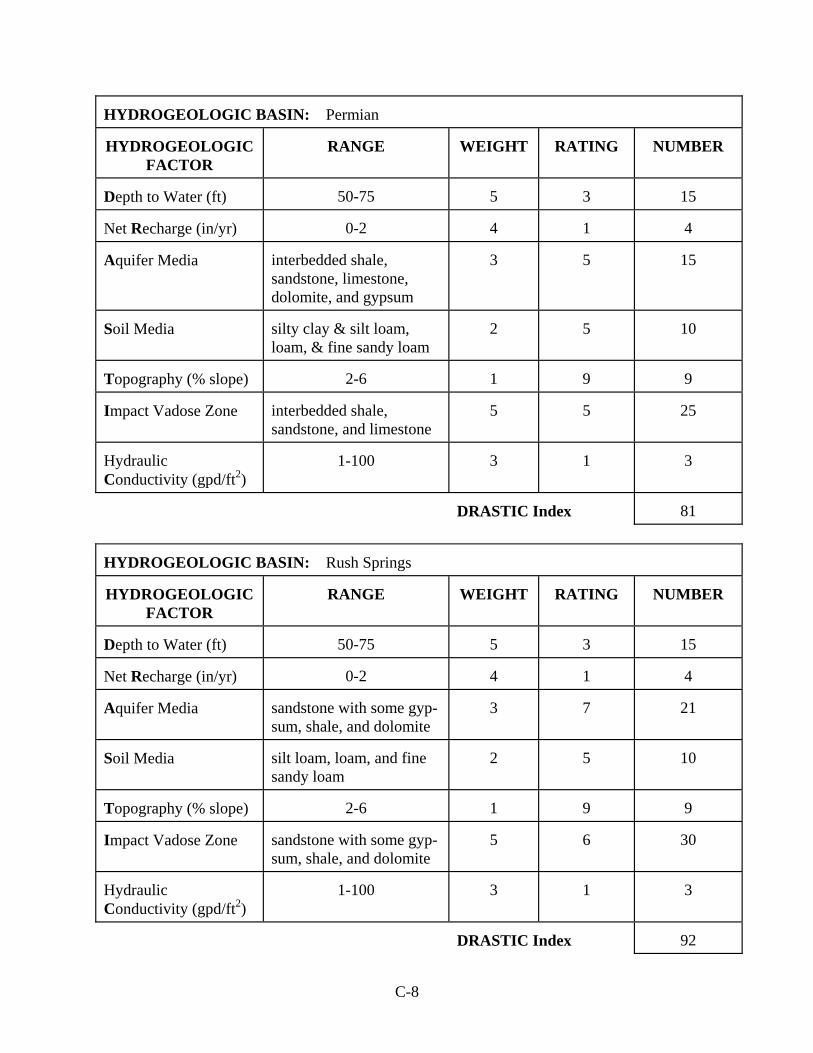
C-8
HYDROGEOLOGIC BASIN: Permian HYDROGEOLOGIC
FACTOR
RANGE
WEIGHT
RATING
NUMBER
Depth to Water (ft)
50-75
5
3
15
Net Recharge (in/yr)
0-2
4
1
4
Aquifer Media
interbedded shale, sandstone, limestone, dolomite, and gypsum
3
5
15
Soil Media
silty clay & silt loam, loam, & fine sandy loam
2
5
10
Topography (% slope)
2-6
1
9
9
Impact Vadose Zone
interbedded shale, sandstone, and limestone
5
5
25
Hydraulic Conductivity (gpd/ft2)
1-100
3
1
3
DRASTIC Index
81
HYDROGEOLOGIC BASIN: Rush Springs HYDROGEOLOGIC
FACTOR
RANGE
WEIGHT
RATING
NUMBER
Depth to Water (ft)
50-75
5
3
15
Net Recharge (in/yr)
0-2
4
1
4
Aquifer Media
sandstone with some gyp-sum, shale, and dolomite
3
7
21
Soil Media
silt loam, loam, and fine sandy loam
2
5
10
Topography (% slope)
2-6
1
9
9
Impact Vadose Zone
sandstone with some gyp-sum, shale, and dolomite
5
6
30
Hydraulic Conductivity (gpd/ft2)
1-100
3
1
3
DRASTIC Index
92
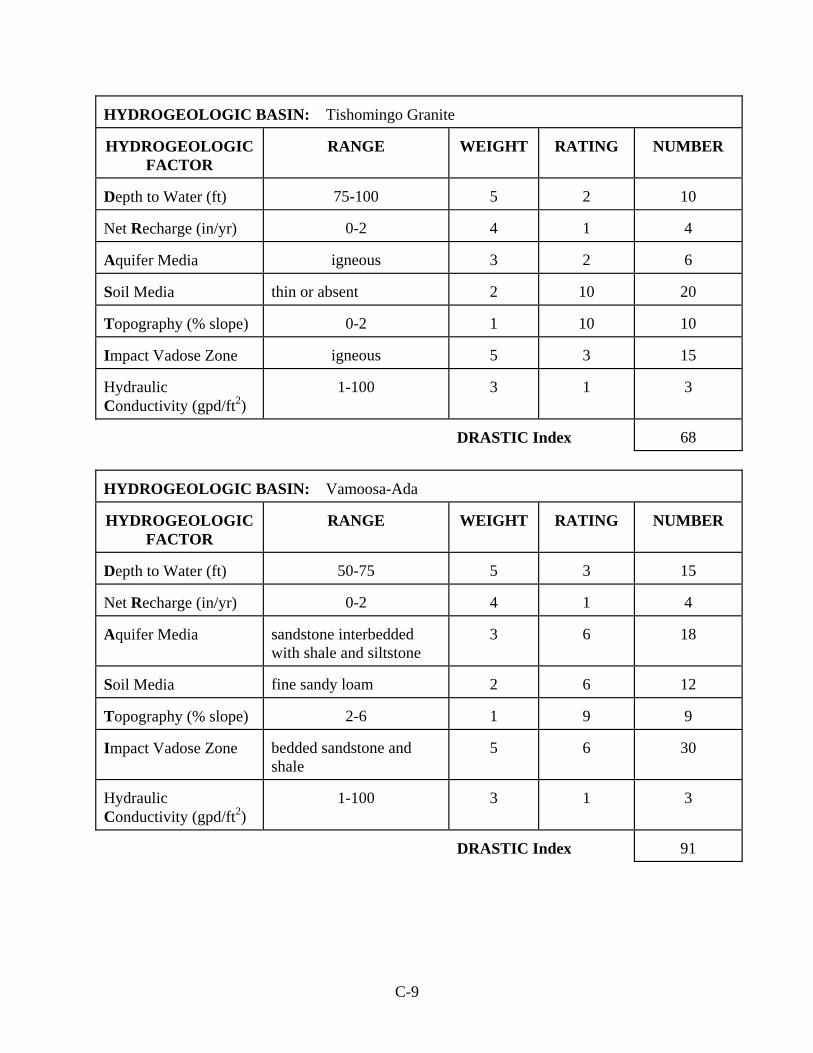
C-9
HYDROGEOLOGIC BASIN: Tishomingo Granite HYDROGEOLOGIC
FACTOR
RANGE
WEIGHT
RATING
NUMBER
Depth to Water (ft)
75-100
5
2
10
Net Recharge (in/yr)
0-2
4
1
4
Aquifer Media
igneous
3
2
6
Soil Media
thin or absent
2
10
20
Topography (% slope)
0-2
1
10
10
Impact Vadose Zone
igneous
5
3
15
Hydraulic Conductivity (gpd/ft2)
1-100
3
1
3
DRASTIC Index
68
HYDROGEOLOGIC BASIN: Vamoosa-Ada HYDROGEOLOGIC
FACTOR
RANGE
WEIGHT
RATING
NUMBER
Depth to Water (ft)
50-75
5
3
15
Net Recharge (in/yr)
0-2
4
1
4
Aquifer Media
sandstone interbedded with shale and siltstone
3
6
18
Soil Media
fine sandy loam
2
6
12
Topography (% slope)
2-6
1
9
9
Impact Vadose Zone
bedded sandstone and shale
5
6
30
Hydraulic Conductivity (gpd/ft2)
1-100
3
1
3
DRASTIC Index
91
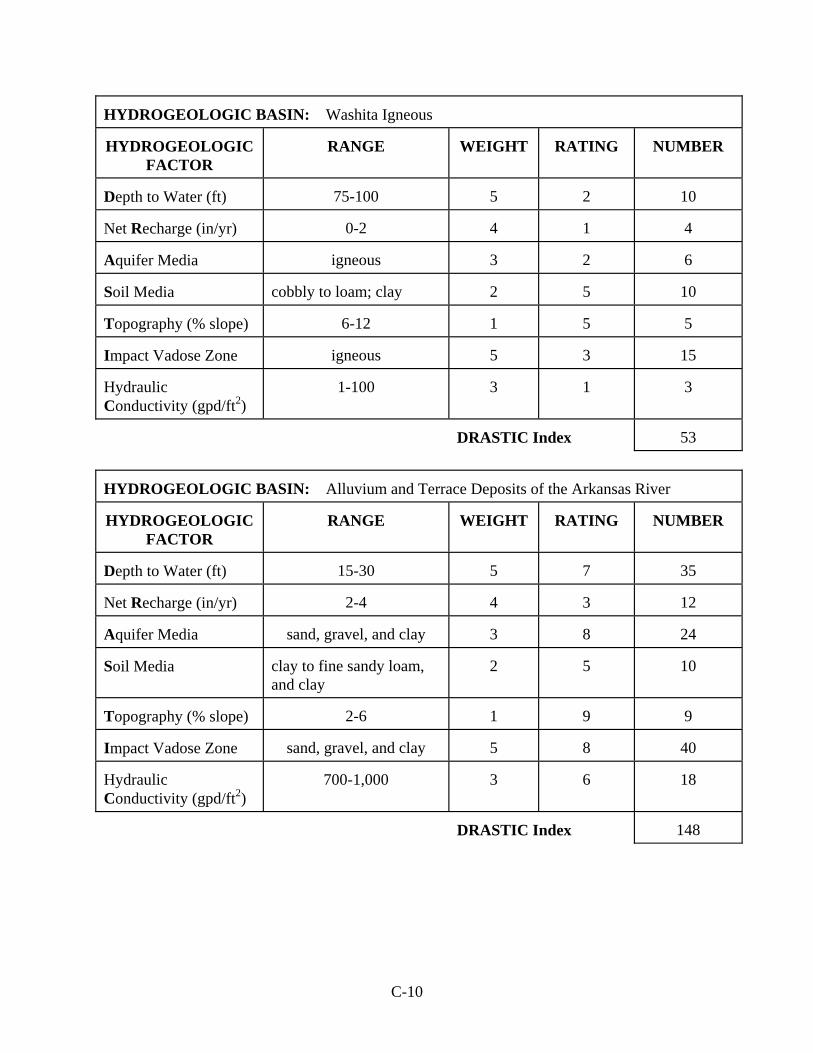
C-10
HYDROGEOLOGIC BASIN: Washita Igneous HYDROGEOLOGIC
FACTOR
RANGE
WEIGHT
RATING
NUMBER
Depth to Water (ft)
75-100
5
2
10
Net Recharge (in/yr)
0-2
4
1
4
Aquifer Media
igneous
3
2
6
Soil Media
cobbly to loam; clay
2
5
10
Topography (% slope)
6-12
1
5
5
Impact Vadose Zone
igneous
5
3
15
Hydraulic Conductivity (gpd/ft2)
1-100
3
1
3
DRASTIC Index
53
HYDROGEOLOGIC BASIN: Alluvium and Terrace Deposits of the Arkansas River HYDROGEOLOGIC
FACTOR
RANGE
WEIGHT
RATING
NUMBER
Depth to Water (ft)
15-30
5
7
35
Net Recharge (in/yr)
2-4
4
3
12
Aquifer Media
sand, gravel, and clay
3
8
24
Soil Media
clay to fine sandy loam, and clay
2
5
10
Topography (% slope)
2-6
1
9
9
Impact Vadose Zone
sand, gravel, and clay
5
8
40
Hydraulic Conductivity (gpd/ft2)
700-1,000
3
6
18
DRASTIC Index
148
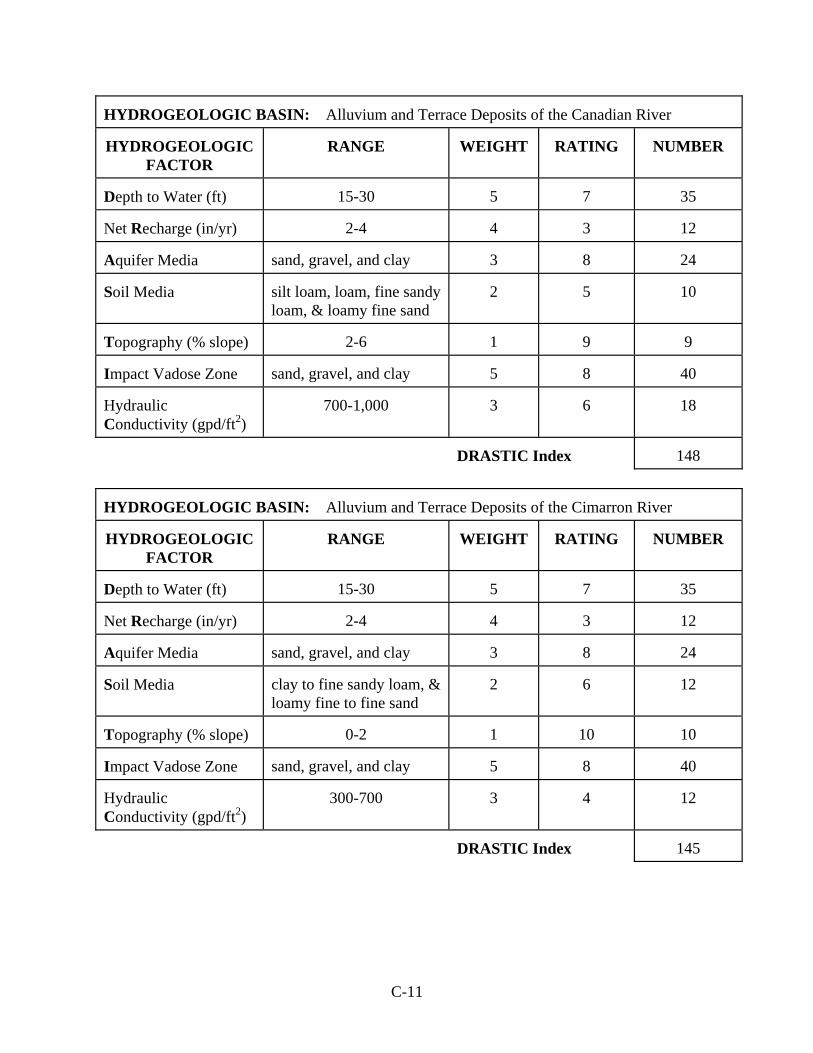
C-11
HYDROGEOLOGIC BASIN: Alluvium and Terrace Deposits of the Canadian River HYDROGEOLOGIC
FACTOR
RANGE
WEIGHT
RATING
NUMBER
Depth to Water (ft)
15-30
5
7
35
Net Recharge (in/yr)
2-4
4
3
12
Aquifer Media
sand, gravel, and clay
3
8
24
Soil Media
silt loam, loam, fine sandy loam, & loamy fine sand
2
5
10
Topography (% slope)
2-6
1
9
9
Impact Vadose Zone
sand, gravel, and clay
5
8
40
Hydraulic Conductivity (gpd/ft2)
700-1,000
3
6
18
DRASTIC Index
148
HYDROGEOLOGIC BASIN: Alluvium and Terrace Deposits of the Cimarron River HYDROGEOLOGIC
FACTOR
RANGE
WEIGHT
RATING
NUMBER
Depth to Water (ft)
15-30
5
7
35
Net Recharge (in/yr)
2-4
4
3
12
Aquifer Media
sand, gravel, and clay
3
8
24
Soil Media
clay to fine sandy loam, & loamy fine to fine sand
2
6
12
Topography (% slope)
0-2
1
10
10
Impact Vadose Zone
sand, gravel, and clay
5
8
40
Hydraulic Conductivity (gpd/ft2)
300-700
3
4
12
DRASTIC Index
145
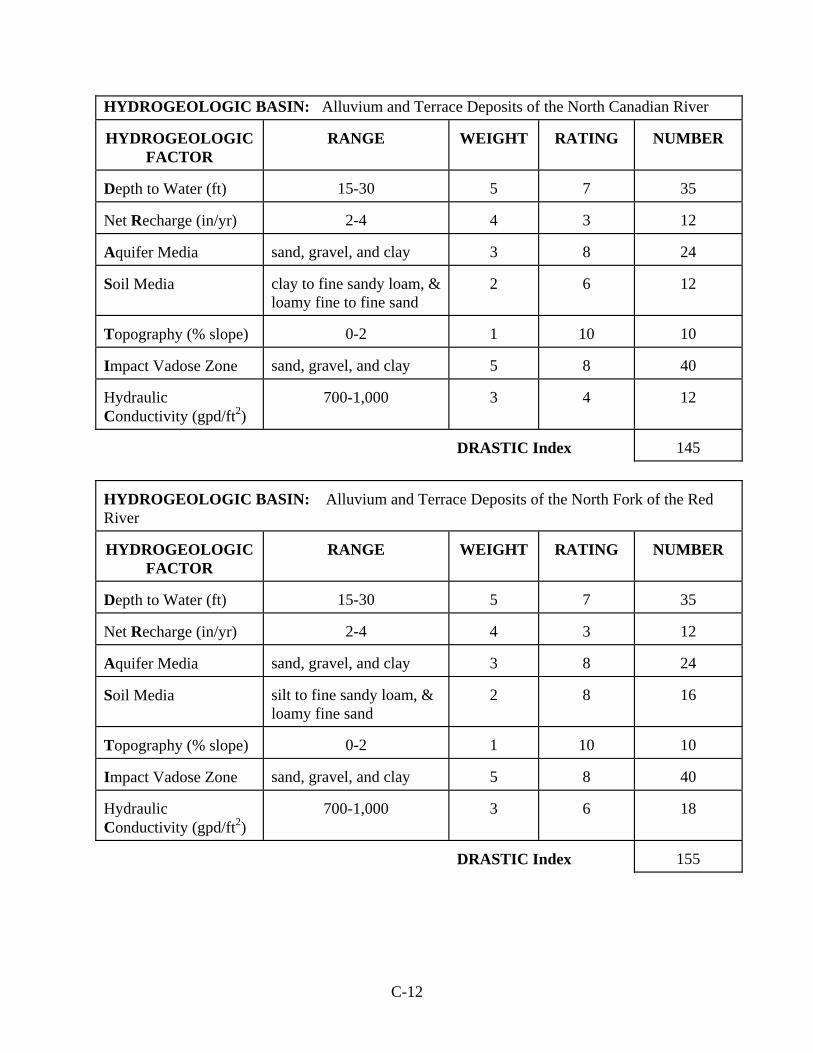
C-12
HYDROGEOLOGIC BASIN: Alluvium and Terrace Deposits of the North Canadian River HYDROGEOLOGIC
FACTOR
RANGE
WEIGHT
RATING
NUMBER
Depth to Water (ft)
15-30
5
7
35
Net Recharge (in/yr)
2-4
4
3
12
Aquifer Media
sand, gravel, and clay
3
8
24
Soil Media
clay to fine sandy loam, & loamy fine to fine sand
2
6
12
Topography (% slope)
0-2
1
10
10
Impact Vadose Zone
sand, gravel, and clay
5
8
40
Hydraulic Conductivity (gpd/ft2)
700-1,000
3
4
12
DRASTIC Index
145
HYDROGEOLOGIC BASIN: Alluvium and Terrace Deposits of the North Fork of the Red River HYDROGEOLOGIC
FACTOR
RANGE
WEIGHT
RATING
NUMBER
Depth to Water (ft)
15-30
5
7
35
Net Recharge (in/yr)
2-4
4
3
12
Aquifer Media
sand, gravel, and clay
3
8
24
Soil Media
silt to fine sandy loam, & loamy fine sand
2
8
16
Topography (% slope)
0-2
1
10
10
Impact Vadose Zone
sand, gravel, and clay
5
8
40
Hydraulic Conductivity (gpd/ft2)
700-1,000
3
6
18
DRASTIC Index
155
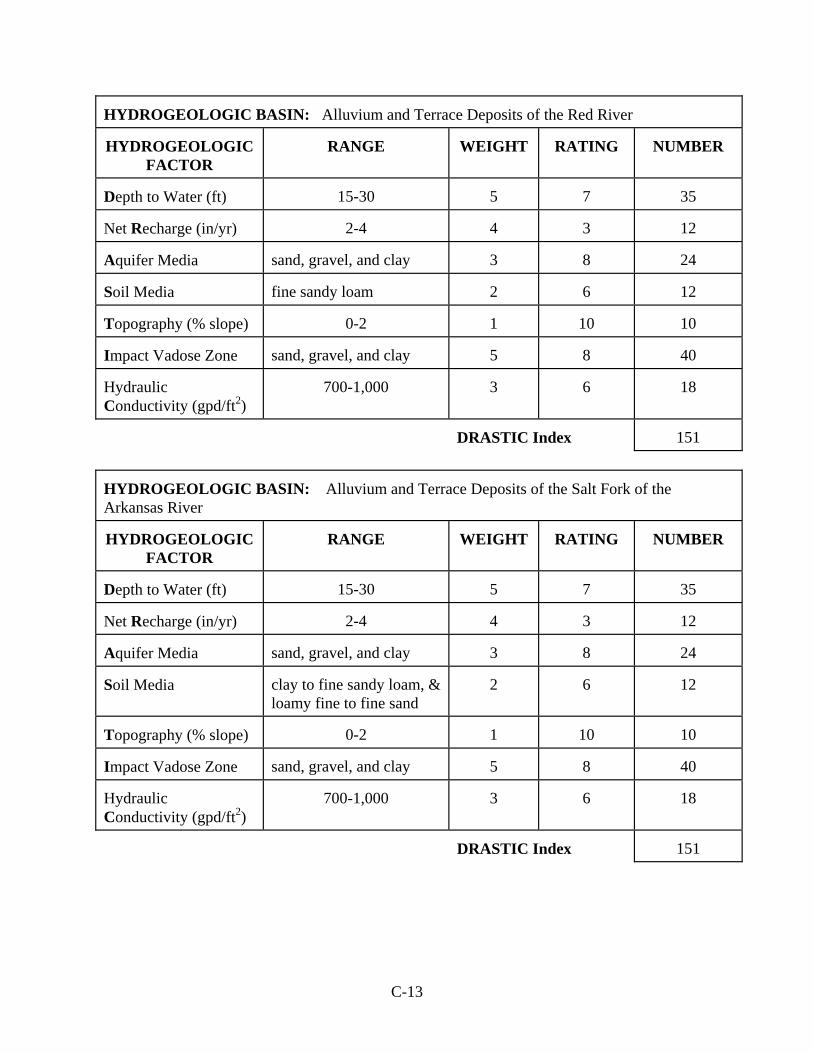
C-13
HYDROGEOLOGIC BASIN: Alluvium and Terrace Deposits of the Red River HYDROGEOLOGIC
FACTOR
RANGE
WEIGHT
RATING
NUMBER
Depth to Water (ft)
15-30
5
7
35
Net Recharge (in/yr)
2-4
4
3
12
Aquifer Media
sand, gravel, and clay
3
8
24
Soil Media
fine sandy loam
2
6
12
Topography (% slope)
0-2
1
10
10
Impact Vadose Zone
sand, gravel, and clay
5
8
40
Hydraulic Conductivity (gpd/ft2)
700-1,000
3
6
18
DRASTIC Index
151
HYDROGEOLOGIC BASIN: Alluvium and Terrace Deposits of the Salt Fork of the Arkansas River HYDROGEOLOGIC
FACTOR
RANGE
WEIGHT
RATING
NUMBER
Depth to Water (ft)
15-30
5
7
35
Net Recharge (in/yr)
2-4
4
3
12
Aquifer Media
sand, gravel, and clay
3
8
24
Soil Media
clay to fine sandy loam, & loamy fine to fine sand
2
6
12
Topography (% slope)
0-2
1
10
10
Impact Vadose Zone
sand, gravel, and clay
5
8
40
Hydraulic Conductivity (gpd/ft2)
700-1,000
3
6
18
DRASTIC Index
151
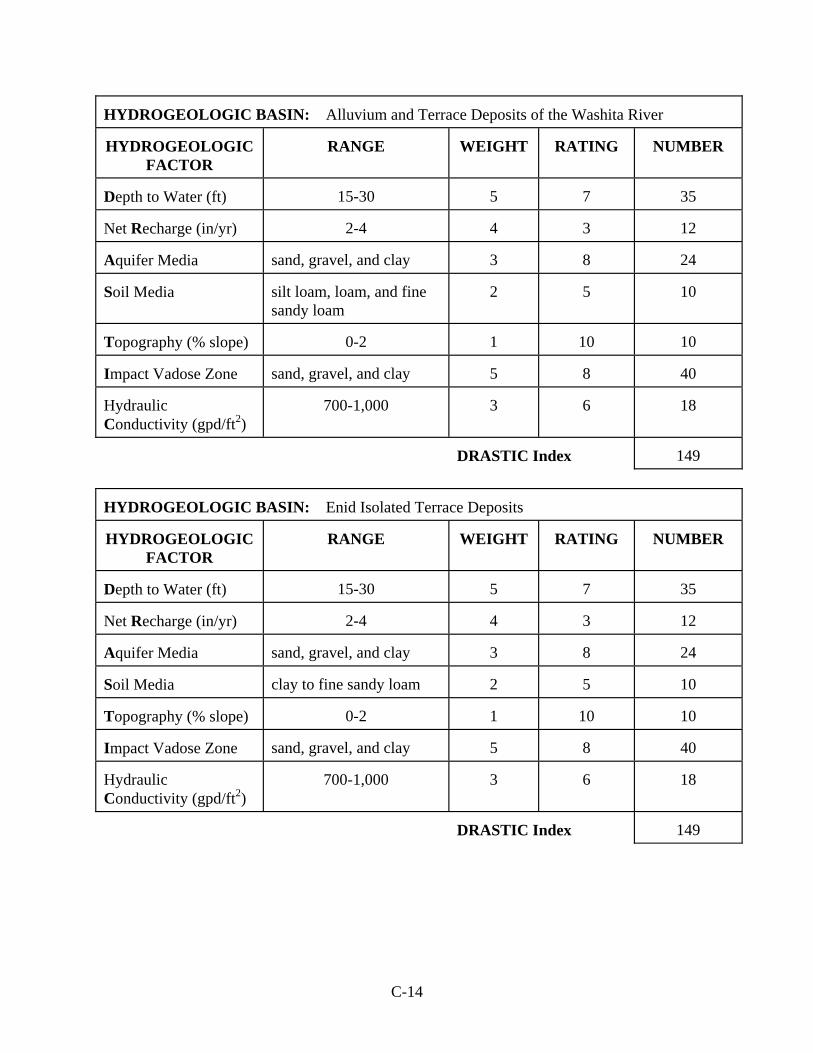
C-14
HYDROGEOLOGIC BASIN: Alluvium and Terrace Deposits of the Washita River HYDROGEOLOGIC
FACTOR
RANGE
WEIGHT
RATING
NUMBER
Depth to Water (ft)
15-30
5
7
35
Net Recharge (in/yr)
2-4
4
3
12
Aquifer Media
sand, gravel, and clay
3
8
24
Soil Media
silt loam, loam, and fine sandy loam
2
5
10
Topography (% slope)
0-2
1
10
10
Impact Vadose Zone
sand, gravel, and clay
5
8
40
Hydraulic Conductivity (gpd/ft2)
700-1,000
3
6
18
DRASTIC Index
149
HYDROGEOLOGIC BASIN: Enid Isolated Terrace Deposits HYDROGEOLOGIC
FACTOR
RANGE
WEIGHT
RATING
NUMBER
Depth to Water (ft)
15-30
5
7
35
Net Recharge (in/yr)
2-4
4
3
12
Aquifer Media
sand, gravel, and clay
3
8
24
Soil Media
clay to fine sandy loam
2
5
10
Topography (% slope)
0-2
1
10
10
Impact Vadose Zone
sand, gravel, and clay
5
8
40
Hydraulic Conductivity (gpd/ft2)
700-1,000
3
6
18
DRASTIC Index
149

C-15
HYDROGEOLOGIC BASIN: Gerty Sand HYDROGEOLOGIC
FACTOR
RANGE
WEIGHT
RATING
NUMBER
Depth to Water (ft)
30-50
5
5
25
Net Recharge (in/yr)
0-2
4
1
4
Aquifer Media
sand, gravel, and clay
3
8
24
Soil Media
silt loam, clay, and loamy fine sand
2
6
12
Topography (% slope)
2-6
1
9
9
Impact Vadose Zone
sand, gravel, and clay
5
8
40
Hydraulic Conductivity (gpd/ft2)
300-700
3
4
12
DRASTIC Index
126