Statement of the Problem. Purpose of the Analysis. · Statement of the Problem. Purpose of the...
12
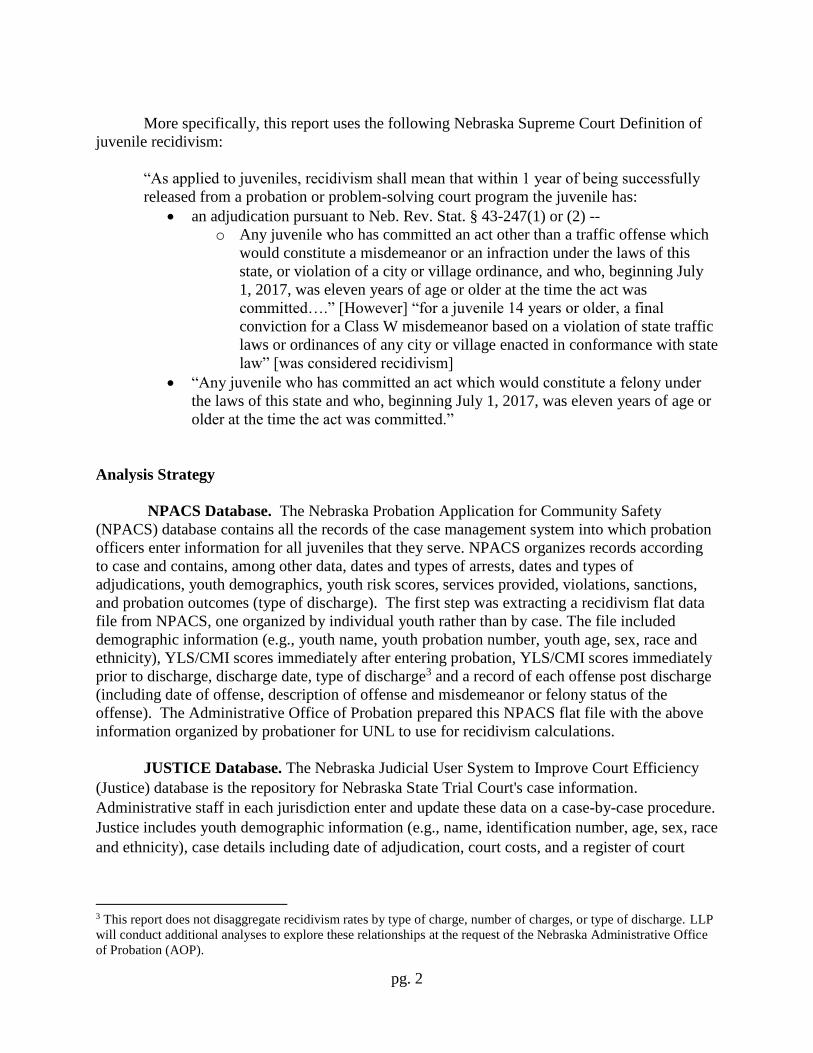
pg. 1 Recidivism Rates for Nebraska Juvenile Probationers: 2010 to 2015 1 Richard L. Wiener, PhD February 5, 2018 University of Nebraska/Lincoln Statement of the Problem. Purpose of the Analysis. Accurate estimates of recidivism rates among juveniles discharged from probation serve multiple administrative purposes, to:1) provide data for program evaluation studies of specific probation services, 2) provide data for cost benefit analyses of probation efforts, 3) track the success of probation services over time, 4) allow evidence based policy formulation, and 5) test applied research hypotheses in the effort to improve both rehabilitation outcomes and public safety. The current report describes the work and results of the University of Nebraska/Lincoln -- Law and Psychology Program’s (LPP) analysis of juvenile recidivism data for Nebraska Probation. Analysis Goals. The primary objective of this work was to calculate the rates of recidivism for juvenile probationers discharged during the time interval beginning on January 1, 2010 and ending on December 31, 2015, and to do so as accurately as the available data allowed. A secondary objective was to disaggregate recidivism ratings according to the youths’ risk level using the Youth Level of Service Case Management (YLS/CMI) risk tool. This report separates recidivism rates by each year during the 2010-2015 interval and by level of YLS/CMI Risk. 2 Definition of Recidivism. The research literature on recidivism offers a diverse set of recidivism measures that vary based upon legal action (arrest vs. adjudication vs. conviction), seriousness of crime (status offense vs. infraction vs. misdemeanor vs. felony), type of violation (crime against property vs. crime against persons) and harmfulness of outcomes (violent crimes vs. non-violent crimes). Although the database offers the opportunity to examine recidivism using a variety of definitions commonly found in the literature, the current work adopted the Nebraska Supreme Court’s definition of Juvenile Recidivism, which turns, in part on the definition of successfully completed probation. For the purposes of this report, successfully completed probation includes all youth who successfully completed probation, successfully completed problem solving court, obtained an early release or “graduated.” Recidivistic youth are those whom the courts adjudicated for infractions, misdemeanors, or felonies in the year following the child’s discharge date if the adjudication was not a traffic violation unless the traffic violation was a Class W misdemeanor (a DUI offense). 1 The University of Nebraska/Law and Psychology Program (LPP) wishes to thank, Ellen Brokofsky, State Probation Administrator, Jeanne Brandner, Deputy Administrator – Juvenile Service Administrator and Kari Rumbaugh, Assistant Deputy Administrator – Juvenile Service Administrator for their support in this work. Furthermore, this analysis would not have been possible without the assistance of a team of graduate students in the UNL Psychology Doctoral Program (Alisha Caldwell, Julie Wertheimer and Taylor Petty). 2 As noted in the definition of recidivism paragraph in this report, recidivism in this data analysis was calculated using a one-year window post discharge for each youth. As a result, data included youth discharged on or before December 31, 2015 and after January 1, 2010. The Justice data that we used for the analyses was pulled in April 2017 not allowing for a full 1-year recidivism window for any occurrences after December 31, 2015. While there were some discharges in 2009 and before, there were not enough occurrences for meaningful analyses.
Transcript of Statement of the Problem. Purpose of the Analysis. · Statement of the Problem. Purpose of the...
pg. 1
Recidivism Rates for Nebraska Juvenile Probationers: 2010 to 20151
Richard L. Wiener, PhD
February 5, 2018
University of Nebraska/Lincoln
Statement of the Problem.
Purpose of the Analysis. Accurate estimates of recidivism rates among juveniles
discharged from probation serve multiple administrative purposes, to:1) provide data for program
evaluation studies of specific probation services, 2) provide data for cost benefit analyses of
probation efforts, 3) track the success of probation services over time, 4) allow evidence based
policy formulation, and 5) test applied research hypotheses in the effort to improve both
rehabilitation outcomes and public safety. The current report describes the work and results of
the University of Nebraska/Lincoln -- Law and Psychology Program’s (LPP) analysis of juvenile
recidivism data for Nebraska Probation.
Analysis Goals. The primary objective of this work was to calculate the rates of
recidivism for juvenile probationers discharged during the time interval beginning on January 1,
2010 and ending on December 31, 2015, and to do so as accurately as the available data allowed.
A secondary objective was to disaggregate recidivism ratings according to the youths’ risk level
using the Youth Level of Service Case Management (YLS/CMI) risk tool. This report separates
recidivism rates by each year during the 2010-2015 interval and by level of YLS/CMI Risk.2
Definition of Recidivism. The research literature on recidivism offers a diverse set of
recidivism measures that vary based upon legal action (arrest vs. adjudication vs. conviction),
seriousness of crime (status offense vs. infraction vs. misdemeanor vs. felony), type of violation
(crime against property vs. crime against persons) and harmfulness of outcomes (violent crimes
vs. non-violent crimes). Although the database offers the opportunity to examine recidivism
using a variety of definitions commonly found in the literature, the current work adopted the
Nebraska Supreme Court’s definition of Juvenile Recidivism, which turns, in part on the
definition of successfully completed probation. For the purposes of this report, successfully
completed probation includes all youth who successfully completed probation, successfully
completed problem solving court, obtained an early release or “graduated.” Recidivistic youth
are those whom the courts adjudicated for infractions, misdemeanors, or felonies in the year
following the child’s discharge date if the adjudication was not a traffic violation unless the
traffic violation was a Class W misdemeanor (a DUI offense).
1 The University of Nebraska/Law and Psychology Program (LPP) wishes to thank, Ellen Brokofsky, State
Probation Administrator, Jeanne Brandner, Deputy Administrator – Juvenile Service Administrator and Kari
Rumbaugh, Assistant Deputy Administrator – Juvenile Service Administrator for their support in this work.
Furthermore, this analysis would not have been possible without the assistance of a team of graduate students in the
UNL Psychology Doctoral Program (Alisha Caldwell, Julie Wertheimer and Taylor Petty). 2 As noted in the definition of recidivism paragraph in this report, recidivism in this data analysis was calculated
using a one-year window post discharge for each youth. As a result, data included youth discharged on or before
December 31, 2015 and after January 1, 2010. The Justice data that we used for the analyses was pulled in April
2017 not allowing for a full 1-year recidivism window for any occurrences after December 31, 2015. While there
were some discharges in 2009 and before, there were not enough occurrences for meaningful analyses.
pg. 2
More specifically, this report uses the following Nebraska Supreme Court Definition of
juvenile recidivism:
“As applied to juveniles, recidivism shall mean that within 1 year of being successfully
released from a probation or problem-solving court program the juvenile has:
an adjudication pursuant to Neb. Rev. Stat. § 43-247(1) or (2) --
o Any juvenile who has committed an act other than a traffic offense which
would constitute a misdemeanor or an infraction under the laws of this
state, or violation of a city or village ordinance, and who, beginning July
1, 2017, was eleven years of age or older at the time the act was
committed….” [However] “for a juvenile 14 years or older, a final
conviction for a Class W misdemeanor based on a violation of state traffic
laws or ordinances of any city or village enacted in conformance with state
law” [was considered recidivism]
“Any juvenile who has committed an act which would constitute a felony under
the laws of this state and who, beginning July 1, 2017, was eleven years of age or
older at the time the act was committed.”
Analysis Strategy
NPACS Database. The Nebraska Probation Application for Community Safety
(NPACS) database contains all the records of the case management system into which probation
officers enter information for all juveniles that they serve. NPACS organizes records according
to case and contains, among other data, dates and types of arrests, dates and types of
adjudications, youth demographics, youth risk scores, services provided, violations, sanctions,
and probation outcomes (type of discharge). The first step was extracting a recidivism flat data
file from NPACS, one organized by individual youth rather than by case. The file included
demographic information (e.g., youth name, youth probation number, youth age, sex, race and
ethnicity), YLS/CMI scores immediately after entering probation, YLS/CMI scores immediately
prior to discharge, discharge date, type of discharge3 and a record of each offense post discharge
(including date of offense, description of offense and misdemeanor or felony status of the
offense). The Administrative Office of Probation prepared this NPACS flat file with the above
information organized by probationer for UNL to use for recidivism calculations.
JUSTICE Database. The Nebraska Judicial User System to Improve Court Efficiency
(Justice) database is the repository for Nebraska State Trial Court's case information.
Administrative staff in each jurisdiction enter and update these data on a case-by-case procedure.
Justice includes youth demographic information (e.g., name, identification number, age, sex, race
and ethnicity), case details including date of adjudication, court costs, and a register of court
3 This report does not disaggregate recidivism rates by type of charge, number of charges, or type of discharge. LLP
will conduct additional analyses to explore these relationships at the request of the Nebraska Administrative Office
of Probation (AOP).
pg. 3
actions. JUSTICE is also organized according to case with at least one entry for each youth,
sometimes with multiple entries when there are multiple adjudications.
Combined Recidivism Database. The major obstacle in analyzing recidivism for
juvenile probationers is the absence of a shared identification number or code to yoke together
youth data in NPACS and JUSTICE. However, both databases contain pieces of information
that together allow programmers to calculate a matched identification code within known limits
of confidence. The variables available to generate a matching code include the youth’s name
(which unfortunately can vary from case to case and entry to entry), date of birth, and various
demographic factors (age, sex, race, ethnicity and so forth). The complexity of linking the
information between these two databases is substantial considering that NPACS includes over
14,000 youths during the interval of interest (2010 – 2015) and that there are over 4 million
records in JUSTICE. The Nebraska Administrative Office of Probation (AOP) contracted with
EKS&H Consulting to write a match program that calculated an identification code linking youth
data in the two databases. The resulting combined database included only those youths whose
match in the two databases achieved a confidence equal to or greater than 99 percent certainty.
AOP and EKS&H Consulting and LPP organized the resulting matched data into a file organized
by instances of probation where each youth could have returned to probation multiple times over
the 6-year window.
Every youth in NPACS has at least one case entry in JUSTICE, the one for the offense
and case that resulted in the probation disposition. Many youths will have multiple offenses in
JUSTICE some during the one interval of interest and some after the interval. LPP analyzed
recidivism based only on the offenses that occurred after discharge but not after the one-year
interval to satisfy the elements of the Nebraska Supreme Court’s definition of recidivism. The
combined recidivism database contained 14,116 youth with matched NPACS data and
JUSTICE data post discharge for the one-year window. Some youth repeated probation up to
four times for a total of five occurrences. In order to offer an unbiased set of analyses not
contaminated by correlated error terms and recidivism rates weighted by the youths’ return to
probation after a successful (or unsuccessful discharge), we report analyses of youth
disaggregated by first, second, and third occurrences of the same youth in probation. Note: fourth
occurrences (14 youth) and fifth occurrences (1 youth) contained too few data points for
meaningful analyses. LPP analyzed these data for the administrative purposes of AOP and not
for the purpose of research or general dissemination. This report to AOP provides the results of
the LPP analyses.
LPP combined fields of information in the recidivism file using both Excel and SPSS
programs to calculate additional variables to use in the recidivism calculations. First, LPP
calculated a Recidivism Score for each of the 14,116 youth in the file for each occurrence in
probation: “0” if there were no new adjudications in the one-year post discharge window, “0” if
there were adjudications in the one-year window but were all traffic violations but not
Misdemeanor W’s -- as per the Nebraska Supreme Court’s definition of recidivism, and “1” if
at least one of the adjudications reached or went beyond the redline (i.e., the Nebraska Supreme
Court definition of recidivism reviewed above). LPP calculated a Risk Level based on the
pg. 4
YLS/CMI scores (the higher the score the more risk) for each instance of probation by adopting
the cutoffs that Nebraska Probation uses to classify juveniles into five risk levels (low - 0 to 8,
low moderate - 9 to 15, high moderate - 16 to 22, high -- 23 to 34, and very high - 35 to 42).
Next, LPP calculated a Year Tag based upon the year that probation discharged a youth for each
occurrence of probation. Finally, LPP calculated a Pretest Risk Score based upon the YLS/CMI
total risk score from the first testing at the beginning of probation for the first occurrence and a
Posttest Risk Score from the YLS/CMI testing just prior to discharge for the first occurrence, if
the data was available in the file. The YLS pretest risk scores ranged from 0 to 37, with
N=11,159 with Mean(M) = 12.35, Median(Md) = 12.00, Standard Deviation(S.D.) = 6.120. The
YLS posttest risk scores ranged from 0 to 38, with N=6159, Mean(M) = 12.10, Median(Md) =
12.00, Standard Deviation(S.D.) = 7.072.
Results.
Sample Characteristics. The combined database included 14,116 youth whose first
occurrence of probation resulted in a discharge between 2010 and 2015. We used December 31,
2015 as the last discharge date because it allowed a full year window to calculate recidivism. Of
the 14,116 youth in sample, 8318 were White (58.9%), 2301 were African American (16.3%),
397 were Native American (2.8%), 153 were Asian or Pacific Islanders (1.1%) and 2947 were
classified as other (20.89%). With regard to ethnicity, 3011 (21.3%) were Hispanic. (Note:
93.2% of the “other” race category were Hispanic youth.) The file included 9124 boys (64.6%)
and 4,992 girls (35.4%). The average age of the youth at the time of the first YLS score was 16
years (M = 15.99, Md = 16.23, S.D. = 1.53). The average age of the youth at the time of
discharge from the first probation occurrence was 17 years (M = 16.99, Md = 17.31, S.D. = 1.53).
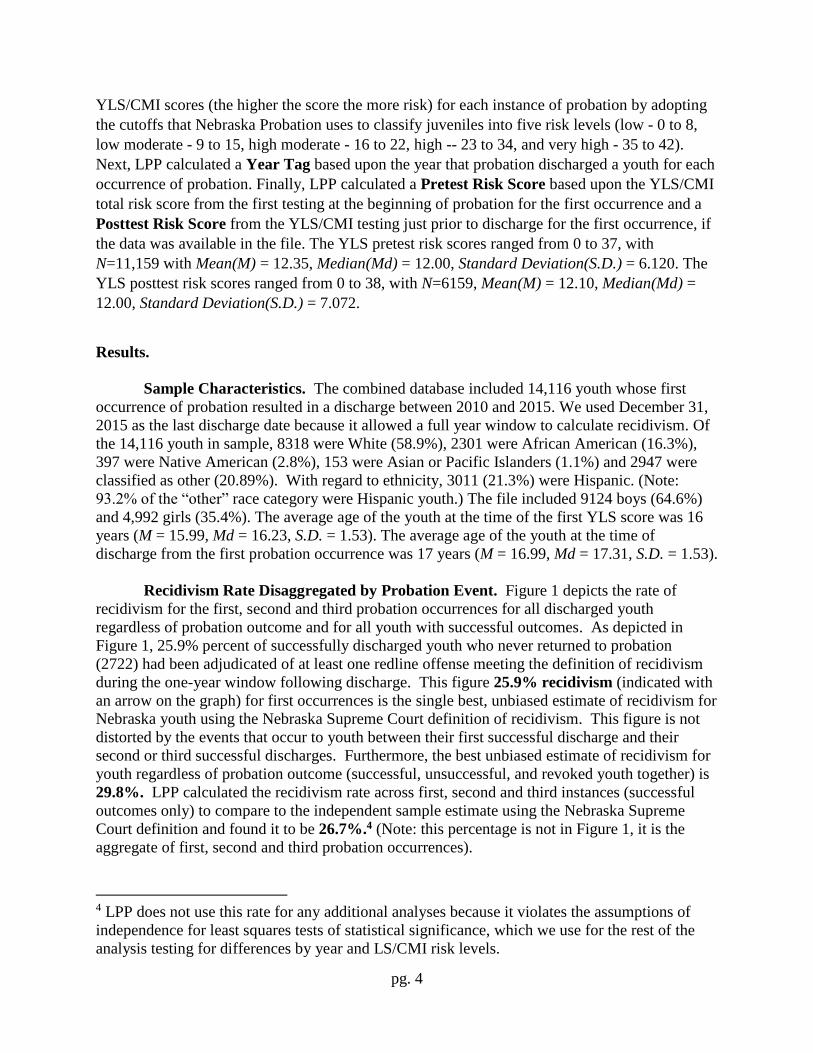
Recidivism Rate Disaggregated by Probation Event. Figure 1 depicts the rate of
recidivism for the first, second and third probation occurrences for all discharged youth
regardless of probation outcome and for all youth with successful outcomes. As depicted in
Figure 1, 25.9% percent of successfully discharged youth who never returned to probation
(2722) had been adjudicated of at least one redline offense meeting the definition of recidivism
during the one-year window following discharge. This figure 25.9% recidivism (indicated with
an arrow on the graph) for first occurrences is the single best, unbiased estimate of recidivism for
Nebraska youth using the Nebraska Supreme Court definition of recidivism. This figure is not
distorted by the events that occur to youth between their first successful discharge and their
second or third successful discharges. Furthermore, the best unbiased estimate of recidivism for
youth regardless of probation outcome (successful, unsuccessful, and revoked youth together) is
29.8%. LPP calculated the recidivism rate across first, second and third instances (successful
outcomes only) to compare to the independent sample estimate using the Nebraska Supreme
Court definition and found it to be 26.7%.4 (Note: this percentage is not in Figure 1, it is the
aggregate of first, second and third probation occurrences).
4 LPP does not use this rate for any additional analyses because it violates the assumptions of
independence for least squares tests of statistical significance, which we use for the rest of the
analysis testing for differences by year and LS/CMI risk levels.
pg. 5
Figure 1 also shows that for all youth regardless of probation outcome each subsequent
probation occurrence significantly increase the risk of recidivism and the same is true for youth
who successfully complete probation. Thus, the estimate combining first, second, and third
probation occurrences (i.e., 26.7%) is inflated because of the increased risk of failure during
subsequent probations.5
Yearly Recidivism Rate. The first step in calculating recidivism across the years in the
interval of interest was to list number of youth in the combined recidivism file for each of the
discharge years (2010 – 2015). (Note: Recidivism data using a one-year window was not
available for those discharged after 2015. However, these additional data will be included in
future analyses when available.) First, we calculated these statistics for the first occurrence of
probation and then for the second occurrence. LPP was unable to complete follow-up analyses
for the third occurrence of probation because the sample size of third occurrences was too small
(N = 100) to calculate reliable statistical parameters. Therefore, the analyses that follow for year
and risk level include only the first and second probation occurrences.
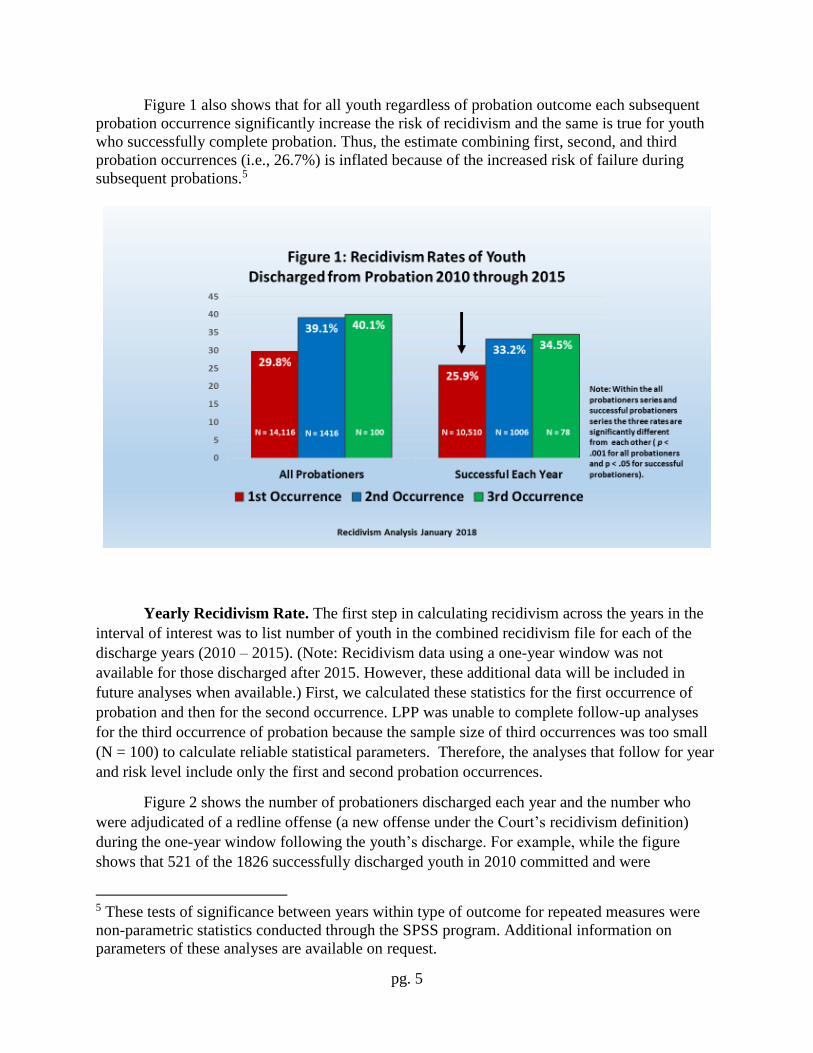
Figure 2 shows the number of probationers discharged each year and the number who
were adjudicated of a redline offense (a new offense under the Court’s recidivism definition)
during the one-year window following the youth’s discharge. For example, while the figure
shows that 521 of the 1826 successfully discharged youth in 2010 committed and were
5 These tests of significance between years within type of outcome for repeated measures were
non-parametric statistics conducted through the SPSS program. Additional information on
parameters of these analyses are available on request.
pg. 6
adjudicated for a redline (recidivating) offense, that offense (or those offenses) could have
occurred anytime during the one-year window following discharge date for each youth.
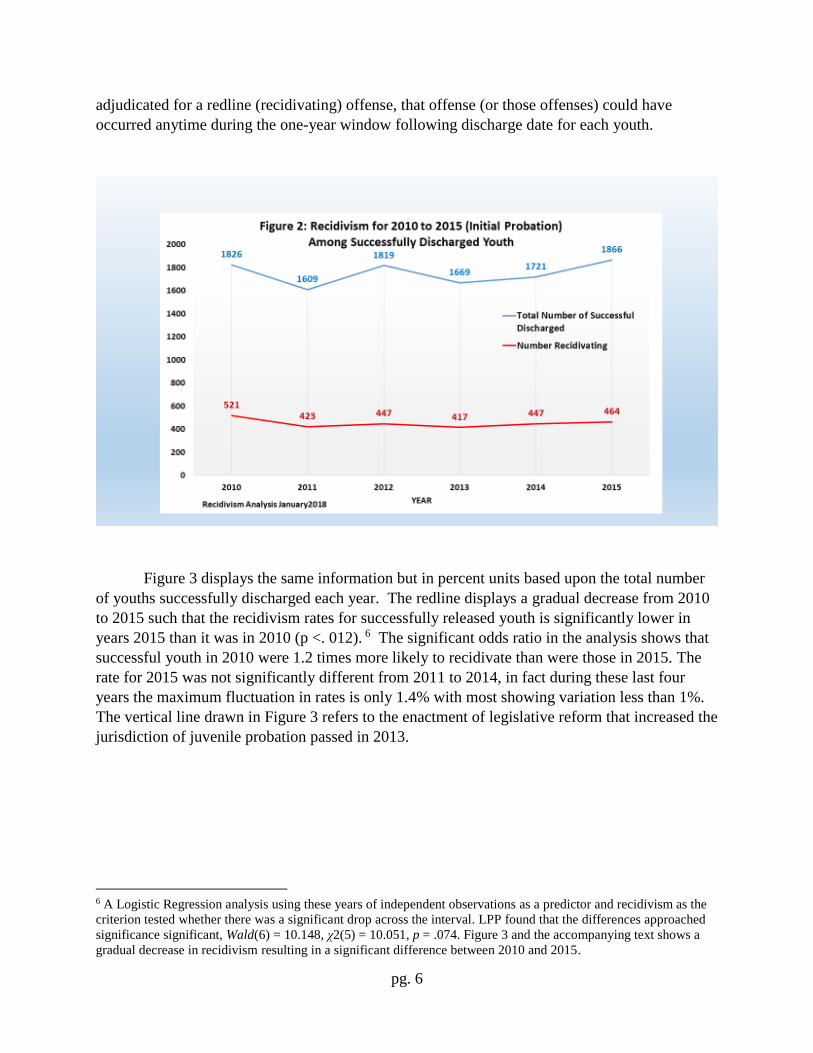
Figure 3 displays the same information but in percent units based upon the total number
of youths successfully discharged each year. The redline displays a gradual decrease from 2010
to 2015 such that the recidivism rates for successfully released youth is significantly lower in
years 2015 than it was in 2010 (p <. 012). 6 The significant odds ratio in the analysis shows that
successful youth in 2010 were 1.2 times more likely to recidivate than were those in 2015. The
rate for 2015 was not significantly different from 2011 to 2014, in fact during these last four
years the maximum fluctuation in rates is only 1.4% with most showing variation less than 1%.
The vertical line drawn in Figure 3 refers to the enactment of legislative reform that increased the
jurisdiction of juvenile probation passed in 2013.
6 A Logistic Regression analysis using these years of independent observations as a predictor and recidivism as the
criterion tested whether there was a significant drop across the interval. LPP found that the differences approached
significance significant, Wald(6) = 10.148, χ2(5) = 10.051, p = .074. Figure 3 and the accompanying text shows a
gradual decrease in recidivism resulting in a significant difference between 2010 and 2015.
pg. 7
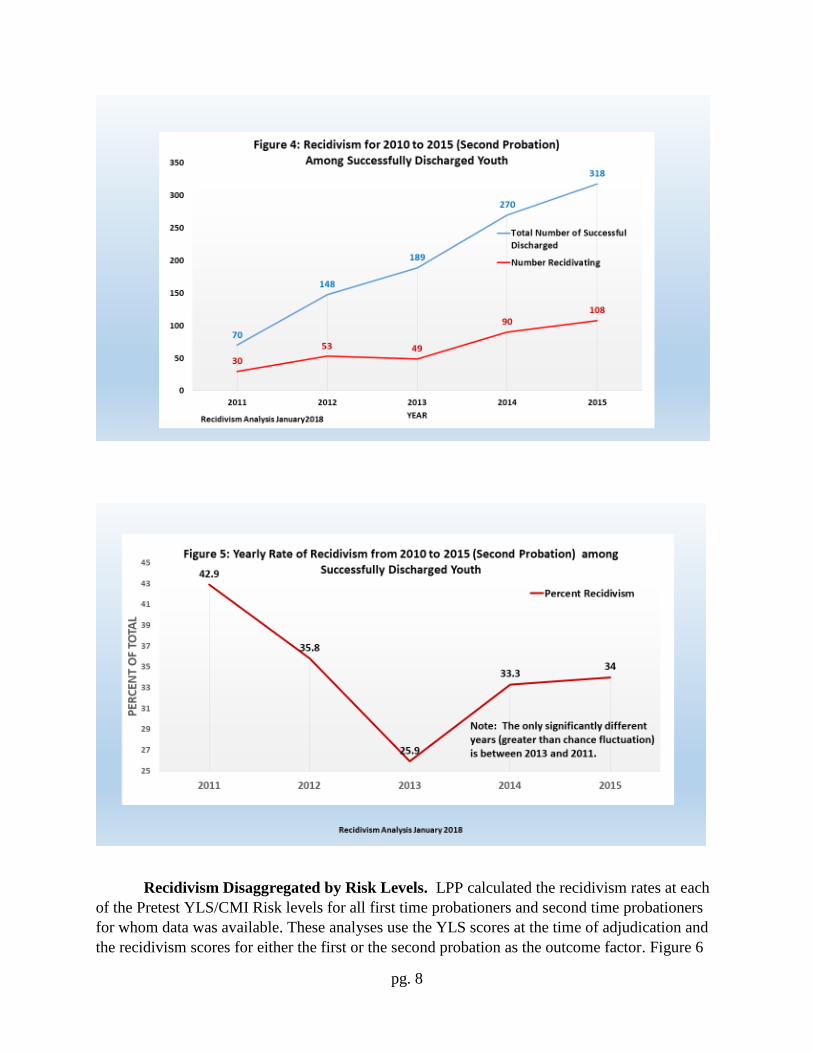
Next, LPP calculated the trend in time for successful youth who had returned to probation
a second time after either successfully or unsuccessfully completing a first probation. These are
the 1006 youth in figure 1 with an overall recidivism rate of 33.2% (N = 1006) without the 14
youth who were discharged in 2010, leaving 995 youth who returned to probation a second time.
We removed these youth because 14 are too few to use to estimate recidivism in that stand-alone
year. Figure 4 shows the number of second time probationers discharged successfully each year
and the number who were adjudicated of a redline offense (a new offense under the Court’s
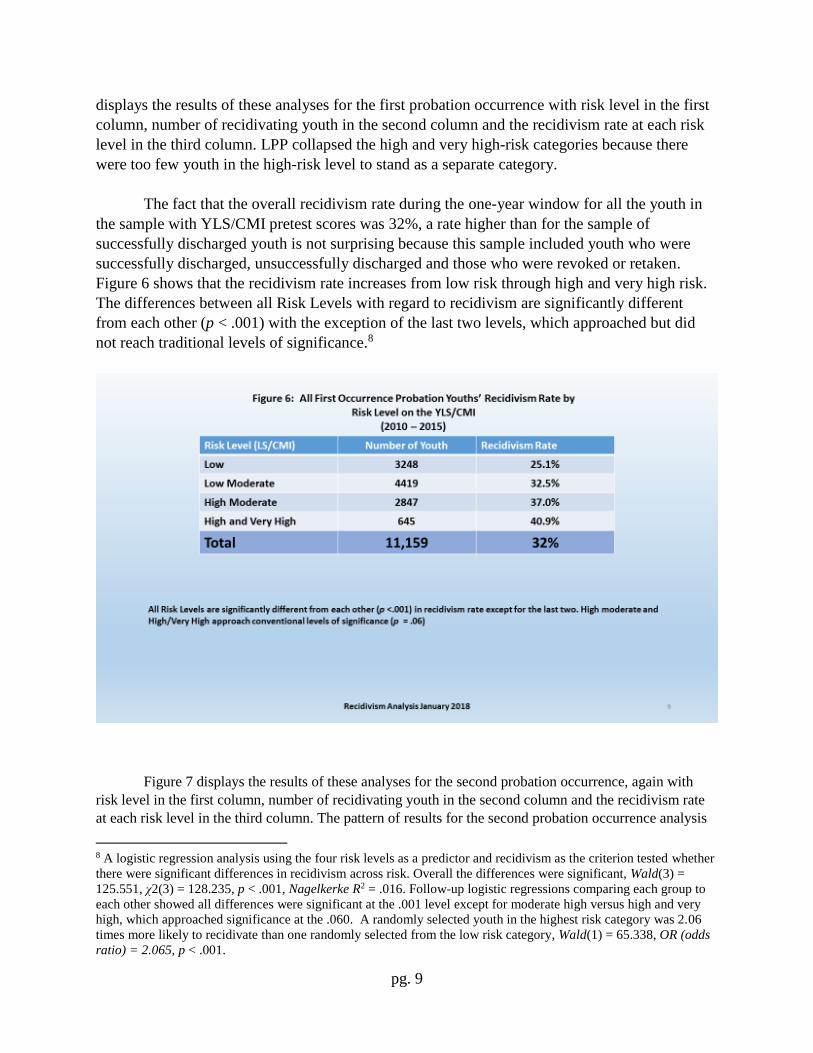
recidivism definition) during the one-year window following the youth’s discharge. Figure 5
displays the same information but in percent units based upon the total number of youths
successfully discharged each year from their second occurrence of probation. While the trend
looks like it fluctuates, the only significant difference in the years is between 2011 and 2013.7
The differences do not reach significance because the number of youth is much lower than in the
first probation occurrence. However, as shown in Figure 1 the rate of recidivism for the second
occurrence of probation is much higher than for the first and that difference is statistically
significant as indicated in Figure 1.
7 A logistic regression analysis using the year of discharge as the predictor and recidivism as the
criterion showed no overall change in the model, Wald(4) = 7.900, χ2(4) = 8.067, p = .095,
Nagelkerke R2 = .01. The only significant change was the difference between 2011 and 2013. All
other changes are simply chance fluctuations.
pg. 8
Recidivism Disaggregated by Risk Levels. LPP calculated the recidivism rates at each
of the Pretest YLS/CMI Risk levels for all first time probationers and second time probationers
for whom data was available. These analyses use the YLS scores at the time of adjudication and
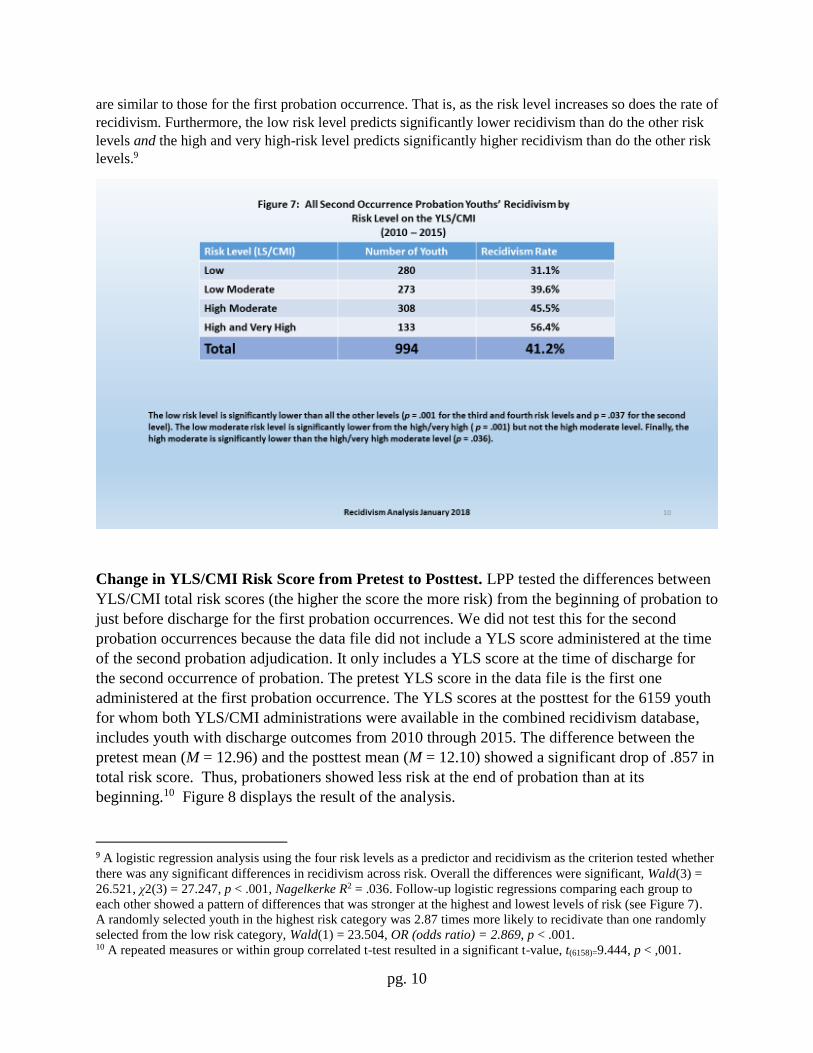
the recidivism scores for either the first or the second probation as the outcome factor. Figure 6
pg. 9
displays the results of these analyses for the first probation occurrence with risk level in the first
column, number of recidivating youth in the second column and the recidivism rate at each risk
level in the third column. LPP collapsed the high and very high-risk categories because there
were too few youth in the high-risk level to stand as a separate category.
The fact that the overall recidivism rate during the one-year window for all the youth in
the sample with YLS/CMI pretest scores was 32%, a rate higher than for the sample of
successfully discharged youth is not surprising because this sample included youth who were
successfully discharged, unsuccessfully discharged and those who were revoked or retaken.
Figure 6 shows that the recidivism rate increases from low risk through high and very high risk.
The differences between all Risk Levels with regard to recidivism are significantly different
from each other (p < .001) with the exception of the last two levels, which approached but did
not reach traditional levels of significance.8
Figure 7 displays the results of these analyses for the second probation occurrence, again with
risk level in the first column, number of recidivating youth in the second column and the recidivism rate
at each risk level in the third column. The pattern of results for the second probation occurrence analysis
8 A logistic regression analysis using the four risk levels as a predictor and recidivism as the criterion tested whether
there were significant differences in recidivism across risk. Overall the differences were significant, Wald(3) =
125.551, χ2(3) = 128.235, p < .001, Nagelkerke R2 = .016. Follow-up logistic regressions comparing each group to
each other showed all differences were significant at the .001 level except for moderate high versus high and very
high, which approached significance at the .060. A randomly selected youth in the highest risk category was 2.06
times more likely to recidivate than one randomly selected from the low risk category, Wald(1) = 65.338, OR (odds
ratio) = 2.065, p < .001.
pg. 10
are similar to those for the first probation occurrence. That is, as the risk level increases so does the rate of
recidivism. Furthermore, the low risk level predicts significantly lower recidivism than do the other risk
levels and the high and very high-risk level predicts significantly higher recidivism than do the other risk
levels.9
Change in YLS/CMI Risk Score from Pretest to Posttest. LPP tested the differences between
YLS/CMI total risk scores (the higher the score the more risk) from the beginning of probation to
just before discharge for the first probation occurrences. We did not test this for the second
probation occurrences because the data file did not include a YLS score administered at the time
of the second probation adjudication. It only includes a YLS score at the time of discharge for
the second occurrence of probation. The pretest YLS score in the data file is the first one
administered at the first probation occurrence. The YLS scores at the posttest for the 6159 youth
for whom both YLS/CMI administrations were available in the combined recidivism database,
includes youth with discharge outcomes from 2010 through 2015. The difference between the
pretest mean (M = 12.96) and the posttest mean (M = 12.10) showed a significant drop of .857 in
total risk score. Thus, probationers showed less risk at the end of probation than at its
beginning.10 Figure 8 displays the result of the analysis.
9 A logistic regression analysis using the four risk levels as a predictor and recidivism as the criterion tested whether
there was any significant differences in recidivism across risk. Overall the differences were significant, Wald(3) =
26.521, χ2(3) = 27.247, p < .001, Nagelkerke R2 = .036. Follow-up logistic regressions comparing each group to
each other showed a pattern of differences that was stronger at the highest and lowest levels of risk (see Figure 7).
A randomly selected youth in the highest risk category was 2.87 times more likely to recidivate than one randomly
selected from the low risk category, Wald(1) = 23.504, OR (odds ratio) = 2.869, p < .001. 10 A repeated measures or within group correlated t-test resulted in a significant t-value, t(6158)=9.444, p < ,001.

pg. 11
Change in YLS/CMI Risk Score from 2010 to 2016. LPP tested the differences of the
YLS/CMI total risk scores at the pretest across the years in the study and although there was an
overall statistically significant difference across years, the pattern of results shows no consistent
trend only random fluctuation, (the mean risk scores across years from 2010 through 2015 were
in chronological order: 12.4, 12.7, 12.8, 12.5, 11.8, and 12.0).11 The range of the pretest scores
is from 12.8 to 11.8, showing only a 1-point fluctuation in a scale that varies from 0 to 37.
Limitations
These data like those that make up all empirical investigations have some limitations.
First, the data in NPACS and JUSTICE do not share a unique probationer identifier, so that
EKS&H Consulting calculated one based upon shared youth characteristics. The resulting
recidivism analyses included only those youth for whom the confidence of the match was equal
to or greater than 99%. Thus, we can expect that a small number (less than 1% of matches)
might have been false positives (positive matches that were in in fact not matches) because the
shared identification code may have produced an incorrect match. However, there is no reason to
believe that any mismatching is systematic; therefore, the mean of the errors in all probability
was equal to 0, indicating that errors in the analysis cancelled each other out in the recidivism
calculations.
11 A oneway Analysis of Variance resulted in an overall significant effect, F(5,11159) = 6.976, p = .003, r = .05. The
effect size is very small so that the reason for the statistically significant F is the very large sample size.

pg. 12
Second, probation and court staff enter data into the NPACS and JUSTICE databases,
respectively. There is likely some error in data input and there are likely some cases missing in
JUSTICE. However, to the extent that probation and court staff entered the data into the two
databases correctly, LPP is confident of the recidivism calculations.
Third and finally, the recidivism numbers do not reflect adjudications in other states or in
federal court and as such only reflect recidivism in the Nebraska system.
These limitations notwithstanding, LPP is confident that the recidivism results presented
here are valid indicators of Nebraska Juvenile Probationer recidivism rates calculated as best as
possible according to the Nebraska Supreme Court’s definition of recidivism.