STATEMENT OF CORPORATE INTENT 2017-18
19
STATEMENT OF CORPORATE INTENT 2017-18
Transcript of STATEMENT OF CORPORATE INTENT 2017-18

STATEMENT OF CORPORATE INTENT
2017-18

Contents
1. INTRODUCTION ............................................................................................................. 1
2. OUR BUSINESS ............................................................................................................. 2
3. OUR STRATEGY ............................................................................................................ 6
4. FINANCIALS .................................................................................................................. 11

1
1. INTRODUCTION
I have the pleasure to present on behalf of the Board of Commissioners of the Insurance Commission of Western Australia (Insurance Commission), the strategic plan for the 2017-18 financial year. This plan is presented as the Statement of Corporate Intent (SCI) as required by the Insurance Commission of Western Australia Act 1986.
Over the past 12 months, the Executive and the Board of the Insurance Commission have reviewed the corporate strategy to ensure it is fit-for-purpose for the business and its environment.
Our strategy must balance short-term objectives with the long-term horizons and the uncertainty that investment markets and long-tail insurance liabilities bring. The strategy must be agile and responsive to change so that we can adopt new technologies and pursue continuous improvement opportunities. Importantly, we must ensure that our organisational culture and values sit at the heart of our strategy and underpin our decision making.
Our four strategic objectives for 2017-18 are to:
1. Provide quality and affordable insurance products.2. Operate effectively and efficiently;3. Deliver sustainable financial performance; and4. Develop our people and capability.
Each of these strategic objectives are supported by underlying strategies and measured by performance targets.
I look forward to continuing to deliver value for our shareholder, the Treasurer representing the Western Australian Government, and the people of Western Australia. Our Board, Chief Executive, Executive team and our committed staff will work towards achieving these strategic objectives over the coming financial year.
FRANK COOPER CHAIRMAN

2
2. OUR BUSINESS The Insurance Commission is a Government Business Enterprise and statutory corporation owned by the Government of Western Australia. The enabling legislation is the Insurance Commission of Western Australia Act 1986. The responsible Minister is Hon Ben Wyatt MLA, Treasurer; Minister for Finance; Energy; Aboriginal Affairs.
2.1 Our Functions
The Insurance Commission is responsible for:
administering, underwriting and managing motor injury insurance;
managing RiskCover, the self-insurance arrangements on behalf of WA Government;
investing and managing funds to provide assets to meet insurance liabilities; and
advising Government about insurance matters.
The Insurance Commission manages and/or underwrites a number of funds to deliver its insurance functions. The Insurance Commission employs approximately 400 people in 360 Full Time Equivalent positions within the areas of insurance, legal, fraud prevention, investment management, information technology, finance and human resource management.
2.1.1 Motor Injury Insurance
The Insurance Commission underwrites motor injury insurance in Western Australia. The motor injury insurance policy is governed by two Acts of Parliament: the Motor Vehicle (Third Party Insurance) Act 1943 and the Motor Vehicle (Catastrophic Injuries) Act 2016. The policy provides owners and drivers of WA registered vehicles with an unlimited indemnity against personal injury claims for injuries they cause to others in motor vehicle crashes. The policy also provides cover to any person catastrophically injured in a crash in WA. The policy is issued to motorists along with the motor vehicle registration by the Department of Transport and its agents who collect premium payments on behalf of the Insurance Commission. At 30 June 2016, there were over 1.8 million licensed drivers and 2.8 million motor vehicles insured in WA.

3
Insurance premium revenue for motor injury insurance is paid into the Third Party Insurance Fund and the Motor Vehicle (Catastrophic Injuries) Fund. Together with investment income, this revenue is used to pay motor injury insurance claims and scheme administration costs. The Insurance Commission, under a Service Delivery Arrangement with the Commonwealth Government, also manages the Indian Ocean Territories Motor Injury Insurance Scheme. 2.1.2 RiskCover
The Insurance Commission through the RiskCover Fund self-insures WA Government public agencies for most agencies’ insurable risk exposures including:
workers’ compensation;
loss or damage to property;
legal liability cover for general, professional and medical treatment; and
personal accident.
Fund contributions (premiums) collected from agencies are used to pay insurance claims. Financial assets are held and invested by the Insurance Commission on behalf of Government to meet insurance liabilities. The Insurance Commission also manages and/or underwrites a number of funds to deliver its insurance functions.
Government Insurance Fund. A consolidation of the Government’s superseded self-insurance arrangements that preceded RiskCover.
Compensation (Industrial Diseases) Fund. Industrial disease insurance policies provided to employers involved in the mining industry, and claims paid against these policies.
Insurance Commission General Fund. Caters for the run-off of non-government liabilities of the former SGIO.
WorkCover WA Funds. Claims managed against WorkCover’s Employers’ Indemnity Supplementation Fund for when an authorised workers’ compensation insurer goes into liquidation, and claims lodged against WorkCover’s General Fund for injured workers of uninsured employers.
Former Police Officers’ Medical Benefit Scheme. Cover provided for medical and other expenses incurred post-separation by former Police Officers and Aboriginal Police Liaison Officers who sustained a work-related injury or disease during service and have since left WA Police.
2.1.3 Investments
The Insurance Commission, assisted by its independent investment consultant, determines an investment strategy to assist it acquire, hold and develop investment assets to meet its insurance liabilities in line with Prudential Guidelines for Investments approved by the Treasurer of Western Australia.
4
2.1.4 Advice to Government
The Insurance Commission provides advice to the Treasurer and Government on insurance matters.
2.2 Our Structure
In order to perform the functions above, our structure is two core insurance divisions (Motor Injury Insurance and RiskCover) and the Investments Division, which are supported by the Executive, Finance and Administration, Information Technology and Human Resource areas. Legal Services has a primary function to protect and pursue the Insurance Commission’s interests in the Bell Group litigation and recovery. The two core insurance divisions are also supported by the business functions of Fraud Investigations, and Business Improvement and Services.

VISIONA Government Business Enterprise delivering efficient and equitable insurance services to WA motorists and Government Departments and Authorities.
MISSIONTo provide high quality and efficient:• motor injury insurance to WA motorists;• self-insurance fund management (RiskCover) for Government
Departments and Authorities;
• industrial diseases insurance to the mining sector and management of the Insurance Commission General Fund, Employers’ Indemnity Supplementation Fund and Government Insurance Fund; and
• advice to the Government on insurance matters. CORE VALUESIn everything we do, our Core Values are:• simplicity;• teamwork;• accountability;
• integrity and openness; and• respect and compassion.
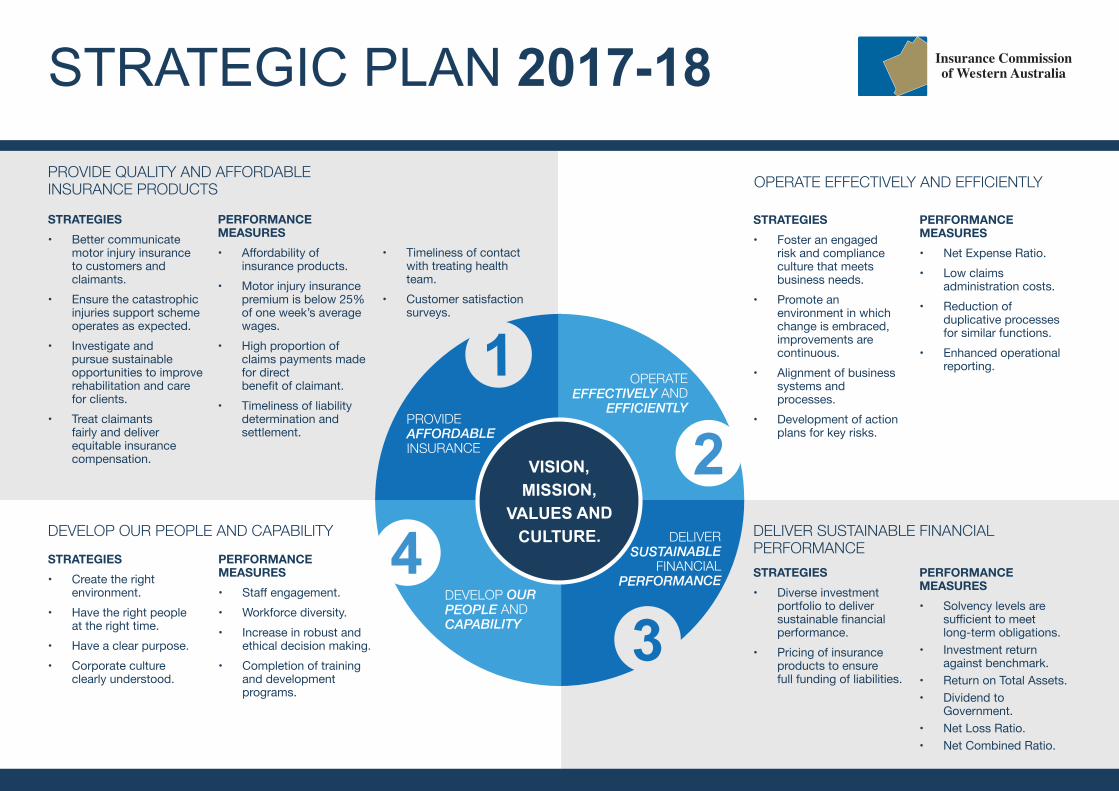
PROVIDE QUALITY AND AFFORDABLE INSURANCE PRODUCTS
OUR APPROACH TO WHAT WE DO IS REFLECTED IN OUR VISION, MISSION AND CORE VALUES.
OUR APPROACH
VISION, MISSION,
VALUES AND CULTURE.
1
3
24
STRATEGIC PLAN 2017-18
PROVIDE AFFORDABLE INSURANCE
STRATEGIES• Bettercommunicate
motorinjuryinsurancetocustomersandclaimants.
• Ensurethecatastrophicinjuriessupportschemeoperatesasexpected.
• Investigateandpursuesustainableopportunitiestoimproverehabilitationandcareforclients.
• Treatclaimantsfairlyanddeliverequitableinsurancecompensation.
PERFORMANCE MEASURES• Affordabilityof
insuranceproducts.• Motorinjuryinsurance
premiumisbelow25%ofoneweek’saveragewages.
• Highproportionofclaimspaymentsmadefordirectbenefitofclaimant.
• Timelinessofliabilitydeterminationandsettlement.
PROVIDE QUALITY AND AFFORDABLE INSURANCE PRODUCTS
• Timelinessofcontactwithtreatinghealthteam.
• Customersatisfactionsurveys.
OPERATE EFFECTIVELY AND
EFFICIENTLY
STRATEGIES• Fosteranengaged
riskandcomplianceculturethatmeetsbusinessneeds.
• Promoteanenvironmentinwhichchangeisembraced,improvementsarecontinuous.
• Alignmentofbusinesssystemsandprocesses.
• Developmentofactionplansforkeyrisks.
PERFORMANCE MEASURES• NetExpenseRatio.• Lowclaims
administrationcosts.• Reductionof
duplicativeprocessesforsimilarfunctions.
• Enhancedoperationalreporting.
OPERATE EFFECTIVELY AND EFFICIENTLY
DELIVER SUSTAINABLE
FINANCIAL PERFORMANCE STRATEGIES
• Diverseinvestmentportfoliotodeliversustainablefinancialperformance.
• Pricingofinsuranceproductstoensurefullfundingofliabilities.
PERFORMANCE MEASURES• Solvencylevelsare
sufficienttomeetlong-termobligations.
• Investmentreturnagainstbenchmark.
• ReturnonTotalAssets.• Dividendto
Government.• NetLossRatio.• NetCombinedRatio.
DELIVER SUSTAINABLE FINANCIAL PERFORMANCE
DEVELOP OUR PEOPLE AND CAPABILITY
STRATEGIES• Createtheright
environment.• Havetherightpeople
attherighttime.• Haveaclearpurpose.• Corporateculture
clearlyunderstood.
PERFORMANCE MEASURES• Staffengagement.• Workforcediversity.• Increaseinrobustand
ethicaldecisionmaking.• Completionoftraining
anddevelopmentprograms.
DEVELOP OUR PEOPLE AND CAPABILITY

7
3.1 Strategies and Performance Measures
Our four strategic objectives for 2017-18 are to:
1. Provide quality and affordable insurance products. 2. Operate effectively and efficiently; 3. Deliver sustainable financial performance; and 4. Develop our people and capability.
Each of these strategic objectives are supported by underlying strategies and various performance targets and measures.
3.1.1 Provide quality and affordable insurance products
Strategy 1 - Better communicate motor injury insurance to customers and claimants.
1. Develop and communicate clear and concise documentation to explain motor injury insurance cover.
2. Produce and provide communication materials to claimants and service providers that helps improve their interactions with the organisation.
3. Continue to work collaboratively with the Department of Transport, as the retail agent of the organisation, to explain to customers the insurance product they purchase.
Strategy 2 - Ensure the catastrophic injuries support scheme operates as expected.
1. Continue to engage with clients of the catastrophic injuries support scheme as early as possible after the crash.
2. Provide an efficient and effective lifetime care service to people with catastrophic injuries.
Strategy 3 - Investigate and pursue sustainable opportunities to improve rehabilitation and care for clients/claimants.
1. Provide funding for neurotrauma research to improve rehabilitation outcomes for people with acquired brain and spinal cord injuries.
2. Review technology and pursue opportunities that increase the independence of people with catastrophic injuries, and reduce carer and family burden.
Strategy 4 – Provide an insurance scheme that treats claimants fairly and delivers equitable compensation.
1. Information on cover and entitlements is clear and available. 2. Claimants are provided pathways to provide feedback and make
complaints. 3. Key claims decisions are appropriately documented and communicated

8
to claimants.
Performance measures
1. Affordability of insurance products compared to other jurisdictions and providers.
2. Motor injury insurance premium is below 25% of one week’s average wages.
3. High proportion of claims payments made for direct benefit of claimant. 4. Timeliness of liability determination and settlement. 5. Timeliness of contact with treating health team. 6. Customer satisfaction surveys.
3.1.2 Operate effectively and efficiently
Strategy 1 - Foster an engaged risk and compliance culture that meets business needs.
1. Deploy risk and compliance resources to ensure the Insurance Commission complies with increasing public sector obligations and legislative requirements on risk and compliance.
2. Ensure risk and compliance efforts meet the business needs and result in a reduction of red-tape.
3. Comprehensive action plans developed for key risks impacting the business.
Strategy 2 - Promote an environment in which change is embraced, improvements are continuous.
1. Continue efforts to encourage improvement suggestions to be proposed and change to be embraced.
2. Recognise and reward proactive change management and innovation. 3. Identify and promote the use of carer technology that helps to:
a. increase independence of individuals with acquired brain injuries or spinal injuries;
b. reduce effort for carers; c. reduce burden on families; and d. lower costs for insurers.
Strategy 3 - Alignment of business systems and processes.
1. Identify common functions within the organisation and seek to align those functions by using similar information technology systems and processes.
2. Decommission business systems and processes that are duplicated. 3. Leverage business intelligence and analytics to drive improved
decision making.
Performance measures
1. Net expense ratio (measures operational efficiency). 2. Claims administration costs as a percentage of claims paid.

9
3. Reduction in number of duplicative processes for similar functions. 4. Enhanced operational reporting including benchmarking.
3.1.3 Deliver sustainable financial performance
Strategy 1 - Diverse investment portfolio to deliver sustainable financial performance.
1. Maintain the diversified portfolio strategic asset allocation in line with Prudential Guidelines for Investments.
2. Maintain a neutral allocation in the order of a 70% growth assets to 30% defensive assets split for the Main Fund.
3. Move toward a neutral allocation in the order of a 75% growth assets to 25% defensive assets split for MVCIF.
4. Seek to divest Westralia Square as the Insurance Commission’s last remaining directly held investment property.
5. Introducing a specific investment allocation to infrastructure assets of 10% for each Fund.
Strategy 2 - Pricing of insurance products to ensure full funding of liabilities.
1. Take steps to minimise underwriting losses in the motor injury
insurance business. 2. Maintain a minimum risk margin to achieve a probability of sufficiency
that the Insurance Commission has sufficient assets to meet insurance liabilities.
3. Ensure that the Insurance Commission and RiskCover are fully funded (i.e., insurance operations are self-sustaining and not reliant on investment returns).
Performance measures
1. Solvency levels are sufficient to meet long-term obligations (maintaining individual Fund solvency at a target of 135%).
2. Investment return above benchmark for each Fund (Main Fund investment performance target of Consumer Price Index plus 3.5% (gross); MVCIF investment performance target of Consumer Price Index plus 3.25% (gross)).
3. Return on Total Assets. 4. Dividend to Government (target of 4% of net equity of Third Party
Insurance Fund). 5. Net Loss Ratio (measures sufficiency of premium revenue compared to
the cost of claims incurred). 6. Net Combined Ratio (measures underwriting profitability).
3.1.4 Develop our people and capability Strategy 1 - Create the right environment
1. Undertake an assessment of our corporate culture and guide programs to create, communicate and maintain the right environment.
2. Implement further policies, practices and training to maintain employee

10
awareness of robust and ethical decision making. 3. Identify opportunities to achieve employee engagement levels that are
equal to or above equivalent sector benchmarks. 4. Implement the Reconciliation Action Plan to enhance respect for
Aboriginal and Torres Strait Islander people. 5. Implement the Disability Access and Inclusion Plan to raise awareness
of access and inclusion, and improve our service delivery. Strategy 2 - Have the right people at the right time
1. Refresh and deliver on our Employee Value Proposition. 2. Actively manage workforce plans and FTE levels. 3. Implement the Corporate Training and Development Plan. 4. Implement the Occupational Safety and Health Management Plan. 5. Implement the Gender Diversity Action Plan. 6. Further develop plans to increase youth workforce diversity. 7. Develop and implement further programs to enhance the professional
development of claims staff. Strategy 3 - Have a clear purpose
1. Undertake an audit of leadership and management efficacy for tier two and three Management through a 360-degree feedback model.
2. Implement a targeted leadership and management development program.
3. Recognise and reward the right employee behaviour and performance. 4. Promptly and honestly address substandard employee performance
and behaviour. Performance measures
1. Increase in robust and ethical decision making. 2. Increase in the proportion of youth in the workforce. 3. Increase in the proportion of women in leadership positions. 4. High levels of staff engagement. 5. 100% of eligible employees complete all public sector compliance
training by the required dates.

11
4. FINANCIALS The Financial Objectives and Key Performance Indicators are presented in Appendix 1. The Insurance Commission prepares financial statements in accordance with Australian Accounting Standards, Statements of Accounting Concepts, and other authoritative pronouncements of the Australian Accounting Standards Board, as applied by the Treasurer's Instructions to ensure appropriate reporting across the Public Sector. Where modification has a material or significant effect on the reported results, details of that modification and the resulting financial effect, are disclosed in individual notes to the financial statements in the Insurance Commission’s Annual Report. The Financial Statements are prepared on the accrual basis of accounting. The majority of the Insurance Commission assets and liabilities are measured at fair value and the remainder follow the historical cost convention.

INSURANCE COMMISSION of WESTERN AUSTRALIA$'000
STATEMENT OF FINANCIAL POSITION 2017-2018
CURRENT ASSETSCash and Cash Equivalents 9 Receivables 48,894 Financial Assets at Fair Value 4,352,593 Other Assets 10,721 Total Current Assets 4,412,217
NON-CURRENT ASSETSReceivables 217,275 Financial Assets at Fair Value 576,919 Investment Property 248,037 Property, Plant and Equipment 3,004 Intangible Assets 6,439 Total Non-Current Assets 1,051,674
TOTAL ASSETS 5,463,892 TOTAL INVESTMENT ASSETS 5,177,549 CURRENT LIABILITIESPayables (27,940)Financial Liabilities at Fair Value (1,086,556)Outstanding Claims Liability (478,068)Unearned Premium Liability (311,924)Provisions (7,622)Current Tax Payable (15,634)Total Current Liabilities (1,927,744)
NON-CURRENT LIABILITIESOutstanding Claims Liability (2,087,219)Provisions (10,440)Deferred Tax Liabilities (146,104)Total Non-Current Liabilities (2,243,763)
TOTAL LIABILITIES (4,171,507)
NET ASSETS 1,292,384
EQUITYC(ID)F Reserve 20,865 Distribution of Equity - Dividend (68,060)Retained Earnings 1,339,579
TOTAL EQUITY 1,292,384
$'000
STATEMENT OF COMPREHENSIVE INCOME 2017-2018
Premium Revenue 771,718 Outwards Reinsurance Premium Expense (8,100)Outwards Reinsurance Commission Revenue 806 Net Premium Revenue 764,424
Claims Expense (708,171)Reinsurance and Other Recoveries Revenue 32,701 Net Claims Incurred (675,470)
Net Underwriting and Administration Expenses (78,485)
UNDERWRITING PROFIT/(LOSS) 10,469
Investment Income 311,781 Investment Admin Expenses (31,888)Net Investment Income 279,893 Finance Costs (64,163)Other Income 2,481
218,211
228,680
Income Tax Equivalent Expense @ 30% (68,604)
160,076
PROFIT BEFORE INCOME TAX EQUIVALENT EXPENSE
PROFIT AFTER INCOME TAX EQUIVALENT EXPENSE

INSURANCE COMMISSION of WESTERN AUSTRALIA
2017-2018
Forecast
Insurance Commission
Return on Total Assets (%) 4.3This KPI is calculated as the Insurance Commission's profit/(loss) beforeincome tax (expense)/benefit divided by its total assets (sum of totalassets at start of financial year and end of financial year divided by 2) andis expressed as a percentage. This KPI measures how well the InsuranceCommission is using its assets to produce income.
Investment Income Rolling 7 Year Return (%) 5.5This KPI calculates the long-term investment performance, measured overa rolling 7-year period as a percentage (on a per annum basis) of theamount of money invested. This KPI measures whether investmentreturns have achieved the Board's long-term Consumer Price Index (CPI)plus 3.5% investment objective (Main Fund) and CPI plus 3.25% (MVCIF).
Annual Investment Rate of Return (%) 6.2This KPI calculates the amount of revenue/(loss) the InsuranceCommission’s investment strategy generates over the financial year as apercentage of the value of the opening investment assets. This KPImeasures the Insurance Commission’s performance compared to aspecific market-related benchmark. The benchmark is a mix of Australianand global share market, fixed interest and property indices.
Solvency Level (%) 131.0This KPI calculates Total Assets as a percentage of Total Liabilities for theInsurance Commission. This KPI measures the ability of the InsuranceCommission to meet its long-term financial obligations as they fall due.
Net Loss Ratio (%) 88.4This KPI calculates net claims incurred (claims payments and movementsin outstanding claims provision) as a percentage of net premium revenue.This KPI measures the sufficiency of premium revenue compared to thecost of claims incurred. A ratio below 100% indicates the InsuranceCommission received sufficient net premium revenue to meet the net costof claims incurred. A ratio greater than 100% indicates net premiumrevenue was insufficient to meet the net cost of claims incurred.
Net Expense Ratio (%) 10.3This KPI calculates underwriting and administration expenses as apercentage of net premium revenue. This KPI is a measure of operationalefficiency. A lower expense ratio would contribute to higher profits/lowerlosses being generated.
Net Combined Ratio (%) 98.7This KPI calculates underwriting and administration expenses and netclaims incurred as a percentage of net premium revenue. This KPI is ameasure of underwriting profitability used to indicate how well the Fund isperforming. It is the combined result of the Net Loss Ratio added to theNet Expense Ratio. A ratio below 100% indicates that an underwritingprofit has been made, whereas a ratio above 100% indicates anunderwriting loss.
Key Performance Indicators
INSURANCE COMMISSION of WESTERN AUSTRALIA
2017-2018
ForecastKey Performance Indicators
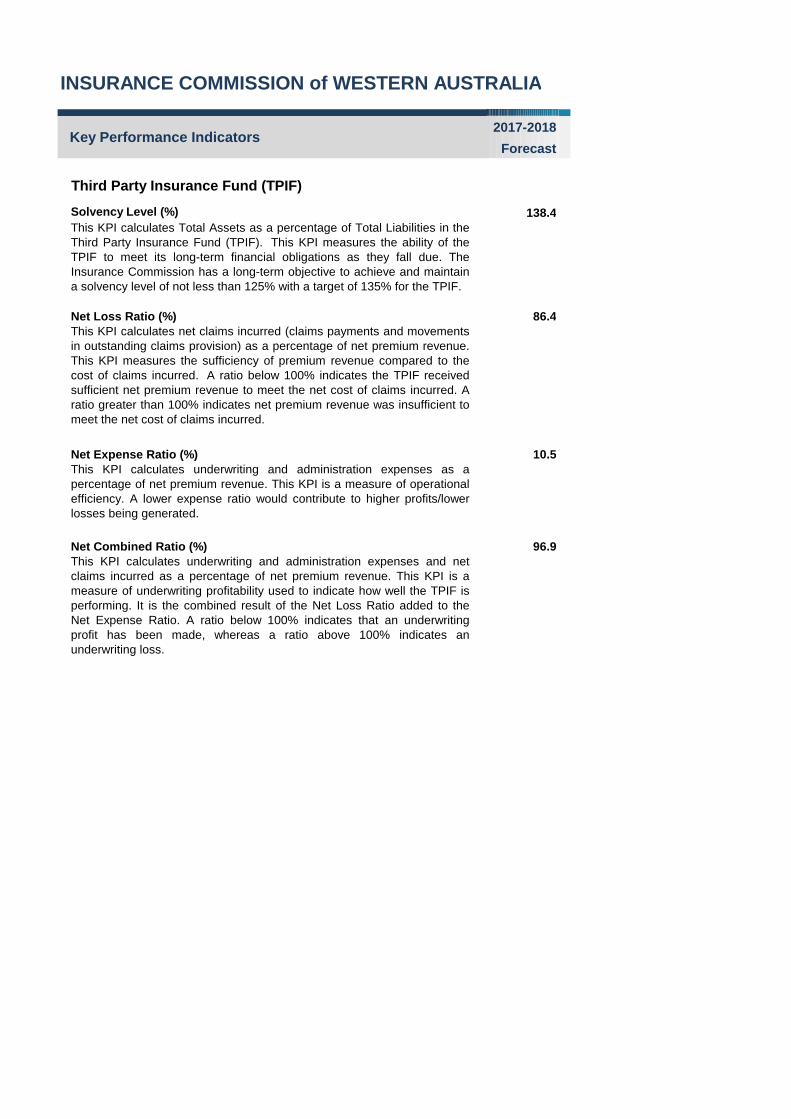
Third Party Insurance Fund (TPIF)
Solvency Level (%) 138.4This KPI calculates Total Assets as a percentage of Total Liabilities in theThird Party Insurance Fund (TPIF). This KPI measures the ability of theTPIF to meet its long-term financial obligations as they fall due. TheInsurance Commission has a long-term objective to achieve and maintaina solvency level of not less than 125% with a target of 135% for the TPIF.
Net Loss Ratio (%) 86.4This KPI calculates net claims incurred (claims payments and movementsin outstanding claims provision) as a percentage of net premium revenue.This KPI measures the sufficiency of premium revenue compared to thecost of claims incurred. A ratio below 100% indicates the TPIF receivedsufficient net premium revenue to meet the net cost of claims incurred. Aratio greater than 100% indicates net premium revenue was insufficient tomeet the net cost of claims incurred.
Net Expense Ratio (%) 10.5This KPI calculates underwriting and administration expenses as apercentage of net premium revenue. This KPI is a measure of operationalefficiency. A lower expense ratio would contribute to higher profits/lowerlosses being generated.
Net Combined Ratio (%) 96.9This KPI calculates underwriting and administration expenses and netclaims incurred as a percentage of net premium revenue. This KPI is ameasure of underwriting profitability used to indicate how well the TPIF isperforming. It is the combined result of the Net Loss Ratio added to theNet Expense Ratio. A ratio below 100% indicates that an underwritingprofit has been made, whereas a ratio above 100% indicates anunderwriting loss.

INSURANCE COMMISSION of WESTERN AUSTRALIA
2017-2018
ForecastKey Performance Indicators
Motor Vehicle Catastrophic Injuries Fund(MVCIF)
Solvency Level (%) 114.5This KPI calculates Total Assets as a percentage of Total Liabilities in theMotor Vehicle (Catastrophic Injuries) Fund (MVCIF). This KPI measuresthe ability of MVCIF to meet its long-term financial obligations as they falldue.
Net Loss Ratio (%) 95.0This KPI calculates net claims incurred (claims payments and movementsin outstanding claims provision) as a percentage of net premium revenue.This KPI measures the sufficiency of premium revenue compared to thecost of claims incurred. A ratio below 100% indicates the MVCIF receivedsufficient net premium revenue to meet the net cost of claims incurred. Aratio greater than 100% indicates net premium revenue was insufficient tomeet the net cost of claims incurred.
Net Expense Ratio (%) 5.5This KPI calculates underwriting and administration expenses as apercentage of net premium revenue. This KPI is a measure of operationalefficiency. A lower expense ratio would contribute to higher profits/lowerlosses being generated.
Net Combined Ratio (%) 100.5This KPI calculates underwriting and administration expenses and netclaims incurred as a percentage of net premium revenue. This KPI is ameasure of underwriting profitability used to indicate how well the MVCIFis performing. It is the combined result of the Net Loss Ratio added to theNet Expense Ratio. A ratio below 100% indicates that an underwritingprofit has been made, whereas a ratio above 100% indicates anunderwriting loss.

RISKCOVER$'000
STATEMENT OF FINANCIAL POSITION 2017-2018
CURRENT ASSETSCash and Cash Equivalents 2 Receivables 10,057 Financial Assets at Fair Value 1,086,556 Total Current Assets 1,096,615
NON-CURRENT ASSETSReceivables 16,968 Total Non-Current Assets 16,968
TOTAL ASSETS 1,113,583
CURRENT LIABILITIESPayables (146,250)Outstanding Claims Liability (207,079)Total Current Liabilities (353,329)
NON-CURRENT LIABILITIESOutstanding Claims Liability (443,614)Total Non-Current Liabilities (443,614)
TOTAL LIABILITIES (796,943)
NET ASSETS 316,640
EQUITYRetained Earnings 300,976 Distribution of Equity (60,262)Prudential Reserve 75,926
TOTAL EQUITY 316,640
$'000
STATEMENT OF COMPREHENSIVE INCOME 2017-2018
Premium Revenue 301,427 Outwards Reinsurance Premium Expense (16,971)Outwards Reinsurance Commission Revenue 772 Net Premium Revenue 285,228
Claims Expense (268,676)Reinsurance and Other Recoveries Revenue 4,398 Net Claims Incurred (264,278)
Underwriting and Adminstration Expenses (34,110)
UNDERWRITING PROFIT/(LOSS) (13,160)
Net Investment Income 64,163
PROFIT 51,002

RISKCOVER
2017-2018
Forecast
Solvency Level (%) 139.7 This KPI calculates Total Assets as a percentage of Total Liabilities in theRiskCover Fund. This KPI measures the ability of the RiskCover Fund tomeet its long-term financial obligations as they fall due.
Net Loss Ratio (%) 92.7
This KPI calculates net claims incurred (claims payments and movements in outstanding claims provision) as a percentage of net premium revenue. This KPI measures the sufficiency of premium revenue compared to the cost of claims incurred. A ratio below 100% indicates RiskCover received sufficient net premium revenue to meet the net cost of claims incurred. A ratio greater than 100% indicates net premium revenue was insufficient to meet the net cost of claims incurred.
Net Expense Ratio (%) 12.0 This KPI calculates underwriting and administration expenses as apercentage of net premium revenue. This KPI is a measure of operationalefficiency. A lower expense ratio would indicate higher profits/lowerlosses being generated.
Net Combined Ratio (%) 104.7 This KPI calculates underwriting and administration expenses and netclaims incurred as a percentage of net premium revenue. This KPI is ameasure of underwriting profitability used to indicate how well the Fund isperforming. It is the combined result of the Net Loss Ratio added to theNet Expense Ratio. A ratio below 100% indicates that an underwritingprofit has been made, whereas a ratio above 100% indicates anunderwriting loss.
Key Performance Indicators