State Waste Discharge Permit Application
76
DOE/RL-94-32 Revision 0 UC-630,721 State Waste Discharge Permit Application Electrical Resistance Tomography Testing Date Published April 1994 Q UnitedStates Departmentof Energy P.O. Box550 Richland, Washington 99352 Approved for Public Release M_STE_ DISTRIBUTION OF ]HIS DOCUMENT IS UNLIMITED
Transcript of State Waste Discharge Permit Application
DOE/RL-94-32Revision 0
UC-630,721
State Waste Discharge PermitApplicationElectrical Resistance Tomography Testing
DatePublished
April 1994
Q UnitedStatesDepartmentofEnergyP.O.Box550Richland,Washington99352
Approved for Public Release M_STE_
DISTRIBUTION OF ]HIS DOCUMENT IS UNLIMITED
TRADEMARKDISCLAIMER
Referencehereinto anyspecificcommercialproduct,process,or serviceby tradename,trademark,manLafacturer,orotherwise,doesnotnecessarilyconstituteor implyitsendorsement,recommendation,or favoringbythe UnitedStatesGovernmentorany agencythereofor its contractorsorsubcontractors.
Thisreporthasbeenreproducedfromthebestavailablecopy.Availableinpapercopyandmicrofiche.
Availableto theU.S, Departmentof EnergyanditscontractorsfromOffice of ScientificandTechnicalInformationP.O. Box62OakRidge,TN 37831(615) 576-8401
Availableto thepublicfromtheU.S. Departmentof CommerceNationalTechnicalInformationService5285 PortRoyalRoadSpringfield,VA22161(703) 487.4650
Printed in the UnitedStates of America
DISCLM-5.CHP(8-91)
DOE/RL-94-32,REV. 0O4/94
FOREWORD
This permit applicationdocumentationis for a State Waste Discharge Permitissued in accordancewith requirementsof WashingtonAdministrativeCode 173-216. The activity being permitted is a technology test usingelectrical resistance tomography.
The electrical resistancetomography technologywas developed at LawrenceLivermoreNational Laboratoryand has been used at other waste sites to trackundergroundcontaminationplumes. The electricalresistance tomographytechnologymeasures soil electrical resistancebetween two electrodes. If afluid contaminatedwith electrolytesis introduced into the soil, the soilresistance is expected to drop. By using an array of measurement electrodesin several boreholes, the areal extent of contaminationcan be estimated.
At the Hanford Site, the purpose of the testing is to determine if theelectrical resistance tomography technologycan be used in the vicinity oflarge undergroundmetal tanks without the metal tank interferingwith thetest. It is anticipatedthat the electrical resistancetomography technologywill provide a method for accuratelydetecting leaks from the bottom ofundergroundtanks, such as the Hanford Site single-shelltanks.
The electrical resistance tomographytesting will take place in the 200 EastArea, northwest of the inactive Semi-Works. The testing will use a partiallyconstructedmetal tank known as tank I05A. The tank will be fitted with asimulatedbottom and backfilled to function as a mock-up of an undergroundtank. A number of boreholes containingelectrode arrays will be placed aroundthe tank mock-up. The test will be performed in two phases. The electricalresistance tomography testingwill inject a maximum of 6,000 gallons of waterwith a tracer of 0.1 molar sodium chloride.This concentrationis equivalentto approximately7,000 milligrams per liter of sodium chloride. Vadose zonemodeling indicatedthat the chlorine concentrationwill be below thegroundwaterquality criteria in WashingtonAdministrativeCode 173-200-040bythe time the plume reaches the groundwater. In addition to the tracersolution, Hanford Site raw water may be used to simulate rainfall eventsduring the second phase of testing. The simulatedrainfall testingwillinclude the applicationof up to a maximum of 25,000 gallons of raw water tothe soil surface. The raw water is not included in the waste stream
informationin the permit application. Testing could includemockups ofundergroundpiping and cathodic protection systems. The purpose of theadditional componentswould be to test for possible interferencewith theelectrical resistance tomographymeasurements.
iii


DOE/RL-94-32,REV. 004/94
CONTENTS
Paqe No.
FOREWARD ................................ iii
CONTENTS ................................ v
GLOSSARY ................................ vii
1.0 PERMIT APPLICATION ........................ i-i
2.0 REFERENCES ............................ 2-I
APPENDICES
A LOCATION MAPS ............................ A-i
B PRODUCT INFORMATION ......................... B-i
C SITE ASSESSMENT ........................... C-i
DOE/RL-94-32,REV. 004/94
This page intentionallyleft blank.
vi

C"_ _"_.---_ C'_ r-- --Io ::::1--,rrl rrl
o
,.<
DOE/RL-94-32,REV. 004/94
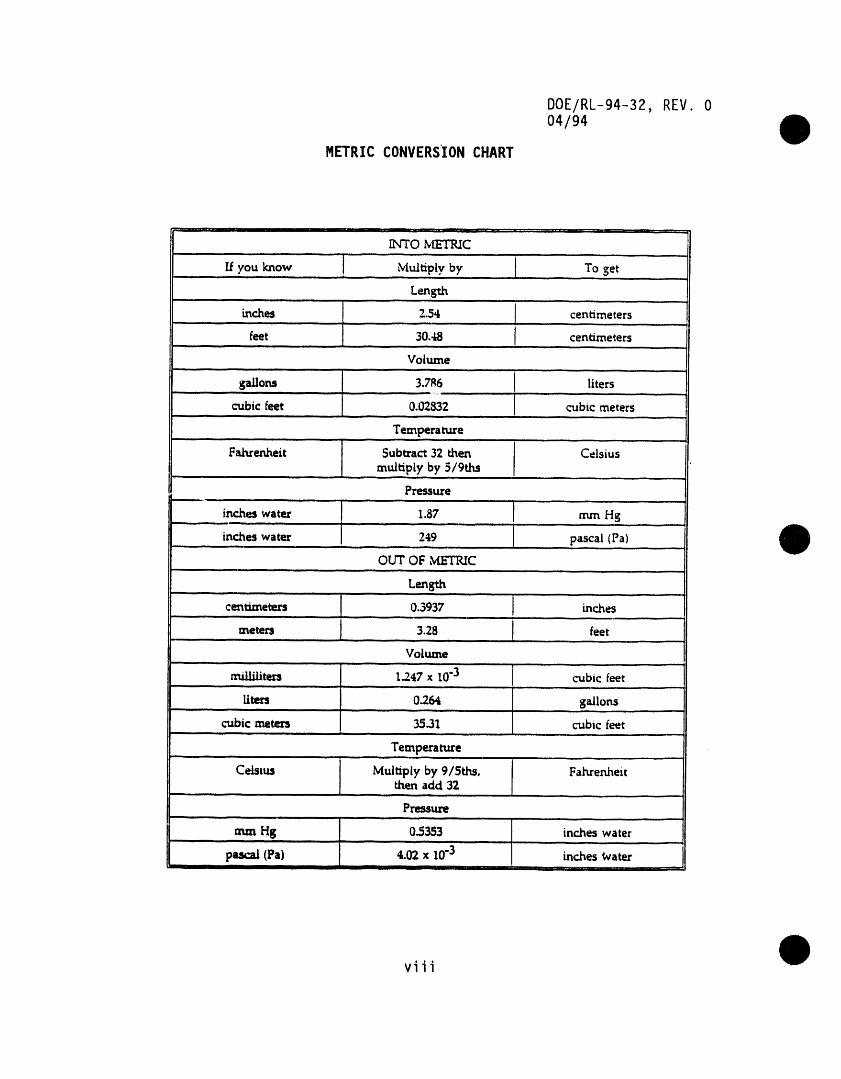
METRIC CONVERSION CHART
_,, ' I i ..... ,,,,'d i , i ' i ,
INTO _C
you know ! Multiplyby To getII
- ,,,, •
Length
inche_ 2.54 j centimetersl
feet 30.48 I centimeters,, ,,
Volume
b_/lons 3.786 J liters!
cubicfeet 0.02832 J cubicmeters
Temperature
Fahrenheit J Subtract32 then I CelsiusmuJtiply by 5/9ths
Pressure
inches water 1.87 mm Hg
inches water 249 pascal(Pa)
OUT OF ,'vI_FRIC
L_
centimeters 0.3937 J inches
meters 3.28 J feetVolume
milliliters 1_47 x 10.3 cubic feet
liters 0.264 gallons
cubic meten 35.31 cubic feet,,
Temperature
CeLsius J Multiply by 9/5ths, Fahrenheit
.... J then acid 32
Pressure
mm Hg 0.5353 incheswater
pascal (Pa) 4.02 x 10.3 inches WaterII I Ill il 'i ' ,,_o I '11 ,,
viii


O
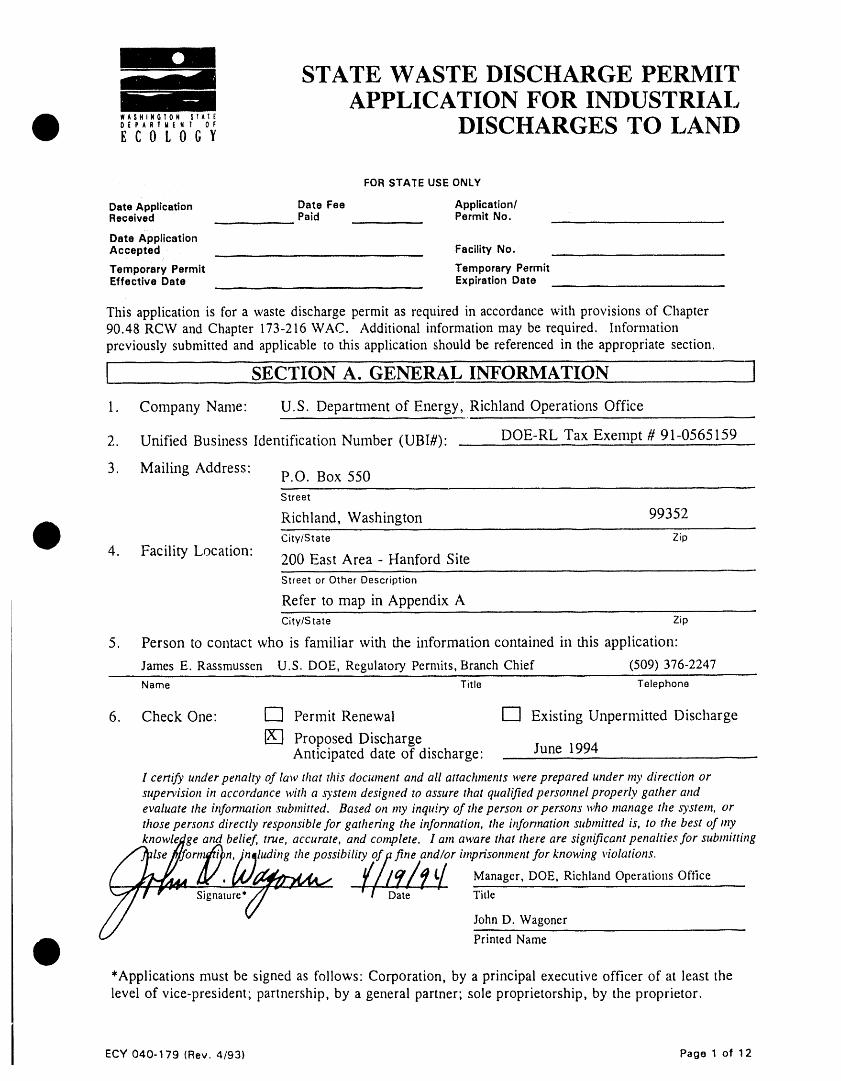
STATE WASTE DISCHARGE PERMITAPPLICATION FOR INDUSTRIAL
,,,,,o, DISCHARGES TO LANDECOLOGY
FORSTATE USE ONLY
Date Application Date Fee Application/Received Paid Permit No.
Date ApplicationAccepted , Facility No.
Temporary Permit Temporary PermitEffective Date Expiration Date
This application is for a waste discharge permit as required in accordance with provisions of Chapter90.48 RCW and Chapter 173-216WAC. Additional information may be required. Informationpreviously submitted and applicable to this application should be referenced in the appropriate section.
[ SECTION A. GENERAL INFORMATION ]
1. Company Name: U.S. Deparmlent of Energy, Richland Operations Office
2. Unified Business Identification Nuxnber (UBI#): DOE-RL Tax Exempt # 91-0565159
3. Mailing Address: P.O. Box 550Street
Richland, Washington 99352City/State Zip
4. Facility Location: 200 East Area - Hartford SiteStreet or Other Description
Refer to map in Appendix ACity/State Zip
5. Person to contact who is familiar with the information contained in this application:
James E. Rassmussen U.S. DOE, RegulatoryPermits,BranchChief (509) 376-2247Name Title Telephone
6. Check One: [_ Permit Renewal El Existing Unpermitted Discharge
[_ Proposed DischargeAnticipated date of discharge: June 1994
I certify under penalty of law that this document and all attachments were prepared under my direction or
supervision in accordance with a O'stem designed to assure that qualified personnel properly gather andevaluate the infonnation submitted. Based on my inquiry of the person or persons who manage the system, or
those persons directly responsible for gathering the information, the infonnation submitted is, to the best of myknowledge and belief, true, accurate, and complete. I atn aware that there are significant penalties for submitting
//_lse //forn_n. j,,qluding the possibility of p fine andor ipnprisonment for knowing violations.
_7_ Ate'- _/'Signature*//'_g ""(,/_ ' [- " f /¢//q/_'IDate __TitleManager'DOE'RichlandOperati°nsOffice
// John D. Wagoner
*Applications must be signed as follows" Corporation, by a principal executive officer of at least thelevel of vice-president; partnership, by a general partner; sole proprietorship, by the proprietor.
ECY 040-179 (Rev. 4/93) Page 1 of 12
Facility: Electrical Resistance DOE/RL-94-32, REV. 0Tomography Testing 04/94
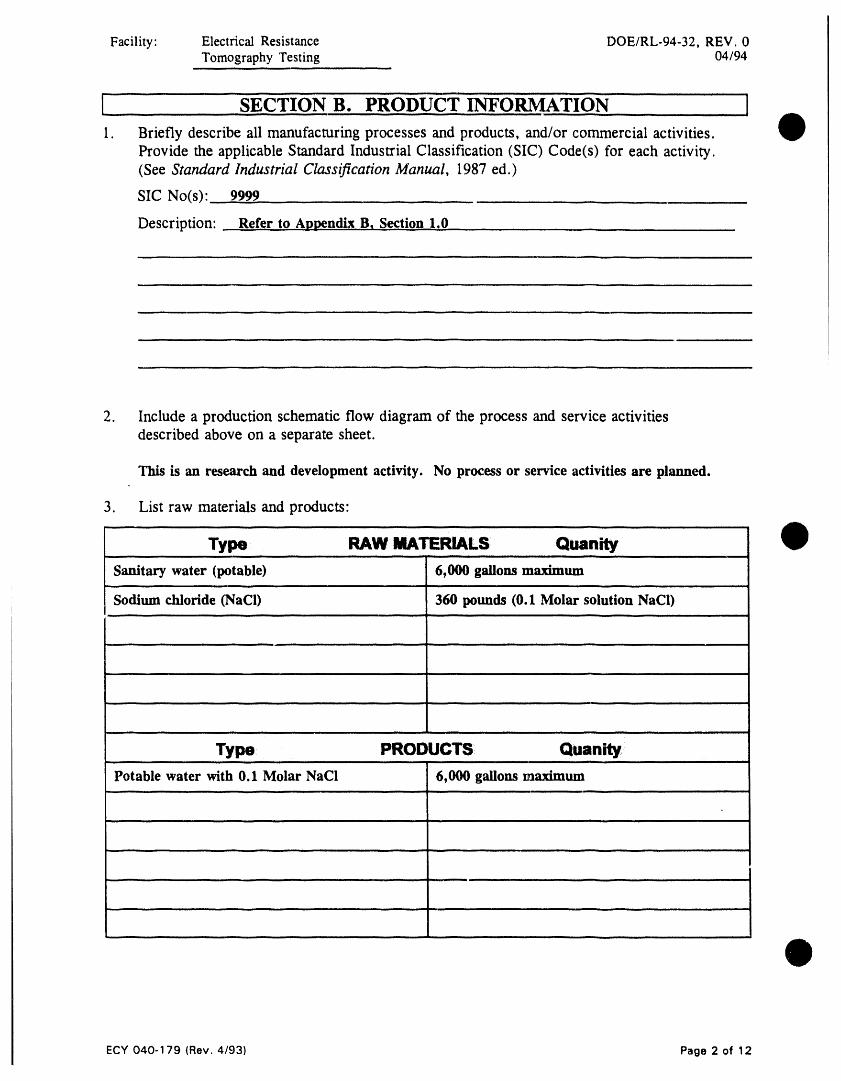
SECTION B. PRODUCT INFORMATION
1. Briefly describe all manufacturing processes and products, and/or commercial activities.
Provide the applicable Standard Industrial Classification (SIC) Code(s) for each activity.(See Standard Industrial Classification Manual, 1987 ed.)
SIC No(s): 9999
Description: Refer to Appendix B, Section 1.0
2. Include a production schematic flow diagram of the process and service activities
described above on a separate sheet.
This is an research and development activity. No process or service activities are planned.
3. List raw materials and products:
Type RAW MATERIALS Quanity
Sanitary water (potable) 6,000 gallons maximum
Sodium chloride (NaCI) 360 pounds (0.1 Molar solution NaCl)
Type PRODUCTS Quanity
Potable water with 0.1 Molar NaCI 6,000 gallons maximum
ECY 040-179 (Rev. 4/93) Page 2 of 12
Facility: Electrical Resistance DOE/RL-94-32, REV. 0Tomography Testing 04/94
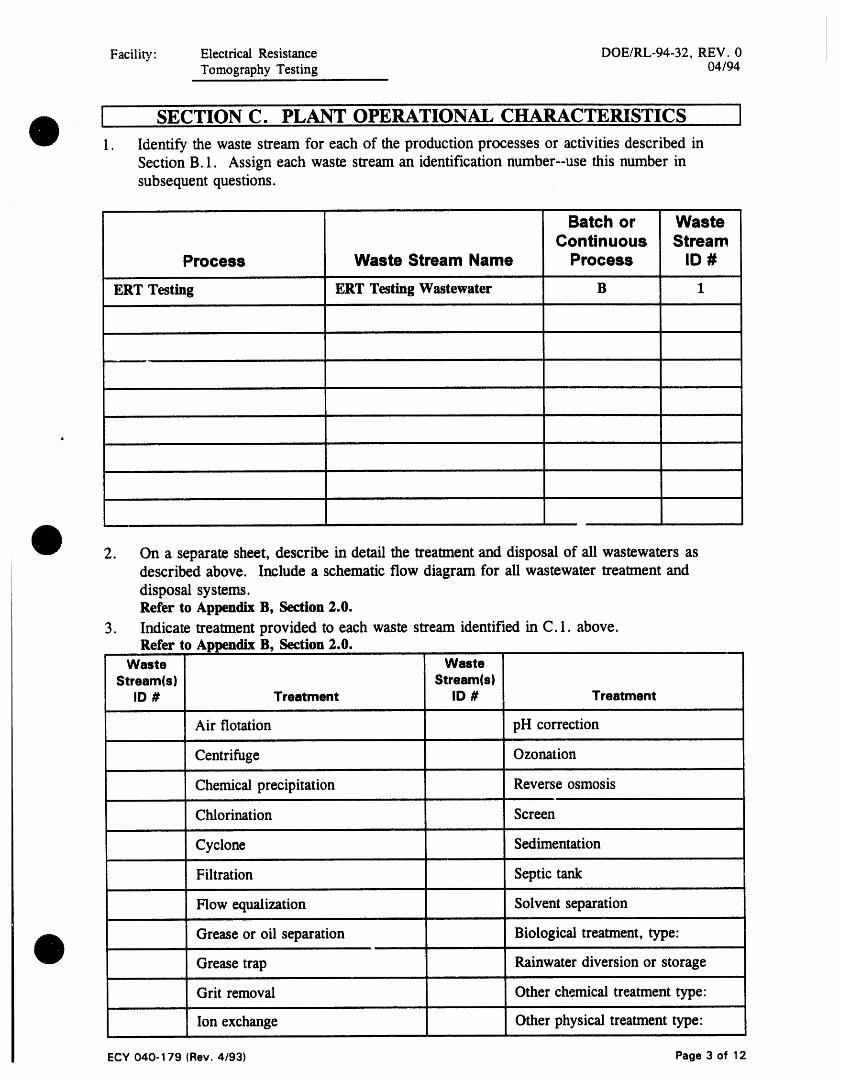
SECTION C. PLANT OPERATIONAL CHARACTERISTICS ]
1. Identify the waste stream for each of the production processes or activities described inSection B. 1. Assign each waste stream an identification number--use this number in
subsequent questions.
Batch or WasteContinuous Stream
Process Waste Stream Name Process ID #
ERT Testing ERT Testing Wastewater B 1
2. On a separate sheet, describe in detail the treatment and disposal of all wastewaters asdescribed above. Include a schematic flow diagram for all wastewater treatment and
disposal systems.Refer to Appendix B, Section 2.0.
3. Indicate treatment provided to each waste stream identified in C. 1. above.Refer to Appendix B, Section 2.0.
Waste WasteStream(s) Stream(s)
ID # Treatment ID # Treatment
Air flotation pH correction
Centrifuge Ozonation
Chemical precipitation Reverse osmosis
Chlorination Screen
Cyclone Sedimentation
Filtration Septic tank
Flow equalization Solvent separation
Grease or oil separation Biological treatment, type:
Grease trap Rainwater diversion or storage
Grit removal Other chemical treatment type:
Ion exchange Other physical treatment type:
ECY 040-179 (Rev. 4/93) Page 3 of 12

Facility" Electrical Resistance DOE/RL-94-32,REV. 0TomographyTesting 04/94
4. Describe any planned wastewater treatment improvements or changes in wastewaterdisposal methods and when they will occur (use additional sheets, if necessary).
None.
5. If production processes are subject to seasonal variations, provide the followinginformation. List discharge for each waste stream in gallons per day (GPD). Thecombined value for each month should equal the estimated total monthly flow.
Waste Smmm MONTHSi
ID # J F M A M J J A S O N D
,, ii
, , i i ,.
,,
The productionprocessis not subjectto seasonalvariationsii
,,,,
ii i
i ,,,
EstbaamdTotlllmmeWFlow(GPO)
6. Shift Information:
a. Number of shifts per work day: 1
b. Number of work days per week: 7
c. Average number of work days per year: 250
d. Maximum number of work days per year: 365
e. Number of employees per shift: Shift start times1st 10 1st 07:002nd 2nd3rd 3rd
7. List all incidental materials like oil, paint, grease, solvents, soaps, cleaners, that areused or stored on-site. (Use additional sheets, if necessary.)
Material/Quantity Stored Sodium chloride / < 400 pounds
Poly vinyl choride 0PVC) clue / < 1 gallon
PVC surface preparation / < 1 gallon
ECY040-179(Rev.4/93) Page4 of 12

Facility: Electrical Resistance DOE/RL-94-32,REV. 0TomographyTesting 04/94
8. Describe any water recycling or material reclaiming processes:
There are no water recyclingor material reclaimine processes.
9. Does _is facility have:a. Spill Prevention, Control, and Countermeasure Plan
(per 40 CFR 112)? ['-] Yes [Xrl No
b. Emergency Response Plan (per WAC 173-303-350)? D Yes IX'] No
c. Runoff, spillage, or leak control plan (per WAC 173-216-110(t"))?1"-]Yes [Xrl No
d. Does your current waste discharge permit require a spill plan? F"] Yes I'g] NoIf yes, submit an update with your application. Not Applicable.
e. Solid Waste Management Plan? [-'] Yes IX] No
l SECTION D. WATER CONSUMFFION AND WATER LOSS ]
1. Water Source(s):
I"] Public System (Specify)
I"'1 Private Well _ Surface Water
a. Water Right Permit Number: Not Applicable.
b. Legal Description:
SW 1/4S, SW 1/4S, 2 Section, 13N TWN, 25E R
2. a. Indicate total water use: Gallons per day (average) Phase I: 200-400/11:40
Gallons per day (Maximum) 400 god
b. Is water metered? !"'! Yes _ No
3. Attach a line drawing showing the water flow through the facility. Indicate source ofintake water, operations contributing wastewater to the effluent, and treatment unitslabeled to correspond to the more detailed descriptions in Item C. Construct a waterbalance on the line drawing by showing average flows between intakes, operations,treatment units, and outfaUs. If a water balance cannot be determined (e.g., for certainmining activities), provide a pictorial description of the nature and amount of anysources of water and any collection or treatment measures.Refer to Appendix B, Section 3.0.
ECY040-179(Rev.4/93) Page5 of 12

Facility: Electrical Resistance DOE/RL-94-32, REV. 0Tomography Testing 04/94
I SECTION E. WASTEWATER INFORMATION
1. Provide measurements for treated wastewater prior to land application for the
parameters listed below, unless waived by the permitting authority. All analytical methods
used to meet these requirements shall, unless approved otherwise in writing
by Ecology, conform to the Guidelines Establishing Test Procedures for the Analysis ofPollutants Contained in 40 CFR Part 136.
Refer to Appendix B, Section 2.0.
Concentrations Analyucal DetectionParameter Measured Method Limit
pHi
Conductivity_,
Total Dissolved Solids
Total Suspended Solidsi
BOD (5 day)
COD
Ammonia-N
TKN-Ni
Nitrate-N
Ortho-phosphate-P
Total-phosphate-P
Total Oil & Grease
Calcium
Magnesium
Sodium
Potassiumi
Chloride
Sulfate
Fluoride
Cadmium (total)
Chromium (total)
Lead (total)
Mercury
Selenium (total)
Silver (total)
Copper (total)
Iron (total)
Manganese (total)
Zinc (total)
Barium (total)
Total Coliform.......
ECY 040-179 (Rev. 4/93) Page 6 of 12

Facility: Electrical Resistance DOE/RL-94-32, REV. 0Tomography Testing 04/94
2. Wastewater:characteristics for toxic pollutants.
The intent of this question is to detelmine which chemicals are or might be present inthe process water or wastewater. For each chemical listed below:
a. Use the letter A in the Absent column if the chemical is not likely to be presentbecause it is not used in the production process or used on site.
b. Use the letter S in the Absent column if the chemical may be present because it isused on site, but the chemical is not used in the production process.
c. Use the letter P in the Present column if the chemical is likely to be present because it
is used in the production process, but the effluent has not been tested.
d. Use the letter K in the Present column if the effluent has been tested and the chemical was
found to be present. Attach the analytical results.
Attachtheanalyticalres_.ImAnal_/ticaI,, ResultsWastewater Characterization for Toxic Pollutants
Absent I Present Cons//tumt/CAS No. Absent I Present Constituen#CAS No.
A Acrylamide/79-06-1 A 1,2 Dichloropropane/78-87-5
A Acrylonitrile/107-13-1 A 1,3 Dichloropropene/542-75-6
A Aldrin/309-O0-2 A Dichlorvos/62-73-7
A Aniline/62-53-3 A Dieldrin/60-57-1
A Aramite/140-57-8 A 3,3' Dimethoxybenzidine/119-90-4
A Arsenic/7440-38-2 A 3,3 Dimethylbenzidine/119-93-7
A Azobenzene/103-33-3 A 1,2 Dimethylhydrazine/540-73-8
A Benzene/71-43-2 A 2,4 Dinitrotoluene/121 -14-2
A Benzidine/92-87-5 A 2,6 Dinitrotoluene/606-20-2
A Benzo(a)pyrene/50-32-8 A 1,4 Dioxane/123-91-1
A Benzotrichloride/98-07-7 A 1,2 Diphenylhydrazine/122-66-7
A Benzyl chloride/100-44-7 A Endrin/72-20-8
A Bis(chloroethyl)ether/111-44-4 A Epichlorohydrin/106-89-8
A Bis(chloromethyl)ether/542-88-1 A Ethyl acrylate/140-88-5
ABis(2-ethylhexyl)phthalate/ A117-81-7 Ethylenedibromide/106-93-4
A Bromodichloromethane/75-27-4 A Ethylenethioureae/96-45-7
A Bromoform/75-25-2 A Folpet/133-07-3
A Carbazole/86-74-8 A Furmecyclox/60568-05-0
A Carbon tetrachloride/56-23-5 A Heptachlor/76-44-8
A Chlordane/57-74-9 A Heptachlor epoxide/1024-57-3i
A Chlorodibromomethane/124-48-1 A Hexachlorobenzene/118-74-1
ECY040-179 (Rev.4/93) Page7 of 12

Facility' Electrical Resistance DOE/RL-94-32, REV. 0Tomography Testing 04/94
Absent / Present ConstituentJCAS No. Absent / Present ConstituentlCAS No.
A A Hexachlorocyclohexane (alpha)/Chloroform/67-66-3 319-84-6
A A Hexachlorocyclohexane (tach.)/Chlorthalonil/1 897-45-6 608-73-1
A A Hexachlorodibenzo-p-dioxin, mix/2,4-D/94-75-7 19408-74-3
A A Hydrazine/hydrazine sulfate/DDT/50-29-3 302-01-2
A Diallate/2303-1 6-4 A Lindane/58-89-9
A 1,2 Dibromoethane/106-93-4 A 2 Methylaniline/100-61-8
A A 2 Methylaniline hydrochlorida/1,4 Dichlorobenzene/106-46-7 636-21-5
A A 4,4' Methylene bis(N,N-3,3' Dichlorobenzidine/91-94-1 dimethyl)aniline/101-61-1
A A Methylene chloride1,1 Dichloroethane/75-34-3 (dichloromethane)/75-09-2
A 1,2 Dichloroethane/107-06-2 A _Mirex/2385-85-5
A Nitrofurazone/59-87-0 A O-phenylenediamine/106-50-3, ,i ,,
AA N-nitrosodiethanolamine/
1116-54-7 Propylene oxide/75-56-9
A A 2,3,7,8-Tetrachlorodibenzo-p-N-nitrosodiethylamine/55-18-5 dioxin/ 1746-01-6
A N-nitrosodimethylamine/62-75-9 A Tetrachloroethylene/127-18-4
A N-nitrosodiphenylamine/86-30-6 A 2,4 Toluenediamine/95-80-7
A N-nitroso-di-n-propylamine/ A621-64-7 o-Toluidine/95- 53-4
A N-nitrosopyrrolidine/930-55-2 A Toxaphene/8001-35-2
A N-nitroso-di-n-butylamine/ A924-16-3 Trichloroethylene/79-01-6
A N-nitroso-n-methylethylamine/ A10595-95-6 2,4,6-Trichlorophenol/88-06-2
A PAH/NA A Trimethyl phosphate/51 2-56-1
A PBBs/NA A Vinyl chloride/75-01-4
A PCBs/1 336-36-3
ECY040-179 (Rev. 4/93) Page8 of 12

Facility: Electrical Resistance DOE/RL-94-32,REV. 0TomographyTesting 04/94
!
SECTION F. STORMWATER I
1. Do you have a Washington State Storm Water Baseline I"7 Yes _ NoGeneral Permit?
If yes, please list the permit number here
2. Have you applied for a Washington State Storm Water 1"7 Yes _ NoBaseline General Permit'?
3. Do you have any storm water quality or quantity data? I-'! Yes I'_ No
Note: If you answered "yes" to questions 1 or 2 above, skip questions 4 through 8.
4. Describe the size of the storm water collection area.
a. Unpaved Area II sq. ft.
b. Paved Area 0 sq. ft.
c. Other Collection Areas (Roofs) fl sq. ft.
5. Does your facility's storm water discharge to: (check all that apply)
I"1 Storm sewer systems; name of storm sewer system (operator):
['i Directly to surface waters or Washington State (e.g., river, lake, creek, estuary, ocean).
1"] Indirectly to surface waters of Washington State (i.e., flows over adjacent properties first).
I'] Directly to ground waters of Washington State: I-'] dry well I"'! drainfield !_ Other
6. Areas with industrial activities at facility: (check all that apply) None.
I"'] Manufacturing Building
['] Material Handling
I-1 Material Storage
I"7 Hazardous Waste Treatment, Storage, or Disposal (Refers to RCRA, Subtitle C FacilitiesOnly)
I-'l Waste Treatment, Storage, or Disposal
1"7 Application or Disposal of Wastewaters
1"! Storage and Maintenance of Material Handling Equipment
["1 Vehicle Maintenance
1"] Areas Where Significant Materials Remain
!"1 Access Roads and Rail Lines for Shipping and Receiving
_-I Other Research and develooment testing
ECY 040-179 (Rev. 4/93) Page 9 of 12

Facility: Electrical Resistance DOE/RL-94-32,REV, 0TomographyTesting 04/94
7. Material handling/management practices.
a. Types of materials handled and/or stored outdoors: (check all that apply)
["'! Solvents I"-] Hazardous Wastes
1"7 Scrap Metal [-'] Acids or Alkalies
I-'1 Petroleum or Petrochemical Products ["'l Paints/Coatings
[_ Plating Products [_ Woodtreating Products
!"'I Pesticides _ Other (Please list) Sodium chloride
b. Identify existing management practices employed to reduce pollutants in industrialstorm water discharges: (check all that apply)
I-7 Oil/Water Separator [_ Detention Facilities
I"'] Containment I"] Infiltration Basins
l'] Spill Prevention l'l Operational BMPs
["] Surface Leachate Collection I'i Vegetation Management
I"'1 Overhead Coverage I"-1 Other (Please list)
8. Attach a map showing storm water drainage/collection areas, disposal areas anddischarge points. No drainage or collection areas.
I SECTION G. OTHER INFORMATION [1. Describe liquid wastes or sludges being generated that are not disposed of in the waste
_tream(s) and how they are disposed of. For each type of waste, provide type of waste,name, address, and phone number of hauler.No liquid wastes or sludges are beinu 2enerated.
2. Describe storage areas for raw materials, products, and wastes.The sanitary water (potable),will be stored in portable tanks.
Other materials will be stored in portable stora2e units at the site. ....
3. Have you designated your wastes according to the proceduresof Dangerous Waste RegulatiorLs, Chapter 173-303-WAC? I'_ Yes !"'1 No
ECY 040-179 (Rev. 4/93) Page 10 of 12
Facility: Electrical Resistance DOE/RL-94-32, REV. 0Tomography Testing 04/94
SECTION H. SITE ASSESSMENT ]
1. Give the legal description of the land treatment site(s). Give the acreage of each landtreatment site(s). Attach a copy of the contract(s) authorizing use of land for treatment.The ERT testing does not include land treatment. The ERT site is located in the
NW 1/4, NW 1/4, Section 2, T12N, R26E, Benton County, Washington
2. List all environmental control permits or approvals needed for this project; for example,
septic tank permits, sludge application permits, or air emissions permits.
The ERT test qualifies for a National Environmental Policy Act (NEPA) Categorical Exclusion
(CX). The CX is currently under preparation and will be submitted May 1994.
A State Environmental Policy Act Checklist is currently under preparation and ss_ll be submitted
May 1994.
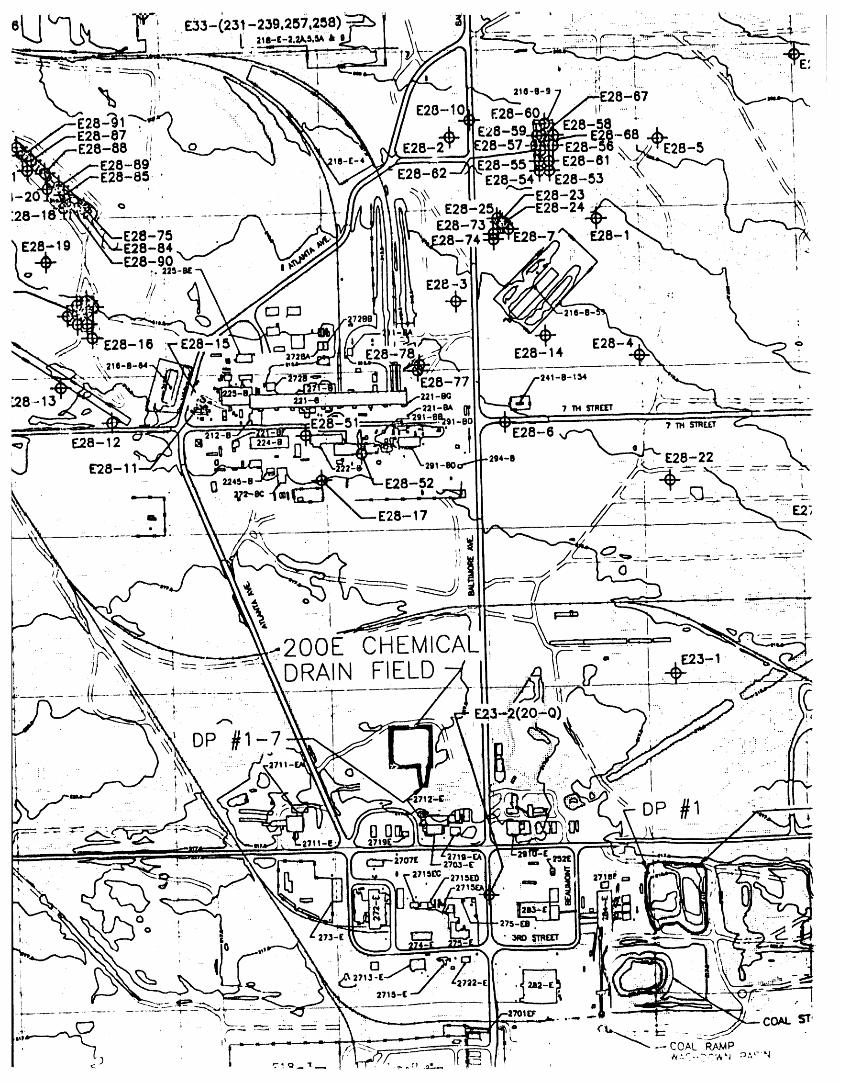
3. Attach a United States Geological Survey (USGS) a topographic map. Show the
following on this map:Refer to Appendix A.
a. Location and name of internal and adjacent streets
b. Surface water drainage systems within 1/4 mile of the sitec. All wells within 1 mile of the site
d. Chemical and product handling and storage facilities
e. Infiltration sources, such as drainfields and lagoons within 1/4 mile of the site
f. Wastewater and cooling water discharge points with waste stream ID numbers
(See Section C. 1)
g. Other activities and land uses within 1/4 mile of the site
4. Attach well logs and well I.D.# when available for all wells within 500 feet and anyavailable water quality data.Refer to Appendix C, Section 1.0.
ECY 040-179 (Rev. 4/93) Page 11 of 12
Facility: Electrical Resistance DOE/RL-94-32, REV. 0Tomography Testing 04/94
5. Describe soils on the site using information from local soil survey reports.
(Submit on separate sheet.)
Refer to Appendix C, Section 2.0.
6. Describe the regional geology and hydrogeology within one mile of the site. (Submit on
separate sheet.)
Refer to Appendix C, Section 3.0.
7. List the names and addresses of contractors or consultants who provided information and
cite sources of information by title and author.
Information for this permit application was obtained from the references listed in section 2.0(References), and from interviews _qth cognizant personnel for the Electrical ResistanceTomography Testing project. The permit application was compiled by:
Westinghouse Hanford CompanyAir & Water Permits Function
P.O. Box 1970Richland, WA 99352
ECY 040-179 (Rev. 4/93) Page 12 of 12

DOE/RL-94-32,REV 004/94
2.0 REFERENCESI
Baker, V.R., B.N. Bjornstad, A.J. Busacca, K.R. Fecht, E.P. Kiver, U.L. Moddy,J.G. Rigby, D.F. Stradling, and A.M. Tallman, 1991, "QuaternaryGeologyof the Columbia Plateau", in Quaternary Nonglacial Geology; ConterminousU.S., R.B. Morrison, Editor, Geology of North America, GeologicalSociety of America, vol. K-2, Boulder, Colorado.
Delaney, C.D., K.A. Lindsey, and S.P. Reidel, 1991, Geology and Hydrology ofthe Hanford Site: A StandardizedText for Use in WestinghouseHanfordCompany Documents and Reports, WHC-SD-ER-TI-O03,WestinghouseHanfordCompany, Richland, Washington.
DOE, 1988, Site CharacterizationPlan, Reference Repository Location,HanfordSite, Washington; ConsultationDraft, 9 Vols., DOE/RW-0164,U.S. Department of Energy, Office of Civilian RadioactiveWasteManagement, Washington,D.C.
DOE-RL, 1993, 200 East GroundwaterAggregateArea Management Study Report,DOE/RL-92-9,Rev. O, U.S. Department of Energy,Richland OperationsOffice, Richland,Washington.
Fecht, R.E., S.P. Reidel, and A.M. Tallman, 1987, Paleodrainageof theColumbia River System on the Columbia Plateau of Washington:A Summary,RHO-BW-SA-318P,Rockwell Hanford Operations,Richland, Washington.
Gaylord, D.R., and E.P. Poeter, 1991, Geology and Hydrology of the 300 Areaand Vicinity,HartfordSite, South-CentralWashington, WHC-EP-0500,WestinghouseHanford Company, Richland,Washington.
Gephart, R.E., R.C. Arnett, R.C. Baca, L.S. Leonhart,and F.A. Spane Jr.,1979, Hydrologic Studies Within the Columbia Plateau, Washington: An
. Integrationof Current Knowledge, RHO-BWI-ST-5,Rockwell HanfordOperations, Richland,Washington.
Hajek, B.F., 1966, Soil Survey: Hanford Project in Benton County, Washington,BWNL-243, Pacific Northwest Laboratory,Richland,Washington.
Hoffman, K.M., S.J. Trent, K.A. Lindsey, and B.N. Bjornstad, 1992, Summary ofthe Geology of the 200-BP-I Operable Unit, WHC-SD-EN-TI-037,Rev. O,WestinghouseHanford Company, Richland,Washington.
Kasza, G.L., M.J. Hartman, W.A. Jordan, D.C. Weekes, 1994, GroundwaterMap ofthe Hanford Site, June 1993, WestinghouseHanford Company, Richland,
Washington.
2-I

DOE/RL-94-32,REV 004/94
Last, G.V., B.N. Bjornstad,M.P. Bergeron, D.W. Wallace, D.R. Newcomer,J.A. Schramke,M.A. Chamness, C.S. Cline, S.P. Airhart, and J.S. Wilbur,1989, Hydrology of the 200 Areas Low-LevelBurial Grounds an InterimReport, PNL-6820, Pacific Northwest Laboratory,Richland,Washington.
Lindsey, K.A., 1991, Revised Stratigraphyfor the Ringold Formation, HanfordSite, South Central Washington,WHC-SD-EN-EE-O04,WestinghouseHanfordCompany, Richland, Washington.
Lindsey, K.A., M.P. Connelly,and B.N. Bjornstad, 1991, Geologic Setting ofthe 200 West Area: An Update, WHC-SD-EN-TI-O08,WestinghouseHanfordCompany, Richland,Washington.
Lindsey, K.A., B.N. Bjornstad,J.W. Lindberg, and K.M. Hoffman, 1992, GeologicSetting of the 200 East Area: An Update, WHC-SD-EN-TI-012,WestinghouseHanford Company, Richland,Washington.
PSPL, 1982, Skagit/HanfordNuclear Project, PreliminarySafety AnalysisReport, Volume 4, Appendix 20, Amendment 23, Puget Sound Power and LightCompany, Bellevue,Washington.
Reidel, S.P. and K.R. Fecht, 1981, "Wanapum and Saddle Mountain Basalt in theCold Creek SynclineArea", in Subsurface Geology of the Cold CreekSyncline, RHO-BWI-ST-14,Rockwell Hanford Operations,Richland,Washington.
Runchal,A.K. and B. Sager, 1992, PORFLOW: A Model for Fluid Flow, Heat andMass Transport in Multifluid,Multiphase Fractured or Porous Media,Users Manual, Version2.4, ACRi/IO6/Rev.G, Analytic and ComputationalResearch, Inc., Los Angeles, California.
Smith, G.A., B.N. Bjornstad, and K.R. Fecht, 1989, "NeogeneTerrestrial,_ SedimentationOn and Adjacent To the Columbia Plateau", in Volcanism and
Tectonism in the Columbia River Flood-BasaltProvince, Special Paper239, S.P. Reidel and P.R. Hopper, editors, Geological Society ofAmerica, Boulder, Colorado, pp. 187-198.
Tallman, A.M., K.R. Fecht, M.C. Marratt, and G.V. Last, 1979, Geology of theSeparationsAreas, Hanford Site, South Central Washington, RHO-ST-23,Rockwell Hanford Operations,Richland,Washington.
WHC, 1993, CharacterizationReport for the Table 4 MiscellaneousStreams inConsent Order No. DE 91NM-177,WHC-EN-EV-020,WestinghouseHanfordCompany, Richland,Washington.
2-2

DOE/RL-94-32,REV. 004/94
APPENDICES
LOCATION MAPS ........................... A-i
PRODUCT INFORMATION ........................ B-i
SITE ASSESSMENT .......................... C-i
APP-i
0

DOE/RL-94-32,REV. 004/94
APPENDIXA
LOCATIONMAPS
A-i

DOE/RL-94-32,REV. 0O4/94
CONTENTS
A-I Hanford Site Map Showing Electrical ResistanceTomography Test Site ............ A-FI
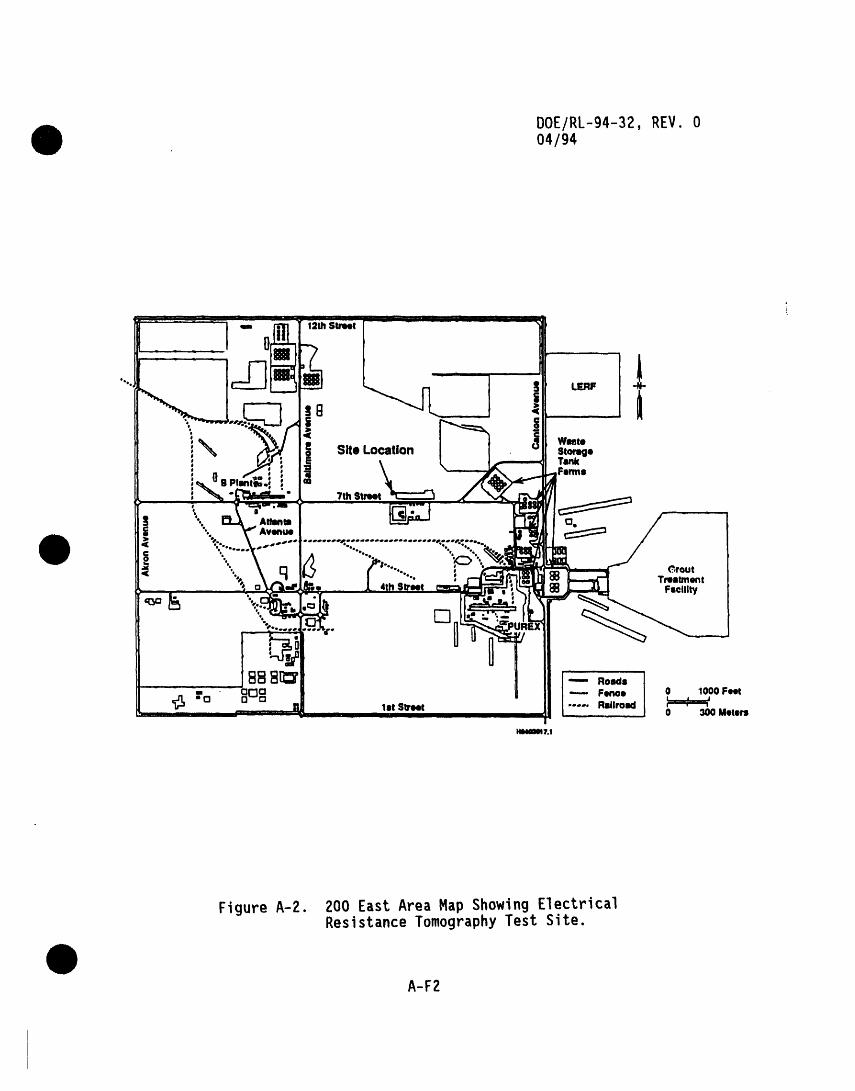
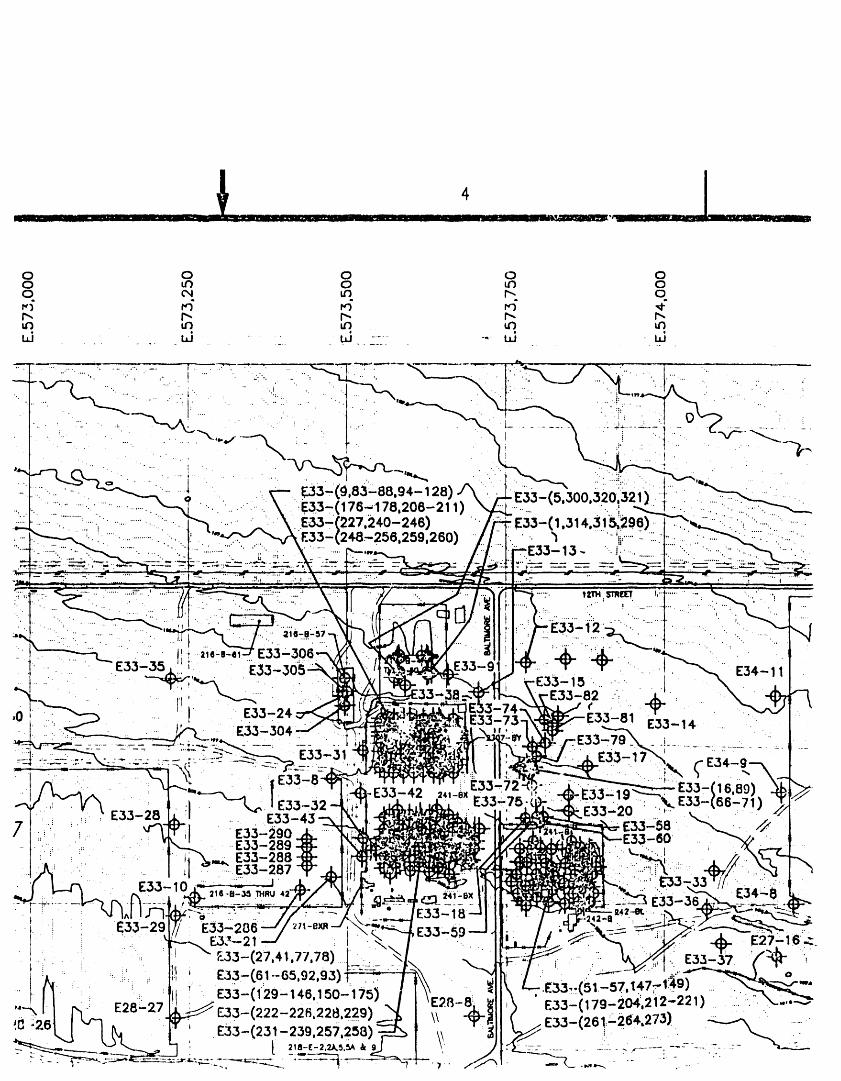
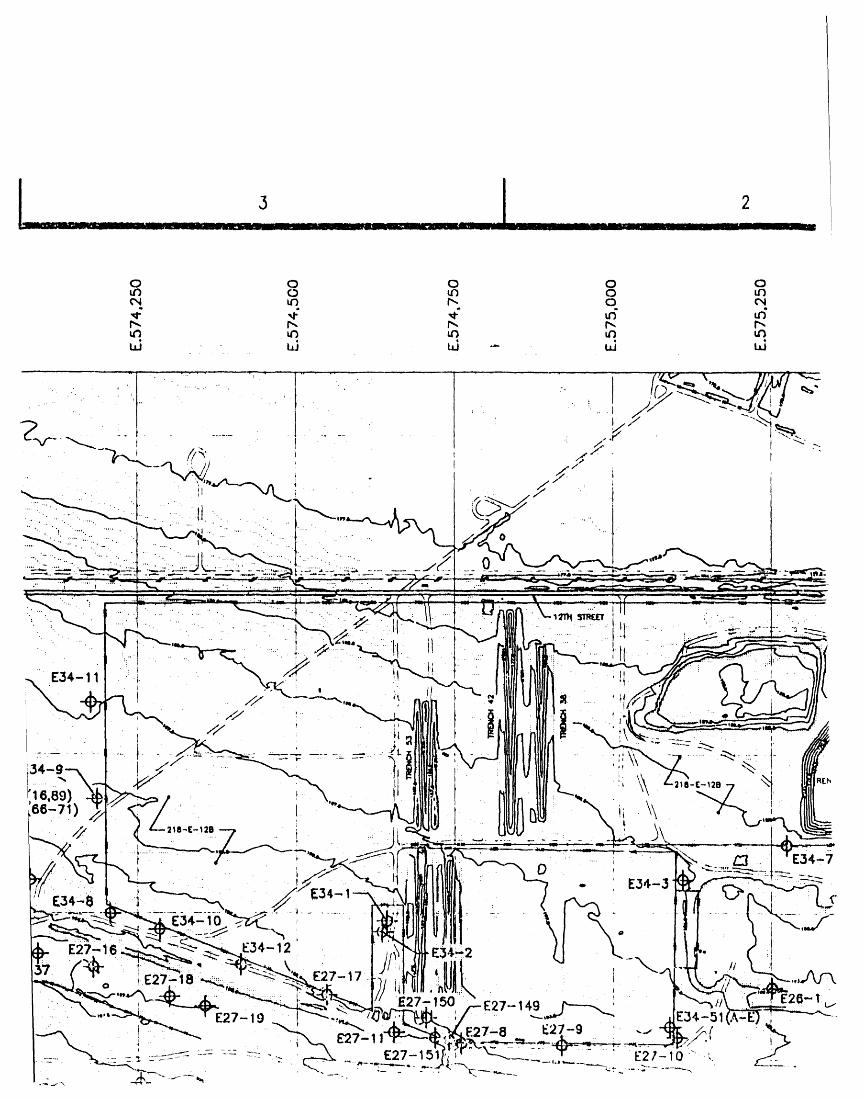
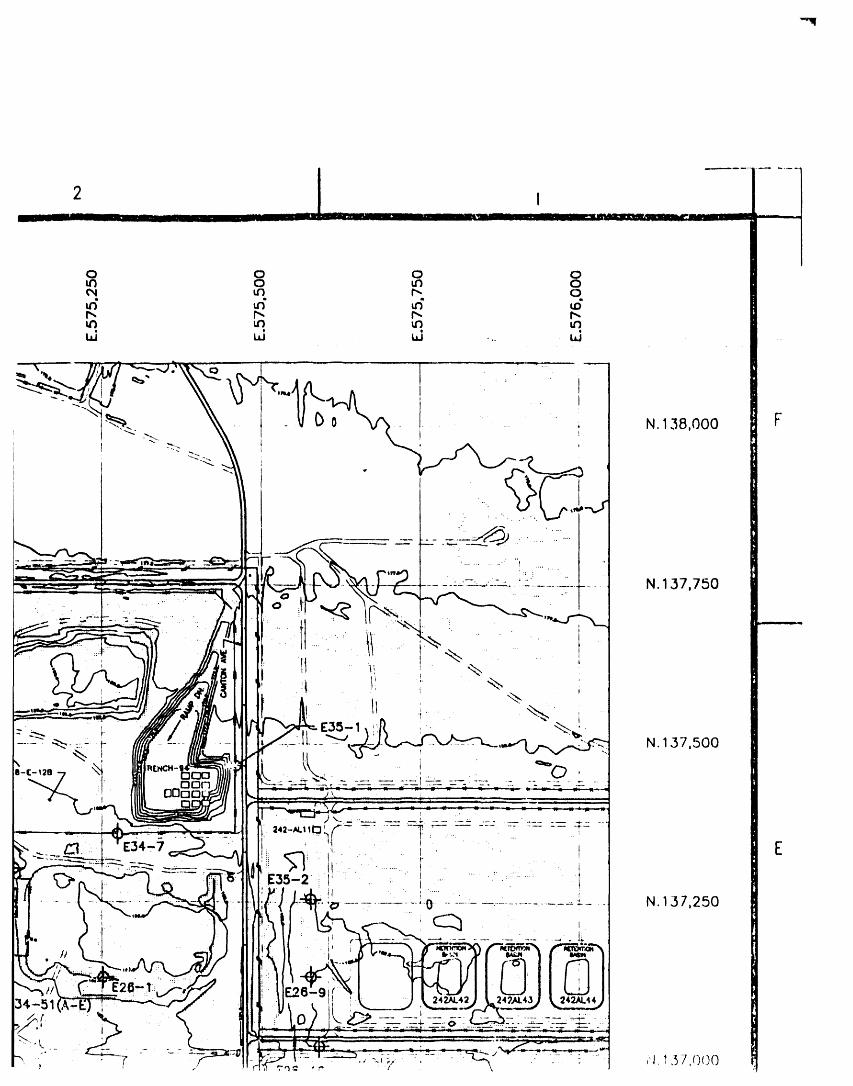
A-2 200 East Area Map Showing Ei_t_ic_i ResistanceTomography Test Site .................. A-F2
H-I -oooo4o omoG p yTesting (RevisionO) ..................... In pocket
TOPOGRAPHICMAPS
SECTION H., SITE ASSESSMENT,ITEM 3: ATTACH A UNITED STATES GEOLOGICAL SURVEY(USGS)TOPOGRAPHIC MAP. SHOW THE FOLLOWINGON THIS MAP:
a. LOCATION AND NAME OF INTERNALAND ADJACENT STREETSb. SURFACE WATER DRAINAGE SYSTEMS WITHIN I/4 MILE OF THE SITEc. ALL WELLS WITHIN I MILE OF THE SITEd. CHEMICAL AND PRODUCTHANDLING AND STORAGE FACILITIESe. INFILTRATIONSOURCES, SUCH AS DRAINFIELDSAND LAGOONS WITHIN I/4 MILE OF
THE SITEf. WASTEWATER AND COOLING WATER DISCHARGE pOINTS WITH WASTE STREAM ID NUMBERS
(SEE SECTION C.I)q. OTHER ACTIVITIES AND LAND USES WITHIN I/4 MILE OF THE SITE.
A topographicmap is included in Appendix A. The map is not a USGStopographicmap, but is derived from the Hanford Site topographicmapdatabase. The Hanford Site database providesmore detail and better accuracythan the USGS topographicmap. There are no known, active disposal areaswithin on quarter mile of the ERT test site.
A-ii

DOE/RL-94-32,REV. 0Waehlnglon 04/94Slalo
Seatlle Spokmn,
tlchlmnd
Portland
fllmlo 24
100 Damd
DR AroN !100 H
100 N Am
100 KW rand AKE Amain 100 F
100 B/C Aroe
N
SiteLocatlon
R_Io I IA
200Ymklmm EastBnfltamd, Area Area pl
\ |U.S, Eoology Wmmhlnglon
PublloWyo powa.'Ba,r0tmndo Supply
Symtom
400 Am
(FF'nF)
HimfordSltogoundawy :300 Arom
0 S MIIoaI Iv , AroaO S Kllomotoro
RlchlandAma
Figure A-I. Hanford Site Map Showing ElectricalResistance TomographyTest Site.
A-FI
DOE/RL-94-32,REV. 004/94
BBBI_ -- .o.,_E]C l "--- Fent:e 0 1000 Feet
rl:] u [, ' ' •11l Street ..... Rlilrotd 0 300 Meters
li4lul?.!
Figure A-2. 200 East Area Map Showing ElectricalResistance TomographyTest Site.
A-F2

" " WEST
1 2 3 4 5 6 7 l
PADDLES INDICAIE DII,_IRADIAL GRIDS f_I,PRE._t i
WIND .CLASS
_ _ . ....
....
E 5.... .---_ _ _1
,WlNI
5_1 .............. 6_ ............. I, ,, , ,,, ,..... .... :_
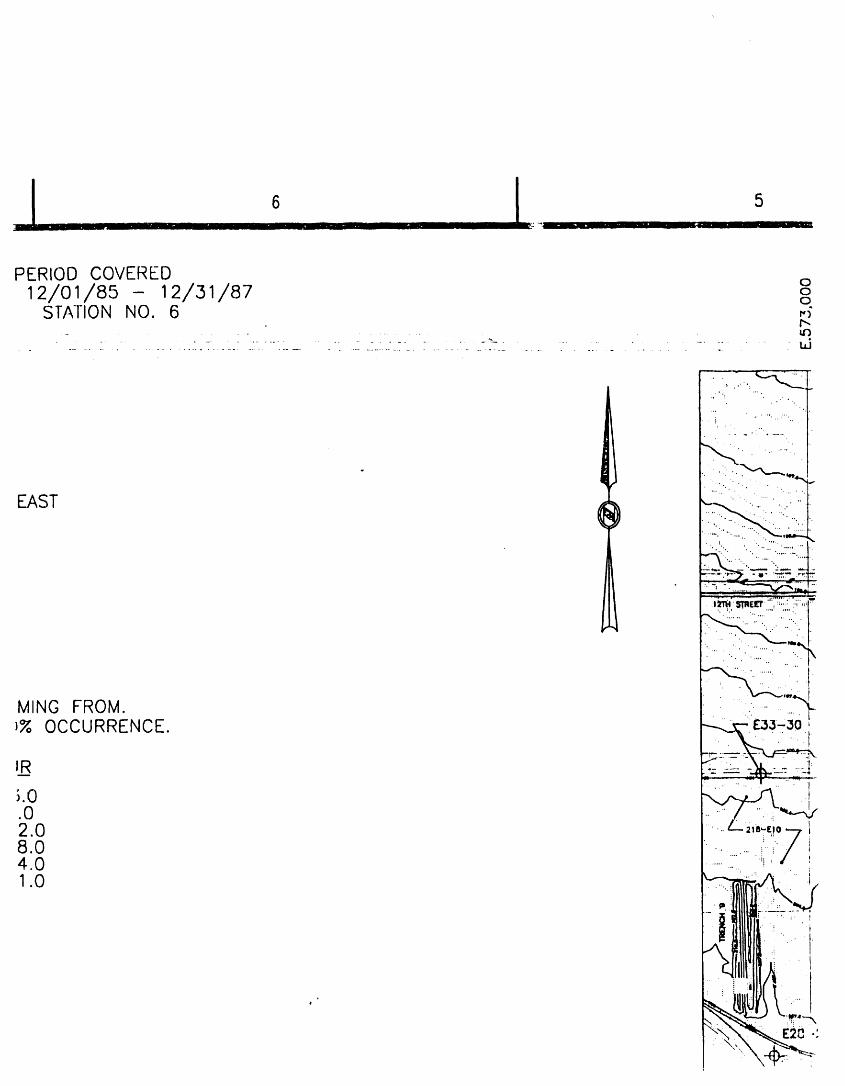
PERIOD COVERED o12/01/85 - 12/31/87 o0
STATIONNO. 6 ,,_r,,,
3 2
2 i

____ ,@
ooD/OR/
100N _[.._
100 KE
o BlCAREA
YAKIMABARRICAI)_
- ®[ROF
C
KEYSCALE
LEGw.47.ooo HANFORD PLANT COORDINATES,V.43.000 (FEET)E.57B,250 WASHINGTONSTATE COORDINATESN.13B,O00 (METERS)
---_,_._", INDEX CONTOUR(METERS)
.......,-." INTERMEDIATECONTOUR

H ARF.A 1
100 F AREA
ELECTRICALRESISTANCETOMOGRAHYTESTING
E2E2
300
ANNE
[_[_ BUILDINGS/STRUCTURESI_ & TOWERS
242-A BUILDING NUMBER
MOBILE OFFICES
E27-1_, 'NELL


KEY PSCALE: N
LEGENw.47.ooo HANFORD PLANT COORDINATES,v.#&ooo (FEET)
E.578,250 WASHINGTON STATE COORDINATESN.13e,ooo (METERS)
--.-,,,._'--"" INDEX CONTOUR (METERS)
..... INTERMEDIATE CONTOUR•:_::' , ;=...::.:".•, .,°_t.,. -"
IMPROVED ROAD
UNIMPROVED ROAD
" DIRT ROAD
SIDEWALKS\ PARKING LOTS
, , RAILROADS
= = SECURITY,WARNING,MISC FENCES
POST & CHAIN
...... (CRIB,BURIAL GROUND FENCES)
PERIMETER FENCES
GENERAL NOTES1. THIS MAP IS BASED ON AERIAL PHOTOGRAPHY FLOWN ON 6-24-89. THE ORIGINAL TOPOGRAPt
BY MERRICK & COMPANY AND CERTIFIED TO MEET NATIONAL MAP ACCURACY STANDARDS.OFFICIAL COPIES OF THE MERRICK MAPS THAT SHOW THE CERTIFICATE ARE LOCATED IN THE WENGINEERING FILES AS DRAWING NUMBERS H-2-79476 SHEET 1 AND H-2-79477 SHEET 1 TtNAMES OF ADDITIONAL FEATURES AND THE TITLE BLOCK WERE ADDED BY WESTINGHOUSE HANF<
2. WASHINGTON STATE PLANE COORDINATE SYSTEM: THE OFFICIAL COORDINATE SYSTEM AS DEFINEREVISED CODE OF WASHINGTON (RCW). THE HANFORD SITE LIES WITHIN THE WASHINGTON CO0SOUTH ZONE. THIS GRID COVERS THE ENTIRE SITE AND USES X (EASTINGS) AND Y (NORTHINC
HORIZONTAL DATUM: NAD-8,3 LAMBERT PROJECTION. WASHINGTON STATE PLANE COORDINATES ;
CONTOUR INTERVAL: 0.5 METERS.
.3. HANFORD PLANT GRID" A LOCAL GRID SYSTEM WITH ITS INITIAL POINT NORTHEAST OF THE 4 !COVERS 200 EAST AND 200 WEST AREA AS WELL AS GENERAL SITE WORK SUCH AS WELLS

_AN)NE
)
I_I[--__ &BUILDINGS/STRUCTURESTowERS
242-A BUILDING NUMBER
MOBILE OFFICES -..
E27-1
WELL
,,.j 0 TANKS
216-A-42 CRIB ,,t
218-E-10 BURIAL GROUND
DP DISCHARGEPOINT
SITE PLANSCALE: 1:6000
_IC MAP WAS PREPARED 0 60 120 240 ,360 480
--L ! l-STINGHOUSE4RU ,37. I cm = 60 meters:)RDCOMPANY.
0 400 600 800 1200 1600 2000 FEE"
I :D BY THE I I= [ 1 I _- I ' IRDINATE SYSTEM,',S)COORDINATES.
_,RESHOWN IN METERS.
O0 AREA. IT'4D BURIAL
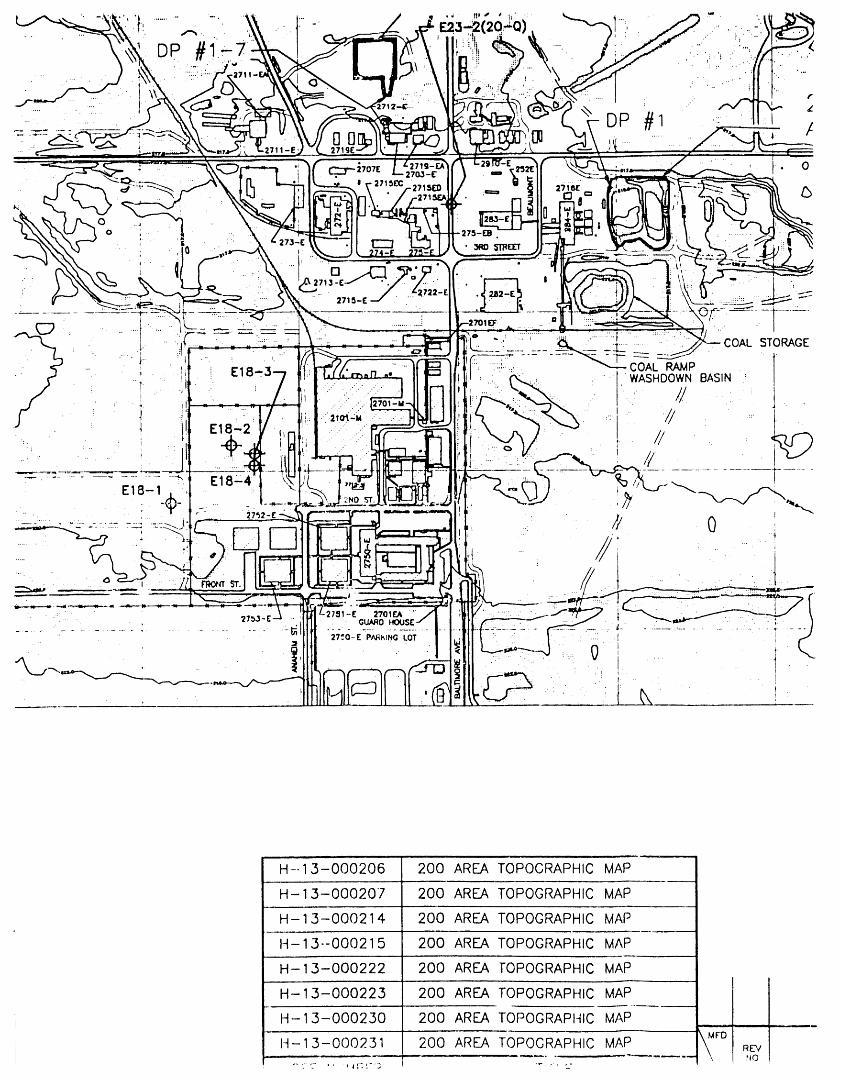
H--13-I000206 200 AREA TOPOCRAPHIC MAP.........
H-15-000207 200 AREA TOPOGRAPHIC MAP.......
H- 1,..,t-000214 200 AREA TOPOGRAPHIC MAP.....
t4-15--000215 200 AREA TOPOGRAPHIC MAP
H-13-000222 200 AREA TOPOGRAPHIC MAP
' H-13-000223 200 AREA TOPOGRAPHIC MAP I IH-13-000230 200 AREA TOPOGRAPHIC _MAP
H-13-000251 200 AIR'EATOPOCRAPHIC MAP

,°
Tt41S MAP IS TO BE
DO NOT USE THIS :.... ..,I
1o_WN RAF.AEL TORRES 3-24-94
I Y / t •
............ - ... , APVO
DESCRIPTION BY BY A.;_VO .....
DArE DATE DArE --_P;r'4OV_LLS--B-':t' >-D'A'TE- _PVO SIZE

Tt41S MAP IS TO BE USED FOR REFERENCE PURPOSES ONLY.
DO NOT USE THIS MAP FOR CONSTRUCTION PURPOSES.
"TOR-RES" 3__4E-9 U.S. DEPARTMENT OF ENERGY /DOE Field Office, Richlond I
I| ¢,_EC,_.5,,....//X,.9'/"t_u_4_---_/'L._ • 5 "& ff _A-_ Westinghouse Honford Compeny J
C O_ E N _ R__':'_--I C __ I " -- _ --_'_ EL_ECTRICAL RESISTANCEAPVD
• TOMOORAPHY TESTINGAPVD
.......... --I---- l ............ r--::_-_] _ ':I,_'E I 2LLG '_O ,NOFX NO OtfG ,qO '
DOE/RL-94-32,REV.004/94
APPENDIXB
PRODUCTINFORMATION
B-i

DOE/RL-94-32, REV.O04/94
CONTENTS
1.0 PRODUCTINFORMATION........................ B-I1.1 ELECTRICALRESISTANCETOMOGRAPHY .......... B-I1.2 PURPOSEOF ELECTRICALRESISTANCETESTING
AT THE HANFORDSITE ................... B-]1.3 LOCATIONOF ELECTRICALRESISTANCE
TOMOGRAPHYTEST SITE ................. B-21.4 ELECTRICALRESISTANCETOMOGRAPHYTESTING .......... B-2
2.0 PLANTOPERATIONALCHARACTERISTICS................. B-3
3.0 WATERCONSUMPTIONAND LOSS ..................... B-4
FIGURES
B-1 Schematic of Resistivity MeasurementsBetweenTwoBoreholes .... B-F1B-2 Perspective View of ProposedTank Mock-upSite ........... B-F2B-3 Plan View of ProposedTank Mock-up Site ........ B-F3B-4 Line Drawing ShowingWater Flow through the Eiectricai
ResistanceTomographyTest Site .................. B-F4
B-ii
DOE/RL-94-32,REV.004/g4
APPENDIXB
1.0 PRODUCTINFORMATION
SECTION B. PRODUCT INFORMATION.OUESTION I; BRIEFLY DESCRIBE ALLMANUFACTURING PROCESSESAND PRODUCTS,AND/OR COMMERCIALACTIVITIES. PROVIDETHE APPLICABLE STANDARD INDUSTRIALGLASSIFICATION(SLC) CODE(S) FOR EACHACTIVITY.
The activity that will generate the liquid dischargedto the ground will be aresearch and development test. The technology to be tested is the ERTtechnology developed at the Lawrence LivermoreNational Laboratory (LLNL).The ERT technology has the potentialto detect leaks from the bottom ofundergroundstorage tanks, such as the single-shelltanks at the Hanford Site.
1.1 ELECTRICALRESISTANCETOMOGRAPHY
The principal behind the ERT technology is, if a current is applied to thesoil, the potentialdifferencemeasured between two points will change ifliquids (especiallyliquidswith electrolytes)are added to the soil. If thepotential difference is measured between an array of points, leaks over alarger area can be detected. Electrical resistance is measured by using aseries of electrode plates placed at differentdepths below the ground surfacein the casing of a borehole. Figure B-I provides a schematicof theconfigurationof the boreholes, electrodes,and electrical equipment. Twocritical aspects of the electrodeplacementare that the electrodes must be ingood contact with the soil and the electrodesmust be insulated from oneanother. Current is driven through the soil from two adjacent electrodes andthe potential difference is measured between all other adjacent electrodepairs. The procedure is repeated for all combinationsof adjacent source andreceiver electrode positions. This scheme is similar to that used for surfacedipole-dipole surveys.
1.2 PURPOSEOF THE ELECTRICALRESISTANCETOMOGRAPHYTESTINGAT THE HANFORDSITE
The LLNL has demonstratedthe ERT technology in tracking groundwatercontaminant plumes at several areas around the country. To prove that the ERTtechnologycan detect leaks at the Hanford Site, a multi-phasetesting programwill be needed. This permit applicationwill covers Phase I and II of thetesting. If these tests are successful,the testingwill continue on to PhaseIll, which will take place in an actual tank farm. The primary purpose thePhase I and II tests is to determine if measur_i_entscan be made in closeproximity to a large steel mass, specifically,a mockup of an undergroundtank.
B-I

DOE/RL-g4-32, REV.O04/94
1.3 LOCATIONOFTHEELECTRICALRESISTANCETOMOGRAPHYTESTSITE
The site chosen for performing the ERTtesting is in the 200 East Area of theHanfordSite,northof 7th Streetand northwestof the inactiveSemi-Works.The testingarea,includingtank mockup,wells,and supportequipmentwill beconfinedto a maximumsurfaceareaof 300 by 300 feet. The locationis shownon figuresin AppendixA. This sitewas chosenbecauseof the availabilityofa partiallyconstructedtank and the similarityof the soilto that foundatthe 200 Area tank farms. The tank,knownas tank I05A,is locatedat theapproximateHanfordSitecoordinatesof N42680and W50700. The tank 105Asiteis not knownto havebeen used for any operationalpurposesand the area hasbeen radiologicallysurveyedand clearedfor the testing. The generalareanear the tank was the intendedlocationof the 221-CChemicalSeparationsPlant. The plantwas neverconstructedand constructionof tank IOSAwasnevercompleted.Currently,tank I05Aconsistsof steelwallsabout50 feetin diameterand 16 feethigh. Aboutone half of the tank'sexteriorhas beenbermed. The bottomof tank I05A is composedof nativesoils.
1.4 ELECTRICALRESISTANCETOMOGRAPHYTESTING
To preparethe partiallycompletedtank I05Ato functionas a mockupof a tankfor testing,a tank bottomwill be simulatedby installingthin-gaugesheetmetal,wire meshinginsidethe tankwalls,or similarmaterial. The purposeof the simulatedtank bottomis to providean electricallycontinuousmassthat is similarin size and electricalpropertiesto that of a realtank. Thesoilwill be backfilledaroundthe wallsof the tankmockup.
Also to preparefor testing,approximately16 boreholesare plannedto beinstalledaroundthe tank mockupforthe placementof the ERT electrodes(FigureB-2). The electrodesare to be installedon up to a 6-inchdiameterpoly vinylchloride(PVC)casing. The boreholeswill vary in lengthfromapproximately35 feetto 115 feetbelowthe surface. Becauseof fundingconstraintsor testingrequirements,the numberof boreholesinstalledfor theERT Testingmay vary. The casingmay be installedeitherby usinga drillingrig, or for the shallowerholes,by backfillingaroundthe casingwith abackhoe. Electrodesfor measuringthe potentialdifferencewill be placedapproximatelyeveryS feet alongthe PVCwell casing.
The ERT testingwill be performedin two phases. PhaseI testingwill consistof takingbackgroundmeasurementsof the soil resistance,followedby quicklyinjecting2,000gallonsof the sodiumchloridetracersolutionfrom a point(s)at the bottomof the tank mockup(FigureB-3). The injectionrate is expectedto be 200 to 400 gallonsper day for 5 to 10 days. PhaseI testingwillsimulatea leak fromthe bottomof an undergroundtank and will evaluateifthe ERT methodhas the sensitivityto detectleaksfrom undergroundtanks.
B-2

DOE/RL-94-32,REV.O04/q4
Followinga successfulcompletion of the Phase I testing, Phase II testingwill be conducted that will inject 2,000 gallons (up to a maximum of 4,000gallons) of the sodium chloride tracer solution into the soil over a longerduration. The injectionrate in Phase II testing will vary, but is expectedto be about 40 gallons per day over a period of 50 days. Phase II testingwill include a more realistic slow leak where the reliabilityof the ERTmethod will be evaluated under the influenceof factors such as noise.
Tests also are planned that simulate rain events by applying water on theground surface for a period of up to 24 hours. The purpose of the rainsimulation is to determine if rainwaterwill interferewith the resistancemeasurements. Plans includesimulating a 0.25- to 0.5- inch rainfall eventover a surface area of 200 by 200 feet. Meteorologicaldata indicatesthat arainfall event as large as 0.5 inches is an infrequentevent on the HanfordSite. The water used for the simulatedrainwaterwill be Hanford Site rawwater accessed at a fire hydrant located near the test site. The maximumamount of raw water expected to be used for the rain simulation tests is25,000 gallons. The water will be applied using standard irrigationsprinklers.
Phase II could also includedrilling back into areas where leaks werepredicted to confirm the readings. It is hoped that informationon themigration of the liquid through the soil column also can be used to validatevadose zone flow modeling.
The liquid being injectedwill consist of Hanford Site sanitary (potable)water with a tracer of sodium chloride added to a concentrationof 0.1 molar(7,000 milligrams per liter). The concentrationof 0.1 molar sodium chlorideis the minimum concentrationof electrolytethat is believed to be required toensure that the plume can be measured. The Phase I and Phase II testing,includingmonitoring, should be completed in approximately18 months. Themaximum discharge to the soil column of the sodium chloride tracer solutionwill not exceed 6,000 gallons.
2.0 PLANTOPERATIONALCHARACTERISTICS
SECTIONC, PLANTOPERATIONALCHARACTERISTICS.OUESTION3: ON A SEPARATESHEET.DESCRIBEIN DETAIl. THE TREATMENTANDDISPOSALOF ALL WASTEWATERAS DESCRIBEDABOVE, INCLUDEA SCHEMATIC FLOW DIAGRAM FOR ALL TREATMENT AND DISPOSALSYSTEMS.
Once the ERT testing is completed, the sodium chloride tracer solution cannotbe recovered and therefore becomes a wastewater. No treatment can be
performed on the wastewater and no schematicdiagram is included. No chemicalanalyses have been included in the permit applicationbecause the wastewaterconsists of sanitary (potable)water with only sodium chloride added.Appendix C contains informationon vadose zone modeling of the waste water.The results of the modeling shows that the maximum salt concentration in the
B-3

DOE/RL-94-32,REV.O04/94
vadosezone is 10 milligramsper literabout300 yearsafterinjection.Themaximumcontaminantlevel(MCL)for chlorinein drinkingwater is 250milligramsper liter. Therefore,the ERT testingshouldnot pose a threattoaquiferquality. Becauseof the long traveltime throughthe vadosezone,theup to 25,000gallonsof raw waterdisposedof to the groundas a resultof therain simulationtestingshouldnot significantlyaffectthe migrationof thetracersolutionto the groundwater.
3.0 WATERCONSUMPTIONANDWATERLOSS
_ECTIOND. WATERCONSUMPTIONANDWATERLOSS.OUESTION3: ATTACHA LIHEDRAWINGSHOWINGTHEWATERFLOWTHROUGHTHEFACILITY. INDICATESOURCESOFINTAKEWATER.OPERATIONSCONTRIBUTINGWASTEWATERTOTHEEFFLUENT.ANDTREATMENTUNITS LABELEDTOCORRESPONDTOTHEMOREDETAILEDDESCRIPTIONSIHITEMC, CONSTRUCTA WATERBALANCEONTHELINE DRAWINGBY SHOWINGAVENGEFLOWSBETWEENINTAKES.OPERATIONS.TREATMENTUNITS.AND OUTFALL$, IFA WATERBALANCECANNOTBE DETERMINED(E.G..FOR CERTAINMININGACTIVITIES).PROVIDEAPIGTORIALDESCRIPTIONOF THE NATUREAND AMOUNTOF ANY SOURCESOF WATERAND ANYCOLLECTIONOR TREATMENTUNITS.
This questionis mainlyrelevantto manufacturingor treatmentfacilities.Althoughthe questiondoes not directlyapplyto the ERT Testing,a linedrawingis providedon FigureB-4.
B-4

DOE/RL-94-32, REV.O04/94
Curren¢Ammeter VoltmeterSource
,!, !hole
I
FigureB-I. Schematicof ResistivityMeasurementsBetweenTwo Boreholes.
B-FI

DOE/RL-94-32,REV.O04/94
ground surface planeshort ERTboreholeedepth of 35 ft
long ERT boreholesto depth of 115 ftfor plume tracklng horlzontal ERTfor leak
)n
outllne of ERTvertlcal planes forplume tracklng
FigureB-2. PerspectiveView of ProposedTankMock-upSite.
B-F2

DOE/RL-94-32, REV.004/94
• horizontalERT plan_I_ated at depth 15,25, 35fl
, ",, . .....,_ - ,=, . ......ta
C
;po!s %
I_. II
RP-A _Y
belween depths25 and 110 , elea= pointsalongthe
7t" / perlm exit along theSide_ and at the tank's
J, %_ A b°tt°1
Figure B-3. Plan View of Proposed Tank Hock-up Site.
B-F3

DOE/RL-94-32,REV.004/94
i i i
HANFORD SITESANITARY WATER
(INTAKE WATER)i ii i ii i ii iii
1, 'i i
STORAGEATERTTANKSsITE_ !1NaCI ADDED I(0.1 molar NaCI iSOLUTION)
1i i T i
J TANK MOCK-UP(ERTTESTING)
i iiii
PH,S ,T ST,NO} { TT,NO200-400 GPD APPROX.40 GF_)
(MAXIMUM (MAXIMUM2,000 GAL) _ 4,O00 GAL)
i
SOIL DISPOSAL
ii i i i i
ERT - ELECRICALRESISTANCETOMOGRAPHY
GAL- GALLONS
GPD - GALLONSPERDAY
NaCI - SODIUMCHLORI_
Figure B-4. Line Drawing Showing Water Flow through theElectrical ResistanceTomography Test Site.
B-F4

DOE/RL-94-32,REV. 004/94
APPENDIXC
SITE ASSESSMENT
C-i

DOE/RL-94-32,REV.004/94
CONTENTS
1.0 BOREHOLEDATA ........................... C-I
2.0 HANFORDSITE SOILS ......................... C-I
3.0 REGIONALGEOLOGYAND HYDROLOGY................... C-23.1 REGIONALGEOLOGY....................... C-23.2 REGIONALSTRATIGRAPHY ......... C-2
3.2.1ColumbiaRiverBasaltand the ....EllensburgFormation ................. C-3
3.2.2SuprabasaltSediments................. C-43.3 REGIONALGEOLOGICSTRUCTURE ................. C-53.4 LOCALGEOLOGY .................... C-6
3.4.1RingoldFormation................... C-63.4.2Hanfordformation_ _ . . . .............. C-73.4.3HoloceneSurficalDeposits .............. C-8
3.5 REGIONALHYDROLOGY...................... C-83.6 LOCALHYDROLOGY ..................... C-93.7 VADOSEZONE MODELING.................... C-I0
FIGURES
C-1 Hanford Site Soil Types................. C-F1C-2 Soil Types in the ElectricaiResistivity
TomographyTest SiteArea ................- C-F2c-3HanfordSiteUnconfinedWaterTableMap ............. C-F3C-4 SodiumChlorideConcentrationsat a Recharge
Rateof I CentimeterPer Year..............- - - - C-F4C-5 SodiumChlorideConcentrationsat a Recharge
Rate of 5 CentimetersPer Year .............- - - _ C-F5C-6 SodiumChlorideConcentrationsat a Recharge
Rate of I CentimeterPer Yearwith MinorDiffusion........ C-F6
C-ii
DOE/RL-94-32, REV. 004/94
1.0 BOREHOLEDATA
ATTACHWELLLOGSANDWELLID # WHENAVAILABLEFORALL WELLSWITHIN 500 FEETANDANYAVAILABLEWATERQUALITYDATA.
The topographic map in Appendix A shows six boreholes within 500 feet of theERT test site. Five of the boreholes were less than 40 feet deep and havebeen abandoned and backfilled. These boreholes include the following:
• 299-E27-126 (35 feet total depth)• 299-E27-128 (35 feet total depth)• 299-E27-132 (35 feet total depth)• 299-E27-137 (25 feet total depth)• 299-E27-140 (40 feet total depth).
Borehole 299-E27-Iwas completed to a total depth of 332 feet. The wellconsists of 8-inch carbon steel casing with a screened interval from 262 to331 feet belowgroundsurface. The well currently is included in the HanfordSite water-level measurementnetwork. The last water level measurement,takenin December 1993, indicatedthat the water table was at approximately281 feetbelowground surface. The well is not sampled for water quality data.Because the well was drilled in 1948, the well logs could not be located.
2.0 HANFORDSITE SOILS
SECTIONH, SITE ASSESSMENT.OUESTION5: DESCRIBESOILS ON THE SITE USINGINFORMATIONFROMLOCALSOIL SURVEYREPORTS.(SUBMIT ONA SEPARATESHEET.)
The most recent study of the soil on the Hanford Site was done by Hajek(1966). Hajek (1966) presents a soil map and descriptive report of the soilsin the Benton County portion of the Hanford Site. Based on morphologic andgenetic characteristics,13 soil types were identified. An approximate landuse capability classificationis provided for these soils, on the basis ofsoil limitations for, and damage risks associatedwith, agriculturaluse.Approximateengineering classificationfor these soils, using the Unified SoilClassificationSystem, also are provided by Hajek (1966). The soils at the200 East Area predominantlyconsist of three soil types: Burbank loamy sand,Quincy sand (Rupert sand), and the Ephrata sandy loam. The soil types mappedon the Hanford Site are shown on Figure C-I. The soil types in the ERT testsite area are shown on Figure C-2.
The Burbank loamy sand is a dark grayish brown, coarse-textured,excessivelydrained soil underlain by gravel. The surface soil is usually about 16 inchesthick, but can be as much as 30 inches thick. The gravel content of thesubsoilmay range from 20 to 80 percent (by volume). The surface of theBurbank loamy sand is Group SM (silty sand) and the subsoil is group GM (siltygravel) to GP (poorlygraded gravel). Group GM (siltygravel) are coarse-grained soils composed predominantlyof gravels with more than 12 percent
C-I

DOE/RL-94-32,REV. 004/94
fines. Group GP (poorlygraded gravel) contains coarse-grainedsoils that arepredominantlywell sorted gravels with less than 5 percent fines.
The Quincy sand (Rupert sand) representsone of the most extensive soils onthe Hanford Site. The soil is grayish brown, moderately-deep,coarse sand.Quincy soils are developed under grass and sagebrush in coarse alluvialdeposits mantled by wind-blown sand. Relief characteristicallyconsists ofhummocky terraces and dune-like ridges. The surface and subsoil of the Quincysand were assigned to Group SM (silty sand), which consists of coarse-grainedsoils composed predominantlyof sands with more than 12 percent fines.
The Ephrata sandy loam, occurringto an average depth of 12 inches, is a darkgrayish-brown,medium-texturedsoil underlainby deep gravelly material. Thetopography is generally level. The surface of the Ephrata sandy loam belongsto Group SM (silty sand) to ML (silt),and the subsurfacebelongs to Group ML(silt). Group ML (silt) are fine-grainedsoils composed of silts and clayswith little or no plasticity.
3.0 REGIONALGEOLOGYANDHYDROLOGY
SECTION H, SITE ASSESSMENT. ITEM 6: DI_SCRIBETHE REGIONAL GEOLOGY ANDHYDROGEOLOGYWITHIN ONE, MILE OF THE SITE. (SUBMITON SEPARATE SHEET.)
3.1 REGIONALGEOLOGY
A summary of the regional geologic characteristicsof the Pasco Basin and theHanford Site is presented in terms of stratigraphyand structure in thefollowing sections. Regional conditions of the area are described in Lindseyet al. (1992), Delaney et al. (1991),and Lindsey et al. (1991),which maybeconsulted for additionaldetail.
3.2 REGIONALSTRATIGRAPHY
The Hanford Site lies within the Pasco Basin, a regional structural andtopographic,sediment-filleddepression.The sediments of the Pasco Basin areunderlain by Miocene-age basalt of the Columbia River Basalt Group, a thicksequence of flood basalts that covers a large area in eastern Washington,western Idaho, and northeasternOregon. The sedimentsoverlying the basalts,from oldest to youngest, includethe following:
• Miocene-PlioceneRingold Formation
• Possible Late Pliocene or probable Early Pleistocenelocal alluvialdeposits
• Local 'Palouse'soil of mostly eolian origin
C-2

DOE/RL-94-32,REV. 004/94
• PleistoceneHanford formationglaciofluvialdeposits
• Holocene eolian and fluvial surficialsediments.
The generalized stratigraphyof the Hanford Site is described from oldest toyoungest formation in the following sections.
3.2.1 Columbia River Basalt Group and the Ellensburg Formation
The Columbia River Basalt Group consists of an assemblage of tholeiitic,continental flood basalts of Miocene Age with accumulatedthickness in excessof 10,000 feet within the Pasco Basin. These flows cover an area of more than63,000 square miles in Washington,Oregon, and Idaho and have an estimatedvolume of about 40,800 square miles. The majority of the flows were erupted17 to 14.5 million years ago (Delaneyet al. 1991).
The Columbia River Basalt Group is formallydivided into five formations (fromoldest to youngest): Imnaha Basalt, PictureGorge Basalt, Grande Ronde Basalt,Wanapum Basalt, and Saddle Mountains Basalt. Of these, all are present withinthe Pasco Basin except for the Picture Gorge Basalt. The Saddle MountainsBasalt, divided into the Ice Harbor, ElephantMountain, Pomona, Esquatzel,Asotin, Wilbur Creek, and Umatilla Members, forms the uppermost basalt unitthroughout most of the Pasco Basin. The ElephantMountain Member is theuppermost unit beneath most of the Hanford Site, except near the 300 Areawhere the Ice Harbor Member is found, and north of the 200 Areas where theSaddle Mountains Basalt has been eroded down to the Umatilla Member in theGable Gap area (Delaneyet al. 1991). The Elephant Mountain Member has alsobeen locally eroded in the vicinity of the northeastcorner of the 200 EastArea (Delaneyet al. 1991). On anticlinal ridges bounding the Pasco Basin,erosion has removed the Saddle Mountains Basalt, exposing the Wanapum andGrande Ronde basalts (Delaneyet al. 1991).
The Ellensburg Formationconsists of all sedimentaryunits that occur betweenthe basalt flows of the Columbia River Basalt Group in the central ColumbiaBasin (Reidel and Fecht 1981). The EllensburgFormation generally consists oftwo main lithologies:volcaniclasticsand siliciclastics. The volcaniclasticsconsist mainly of primary pyroclasticair-fall deposits and reworkedepiclastics derived from volcanic terrainswest of the Columbia Plateau.Siliciclasticstrata consist of clastic, plutonic,and metamorphic detritusderived from the Rocky Mountain terrain to the east.
At the Hanford Site, the three uppermost units of the Ellensburg Formation arethe Levy interbed,the RattlesnakeRidge interbed,and the Selah interbed. TheLevey interbed is confined to the vicinity of the 300 Area. The RattlesnakeRidge and Selah interbedsare found beneath most of the Hanford Site(Lindsey et al. 1992).
C-3

DOE/RL-94-32,REV. 004/94
3.2.2 Suprabasalt Sediments
The suprabasalt sedimentary sequence is up to approximately 750 feet thick inthe west-central Cold Creek syncline, while it pinches out against theanticlinal ridges that bound or are present within the Pasco Basin (Gaylordand Poeter 1991). The suprabasalt sediments are dominated by laterallyextensivedeposits of the late Miocene to Pliocene age Ringold Formation andthe Pleistocene-ageHanford formation. Locally occurring strata separatingthe Ringold and Hanford formationsare assigned to the informallydefinedPlio-Pleistoceneunit, early 'Palouse'soil, and pre-Missoulagravels, whichmake up the remainder of the sequence (DOE 1993).
3.2.2.1 Ringold Formation. Overlying the Columbia River Basalt Group is thelate Miocene to Pliocene-ageRingold Formation (Fecht et al. 1987, DOE 1988).The Ringold Formation accumulatedto thicknessesof up to 1,200 feet in thePasco Basin (Tallmanet al. 1979). On the Hanford Site, the Ringold Formationis up to 600 feet thick in the deepest part of the Cold Creek syncline southof the 200 West Area and 560 feet thick in the western Wahluke syncline nearthe IO0-B Area (Delaneyet al. 1991). The Ringold Formation pinches outagainst the anticlinal flanks that bound or are presentwithin the PascoBasin, and is largely absent in the northern and northeasternparts of the 200East Area and adjacent areas to the north (Delaneyet al. 1991, Lindsey et al.1992). The recent studies of the Ringold Formation (Lindsey et al. 1991)indicate it is best described on the basis of sediment facies associationsandtheir distribution. The facies associationshave been divided into fluvialgravel, fluvial sand, overbank deposits, lacustrinedeposits, and alluvialfans. The lower Ringold Formationcontains five separate stratigraphicintervalsdominated by fluvial gravels, which have been designated units A, B,C, D, and E, from oldest to youngest. These gravels units are separated bybasin-wide overbank and lacustrinedeposits (Lindseyet al. 1992). A moredetailed discussion of the Ringold Formationstratigraphycan be found inLindsey et al. (1991).
3.2.2.2 Post-RingoldPre-HanfordSediments. Thin alluvial deposits situatedstratigraphic_llybetween the Ringold Formation and the Hanford formation arefound within the Pasco Basin. The three informallydefined units include:(I) the Plio-Pleistoceneunit, (2) the early 'Palouse'soil, and (3) thePre-Missoulagravels. The Plio-Pleistoceneunit and early 'Palouse'soil arenot found in or near the 200 East Area. These soils are found to the west ofthe 200 East Area, near the eastern boundary of the 200 West Area. Thepre-Missoulagravels are not found in the 200 East Area. Because of theabsence of these units from the site area, the gravels will not be discussedfurther. The Plio-Pleistoceneunit and early 'Palouse'soil are described indetail in Last et al. (1989).The pre-Missoulagravels are discussed in PSPL(1982) and Fecht et al. (1987).
3.2.2.3 Hartfordformation. The informallydesignated Hanford formationconsists of unconsolidated,glaciofluvialsedimentsthat were deposited duringseveral episodes of cataclysmicflooding during the PleistoceneEpoch. The
C-4
DOE/RL-94-32, REV. 004/94
sediments are composed of pebble- to boulder-sized gravel, fine- tocoarse-grained sand, and silt. These sediments are divided into three facies:(1) gravel-dominated, (2) sand-dominated, and (3) silt-dominated (Lindsey etal. 1992). These facies are referred to as coarse-grained deposits,plane-laminated sand facies, and rhythmite facies, respectively (Baker et al.1991). The silt-dominated deposits also are referred to as 'Touchet' beds,and the gravel-dominated facies generally correspond to the Pasco gravels.
The Hanford formation is thickest in the vicinity of the 200 Areas where it isup to 350 feet thick (Lindsey et al. 1992). The formation was deposited bycataclysmic flood waters that originated from glacial Lake Missoula (Fecht etal. 1987, DOE 1988, Baker et al. 1991). The deposits are absent from ridgesabove approximately 1,180 feet above mean sea level, the highest level ofcataclysmic flooding in the Pasco Basin (Delaney et al. 1991).
3.2.2.4 Holocene Surftctal Deposits. Holocene surficial deposits consist ofsilt, sand, and gravel that form a less than 16 foot veneer across much of theHanford Site. These sediments were deposited by eolian and alluvial processes(Delaney et al. 1991).
3.3 REGIONALGEOLOGICSTRUCTURE
The Hanford Site is locatedwithin the Pasco Basin near the eastern edge ofthe Yakima Fold Belt. The Yakima Fold Belt consists of a series of segmented,narrow, asymmetric,east-westtrending anticlinesseparated by broad synclines"or basins that, in many cases, contain thick accumulationsof Neogene- toQuaternary-agedsediments (DOE 19B8, Smith et al. 1989). The Pasco Basin isone of the larger structuralbasins of the fold belt.
The northern limbs of the anticlinesof the Yakima Fold Belt generally dipsteeply to the north, or are vertical. The southern limbs generally dip atrelatively shallow angles to the south. Thrust or high-angle reverse faultswith fault planes that strike parallel or subparallelto the axial trends arefound principally on the north sides of the anticlines. The amount ofvertical stratigraphicoffset associatedwith these faults varies (Delaney etal. 1991).
Deformationof the Yakima folds occurred under north-southcompressionand wascontemporaneouswith the eruption of the basalt flows. The fold belt wasenlargingduring the eruption of the ColumbiaRiver Basalt Group and continuedto enlarge through the Pliocene, into the Pleistocene,and perhaps to thepresent (Delaneyet al. 1991).
The Pasco Basin is a structuraldepressionbounded on the north by the SaddleMountain anticline, on the west by the Umtanum Ridge, Yakima Ridge, andRattlesnake Hills anticlines,and on the south by the RattlesnakeMountainanticline. The Palouse slope, a west-dippingmonocline, bounds the PascoBasin on the east. The Pasco Basin is divided into the Wahluke and Cold Creek
C-5
DOE/RL-94-32,REV. 004/94
synclinesby the Gable Mountain anticline,the eastern extension of theUmtanum Ridge anticline.
The Cold Creek syncline lies between the Umtanum Ridge-GableMountain upliftand the Yakima Ridge uplift, and is an asy,ametricand relatively flat-bottomedstructure. The bedrock of the northern limb dips gently to the south, and thesouthern limb dips steeply to the north. The deepest parts of the Cold Creeksyncline, the Wye Barricadedepression,and the Cold Creek depression, arelocated approximately7.5 miles southeastof the 200 Areas and justwest-southwestof the 200 West Area, respectively(Tallmanet al. 1979).
3.4 LOCALGEOLOGY
The depth to the top of the ElephantMountain Member basalt in the vicinity ofthe 200 East Area ranges from approximately280 feet in the northern part toapproximately 520 feet in the southern part. Overlying the basalt aresedimentsof the Ringold Formation,Hanford formation, and Holocene surficaldeposits. The Piio-Pleistoceneunit, early 'Palouse'soil and the Pre-Missoulagravels are absent in the vicinity of the 200 East Area (Lindsey et al. 1992).The following discussion emphasizes the suprabasaltsediments in the vicinityof the 200 East Area.
3.4.1 Ringold Formation
The Ringold Formationunconformablyoverlies the Elephant Mountain Memberbasalt in the southern two-thirds of 200 East, but is absent in the northernpart of the 200 East Area. The Ringold Formation thickens and dips to thesouth, southeast, and southwesttowards the axis of the Cold Creek syncline(Lindsey et al. 1992). Unit A, the lower mud sequence,and unit E are theonly Ringold Formation units present in the 200 Areas.
The lowest unit of the Ringold Formationis fluvial gravel unit A. Unit Athickens and dips towards the south in the direction of the Cold Creeksyncline. Unit A within the 200 East Area ranges from 0 feet thick in thenorthern part to approximately100 feet thick near the southern boundary.Unit A generally is described as a clast-supportedgranule to cobble gravelwith a sandy matrix. Clast compositionvaries with basalt, quartzite,porphyriticvolcanics, and greenstone being the most common. Clasts ofsilicic plutonic rocks, gneisses, and volcanic breccias also can be found.Associated sands are generally quartzo-feldspathicwith basalt content rangingfrom 5 to 25 percent (Lindsey et al. 1992).
The lower mud sequence overlies unit A and also dips and thickens towards thesouth. The lower mud sequence ranges from 0 feet thick in the northern partto approximately50 feet thick near the southern boundary of the 200 EastArea. The lower mud sequence is composed of overbank and lacustrine deposits.The overbank deposits consist of laminatedto massive silt, silty fine-grained
C-6

DOE/RL-94-32,REV. 004/94
sand, and paleosols containingvariable amounts of pedogenic calciumcarbonate. Plane-laminatedto massive clay with thin silt and sand interbedscharacterizethe lacustrinedeposits. The lacustrinedeposits contain somesoft-sedimentdeformation (Lindseyet al. Igg2).
Unit E locally overlies the lower mud sequence in the southwest corner of the
i 200 East Area and in the vicinity of the Grout Treatment Facility. Unit Eappears to be absent from the northern and central parts of the 200 East Area.The unit thickens towards the area between 200 East and 200 West Areas. Unit
E ranges from 0 feet thick in the northern and central parts of the 200 EastArea to approximatelygo feet thick southwestof the 200 East Area. Unit E isa clast-supportedgranule to cobble gravel, similarto unit A. Locally,strata typical of the fluvial sand and overbank facies associationscould beencounteredwithin unit E (Lindseyet al. 1992).
3.4.2 Hanford formation
In the 200 East Area, the Hanford formationconsists predominatelyof gravel-dominated and sand-dominatedfacies. Informally,the Hanford formation can bedivided into the upper gravel sequence,middle sand sequence, and lower gravelsequence (Lindsey et al. 1992). Because of the variability of Hanfordformation sediments,contacts between these sedimentscan be difficult todistinguish,especially where the sandy sequence is missing and the uppergravel directly overlies the lower gravel. In the 200 East Area, the Hanfordformationoverlies the Ringold Formation in the southern two-thirds of thearea and in the northern part, the Hanford formationdirectly overlies theElephant Mountain Member basalt where the Ringold Formation is absent.
The lower gravel sequence consists of coarse-grainedbasaltic sand and granuleto boulder gravel. Other clast types includeRingold and Plio-Pleistocenerip-ups, granite, quartzite, and gneiss (Hoffmanet al. 1992). Discontinuousintervalsdominated by the sand-dominatedfacies and localizedhorizons ofsilt-dominateddeposits also are presentwithin the lower gravel sequence.The lower gravel sequence ranges from approximately0 to 134 feet thick. Thelower gravel sequence is absent in the east central part of the 200 East Area(Lindseyet al. 1992).
The middle sand sequence overlies the lower gravel sequence and is dominatedby deposits of the sand-dominatedfacies,consisting of fine- tocoarse-grainedsand and granule gravel displaying plane lamination andbedding. Intercalatedhorizons typical of both the gravel-dominatedand silt-dominated sequences also occur within the middle sand sequence,with thegravel sequence more abundant in the northern part and the silt sequence moreabundant in the southern part of the 200 East Area. The middle sand sequencein 200 East ranges from 0 to 275 feet thick. The middle sand unit thins andpinches out to the north, east, and west of the 200 East Area (Lindsey et al.1992).
C-7

DOE/RL-94-32, REV, 004/94
The upper gravel sequence overlies the middle sand sequence in the southernpart of the 200 East Area and the lower gravel unit in the northern part ofthe 200 East Area. Deposits comprising the upper gravel sequence are typicalof the gravel-dominated facies. LentJcular horizons of sand-dominated andsilt-dominated facies are encountered locally in the upper gravel sequence.The upper gravel sequence ranges from 0 to 60 feet thick. The upper gravelsequence thickens to the north and is absent in the central part of the 200East Area.
3.4.3 Holocene Surftctal Deposits
Holocene surftcial deposits consist of silt, very fine- to medium-grained sandand gravel that form a <33 foot veneer across much of the Hanford Site. Thesesediments were deposited by a combination of eolian and alluvial processes,which have produced sheet sands that blanket the surface. Local!y, most ofthe surfical deposits have been removed by construction activities (Lindsey etal. 1992).
3.5 REGIONALHYOROGEOLOGY
The hydrogeology of the Pasco Basin has been broadly characterized asconsisting of four primary hydrogeologlc units (DOE 1988). These unitscorrespond to the upper three formations of the Columbia River Basalt Group(Grande Ronde Basalt, WanapumBasalt, and Saddle Mountains Basalt) and thesedimentary overburden. The basalt aquifers consist of the flood basalts ofthe Columbia River Basalt Group and relatively minor amounts of intercalatedfluvtal and volcaniclastic sediments of the Ellensburg Formation. Confinedzones in the basalt aquifers are present in the sedimentary interbeds and/ortnterflow zones that occur between dense basalt flows. The main water-bearingportions of the interflow zones are networks of interconnecting vesicles andfractures of the basalt flow tops and bottoms (DOE 1988). The suprabasalt,sediment, or uppermost aquifer system consists of fluvial, lacustrine, andglaciofluvial sediments. This aquifer is regionally unconfined and iscontained largely within the Rtngold Formation and the Hanford formation.Figure C-3 provides unconfined aquifer water table elevations for the HanfordSite.
The uppermost aquifer is part of a flow system that is local to the PascoBasin, as are the uppermost basalt interbed aquifers (Gephart et al. 1979, DOE1988). Groundwater in these aquifer systems is probably recharged anddischarged locally. Deeper in the basalt, interbed aquifer systems are partof the regional, or interbasin,flow system,which extends outside the marginsof the Pasco Basin (DOE 1988). The uppermostaquifer system is regionallyunconfined and occurs within the glaciofluvialsands and gravels of theHanford formation and the fluvial/lacustrinesediments of the RingoldFormation. Confined to semi-confinedaquifers of more limited extent alsooccur in the suprabasalt sedimentsof the Pasco Basin. These confined zones
C-8
===

DOE/RL-94-32, REV. 004/94
generally are located within the local flow system, between the unconfinedaquifer and the underlying basalt surface.
3.6 LOCALHYDROSEOLOGY
The primary hydrostrattgraphtc units in the 200 East Area are the confinedaquifer system of the Saddle Mountain Basalt Formation and EllensburgFormation and the unconfined to confined aquifer system of the RtngoldFormation and the Hanford formation. The following discussion focuses on thehydrogeology of the suprabasalt sediments.
In the vicinity of the 200 East Area, the saturated zone is primarily composedof the Rtngold gravel unit A through the central and southern portions of thearea and the Rtngold lower mud sequence to the east near the 216-B-3 PondSystem. In the north part of 200 East where the Ringold Formation isdiscontinuous, the saturated zone is dominantly composedof the Hartfordformation (DOE-RL 1993). The vadose zone ranges from _bout 317 feet thick nearthe southwestern part of the 200 East Area to 123 feet thick in the vicinityof the 216-B-3 Pond System (DOE-RL 1993).
The uppermost aquifer system is comprises of the unconfined aquifer, but alsoincludes localized semiconftned and confined areas. The hydrostratlgraphy ofthe unconfined aquifer in the 200 East Area is relatively complex because ofdeposttlonal and erosional history of the geologic units (DOE-RL 1993). Theunconfined aquifer in the 200 East Area occurs within the Rtngold Formationand Hanford formation. The base of the unconfined aquifer is the top of thelower mud sequence along the southern and eastern areas of 200 East. Alongthe northern parts of 200 East, the base of the unconfined aquifer is the topof the Elephant Mountain Member basalt. The thickness of the unconfinedaquifer varies from zero in the northeastern corner where basalt extends abovethe water table to more than 262 feet to the south (DOE-RL 1993), Within thecentral part of the 200 East Area, the water table is located within theRingold unit A fluvial gravels, where the lower mud sequence is missing, inthe southern part of the 200 East Area, the water table is found near thecontact of the gravelly sediments of Rtngold unit E and the Hanford formation(DOE-RL 1993).
A semiconftned to confined aquifer is observed in the vicinity of the 216-B-3Pond System where the groundwater occurs in the Ringold unit A gravels and isconfined by the lower mud sequence. This aquifer appears to be near only the216-B-3 Pond System (DOE-RL 1993).
Groundwater flow in the 200 West Area is controlled by the effluent dischargesassociatedwith the 216-U-I0 Pond system. Effluentdischarge to the 216-U-I0Pond System has created a groundwatermound emanating from the ponds. Thegroundwatermound underlyingthe 216-U-I0 Pond System causes a radial flowpattern. The radial flow pattern disrupts the regional easterly flow andsplits the regional flow into two flow components;one to the southeast and
C-9

DOE/RL-94-32,REV. 004/94
one to the northwest (DOE-RL 1993). The division of the regional flow iscaused by the westerly flow componentof the radial flow collidingwith theregional easterly flow underneath the central part of the 200 East Area. Theresulting flow patterns create the division,with the northwesternflowcomponentmoving toward Gable Gap and the east-southeasternflow componentmoving towards the central and eastern parts of the Hanford Site.
3.7 VADOSEZONEMODELING
The proposed ERT test at the tank 105A mock-up in the 200 East Area wassimulatedwith the PORFLOW code (Runchaland Sager 1992). The purpose of thesimulation was to estimate the proposed sodium chloride tracer concentrationand spatial distributionin the underlying vadose zone and aquifer.
The maximum contaminant level (MCL), as a secondarystandard, for chlorine indrinking water is 250 parts per million (ppm) or 250 milligrams per liter(mg/L) (WAC 246-290-310). The water quality criteria in WAC 173-200-040forchoride is also 250 mg/L. The chlorine MCL of 250 ppm is equivalent to asodium chloride MCL of 415 ppm or 415 mg/L. It was assumed that the saltconcentration in the proposed injectionwater of 2,000 gallons (7,570 liters)is 7,000 mg/L. It also was assumed that another injectionof 2,000 gallons ofsalt solution may shortly follow the first injectionfrom a differentlocation. For simulationpurposes, both injectionswere at the same tank edgelocation and each injectiontook 5 days. Six of the simulationswere for oneinjection, and one was for two injections.
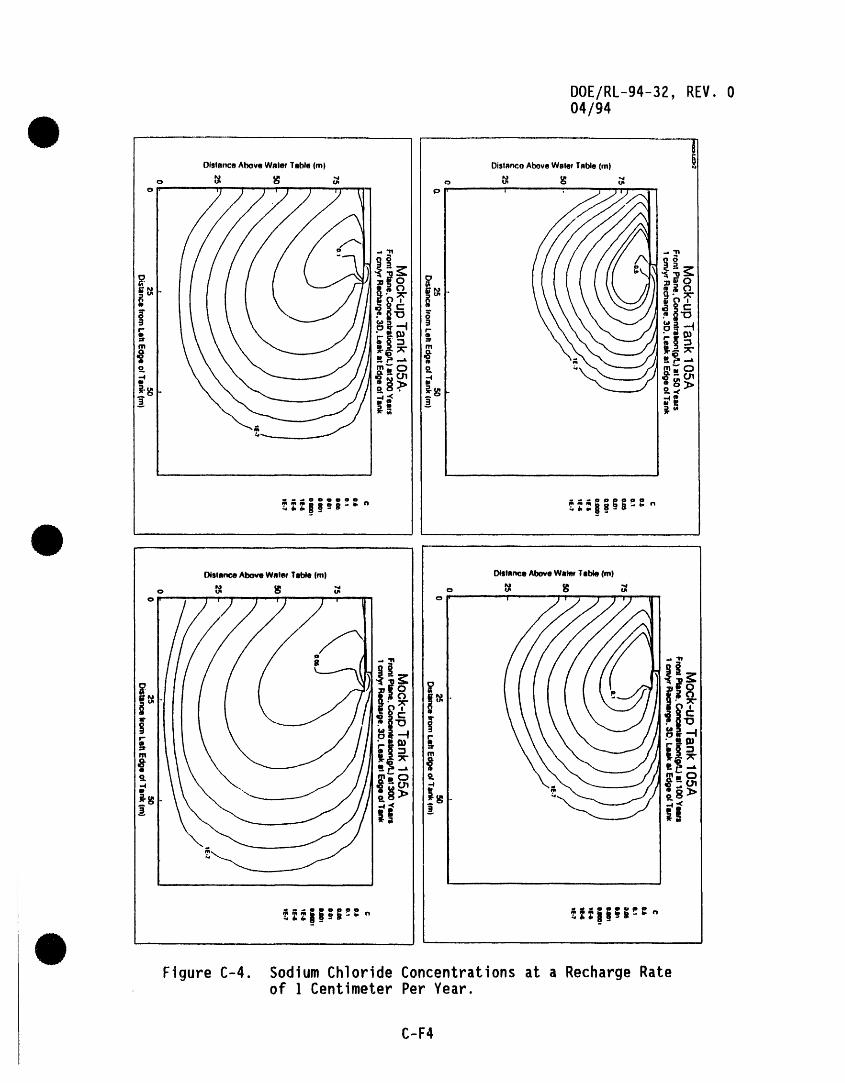
After simulating six different cases of one injectionwith different rechargeand tracer-sourcetank locations, the maximum concentrationof salt in thevadose zone reduces to 10 mg/L, about 300 years after the tracer test for mostof the cases. The salt concentrationwould be even lower in the aquifer at aneven later time. Figure C-4 shows the predicted sodium chloride concentrationfor the expected case [I centimeter per year (cm/yr) recharge]. The traveltime to the groundwater in the expected case is about 200 years. For thehigh-rechargecase (5 cm/yr recharge), the maximum salt concentration reducesto 10 mg/L around 100 years (FigureC-5), which occurs much sooner than the 1-cm/yr recharge case because of the higher recharge causing higher velocities.Travel time to groundwater in the 5-cm/yr case is approximately50 years.
The largest maximum salt concentrationwithin the vadose zone is realized forthe case that includedno dispersioneffects, which physically is not expectedand is very conservative (FigureC-6). Even in the conservativeno-dispersioncase, the maximum salt concentrationof 40 mg/L in the aquifer at 800 years isless than the MCL (415 mg/L) required for salt in drinking water.
C-I0

DOE/RL-94-37, rEv. 004/94
Hant'ord Soils Map
,/LegendWa
I R|-Ritzville Silt Loam
(J)'--Quincy S,md
tle-Hezel Sand
Kf-K¢_hler Sand
Ba-Burhank I.oam)- Sand
I EI-Ephrata Sand)l.oam
I Ls-l.ickskilletSiltl,oam
Eb-Ephrata Stone',' l.oam
Ki-Kioana Silt [,oam
Wa-Warden Silt [.oam
I Sc-Sc_tney St(m)Silt I.oam Scale Kilometers
P--Pa.scoSill [,oam tQu-EsquatzelSilll,oatn
I Rv-Riverwash 0 7 14
l)--l)unesand Soils Map ol the Ilanlt_rd Sfle (modilied t[om ilajek lt)Cvh__'llt" 1 -M}2-_-_
Figure C-1. Hanford Site Soil Map.
C-F1

DOE/RL-94-32, REV. 004/94


DOE/RL-94-32,REV. 004/94
• I100-H HanfordSite
j....l......J---J ........i IO0-D .....1 Boundary
......j- IO0-N tO-F _'L__100-K " • ! |
C " • I• |
• !
•" 1!1
• *'L
200 ......I• West
Area 200 East.• •Area
• I '• Washington
June1989 • . /Public PowerWaterTableElevations /Supply ,
Contoursare inMeters (System /AboveMeanSea Level 17
ContourInterval- 2 m \ 400 /• MonitoringWellsfor \ /
WaterLevelMeasurements /J
GeneralizedBasaltAbove [theWaterTable I.0 3 Miles _t 300
I I __Area! I
0 3 Kilometers
H9104O 11.2
Figure C-3. Hanford Site UnconfinedWater Table Map.
C-F3
DOE/RL-94-32,REV. 004/94
-..| .... |m
FigureC-4. SodiumChlorideConcentrationsat a RechargeRateof ] CentimeterPer Year.
C-F4

DOE/RL-94-32,REV. 004/94
O_stonce Above Water Table |m) Distanco Above Water Table (m)
--4 _"
g-c. -_
- _(,_
_ii!i_i.,'r.- o _i_.lii._ii"-...-<>
Figure C-5. Sodium Chloride Concentrationsat a Recharge Rateof 5 Centimeters Per Year.
C-F5

(w)_ul Ioo_g)3moq_ I (w)queLio.8P3 woqr_mm(]-I"1 O; _;_ 0 ! (IS ;_ o
_.,. , , 0 i , , 0_Q
i'D
C-J
O'b
•i'1 _-% 0 a-Sl
_. uiL Of 0_; 5i,,..,,.z_ _l _tl L -
c..4-_" _ wo
0 ro voi'D "5 tc+ --,-
"5 i'D _ IJIWS qMm._Jllt IO O(}P3 II _18111 "(]C "O_JlqOe_J _ I. J _ IJgtu$ _ _Ulll IO O_ 3 il _ "OC "OlSliN:_l:J JA/q_o t
"O C'_ s_era_00Cte ("_)uo_mluouuoo "oUelditm_j I ueeA,OO_le ('l/0)uoqemJoouoo"oUeldlUOJ::lt ,i)o ggo L)luej. dn-)t0oN g_;OI.)luej. dn-:_o_
-rl -5 _ !0"_ ('1
•-< i'D (wl_Ue.LIOo_ woq aoums_] i (w)_Ue.LIo0_3 um_laoumsJQi'D :3 O_ ;_ o o(3 5_ ot:_ (..t- 0"5 "5 o '
m I
e'_O i
0
(._
(-,I- ..(I:) _ I =
uo_sn,mQ_ _q.,__tL io 0_3 le _rl '0£ "_¢NO%l d_uo I ! u_nll_ Ictus _ _el io 0_3 te _erl '(3C"a0_pol:f _ [ ;z3m_ ClOtill l-U_)uoqiului:u_O"a_etdluo_ sme,_O_ill {Gll,_iuo__ "tuild t-o_ m
gO0 L_uei dn-_po_ t V_O_._uel dn.-_oo_ _ ._C3

I II