State Utility Forecasting Group | Energy Center at ...
143
State Utility Forecasting Group | Energy Center at Discovery Park | Purdue University | West Lafayette, Indiana October 2017
Transcript of State Utility Forecasting Group | Energy Center at ...
State Utility Forecasting Group | Energy Center at Discovery Park | Purdue University | West Lafayette, Indiana
October 2017

2017 INDIANA RENEWABLE ENERGY
RESOURCES STUDY
State Utility Forecasting Group
Energy Center
Purdue University
West Lafayette, Indiana
David Nderitu
Douglas Gotham
Liwei Lu
Darla Mize
Tim Phillips
Paul Preckel
Marco Velastegui
Fang Wu
October 2017

i 2017 Indiana Renewable Energy Resources Study - State Utility Forecasting Group
Table of Contents List of Figures .......................................................................................................................... iii List of Tables ............................................................................................................................. v Acronyms and Abbreviations .................................................................................................. vii Foreword……………………………… ………………………………………………. ....... .xi
1. Overview ......................................................................................................................... 1
1.1 Trends in renewable energy consumption in the United States ....................... 1 1.2 Trends in renewable energy consumption in Indiana ...................................... 4 1.3 Cost of renewable resources .......................................................................... 10 1.4 References ...................................................................................................... 12
2. Energy from Wind ........................................................................................................ 13
2.1 Introduction .................................................................................................... 13 2.2 Economics of wind energy ............................................................................ 15 2.3 State of wind energy nationally ..................................................................... 20 2.4 Wind energy in Indiana .................................................................................. 26 2.5 Incentives for wind energy ............................................................................ 32 2.6 References ...................................................................................................... 34
3. Dedicated Energy Crops ............................................................................................... 37
3.1 Introduction .................................................................................................... 37 3.2 Economics of energy crops ............................................................................ 42 3.3 State of energy crops nationally ..................................................................... 46 3.4 Energy crops in Indiana ................................................................................. 48 3.5 Incentives for energy crops ............................................................................ 51 3.6 References ...................................................................................................... 52
4. Organic Waste Biomass ................................................................................................ 55
4.1 Introduction .................................................................................................... 55 4.2 Economics of organic waste biomass ............................................................ 57 4.3 State of organic waste biomass nationally ..................................................... 61 4.4 Organic waste biomass in Indiana ................................................................. 67
ii 2017 Indiana Renewable Energy Resources Study - State Utility Forecasting Group
4.5 Incentives for organic waste biomass ............................................................ 74 4.6 References ...................................................................................................... 76
5. Solar Energy ................................................................................................................. 79
5.1 Introduction .................................................................................................... 79 5.2 Economics of solar technologies ................................................................... 82 5.3 State of solar energy nationally ..................................................................... 86 5.4 Solar Energy in Indiana ................................................................................. 88 5.5 Incentives for solar energy ............................................................................. 90 5.6 References ...................................................................................................... 92
6. Photovoltaic Cells ......................................................................................................... 93
6.1 Introduction .................................................................................................... 93 6.2 Economics of PV systems .............................................................................. 96 6.3 State of PV systems nationally .................................................................... 100 6.4 PV systems in Indiana .................................................................................. 104 6.5 Incentives for PV systems ............................................................................ 108 6.6 References .................................................................................................... 110
7. Hydropower ................................................................................................................ 113
7.1 Introduction .................................................................................................. 113 7.2 Economics of hydropower ........................................................................... 114 7.3 State of hydropower nationally .................................................................... 117 7.4 Hydropower in Indiana ................................................................................ 122 7.5 Incentives for hydropower ........................................................................... 124 7.6 References .................................................................................................... 125
iii 2017 Indiana Renewable Energy Resources Study - State Utility Forecasting Group
List of Figures 1-1 Renewable energy consumption in the U.S. (1949-2016) .............................................. 2 1-2 U.S. energy consumption by source (1949-2016) .......................................................... 2 1-3 U.S. total energy consumption by energy source in 2016 .............................................. 3 1-4 Net U.S. electricity generation by energy source in 2016 .............................................. 4 1-5 Renewables share of Indiana total energy consumption (1960-2014) ............................ 5 1-6 Renewables share of Indiana electricity generation (1990-2015) .................................. 6 1-7 Wind energy capacity in Indiana .................................................................................... 7 1-8 Estimated generating technologies capital cost ............................................................ 10 1-9 Estimated generating technologies fixed and variable O&M cost ............................... 11
2-1 Horizontal wind turbine configuration ......................................................................... 13 2-2 Estimated capital costs of various electric generation options ..................................... 16 2-3 Installed wind power project costs over time ............................................................... 17 2-4 Generating technologies O&M cost ............................................................................. 18 2-5 Average O&M costs for available data years ............................................................... 19 2-6 Average wind and wholesale electricity prices ............................................................. 20 2-7 U.S. wind capacity growth ............................................................................................ 21 2-8 Renewable portfolio standards across the U.S .............................................................. 22 2-9 Wind power capacity by state at the end of June 2017 (MW) ...................................... 23 2-10 U.S. wind share of electricity generation in 2016 ......................................................... 24 2-11 80-meter U.S. wind resource map................................................................................. 25 2-12 Wind energy capacity in Indiana .................................................................................. 26 2-13 Indiana wind speed at 100 meters height ...................................................................... 30 2-14 Indiana wind speed at 50 meters height ........................................................................ 31
3-1 Energy crops included in the 2016 Billion-Ton Report ................................................ 39 3-2 Production of energy crops at various farm-gate prices for select years ...................... 42 3-3 Supply curves of potential herbaceous energy crop production for select
years under base-case assumptions ............................................................................... 43 3-4 Supply curves of potential woody energy crop production for select years
under base-case assumptions ........................................................................................ 44 3-5 Bioenergy crop trial stations ......................................................................................... 47 3-6 Estimated shares of energy crops and agricultural residues supplied
at $60 per dry ton in 2030 ............................................................................................. 48 3-7 Projected production of energy crops in Indiana in 2030 ............................................. 49
iv 2017 Indiana Renewable Energy Resources Study - State Utility Forecasting Group
4-1 Supply curves of potential production from primary crop residues for select years under 2016 Billion-ton study base-case assumptions .......................... 59
4-2 U.S. corn stover supply curve ....................................................................................... 61 4-3 U.S. renewable energy consumption (1949-2016) ....................................................... 62 4-4 Landfill gas projects ...................................................................................................... 64 4-5 Renewables share of Indiana total energy consumption (1960-2014) .......................... 67 4-6 Estimated biomass production potential in Indiana ...................................................... 72 5-1 Cross-section layout of a flat-plate collector ................................................................ 79 5-2 A parabolic trough CSP system .................................................................................... 80 5-3 A linear Fresnel CSP system ........................................................................................ 81 5-4 A power tower CSP system .......................................................................................... 81 5-5 A dish/engine CSP system ............................................................................................ 82 5-6 Estimated capital cost of generating technologies ........................................................ 84 5-7 Operating and maintenance cost of generating technologies ........................................ 85 5-8 Concentrating solar power resource in the U.S. ........................................................... 86 5-9 Solar thermal power capacity installed in the U.S. ....................................................... 87 5-10 Direct normal solar radiation (flat-plate collector) in Indiana ...................................... 89
6-1 Photovoltaic cell operation ........................................................................................... 93 6-2 Illustration of a cell, module and array of a PV system ................................................ 94 6-3 Illustration of concentrating photovoltaic cell .............................................................. 95 6-4 Performance and price of different PV technologies .................................................... 96 6-5 Installed price ($/WDC ) trends for residential and commercial PV systems................ 97 6-6 Installed price of utility-scale PV systems over time ................................................... 98 6-7 Average cost of PV systems of at least 1 MW installed in the U.S. in 2013 ................ 98 6-8 Estimated capital cost of generating technologies ........................................................ 99 6-9 Estimated fixed and variable O&M cost of generating technologies ......................... 100 6-10 Grid-connected U.S. PV installed 2000 to 2016 ......................................................... 101 6-11 Renewable portfolio standards with solar carve-outs ................................................. 102 6-12 Indiana annual installed PV capacity .......................................................................... 105
7-1 Schematic of impoundment hydropower facility ........................................................ 114 7-2 U.S. hydropower construction cost by project type and size ...................................... 115 7-3 Variable and fixed O&M costs of generating technologies ........................................ 117 7-4 Net renewable electricity generation in the U.S. (1949-2016) ................................... 118 7-5 Non-powered dams with potential capacity over 1 MW ............................................ 120 7-6 Renewables share of Indiana net electricity generation (1990-2014) ......................... 122
v 2017 Indiana Renewable Energy Resources Study - State Utility Forecasting Group
List of Tables 1-1 Total installed Indiana PV capacity ................................................................................ 8 1-2 Renewable generation capacity contracted under net metering ...................................... 9 1-3 Renewable generation capacity contracted under feed-in tariffs .................................... 9 2-1 Wind resource classification ......................................................................................... 14 2-2 Utility scale wind farms in Indiana ............................................................................... 27 2-3 Community wind projects in Indiana ............................................................................ 28 2-4 Wind energy purchase agreements by Indiana utilities ................................................ 29 3-1 DOE funded integrated biorefinery projects ................................................................. 41 3-2 Ethanol plants in Indiana .............................................................................................. 45 3-3 Average cost ($/ton) for producing switchgrass in Indiana .......................................... 49 3-4 Cost by category for producing corn stover,
switchgrass, and miscanthus in Wildcat Creek Watershed ........................................... 50
4-1 Summary of secondary agricultural wastes potential at selected prices and years under 2016 Billion-ton study base-case assumptions ........................ 60
4-2 Location of the 77 solid waste to energy plants in the U.S........................................... 63 4-3 Top ten states for potential electricity generation from swine and dairy farms .......... 65 4-4 Wastewater treatment combined heat and power systems in the U.S. ......................... 66 4-5 Electricity generating plants in Indiana landfills .......................................................... 68 4-6 Potential electricity generating capacity in Indiana landfills ........................................ 69 4-7 Operational anaerobic digesters in Indiana ................................................................... 70 4-8 Potential electricity generating capacity in Indiana
concentrated animal feeding operations........................................................................ 71 4-9 Potential electricity generating capacity in Indiana wastewater treatment plants ........ 72
5-1 Estimated capital cost of CSP plants in the U.S. .......................................................... 83 5-2 Operating concentrating solar power plants in the U.S.... ............................................ 88
6-1 PV systems with capacity of 50 MW and above installed in the U.S.... ..................... 103 6-2 Total installed Indiana PV capacity ............................................................................ 104 6-3 PV systems in Indiana with capacity 1.5 MW and above .......................................... 106 6-4 Purchase rates under NIPSCO renewable feed-in tariff ............................................. 107
7-1 Initial capital costs of hydropower projects ................................................................ 116

vi 2017 Indiana Renewable Energy Resources Study - State Utility Forecasting Group
7-2 Ten largest hydropower plants in the U.S. .................................................................. 118 7-3 Top ten U.S. hydropower generating states in 2015 (MWh) ...................................... 119 7-4 Top ten U.S. hydropower capacity states at end of 2015 (MW)................................. 119 7-5 Hydropower potential from non-powered dams by state ............................................ 121 7-6 Indiana non-powered dams with potential capacity over 1 MW ................................ 123
vii 2017 Indiana Renewable Energy Resources Study - State Utility Forecasting Group
Acronyms and Abbreviations AC Alternating current
ARRA American recovery and reinvestment act
AMP American Municipal Power
AWEA American Wind Energy Association
Btu British thermal unit
CAFO concentrated animal feeding operations
CEC California Energy Commission
CHP combined heat and power plant
CO2 Carbon dioxide
CPV Concentrating photovoltaic
CREB Clean renewable energy bonds
CSP Concentrating solar power
DC Direct current
DOE U.S. Department of Energy
DSIRE Database of state incentives for renewables and efficiency
EERE Office of Energy Efficiency and Renewable Energy, U.S. Department of Energy
EIA Energy Information Administration, U.S. Department of Energy
EPA U.S. Environmental Protection Agency
ft Feet
ft3 Cubic feet
GIS Geographical information system
GW Gigawatt
GWh Gigawatthour
IEA International Energy Agency
IMPA Indiana Municipal Power Agency
INL Idaho National Laboratory, U.S. Department of Energy
viii 2017 Indiana Renewable Energy Resources Study - State Utility Forecasting Group
IPL Indianapolis Power and Light Company
IREC Interstate Renewable Energy Council
ITC Business energy investment tax credit
IURC Indiana Utility Regulatory Commission
I&M Indiana Michigan Power
KDF Bioenergy Knowledge Discovery Framework, U.S. Department of Energy
kW Kilowatt
kWh Kilowatthour
LLC Limited liability company
LBNL Lawrence Berkeley National Laboratory, U.S. Department of Energy
LMOP Landfill Methane Outreach Program, Energy Information Administration, U.S. Department of Energy
m/s Meters per second
MACRS Modified accelerated cost-recovery system
MGD Million gallons per day
MGY Million gallons per year
mmBtu Million British thermal unit
mmscfd Million standard cubic feet per day
MMTCO2e/yr million metric ton of carbon dioxide-equivalent per
mph Miles per hour
MSW Municipal solid waste
MTBE Methyl tertiary butyl ether – a gasoline oxygenating additive
MW Megawatt
MWh Megawatthour
NAABB National Alliance for Advanced Biofuels and Bioproducts
NIPSCO Northern Indiana Public Service Company
NOx Nitrogen oxide
NREL National Renewable Energy Laboratory, U.S. Department of Energy

ix 2017 Indiana Renewable Energy Resources Study - State Utility Forecasting Group
O&M Operation and maintenance
OED Indiana Office of Energy Development
ORNL Oak Ridge National Laboratory, U.S. Department of Energy
POLYSYS Policy analysis system
PPA Power purchase agreements
PTC Production tax credit
PV Photovoltaic
QECB Qualified energy conservation bonds
REAP Rural Energy for America Program, U.S. Department of Agriculture
RPS Renewable portfolio standard
SEDS State Energy Data System, Energy Information Administration, U.S. Department of Energy
SEGS Solar Electric Generation System
SEIA Solar Energy Industries Association
SOx Sulfur oxides
SUFG State Utility Forecasting Group
USDA U.S. Department of Agriculture
VEETC Volumetric ethanol tax credit
W Watts
WDC Direct Current Watts
W/m2 Watts per square meter
WPCP Water pollution control plant
WVPA Wabash Valley Power Association
WWTP wastewater treatment plant
yr year

x 2017 Indiana Renewable Energy Resources Study - State Utility Forecasting Group
xi 2017 Indiana Renewable Energy Resources Study - State Utility Forecasting Group
Foreword This report represents the fifteenth annual study of renewable resources in Indiana performed by the State Utility Forecasting Group. It was prepared to fulfill SUFG’s obligation under Indiana Code 8-1-8.8 (added in 2002) to “conduct an annual study on the use, availability, and economics of using renewable energy resources in Indiana.” The code was further amended in 2011, clarifying the topics to be covered in the report. The report consists of seven sections. Section one provides an overview of the renewable energy industry in the United States and in Indiana. It includes a discussion of trends in penetration of renewable energy into the energy supply, both nationally and in Indiana. The other six sections are each devoted to a specific renewable resource: energy from wind, dedicated crops grown for energy production, organic biomass waste, solar energy, photovoltaic cells, and hydropower. They are arranged to maintain the format in the previous reports as follows:
Introduction: This section gives an overview of the technology and briefly explains
how the technology works. Economics of the renewable resource technology: This section covers the capital and
operating costs of the technology. State of the renewable resource technology nationally: This section reviews the
general level of usage of the technology throughout the country and the potential for increased usage.
Renewable resource technology in Indiana: This section examines the existing and potential future usage for the technology in Indiana in terms of economics and availability of the resource.
Incentives for the renewable resource technology: This section contains incentives currently in place to promote the development of the renewable resource.
References: This section contains references that can be used for a more detailed examination of the particular renewable resource.
This report was prepared by the State Utility Forecasting Group. The information contained in it should not be construed as advocating or reflecting any other organization’s views or policy position. For further information, contact SUFG at: State Utility Forecasting Group 203 South Martin Jischke Drive Mann Hall, Suite 160 West Lafayette, IN 47907-1971 Phone: 765-494-4223 e-mail: [email protected] http://www.purdue.edu/discoverypark/SUFG/

1 2017 Indiana Renewable Energy Resources Study - State Utility Forecasting Group
1. Overview
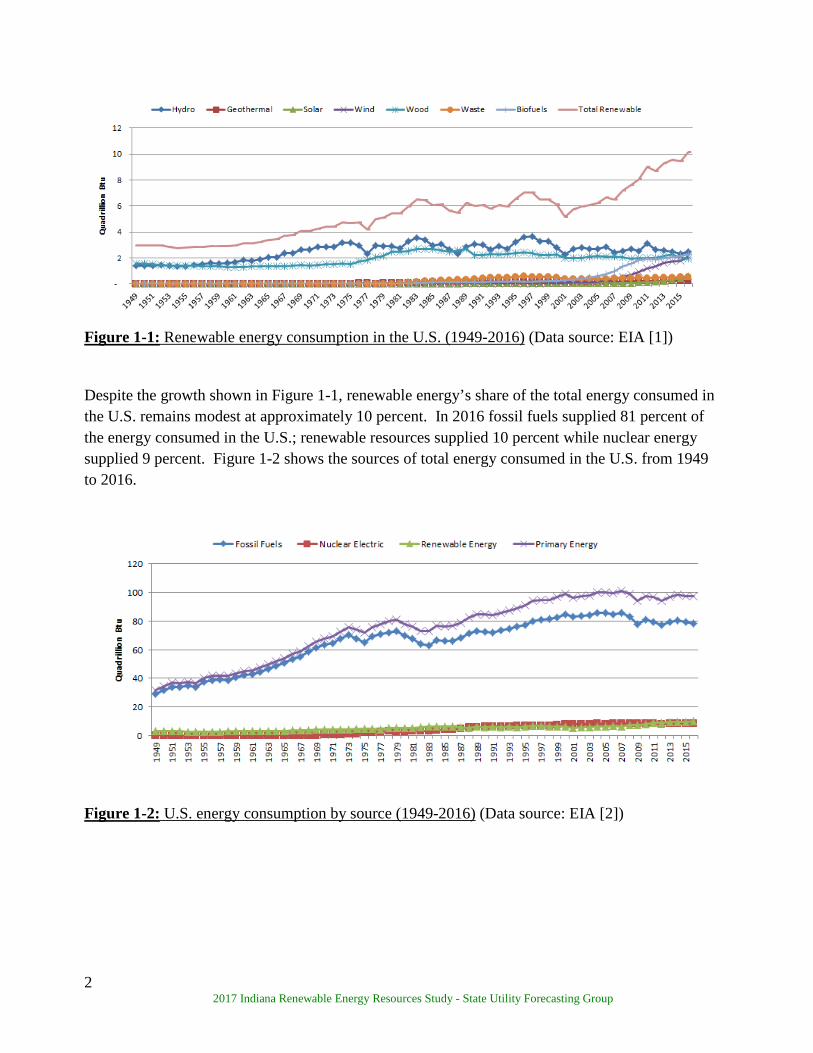
This first section of the 2017 Indiana Renewable Energy Resources Report presents an overview of the trends in renewable energy penetration in the U.S. and in Indiana. 1.1 Trends in renewable energy consumption in the United States Figure 1-1 shows the amount of renewable energy in quadrillion British thermal units (Btu) consumed in the U.S. from 1949 to 2016. Until the early 2000s hydroelectricity and woody biomass were the dominant sources of renewable energy consumed in the U.S. The last sixteen years have seen a rapid increase in biofuels (mainly corn-based ethanol), wind and solar as sources of renewable energy. In 2016 biofuels, wind and solar combined contributed 49 percent of the 10 quadrillion Btu of renewable energy consumed in the U.S. The rapid increase in corn-ethanol has been driven by two factors: it serves as a replacement of the oxygenating additive MTBE in gasoline, which started being phased out in 2000, and the Federal Renewable Fuel Standard, first authorized in the 2005 Energy Policy Act and then expanded in 2007, which created mandates for the production of biofuels. This rapid increase in corn-ethanol has since slowed and even turned into a decline in 2012 in line with declining U.S. gasoline demand. The rapid increase in wind energy started with the introduction of the Federal Production Tax Credit (PTC) in 1992, and continued with the proliferation of renewable portfolio standards (RPS) in a number of states. The rapid expansion in solar capacity installations is attributed to a combination of state RPS, financial incentives offered by the federal government as part of the 2008/2009 economic recovery packages and the declining cost of installing photovoltaic systems. These federal incentives include the modification of the 30 percent Investment Tax Credit (ITC) to remove the $2,000 cap and to allow utilities access to the ITC, the provision for investors to take a 30 percent cash grant in lieu of the ITC and PTC, and the provision of extra funds for the U.S. Department of Energy (DOE) loan guarantee program. This cash grant provision and the special DOE loan guarantee program provided under Section 1705 of the Energy Policy Act were retired in 2011. However, the production tax credit and the investment tax credit are still in place having been extended most recently to 2019 by the Consolidated Appropriations Act of 2016.
2 2017 Indiana Renewable Energy Resources Study - State Utility Forecasting Group
Figure 1-1: Renewable energy consumption in the U.S. (1949-2016) (Data source: EIA [1])
Despite the growth shown in Figure 1-1, renewable energy’s share of the total energy consumed in the U.S. remains modest at approximately 10 percent. In 2016 fossil fuels supplied 81 percent of the energy consumed in the U.S.; renewable resources supplied 10 percent while nuclear energy supplied 9 percent. Figure 1-2 shows the sources of total energy consumed in the U.S. from 1949 to 2016.
Figure 1-2: U.S. energy consumption by source (1949-2016) (Data source: EIA [2])

3 2017 Indiana Renewable Energy Resources Study - State Utility Forecasting Group
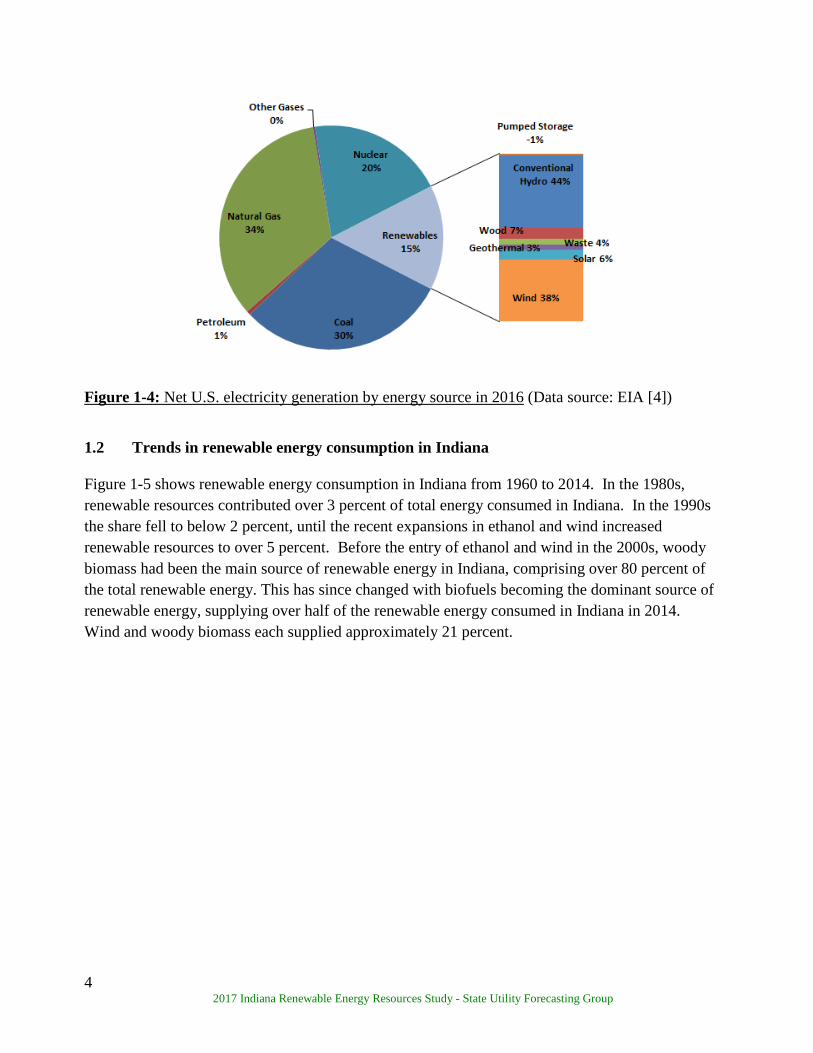
Figure 1-3 shows the contribution of the various energy sources to total energy consumed in the U.S. in 2016. Petroleum continued to be the dominant energy source supplying 37 percent, followed by natural gas at 29 percent and coal at 15 percent. Among the renewable resources, biomass (including wood, biofuels, municipal solid waste, landfill gas and others) comprised 47 percent of the total renewable energy, followed by hydroelectricity at 24 percent. Wind power’s contribution rose to 21 percent from 19 percent in 2015, solar and geothermal remained at 6 percent and 2 percent respectively. When one considers renewable resources in electricity generation (Figure 1-4), hydroelectricity and wind played dominant roles in 2016 together contributing 82 percent of the total renewable electricity generated (44 percent from hydro and 38 percent from wind). Woody biomass contributed 7 percent, solar 6 percent, waste biomass 4 percent, and geothermal 3 percent. As expected, pumped hydroelectricity’s net energy contribution was negative.1
Figure 1-3: U.S. total energy consumption by energy source in 2016 (Data source: EIA [1, 3])
1 Pumped hydroelectric facilities use electricity from the grid during periods of low demand and price to pump water from a lower reservoir to a higher one. That water is then available to generate electricity during high demand and price periods. Due to evaporation and inefficiencies in the pumping and generating processes, less energy is generated than is used. However, the value of the lost energy is more than compensated because low cost, off-peak electricity is converted to high cost, on-peak electricity.
4 2017 Indiana Renewable Energy Resources Study - State Utility Forecasting Group
Figure 1-4: Net U.S. electricity generation by energy source in 2016 (Data source: EIA [4])
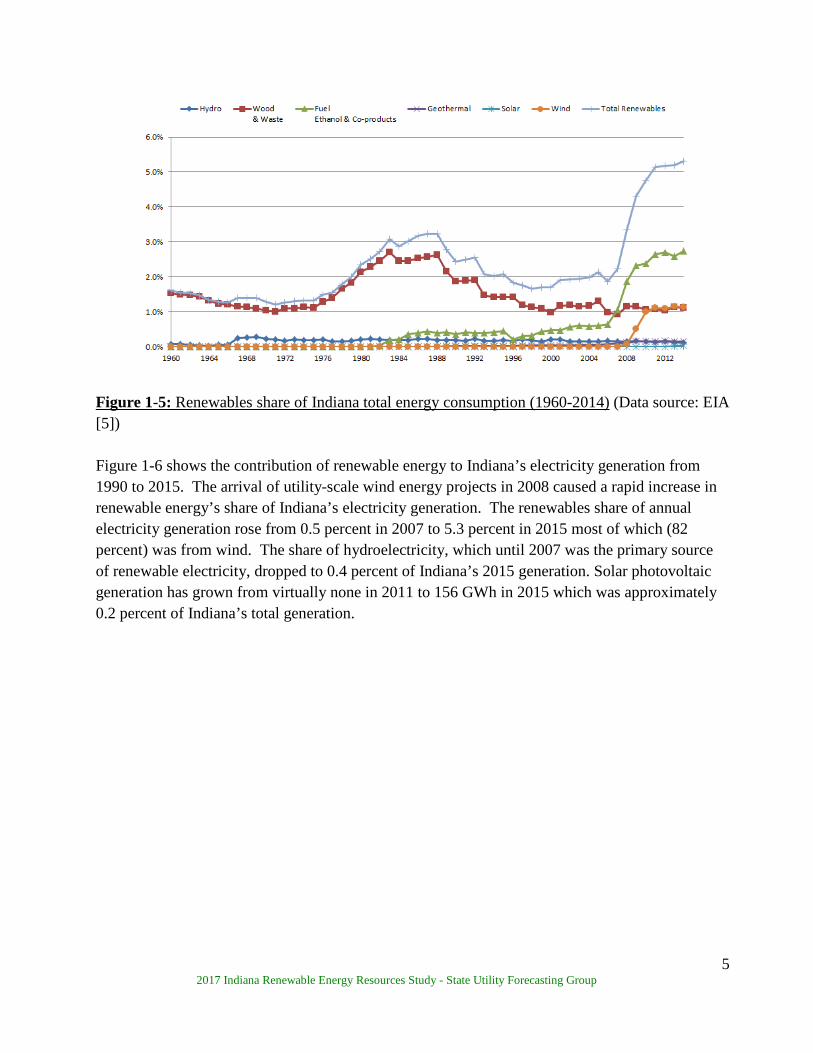
1.2 Trends in renewable energy consumption in Indiana Figure 1-5 shows renewable energy consumption in Indiana from 1960 to 2014. In the 1980s, renewable resources contributed over 3 percent of total energy consumed in Indiana. In the 1990s the share fell to below 2 percent, until the recent expansions in ethanol and wind increased renewable resources to over 5 percent. Before the entry of ethanol and wind in the 2000s, woody biomass had been the main source of renewable energy in Indiana, comprising over 80 percent of the total renewable energy. This has since changed with biofuels becoming the dominant source of renewable energy, supplying over half of the renewable energy consumed in Indiana in 2014. Wind and woody biomass each supplied approximately 21 percent.
5 2017 Indiana Renewable Energy Resources Study - State Utility Forecasting Group
Figure 1-5: Renewables share of Indiana total energy consumption (1960-2014) (Data source: EIA [5]) Figure 1-6 shows the contribution of renewable energy to Indiana’s electricity generation from 1990 to 2015. The arrival of utility-scale wind energy projects in 2008 caused a rapid increase in renewable energy’s share of Indiana’s electricity generation. The renewables share of annual electricity generation rose from 0.5 percent in 2007 to 5.3 percent in 2015 most of which (82 percent) was from wind. The share of hydroelectricity, which until 2007 was the primary source of renewable electricity, dropped to 0.4 percent of Indiana’s 2015 generation. Solar photovoltaic generation has grown from virtually none in 2011 to 156 GWh in 2015 which was approximately 0.2 percent of Indiana’s total generation.

6 2017 Indiana Renewable Energy Resources Study - State Utility Forecasting Group
Figure 1-6: Renewables share of Indiana electricity generation (1990-2015) (Data source: EIA [6]) As can be seen in Figure 1-7 there was a rapid growth in installed wind capacity in Indiana in the three years 2008 to 2010 when nine utility scale wind farms and at least three community wind projects2 with a combined capacity of 1,347 MW were commissioned. Although that rapid pace of expansion slowed down somewhat after 2010, wind energy capacity in Indiana has continued to grow steadily with three wind farms with a combined capacity of 550 MW installed in the last 5 years and two wind farms with a combined capacity of 220 MW under construction at the time this report was written and expected to be completed before the end of 2017. Indiana utilities have a total 1,267 MW contracted through power purchase agreements, with 866 MW from wind farms in Indiana and 401 MW from out of state wind farms [7].
2 Community wind projects are single wind turbine projects installed as a community effort to supplement a community’s electricity supply. They are typically installed in schools or other such community facilities.

7 2017 Indiana Renewable Energy Resources Study - State Utility Forecasting Group
Figure 1-7: Wind energy capacity in Indiana (Data sources: IURC [7], Performance Services [8], Open EI [9], City Bus Greater Lafayette [10]). Another renewable resource, solar photovoltaic, has been experiencing rapid growth with the installed capacity increasing from virtually none in 2008 to nearly 213 MW at the time this report was written. As can be seen in Table 1-1 more than half of this capacity (111 MW) is connected through the feed-in-tariffs offered by the Indianapolis Power and Light Company (IPL) and the Northern Indiana Public Service Company (NIPSCO). Forty one percent of the capacity (87 MW) is operated directly by four utilities: Duke Energy (Duke), Indiana Municipal Power Agency (IMPA), Indiana Michigan Power Company (I&M) and Hoosier Energy Rural Cooperative (Hoosier). An additional 7 percent of solar photovoltaic capacity is connected through the net metering tariffs offered by the five investor-owned utilities (IPL, Duke, NIPSCO, I&M, and Vectren).

8 2017 Indiana Renewable Energy Resources Study - State Utility Forecasting Group
Feed-in-tariff (MWAC)
Utility Operated (MWAC)
Net metered (MWAC)
Total (MWAC)
IPL 94.4 - 1.6 96 Duke - 37.3 7.3 45 IMPA - 28.0 - 28
NIPSCO 16.5 - 2.1 19 I&M - 10.1 1.7 12
Hoosier - 11.8 - 12 Vectren - - 2.1 2
Total 111 87 15 213 Table 1-1: Total Installed Indiana PV capacity (Data source: IURC [7] The factors credited for rapid growth in photovoltaic generation capacity in Indiana include federal, state and utility incentives. Federal incentives include the extension and modification of the 30 percent ITC to remove the $2,000 cap for solar and small wind, the provision by the 2009 American Recovery and Reinvestment Act (ARRA) for a 30 percent cash grant in lieu of the ITC and the PTC, and the provision in the ARRA for funds for a U.S. Department of Energy loan guarantee program targeted towards renewable energy resources. The favorable conditions at the state level include the expansion of the net metering rule to include all customer classes, renewable generating systems up to 1 MW, and the increase of the cap at which a utility may limit system-wide net metering3 capacity form one-tenth of a percent to one percent of its most recent summer peak [11]. The net metering rule has since been modified by Indiana Senate Bill 309 to change the compensation after June 30, 2022 to 1.25 times the utility’s average wholesale cost for the most recent year. Generators installed before the end of 2017 shall continue to receive full retail credit until July 1, 2047 and those installed in the years 2018 to 2022 shall receive full retail credit for their generation until July 1, 2032 [12, 13].
3 The net metering rule allows customers with eligible renewable resource generating facilities to receive credit for the self-generated electricity at the retail rate. At the end of each billing cycle the customer pays for the net electricity received from the utility. In the Indiana rule excess generation by the customer is credited to the next billing cycle.
9 2017 Indiana Renewable Energy Resources Study - State Utility Forecasting Group
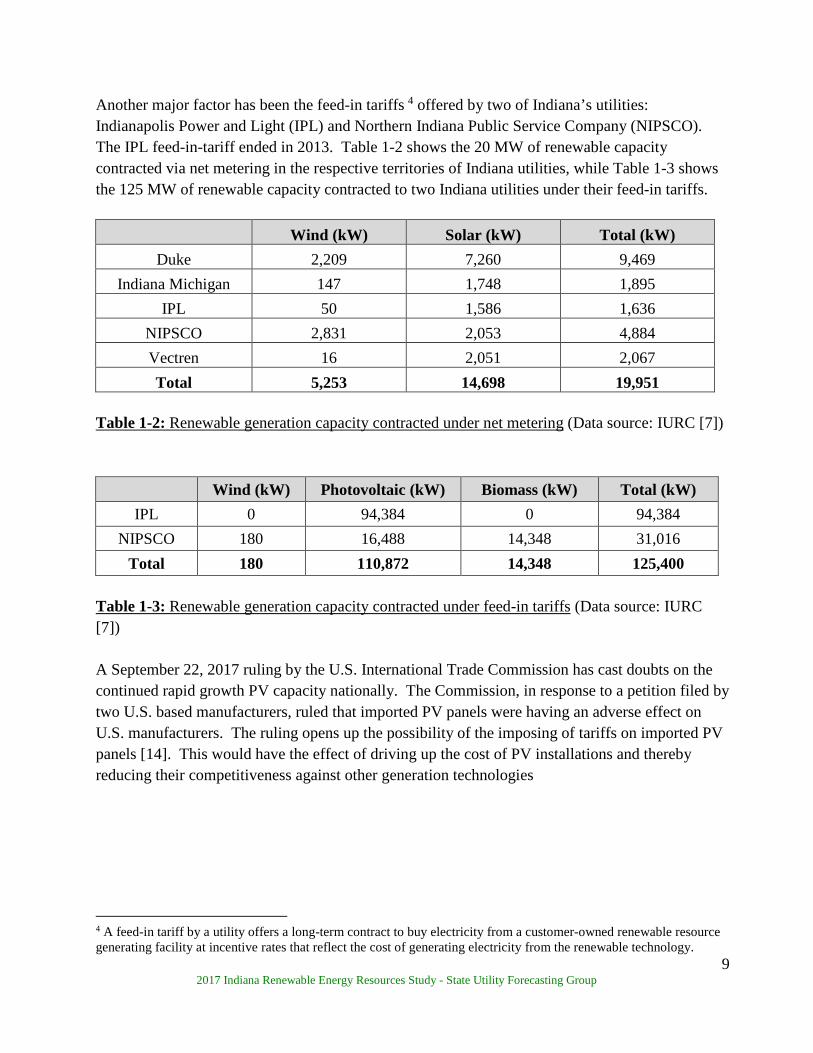
Another major factor has been the feed-in tariffs 4 offered by two of Indiana’s utilities: Indianapolis Power and Light (IPL) and Northern Indiana Public Service Company (NIPSCO). The IPL feed-in-tariff ended in 2013. Table 1-2 shows the 20 MW of renewable capacity contracted via net metering in the respective territories of Indiana utilities, while Table 1-3 shows the 125 MW of renewable capacity contracted to two Indiana utilities under their feed-in tariffs.
Wind (kW) Solar (kW) Total (kW) Duke 2,209 7,260 9,469
Indiana Michigan 147 1,748 1,895 IPL 50 1,586 1,636
NIPSCO 2,831 2,053 4,884 Vectren 16 2,051 2,067 Total 5,253 14,698 19,951
Table 1-2: Renewable generation capacity contracted under net metering (Data source: IURC [7])
Wind (kW) Photovoltaic (kW) Biomass (kW) Total (kW) IPL 0 94,384 0 94,384
NIPSCO 180 16,488 14,348 31,016 Total 180 110,872 14,348 125,400
Table 1-3: Renewable generation capacity contracted under feed-in tariffs (Data source: IURC [7]) A September 22, 2017 ruling by the U.S. International Trade Commission has cast doubts on the continued rapid growth PV capacity nationally. The Commission, in response to a petition filed by two U.S. based manufacturers, ruled that imported PV panels were having an adverse effect on U.S. manufacturers. The ruling opens up the possibility of the imposing of tariffs on imported PV panels [14]. This would have the effect of driving up the cost of PV installations and thereby reducing their competitiveness against other generation technologies
4 A feed-in tariff by a utility offers a long-term contract to buy electricity from a customer-owned renewable resource generating facility at incentive rates that reflect the cost of generating electricity from the renewable technology.
10 2017 Indiana Renewable Energy Resources Study - State Utility Forecasting Group
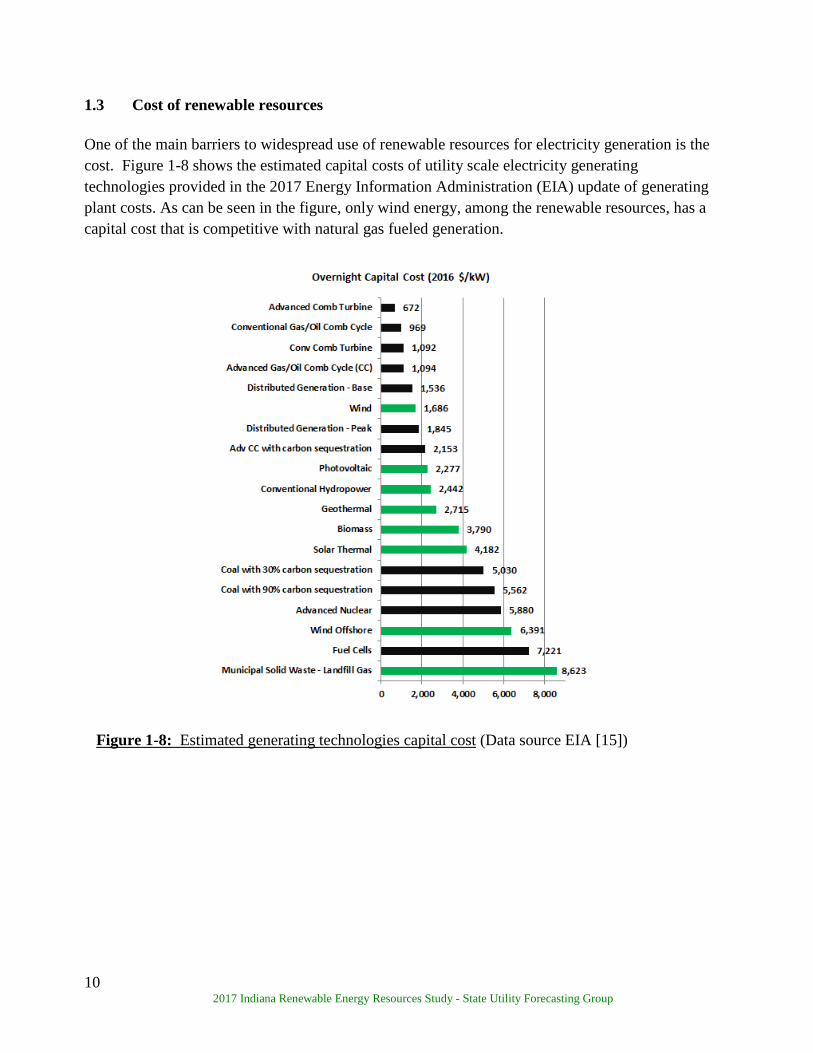
1.3 Cost of renewable resources One of the main barriers to widespread use of renewable resources for electricity generation is the cost. Figure 1-8 shows the estimated capital costs of utility scale electricity generating technologies provided in the 2017 Energy Information Administration (EIA) update of generating plant costs. As can be seen in the figure, only wind energy, among the renewable resources, has a capital cost that is competitive with natural gas fueled generation.
Figure 1-8: Estimated generating technologies capital cost (Data source EIA [15])
11 2017 Indiana Renewable Energy Resources Study - State Utility Forecasting Group
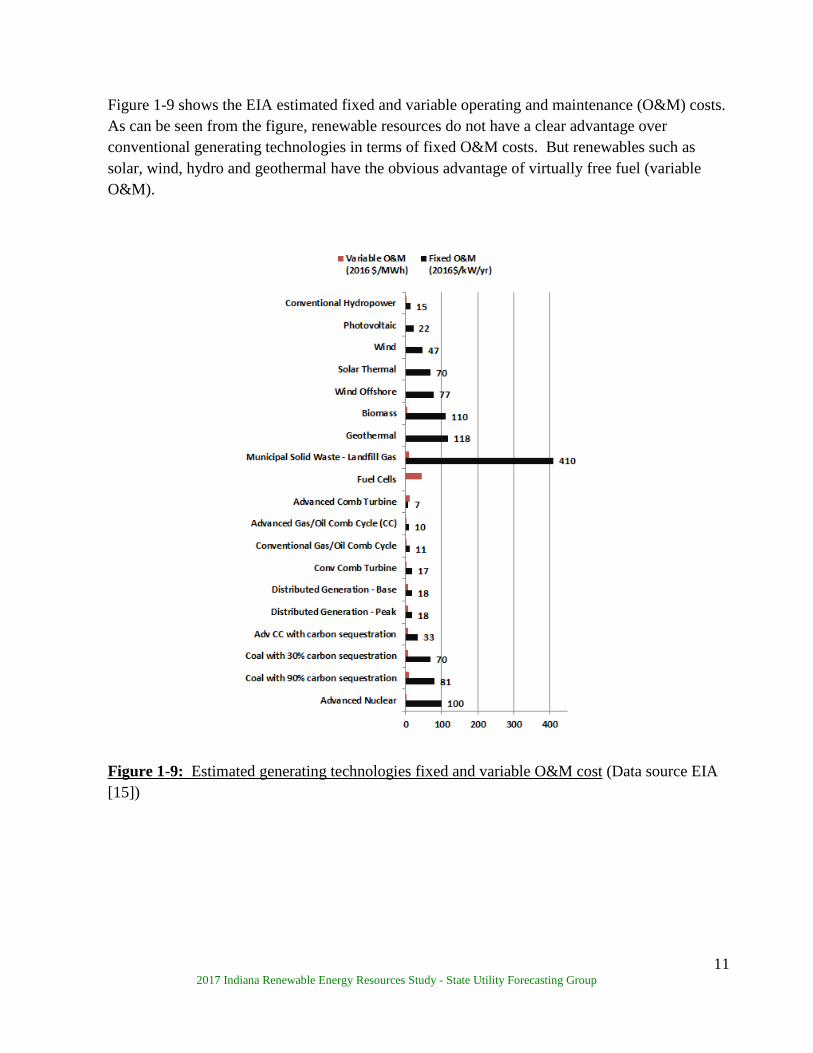
Figure 1-9 shows the EIA estimated fixed and variable operating and maintenance (O&M) costs. As can be seen from the figure, renewable resources do not have a clear advantage over conventional generating technologies in terms of fixed O&M costs. But renewables such as solar, wind, hydro and geothermal have the obvious advantage of virtually free fuel (variable O&M).
Figure 1-9: Estimated generating technologies fixed and variable O&M cost (Data source EIA [15])
12 2017 Indiana Renewable Energy Resources Study - State Utility Forecasting Group
1.4 References
1. Energy Information Administration (EIA). April 2017 Monthly Energy Review Table 10.1. https://www.eia.gov/totalenergy/data/monthly/#renewable 2. EIA. April 2017 Monthly Energy Review Table 1.1
https://www.eia.gov/totalenergy/data/monthly/#summary 3. EIA. April 2016 Monthly Energy Review Table 1.3
https://www.eia.gov/totalenergy/data/monthly/#summary 4. EIA. Renewable. May 2017 Monthly Energy Review, Table 7.2a.
http://www.eia.gov/totalenergy/data/monthly/#electricity 5. EIA. State Energy Data System (SEDS),
Table CT2. Primary Energy Consumption Estimates, 1960-2014, Indiana https://www.eia.gov/state/seds/data.php?incfile=/state/seds/sep_use/total/use_tot_INcb.html&sid=IN
6. EIA. Indiana Electricity Profile 2015, Table 5, Electric power industry generation by primary energy source, 1990 through 2015. Release date: January, 2017. https://www.eia.gov/electricity/state/indiana/ https://www.eia.gov/electricity/state/indiana/xls/in.xlsx
7. George Stevens. Indiana Utility Regulatory Commission. 8. Performance Services
Corporation. http://www.performanceservices.com/services/wind_power/Community_wind_project
9. OpenEI. Wind for schools portal. http://en.openei.org/wiki/Wind_for_Schools_Portal 10. City Bus Greater Lafayette. http://www.gocitybus.com/About/Sustainability 11. Database of State Incentives for Renewables & Efficiency (DSIRE). 12. Indiana General Assembly, 2017 Session. Senate Bill 309
https://iga.in.gov/legislative/2017/bills/senate/309#digest-heading 13. The Journal Gazette, June 26 2017. Holcomb signs solar energy bill).
http://www.journalgazette.net/news/local/indiana/20170503/holcomb-signs-solar-energy-bill 14. Bloomberg Politics September 22, 2017. Uncertainty Grips Solar as Industry Awaits Trump's
Tariff Ruling. https://www.bloomberg.com/news/articles/2017-09-22/itc-votes-in-favor-of-imposing-tariffs-on-u-s-solar-imports
15. EIA. Annual Energy Outlook 2017 Table 8.2). Cost and performance characteristics of new generating technologies. January 2017. https://www.eia.gov/forecasts/aeo/assumptions/pdf/table_8.2.pdf
13 2017 Indiana Renewable Energy Resources Study - State Utility Forecasting Group
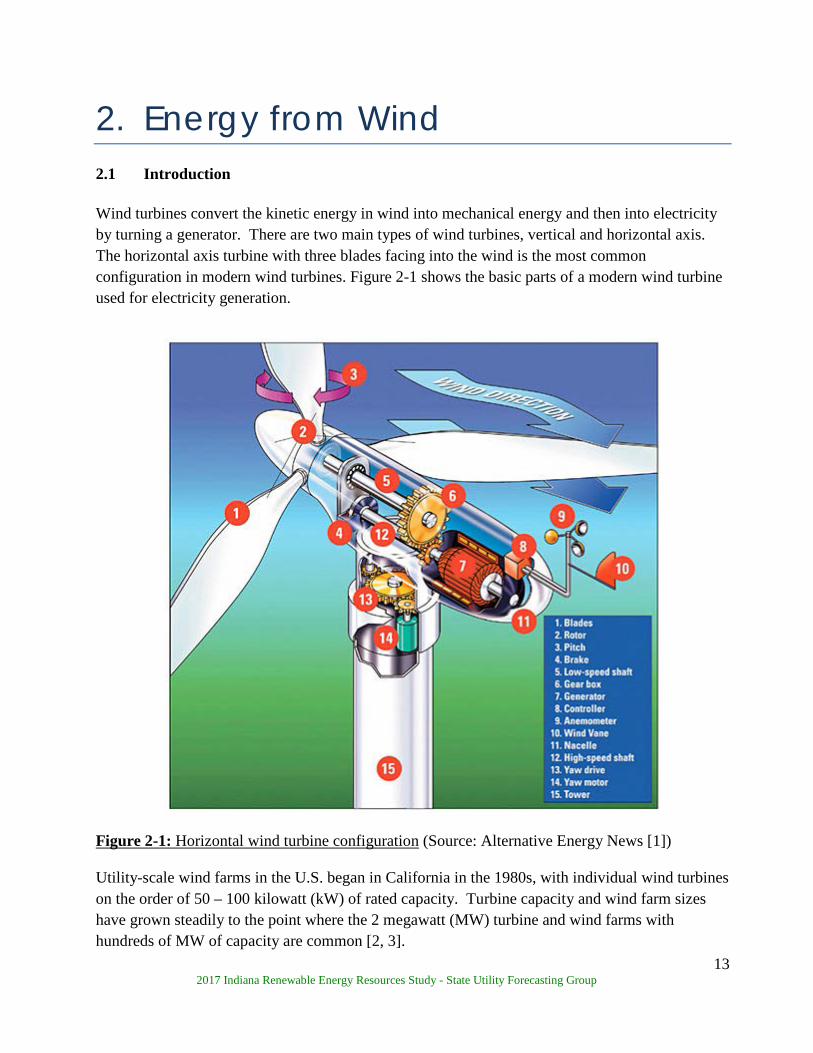
2. Energy from Wind 2.1 Introduction Wind turbines convert the kinetic energy in wind into mechanical energy and then into electricity by turning a generator. There are two main types of wind turbines, vertical and horizontal axis. The horizontal axis turbine with three blades facing into the wind is the most common configuration in modern wind turbines. Figure 2-1 shows the basic parts of a modern wind turbine used for electricity generation.
Figure 2-1: Horizontal wind turbine configuration (Source: Alternative Energy News [1]) Utility-scale wind farms in the U.S. began in California in the 1980s, with individual wind turbines on the order of 50 – 100 kilowatt (kW) of rated capacity. Turbine capacity and wind farm sizes have grown steadily to the point where the 2 megawatt (MW) turbine and wind farms with hundreds of MW of capacity are common [2, 3].
14 2017 Indiana Renewable Energy Resources Study - State Utility Forecasting Group
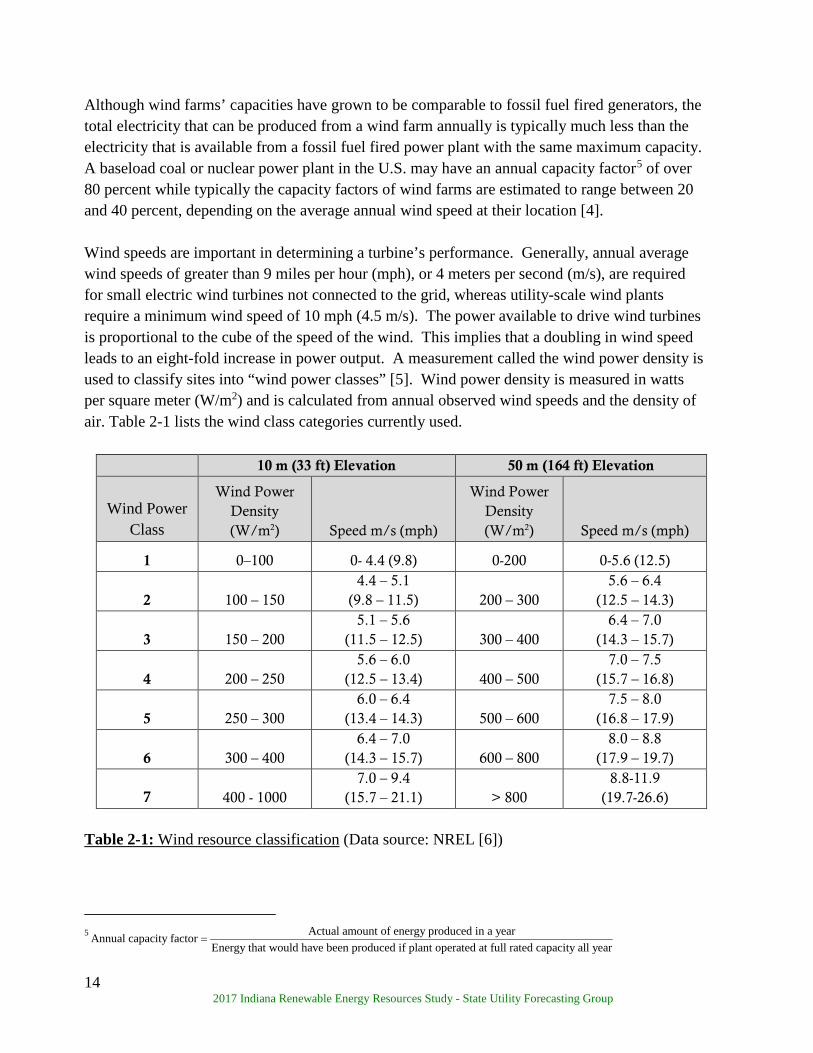
Although wind farms’ capacities have grown to be comparable to fossil fuel fired generators, the total electricity that can be produced from a wind farm annually is typically much less than the electricity that is available from a fossil fuel fired power plant with the same maximum capacity. A baseload coal or nuclear power plant in the U.S. may have an annual capacity factor5 of over 80 percent while typically the capacity factors of wind farms are estimated to range between 20 and 40 percent, depending on the average annual wind speed at their location [4]. Wind speeds are important in determining a turbine’s performance. Generally, annual average wind speeds of greater than 9 miles per hour (mph), or 4 meters per second (m/s), are required for small electric wind turbines not connected to the grid, whereas utility-scale wind plants require a minimum wind speed of 10 mph (4.5 m/s). The power available to drive wind turbines is proportional to the cube of the speed of the wind. This implies that a doubling in wind speed leads to an eight-fold increase in power output. A measurement called the wind power density is used to classify sites into “wind power classes” [5]. Wind power density is measured in watts per square meter (W/m2) and is calculated from annual observed wind speeds and the density of air. Table 2-1 lists the wind class categories currently used.
10 m (33 ft) Elevation 50 m (164 ft) Elevation
Wind Power Class
Wind Power Density (W/m2) Speed m/s (mph)
Wind Power Density (W/m2) Speed m/s (mph)
1 0–100 0- 4.4 (9.8) 0-200 0-5.6 (12.5)
2 100 – 150 4.4 – 5.1
(9.8 – 11.5) 200 – 300 5.6 – 6.4
(12.5 – 14.3)
3 150 – 200 5.1 – 5.6
(11.5 – 12.5) 300 – 400 6.4 – 7.0
(14.3 – 15.7)
4 200 – 250 5.6 – 6.0
(12.5 – 13.4) 400 – 500 7.0 – 7.5
(15.7 – 16.8)
5 250 – 300 6.0 – 6.4
(13.4 – 14.3) 500 – 600 7.5 – 8.0
(16.8 – 17.9)
6 300 – 400 6.4 – 7.0
(14.3 – 15.7) 600 – 800 8.0 – 8.8
(17.9 – 19.7)
7 400 - 1000 7.0 – 9.4
(15.7 – 21.1) > 800 8.8-11.9
(19.7-26.6) Table 2-1: Wind resource classification (Data source: NREL [6])
5 Actual amount of energy produced in a yearAnnual capacity factor
Energy that would have been produced if plant operated at full rated capacity all year=

15 2017 Indiana Renewable Energy Resources Study - State Utility Forecasting Group
In addition to being a virtually inexhaustible renewable resource, wind energy has the advantage of being modular; that is a wind farm’s size can be adjusted by simply adjusting the number of turbines on the farm. A major disadvantage of wind is that the amount of energy available from the generator at any given time is dependent on the intensity of the wind resource at the time, which is difficult to predict. This intermittency of intensity reduces the wind generator’s value both at the operational level and also at the system capacity planning level where the system planner needs information about how much energy they can depend on from a generator at a future planning date, i.e., when the wind intensity cannot be perfectly predicted. Another disadvantage of wind energy is that good wind sites tend to be located far from main load centers and transmission lines. Concerns have also been raised about the death of birds and bats flying into wind turbines, the possibility of turbines causing radar interference, and potential adverse effects of the shadow flicker6 on people living in close proximity. 2.2 Economics of wind energy Figure 2-2 shows capital cost estimates for electricity generating plant modeled by the EIA in the 2017 Annual Energy Outlook. According to these estimates, onshore utility scale wind power plants have the lowest capital cost among the renewable options at $1,686/kW. In addition, onshore wind has a lower capital cost than two of the baseload plants modeled, i.e. nuclear and coal with carbon capture and storage. Offshore wind power plants, on the other hand, have an estimated capital cost that is higher than all other generating technologies modeled except municipal solid waste power plants and fuel cells.
6Shadow flicker is the pulse of shadows and reflections that is sometimes cast by the moving turbine blades.

16 2017 Indiana Renewable Energy Resources Study - State Utility Forecasting Group
Figure 2-2: Estimated capital costs of various electric generation options (Source: EIA [7])

17 2017 Indiana Renewable Energy Resources Study - State Utility Forecasting Group
Figure 2-3 shows the trend in installed wind power plant costs for the projects from 1982 to 2016 contained in the 2016 Wind Technologies Market Report [8] from Lawrence Berkeley National Laboratory (LBNL). As can be seen in the figure, after a period of increasing project cost between 2005 and 2009, the costs have been declining. The 2016 capacity-weighted average installed project cost of $1,590/kW was 33 percent lower than the peak $2,329/kW reported in 2009. The decline in installed costs of wind energy projects reflects the reduction in turbine prices that has been occurring since 2008.
Figure 2-3: Installed wind power project costs over time (Source: LBNL [8])
18 2017 Indiana Renewable Energy Resources Study - State Utility Forecasting Group
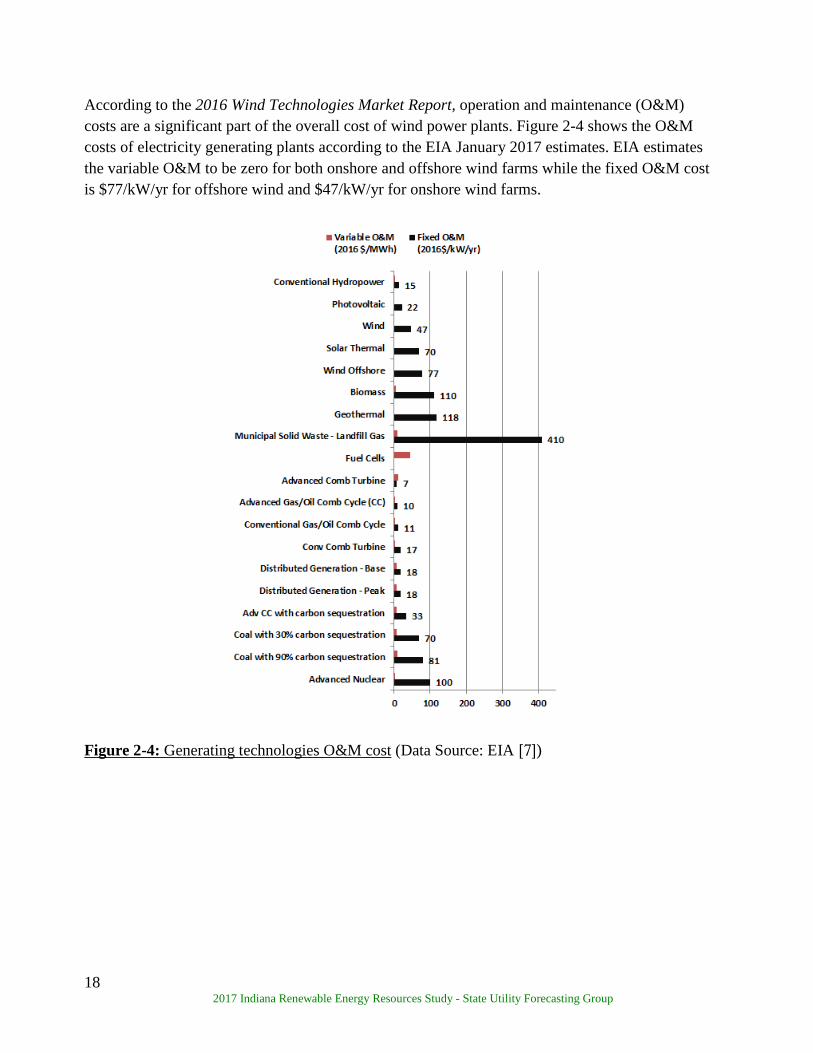
According to the 2016 Wind Technologies Market Report, operation and maintenance (O&M) costs are a significant part of the overall cost of wind power plants. Figure 2-4 shows the O&M costs of electricity generating plants according to the EIA January 2017 estimates. EIA estimates the variable O&M to be zero for both onshore and offshore wind farms while the fixed O&M cost is $77/kW/yr for offshore wind and $47/kW/yr for onshore wind farms.
Figure 2-4: Generating technologies O&M cost (Data Source: EIA [7])
19 2017 Indiana Renewable Energy Resources Study - State Utility Forecasting Group
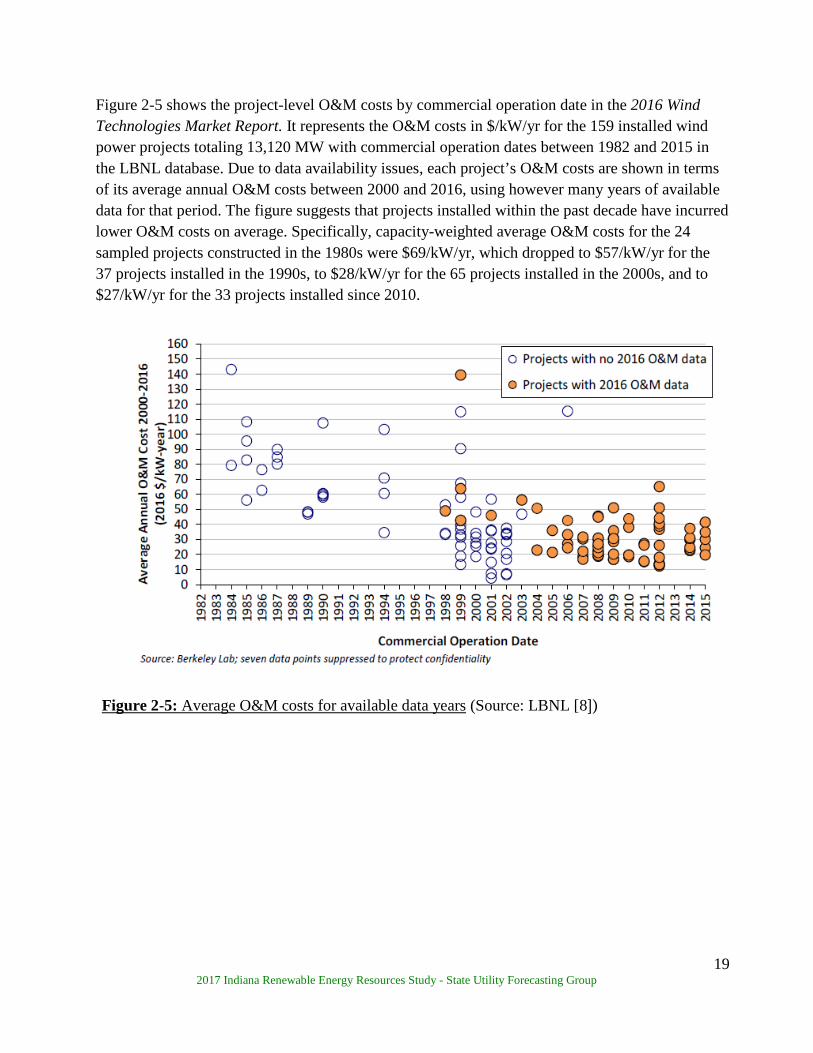
Figure 2-5 shows the project-level O&M costs by commercial operation date in the 2016 Wind Technologies Market Report. It represents the O&M costs in $/kW/yr for the 159 installed wind power projects totaling 13,120 MW with commercial operation dates between 1982 and 2015 in the LBNL database. Due to data availability issues, each project’s O&M costs are shown in terms of its average annual O&M costs between 2000 and 2016, using however many years of available data for that period. The figure suggests that projects installed within the past decade have incurred lower O&M costs on average. Specifically, capacity-weighted average O&M costs for the 24 sampled projects constructed in the 1980s were $69/kW/yr, which dropped to $57/kW/yr for the 37 projects installed in the 1990s, to $28/kW/yr for the 65 projects installed in the 2000s, and to $27/kW/yr for the 33 projects installed since 2010.
Figure 2-5: Average O&M costs for available data years (Source: LBNL [8])
20 2017 Indiana Renewable Energy Resources Study - State Utility Forecasting Group
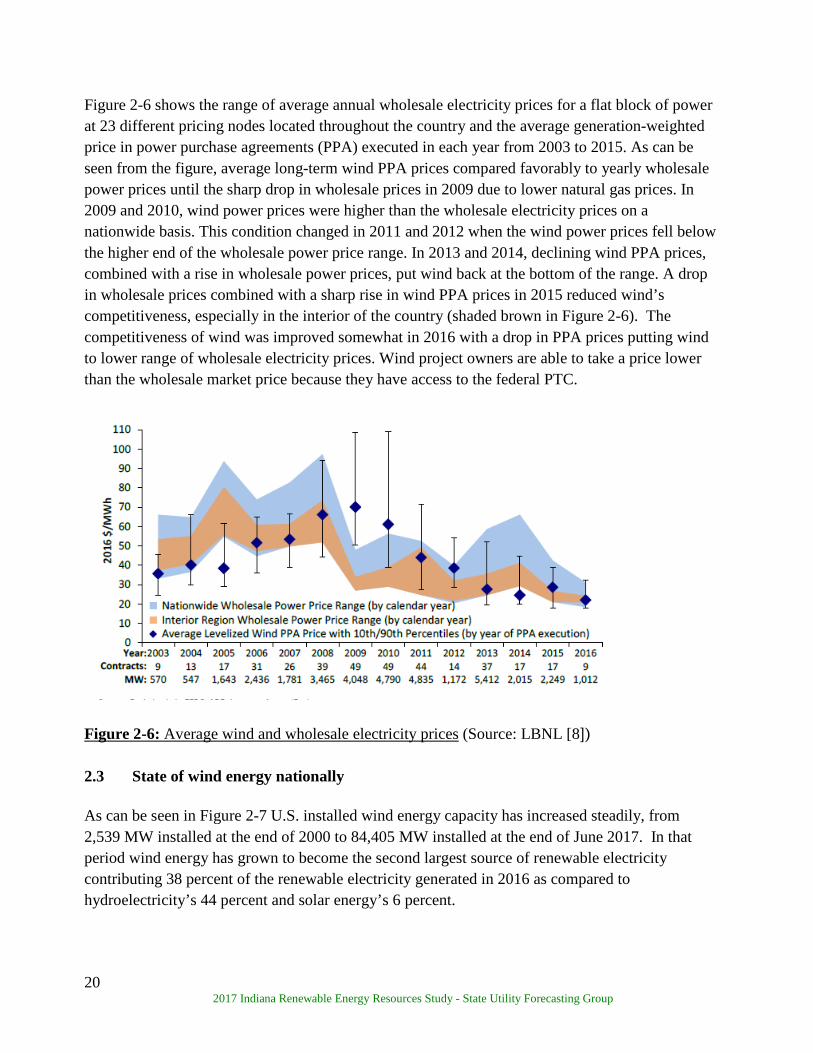
Figure 2-6 shows the range of average annual wholesale electricity prices for a flat block of power at 23 different pricing nodes located throughout the country and the average generation-weighted price in power purchase agreements (PPA) executed in each year from 2003 to 2015. As can be seen from the figure, average long-term wind PPA prices compared favorably to yearly wholesale power prices until the sharp drop in wholesale prices in 2009 due to lower natural gas prices. In 2009 and 2010, wind power prices were higher than the wholesale electricity prices on a nationwide basis. This condition changed in 2011 and 2012 when the wind power prices fell below the higher end of the wholesale power price range. In 2013 and 2014, declining wind PPA prices, combined with a rise in wholesale power prices, put wind back at the bottom of the range. A drop in wholesale prices combined with a sharp rise in wind PPA prices in 2015 reduced wind’s competitiveness, especially in the interior of the country (shaded brown in Figure 2-6). The competitiveness of wind was improved somewhat in 2016 with a drop in PPA prices putting wind to lower range of wholesale electricity prices. Wind project owners are able to take a price lower than the wholesale market price because they have access to the federal PTC.
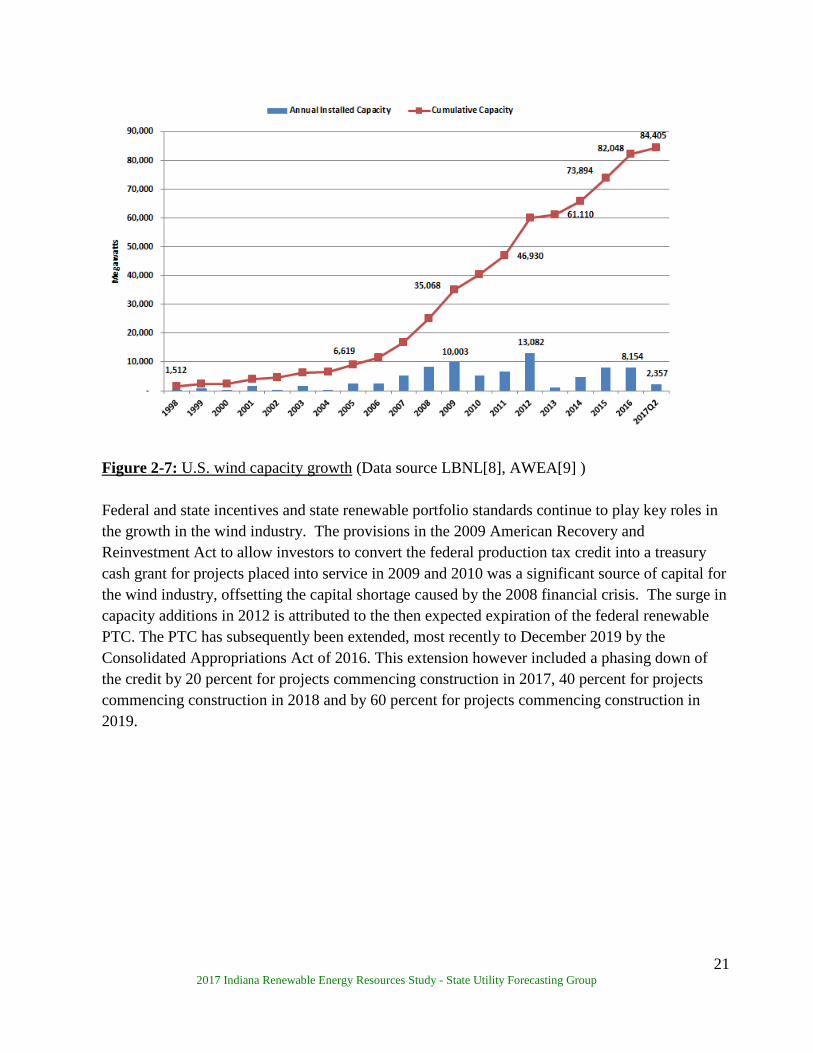
Figure 2-6: Average wind and wholesale electricity prices (Source: LBNL [8]) 2.3 State of wind energy nationally As can be seen in Figure 2-7 U.S. installed wind energy capacity has increased steadily, from 2,539 MW installed at the end of 2000 to 84,405 MW installed at the end of June 2017. In that period wind energy has grown to become the second largest source of renewable electricity contributing 38 percent of the renewable electricity generated in 2016 as compared to hydroelectricity’s 44 percent and solar energy’s 6 percent.
21 2017 Indiana Renewable Energy Resources Study - State Utility Forecasting Group
Figure 2-7: U.S. wind capacity growth (Data source LBNL[8], AWEA[9] ) Federal and state incentives and state renewable portfolio standards continue to play key roles in the growth in the wind industry. The provisions in the 2009 American Recovery and Reinvestment Act to allow investors to convert the federal production tax credit into a treasury cash grant for projects placed into service in 2009 and 2010 was a significant source of capital for the wind industry, offsetting the capital shortage caused by the 2008 financial crisis. The surge in capacity additions in 2012 is attributed to the then expected expiration of the federal renewable PTC. The PTC has subsequently been extended, most recently to December 2019 by the Consolidated Appropriations Act of 2016. This extension however included a phasing down of the credit by 20 percent for projects commencing construction in 2017, 40 percent for projects commencing construction in 2018 and by 60 percent for projects commencing construction in 2019.
22 2017 Indiana Renewable Energy Resources Study - State Utility Forecasting Group
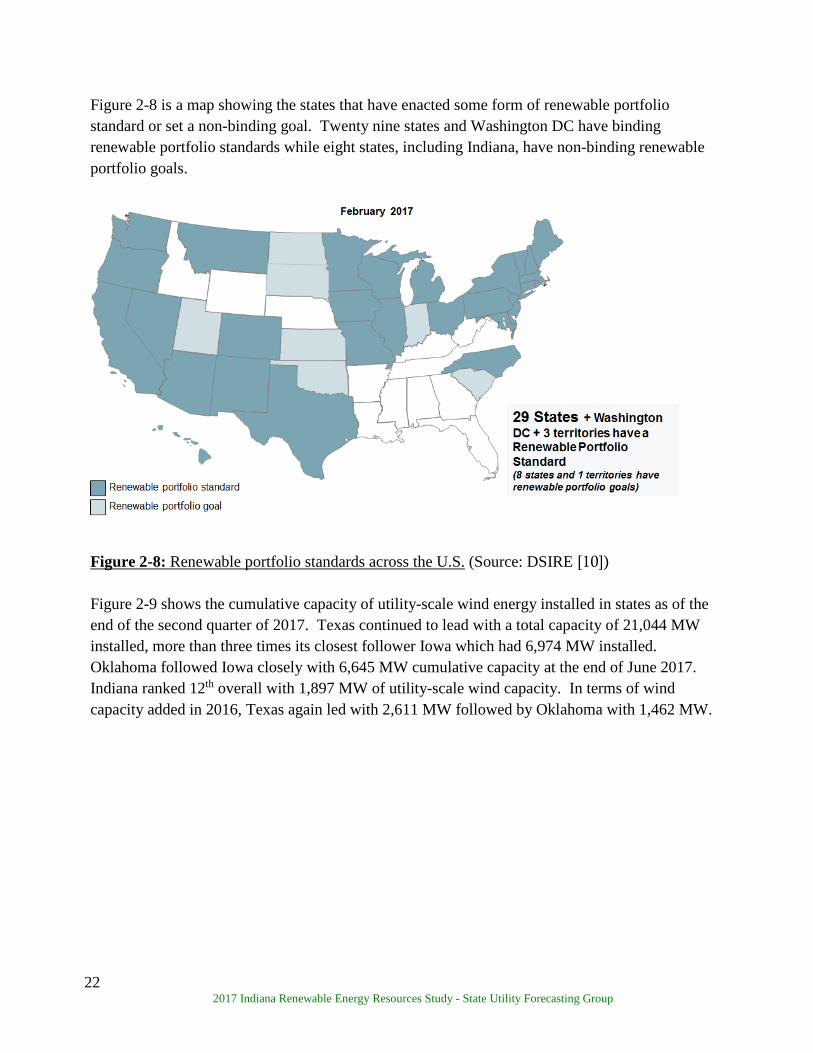
Figure 2-8 is a map showing the states that have enacted some form of renewable portfolio standard or set a non-binding goal. Twenty nine states and Washington DC have binding renewable portfolio standards while eight states, including Indiana, have non-binding renewable portfolio goals.
Figure 2-8: Renewable portfolio standards across the U.S. (Source: DSIRE [10])
Figure 2-9 shows the cumulative capacity of utility-scale wind energy installed in states as of the end of the second quarter of 2017. Texas continued to lead with a total capacity of 21,044 MW installed, more than three times its closest follower Iowa which had 6,974 MW installed. Oklahoma followed Iowa closely with 6,645 MW cumulative capacity at the end of June 2017. Indiana ranked 12th overall with 1,897 MW of utility-scale wind capacity. In terms of wind capacity added in 2016, Texas again led with 2,611 MW followed by Oklahoma with 1,462 MW.

23 2017 Indiana Renewable Energy Resources Study - State Utility Forecasting Group
Figure 2-9: Wind power capacity by state at the end of June 2017 (MW) (Source: AWEA [9])
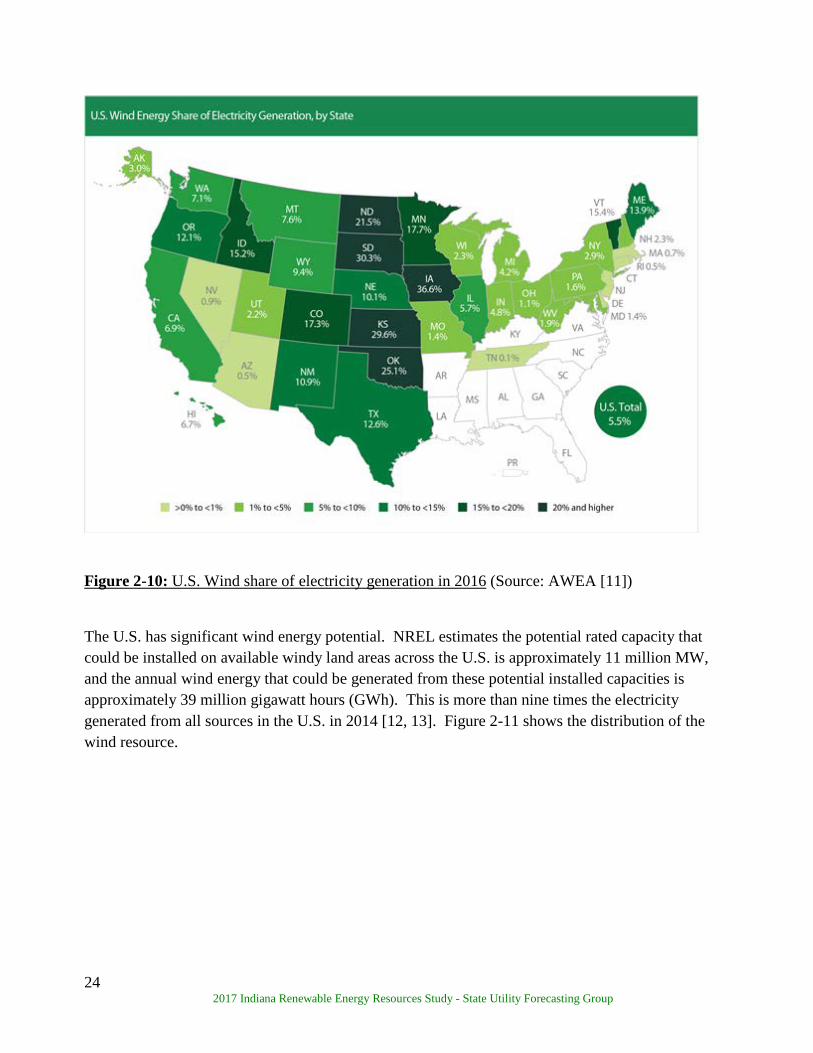
The leading five states for wind energy penetration in 2016 as a percent of total electricity generated were Iowa – 36.6 percent; South Dakota – 30.3 percent; Kansas – 29.6 percent; Oklahoma – 25.1 percent; North Dakota –21.5 percent. Indiana’s penetration was 4.8 percent and the U.S. total was 5.5 percent. Figure 2-10 shows the penetration of wind energy in each of the fifty states.
24 2017 Indiana Renewable Energy Resources Study - State Utility Forecasting Group
Figure 2-10: U.S. Wind share of electricity generation in 2016 (Source: AWEA [11])
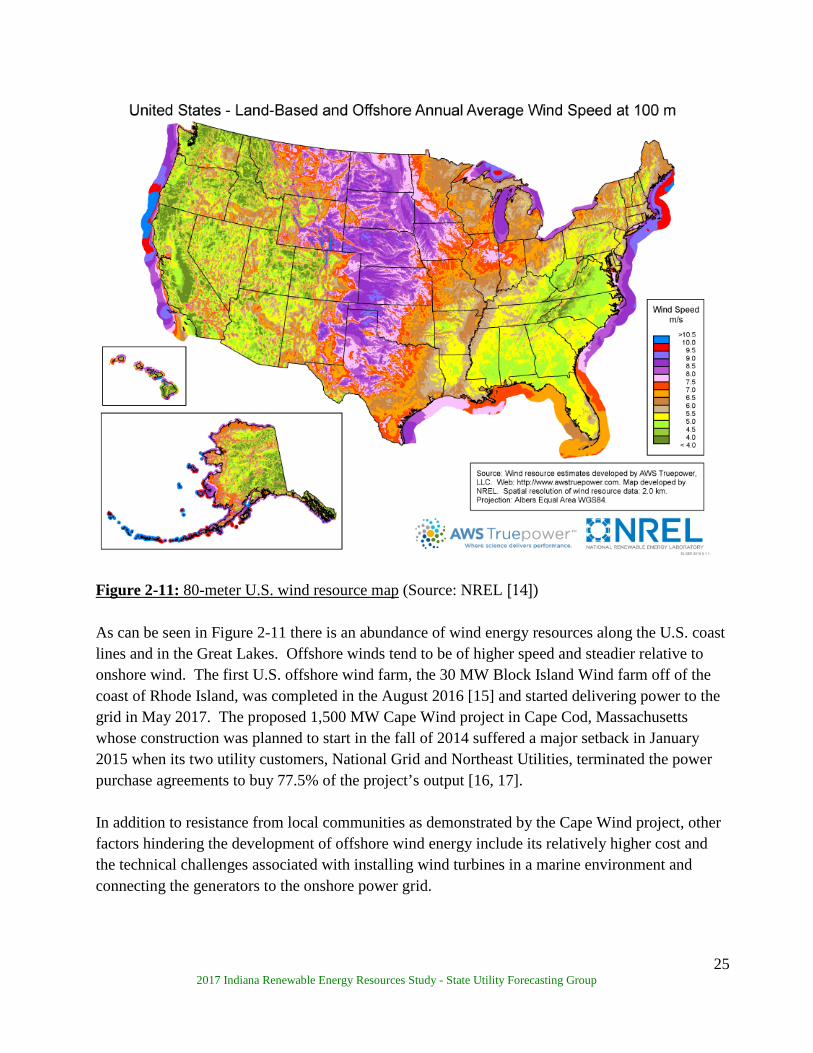
The U.S. has significant wind energy potential. NREL estimates the potential rated capacity that could be installed on available windy land areas across the U.S. is approximately 11 million MW, and the annual wind energy that could be generated from these potential installed capacities is approximately 39 million gigawatt hours (GWh). This is more than nine times the electricity generated from all sources in the U.S. in 2014 [12, 13]. Figure 2-11 shows the distribution of the wind resource.
25 2017 Indiana Renewable Energy Resources Study - State Utility Forecasting Group
Figure 2-11: 80-meter U.S. wind resource map (Source: NREL [14]) As can be seen in Figure 2-11 there is an abundance of wind energy resources along the U.S. coast lines and in the Great Lakes. Offshore winds tend to be of higher speed and steadier relative to onshore wind. The first U.S. offshore wind farm, the 30 MW Block Island Wind farm off of the coast of Rhode Island, was completed in the August 2016 [15] and started delivering power to the grid in May 2017. The proposed 1,500 MW Cape Wind project in Cape Cod, Massachusetts whose construction was planned to start in the fall of 2014 suffered a major setback in January 2015 when its two utility customers, National Grid and Northeast Utilities, terminated the power purchase agreements to buy 77.5% of the project’s output [16, 17]. In addition to resistance from local communities as demonstrated by the Cape Wind project, other factors hindering the development of offshore wind energy include its relatively higher cost and the technical challenges associated with installing wind turbines in a marine environment and connecting the generators to the onshore power grid.
26 2017 Indiana Renewable Energy Resources Study - State Utility Forecasting Group
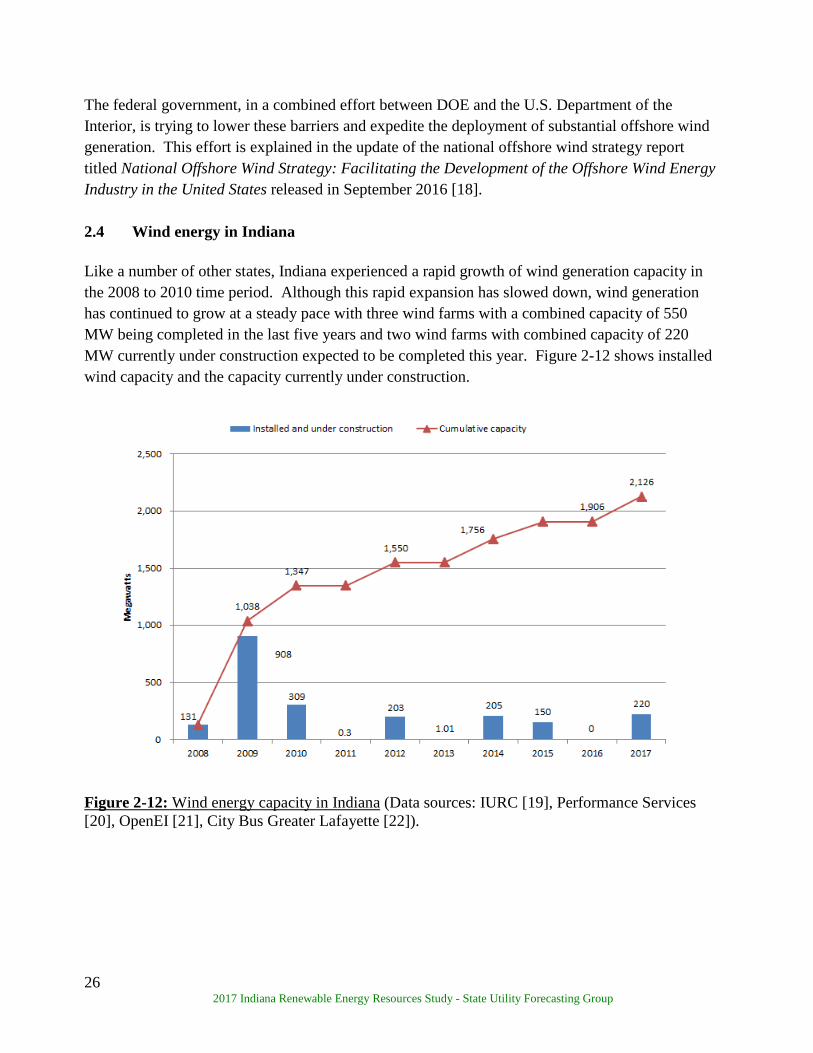
The federal government, in a combined effort between DOE and the U.S. Department of the Interior, is trying to lower these barriers and expedite the deployment of substantial offshore wind generation. This effort is explained in the update of the national offshore wind strategy report titled National Offshore Wind Strategy: Facilitating the Development of the Offshore Wind Energy Industry in the United States released in September 2016 [18]. 2.4 Wind energy in Indiana Like a number of other states, Indiana experienced a rapid growth of wind generation capacity in the 2008 to 2010 time period. Although this rapid expansion has slowed down, wind generation has continued to grow at a steady pace with three wind farms with a combined capacity of 550 MW being completed in the last five years and two wind farms with combined capacity of 220 MW currently under construction expected to be completed this year. Figure 2-12 shows installed wind capacity and the capacity currently under construction.
Figure 2-12: Wind energy capacity in Indiana (Data sources: IURC [19], Performance Services [20], OpenEI [21], City Bus Greater Lafayette [22]).
27 2017 Indiana Renewable Energy Resources Study - State Utility Forecasting Group
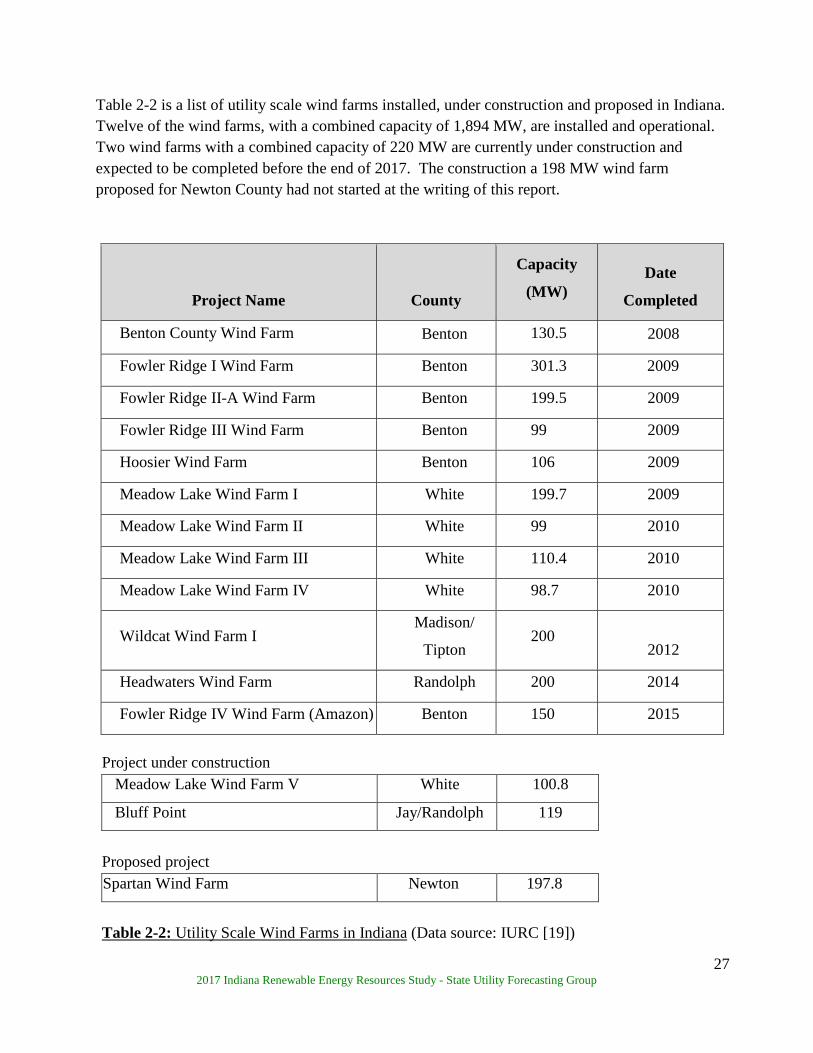
Table 2-2 is a list of utility scale wind farms installed, under construction and proposed in Indiana. Twelve of the wind farms, with a combined capacity of 1,894 MW, are installed and operational. Two wind farms with a combined capacity of 220 MW are currently under construction and expected to be completed before the end of 2017. The construction a 198 MW wind farm proposed for Newton County had not started at the writing of this report.
Project Name County
Capacity
(MW) Date
Completed
Benton County Wind Farm Benton 130.5 2008
Fowler Ridge I Wind Farm Benton 301.3 2009
Fowler Ridge II-A Wind Farm Benton 199.5 2009
Fowler Ridge III Wind Farm Benton 99 2009
Hoosier Wind Farm Benton 106 2009
Meadow Lake Wind Farm I White 199.7 2009
Meadow Lake Wind Farm II White 99 2010
Meadow Lake Wind Farm III White 110.4 2010
Meadow Lake Wind Farm IV White 98.7 2010
Wildcat Wind Farm I Madison/
Tipton 200
2012
Headwaters Wind Farm Randolph 200 2014
Fowler Ridge IV Wind Farm (Amazon) Benton 150 2015
Project under construction
Meadow Lake Wind Farm V White 100.8
Bluff Point Jay/Randolph 119
Proposed project Spartan Wind Farm Newton 197.8
Table 2-2: Utility Scale Wind Farms in Indiana (Data source: IURC [19])
28 2017 Indiana Renewable Energy Resources Study - State Utility Forecasting Group
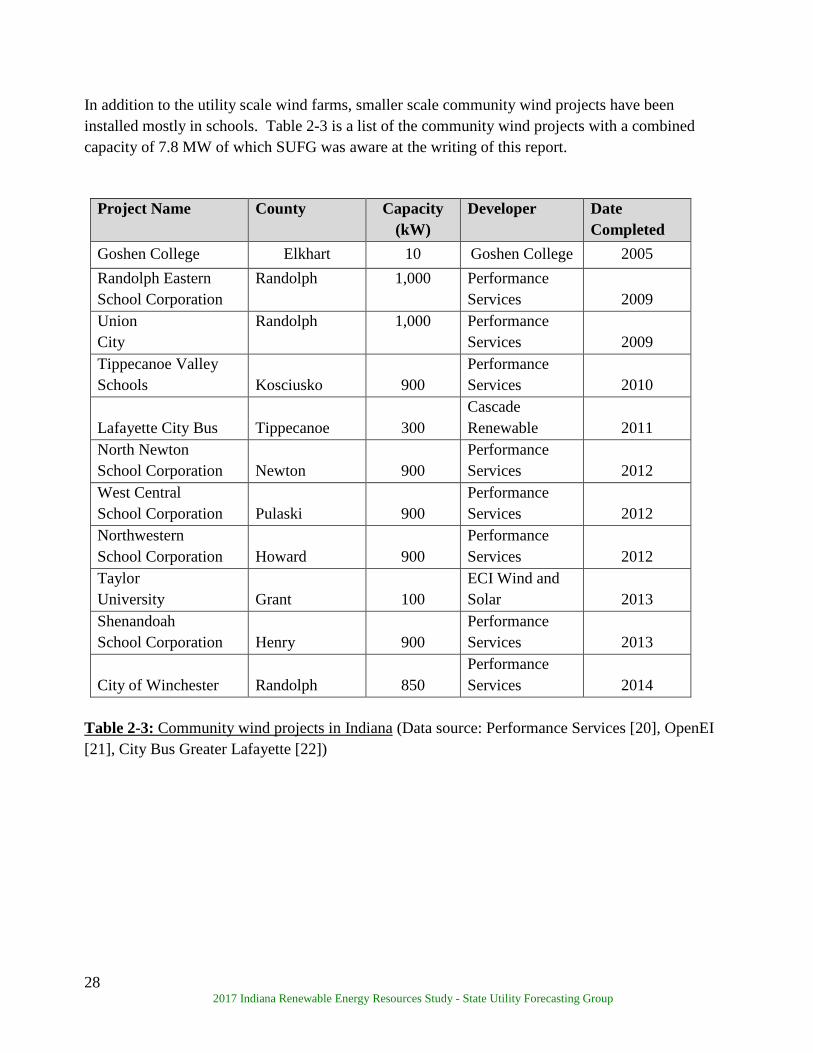
In addition to the utility scale wind farms, smaller scale community wind projects have been installed mostly in schools. Table 2-3 is a list of the community wind projects with a combined capacity of 7.8 MW of which SUFG was aware at the writing of this report.
Project Name County Capacity (kW)
Developer Date Completed
Goshen College Elkhart 10 Goshen College 2005 Randolph Eastern School Corporation
Randolph 1,000 Performance Services 2009
Union City
Randolph 1,000 Performance Services 2009
Tippecanoe Valley Schools Kosciusko 900
Performance Services 2010
Lafayette City Bus Tippecanoe 300 Cascade Renewable 2011
North Newton School Corporation Newton 900
Performance Services 2012
West Central School Corporation Pulaski 900
Performance Services 2012
Northwestern School Corporation Howard 900
Performance Services 2012
Taylor University Grant 100
ECI Wind and Solar 2013
Shenandoah School Corporation Henry 900
Performance Services 2013
City of Winchester Randolph 850 Performance Services 2014
Table 2-3: Community wind projects in Indiana (Data source: Performance Services [20], OpenEI [21], City Bus Greater Lafayette [22])

29 2017 Indiana Renewable Energy Resources Study - State Utility Forecasting Group
Indiana utilities have a total 1,281.5 MW of wind power contracted on power purchase agreements, 866.1 MW from wind farms in Indiana and 415.4 MW from out of state wind farms. Table 2-4 shows the wind power capacity contracted to Indiana utilities.
Utility Project State Power Purchase
Agreement (MW)
Duke Energy Benton County Wind Farm Indiana 110.7 Vectren Benton County Wind Farm Indiana 30 Vectren Fowler Ridge II Indiana 50 Indiana Michigan Power (I&M)
Fowler Ridge I Wind Farm
Indiana
100.4
I&M Fowler Ridge II Wind Farm
Indiana 50
I&M Wildcat I Wind Farm Indiana 100 I&M Headwaters Wind Farm Indiana 200 I&M Bluff Point Indiana 119 IPL Hoosier Wind Indiana 106 IPL Lakefield Wind Minnesota 201 NIPSCO Buffalo Ridge South
Dakota 50.4
NIPSCO Barton Wind Farm Iowa 50 Hoosier Energy Story County Iowa 25 Wabash Valley Power Association (WVPA)
Various sources Various
39 Indiana Municipal Power Agency (IMPA)
Crystal Lake Wind, Hancock County
Iowa 50
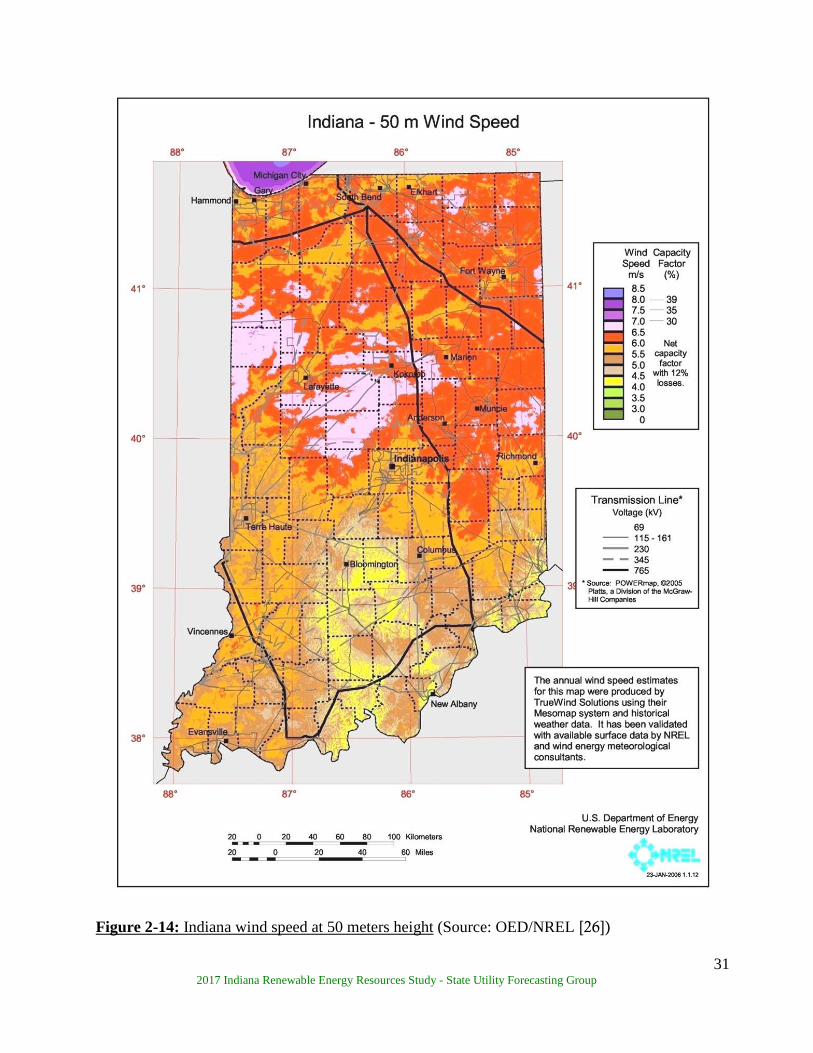
Table 2-4: Wind energy purchase agreements by Indiana utilities (Data sources: IURC, Hoosier Energy [23], WVPA [24], IMPA [25]) Figure 2-13 shows the distribution of Indiana wind energy resources at 100 meters and the location of major transmission lines, the two main factors influencing the location of utility scale wind farms while Figure 2-14 shows the distribution of the wind resource at 50m, a height at which smaller scale community wind projects operate.

30 2017 Indiana Renewable Energy Resources Study - State Utility Forecasting Group
Figure 2-13: Indiana wind speed at 100 meters height (Source: OED/NREL [26])
31 2017 Indiana Renewable Energy Resources Study - State Utility Forecasting Group
Figure 2-14: Indiana wind speed at 50 meters height (Source: OED/NREL [26])
32 2017 Indiana Renewable Energy Resources Study - State Utility Forecasting Group
2.5 Incentives for wind energy The following federal and state incentives are available for wind energy projects. Federal Incentives
Renewable Electricity Production Tax Credit (PTC) credits wind energy producers with 2.3
cents/kWh during the first ten years of operation for wind projects that had commenced construction before January 1, 2017. The PTC was extended to December 2019 by the Consolidated Appropriations Act of 2016 with a provision for phasing it down by reducing it by 20 percent for wind projects commencing construction in 2017, by 40 percent for projects commencing construction in 2018 and by 60 percent for projects commencing construction in 2019. The credit for wind projects commencing construction in 2017 has been set at 1.84 cents/kWh. In 2009 the PTC was modified to allow producers who would qualify for the PTC to opt to take the federal business energy investment tax credit (ITC) [10, 27].
Business Energy Investment Tax Credit (ITC) credits wind projects with 30 percent of their construction cost in lieu of the production tax credit. Like the PTC the ITC expires in December 2019 and is scheduled to scale down by 20, 40 and 60 percent respectively in 2017, 2018 and 2019. The ITC for small wind projects up to 100 kW expires in December 2016 [10].
U.S. DOE Loan Guarantee Program (Section 1703, Title IV of Energy Policy Act of 2005) provides loan guarantees for large scale innovative, high technology risk renewable energy projects that reduce the emission of pollutants [10].
Modified Accelerated Cost-Recovery System (MACRS) allows businesses to recover investments in qualified renewable energy technologies through depreciation deductions. A 50 percent first year bonus depreciation first provided by the Economic Stimulus Act of 2008 has been extended by the Consolidated Appropriations Act of 2016 to 2019. The bonus depreciation is scaled down to 40 percent in 2018 and 30 percent in 2019 [10].
USDA Rural Energy for America Program (REAP) promotes energy efficiency and renewable energy for agricultural producers and rural small businesses through the use of grants and loan guarantees for energy efficiency improvements and renewable energy systems. The program covers up to 25 percent of costs [10].
Clean Renewable Energy Bonds (CREBs) are tax credit bonds designed to offset the tax liability of not-for-profit entities such as public utilities, and local and state governments that, because of their structure, do not benefit from the traditional renewable energy production tax credit (PTC) [10].
33 2017 Indiana Renewable Energy Resources Study - State Utility Forecasting Group
Qualified Energy Conservation Bonds (QECBs) are qualified tax credit bonds that state, local and tribal governments may use to finance renewable energy projects and other energy conservation measures. Unlike the Clean Renewable Energy Bonds (CREBS) QECBs are not subject to U.S. Department of Treasury approval. The volume of the bonds is allocated to states in proportion to the state’s percentage of the U.S. population [10].
High Energy Cost Grant Program administered by USDA is aimed at improving the electricity supply infrastructure in rural areas having home energy costs exceeding 275 percent of the national average. Eligible infrastructure includes renewable resources generation [10, 28].
Residential Renewable Energy Tax Credit allows taxpayers to claim 30 percent of their qualifying expenditures on installation of renewable energy technologies including solar electric systems, solar water heaters, wind turbines and geothermal heat pumps [10].
Green Power Purchasing Goal requires that 30 percent of energy used by federal agencies must be obtained from renewable resources by 2025 [10].
Indiana Incentives
Net Metering Rule allows utility customers with renewable resource facilities having a
maximum capacity of 1 MW to receive a credit for net excess generation in the next billing cycle [10]. Indiana Senate Bill 309 signed into law in May 2017 made changes to the net metering rule to modify the compensation after June 30, 2022 to 1.25 times the utility’s average wholesale cost for the most recent year. Generators installed before the end of 2017 shall continue to receive full retail credit until July 1, 2047 and those installed in the years 2018 to 2022 shall receive full retail credit for their generation until June 30, 2032 [29, 30].
Renewable Energy Property Tax Exemption provides property tax exemptions for solar thermal, PV, wind, hydroelectric and geothermal systems [10].
Community Conservation Challenge Grant provides $20,000-$80,000 in grants for community energy conservation projects that reduce energy consumption or displace the use of traditional energy sources [31].
Sales and Use Tax Exemption for Electrical Generating Equipment exempts transactions involving manufacturing machinery, tools, and equipment used for the production of tangible personal property, which includes electricity, from state gross retail tax. However, only wind energy has clearly specified rules from the Department of Revenue [10].
Clean Energy Portfolio Goal sets a voluntary goal of obtaining 4 percent between 2013 and 2018, 7 percent between 2019 and 2024, and 10 percent by 2025, of electricity from clean energy sources based on 2010 retail sales. Participation in the goal makes utilities eligible for incentives that can be used to pay for the compliance projects. The deadline to apply for incentives in the 2013 to 2018 period has expired [10].
34 2017 Indiana Renewable Energy Resources Study - State Utility Forecasting Group
Northern Indiana Public Service Company (NIPSCO) offers feed-in tariff incentive rates for electricity generated from renewable resources for up to 15 years. The payment for wind turbines between from 3kW and 10kW is $0.25/kWh for projects selected in the first capacity allocation lottery (allocation 1) and $0.23/kW for subsequent ones (allocation 2). The payment for wind turbines larger than 10kW up to 200kW is $0.15/kWh for projects in allocation 1 and $0.138 for those in allocation 2 [10, 32, 33].
2.6 References 1. Alternative Energy News.
http://www.alternative-energy-news.info/technology/wind-power/wind-turbines// 2. National Renewable Energy Laboratory (NREL). Wind Powering America. Wind energy
update, January 2012. http://apps2.eere.energy.gov/wind/windexchange/pdfs/wpa/wpa_update.pdf
3. U.S. Department of Energy (U.S. DOE). Wind vision: a new era for wind in the United States. http://www.energy.gov/windvision, http://www.energy.gov/sites/prod/files/WindVision_Report_final.pdf
4. Renewable Energy Research Laboratory. University of Massachusetts at Amherst. Wind power: Capacity factor, intermittency, and what happens when the wind doesn’t blow? http://www.leg.state.vt.us/jfo/envy/Wind%20Power%20Fact%20Sheet.pdf
5. U.S.DOE.Wind Energy Technologies Office. Frequently asked questions on small wind systems. https://energy.gov/eere/wind/frequently-asked-questions-small-wind-systems
6. Renewable Resource Data Center. NREL. Wind energy resource atlas of the United States, Table 1-1. http://rredc.nrel.gov/wind/pubs/atlas/tables/1-1T.html http://rredc.nrel.gov/wind/pubs/atlas/tables/A-8T.html
7. U.S. Energy Information Administration (EIA). Cost and performance characteristics of new central station electricity generating technologies, Annual energy outlook 2017. January 2017. https://www.eia.gov/forecasts/aeo/assumptions/pdf/table_8.2.pdf
8. Lawrence Berkeley National Laboratory. 2016 Wind technologies market report. https://emp.lbl.gov/wind-technologies-market-report https://emp.lbl.gov/sites/default/files/2016_wind_technologies_market_report_final_optimized.pdf https://emp.lbl.gov/sites/default/files/2016_wtmr_data_file.xls https://emp.lbl.gov/sites/default/files/2016-wtmr-presentation-final.pdf
9. American Wind Energy Association (AWEA). U.S. Wind Industry Second Quarter Market Report. http://www.awea.org/2017-market-reports http://awea.files.cms plus.com/FileDownloads/pdfs/2Q%202017%20AWEA%20Market%20Report%20Public%20Version.pdf

35 2017 Indiana Renewable Energy Resources Study - State Utility Forecasting Group
10. Database of State Incentives for Renewables & Efficiency (DSIRE). http://www.dsireusa.org/ 11. AWEA. US wind generation reached 5.5% of the grid in 2016.
http://www.awea.org/MediaCenter/pressrelease.aspx?ItemNumber=9999 12. NREL. Estimates of windy land area and wind energy potential, by State, for areas >= 30%
capacity factor at 80m.apps2.eere.energy.gov/wind/windexchange/docs/wind_potential_80m_30percent.xlsx
13. EIA. March 2017 Electric Power Monthly Table 1.1 http://www.eia.gov/electricity/monthly/
www.eia.gov/electricity/monthly/xls/table_1_01.xlsx 14. NREL. Wind maps. http://www.nrel.gov/gis/wind.html
http://www.nrel.gov/gis/images/100m_wind/awstwspd100onoff3-1.jpg 15. Business Insider. May 22, 2017.
http://www.businessinsider.com/ge-wind-farm-block-island-2017-5 16. Cape Wind. http://www.capewind.org/ 17. The Boston Globe, January 7, 2015.
https://www.bostonglobe.com/metro/2015/01/06/major-setback-for-cape-wind-project/kggnYeAXRj03PyfIUn2iIM/story.html
18. EERE. A national offshore wind strategy: creating an offshore wind industry in the United States. http://energy.gov/eere/wind/downloads/national-offshore-wind-strategy-facilitating-development-offshore-wind-industry http://energy.gov/sites/prod/files/2016/09/f33/National-Offshore-Wind-Strategy-report-09082016.pdf
19. George Stevens. Indiana Utility Regulatory Commission. 20. Performance Services Corporation.
http://www.performanceservices.com/services/wind_power/Community_wind_project http://www.performanceservices.com/project?state=indiana
21. OpenEI, Wind for schools portal;. http://en.openei.org/wiki/Wind_for_Schools_Portal 22. City Bus Greater Lafayette.
http://www.gocitybus.com/About/Sustainability 23. Hoosier Energy. https://www.hepn.com/renewables.asp 24. Wabash Valley Power Association.
http://www.wvpa.com/producing-power/rtoiso-membership https://www.wvpa.com/power-supply-diversity/renewable-energy/
25. Indiana Municipal Power Agency 2015 Integrated Resource Plan. November 2015. 26. Indiana Office of Energy Development. Indiana wind maps & reports. http://www.in.gov/oed/2425.htm 27. DOE. Renewable Production Tax Credit (PTC). https://energy.gov/savings/renewable-electricity-production-tax-credit-ptc
36 2017 Indiana Renewable Energy Resources Study - State Utility Forecasting Group
28. U.S. Department of Agriculture, Rural Development. Grants. http://www.rd.usda.gov/programs-services/high-energy-cost-grants
29. Indiana General Assembly, 2017 Session. Senate Bill. https://iga.in.gov/legislative/2017/bills/senate/309#digest-heading
30. The Journal Gazette, June 26 2017. Holcomb signs solar energy bill. http://www.journalgazette.net/news/local/indiana/20170503/holcomb-signs-solar-energy-bill
31. Indiana Office of Energy Development. Community Conservation Challenge. https://secure.in.gov/oed/2645.htm
32. NIPSCO. March 4, 2015. http://www.nipsco.com/docs/default-source/electric-tariffs-122711-docs/rate-665
33. NIPSCO. 2017. Feed-in Tariff Program. https://www.nipsco.com/our-services/renewable-energy-projects/feed-in-tariff-program
37 2017 Indiana Renewable Energy Resources Study - State Utility Forecasting Group
3. Dedicated Energy Crops 3.1 Introduction This section discusses biomass in the form of crops grown exclusively for use as a source of energy. This is distinct from the use of organic waste and residues discussed in the section that follows (Section 4) and also from bioenergy from dual use crops such as corn and soybeans to make transportation fuels such as ethanol and biodiesel. Although biomass is already the highest source of renewable energy in the U.S., the energy crops industry is still in its infancy. In 2012 an estimated 11,264 dry tons of switchgrass and miscanthus were grown and harvested for energy conversion as compared to the 170 million dry tons of forestry byproducts (wood and wood waste) used for energy conversion in 2014 [1]. A substantial research, development, demonstration and deployment effort, led by the U.S. Department of Energy (DOE) Bioenergy Technologies Office, is under way to build a national bioenergy industry with the objective to reduce U.S. dependence on imported oil. Biomass is unique among renewable resources in that it can also be used as feedstock to produce liquid transportation fuels and industrial chemicals. This characteristic is the primary motivation behind the research on energy crops and organic waste biomass and the associated conversion technologies [2]. This research effort is detailed in the DOE report titled 2016 Billion-Ton Report: Advancing Domestic Resources for a Thriving Bioeconomy [1] and the Bioenergy Technologies Office March 2016 Multi-Year Program Plan [3]. The crops being considered and developed as dedicated energy crops can be grouped into three main categories – perennial grasses, woody crops and annual crops. Perennial grasses include switchgrass, big bluestem, Indian grass, miscanthus and sugarcane. Switchgrass, big bluestem, and Indian grass are perennial grasses that are native to North America. They are already grown in a wide range of habitats and climates for pasture, hay production, soil and water conservation, and for wildlife habitat. With proper management they can remain productive for as long as ten years. The Giant Miscanthus hybrid was developed in Japan and introduced to the U.S. as a landscape plant. The main attraction of Giant Miscanthus as an energy crop is its high level of biomass production. While a great deal of research has been done establishing its potential as an energy crop, there are still barriers to overcome before it can enter large scale commercial production. They include the development of low-cost reliable propagation methods since it is a seedless sterile hybrid. In addition there is still work to be done to identify varieties suited to given regions of the country.

38 2017 Indiana Renewable Energy Resources Study - State Utility Forecasting Group
Sugarcane is attractive as an energy crop primarily due to its ability to store sugar (sucrose) in its stem. In addition, sugarcane ethanol is used as a fuel and is recognized to cut greenhouse gas emissions more than any other biofuel. However, sugarcane is a tropical crop and significant research is still to be done to develop varieties that do well in temperate climates. Woody crops being developed as energy crops include poplars, willows, eucalyptus and southern pines. Poplars are well established trees native to North America. There are already commercial plantations of hybrid poplars (cottonwood) for the production of fiber, biofuels and for environmental remediation. High rates of biomass productivity, ease of propagation and management are cited as factors that make poplar attractive as an energy crop. The characteristics that make willows desirable as energy crops include high yields, ease of propagation and high energy content. Eucalyptus is being developed for the southern United States where it is grown for lumber. It has been grown commercially for lumber in Florida since the 1960s. Southern pines are already one of the main contributors to bioenergy in the United States. Their bark and the paper processing byproduct black liquor are used to produce energy in pulp and paper mills. The ability to grow rapidly in a wide range of sites has made the southern pine the most important and widely cultivated timber species in the U.S., mainly for lumber and pulpwood. The one annual crop being developed as an energy crop is sorghum. According to the DOE Biomass Program, although perennial crops are considered better than annual crops for energy production sustainability purposes, an annual crop serves well as a bridge for a new bioenergy processing facility as it awaits the establishment and full productivity of perennial crops. The factors that make sorghum attractive as an energy crop include its composition and high yield potential, drought resistance, water use efficiency, established production systems, and potential for genetic improvement [4]. Figure 3-1 shows the energy crops considered under the 2016 Billion-Ton Report

39 2017 Indiana Renewable Energy Resources Study - State Utility Forecasting Group
a, b, c These energy crops are studied in more detail in the 2016 Billion-Ton Report than in previous versions of the Billion-Ton Study.
Figure 3-1: Energy crops included in the 2016 Billion-Ton Report (Source: DOE [1]) Biomass, including energy crops, can be converted into energy in the following ways:
• In direct combustion the biomass is burned directly in a boiler to produce steam that can then be used to drive a turbine to generate electricity. Combustion can be done either in a dedicated biomass-only boiler or cofired with other fuels such as coal. Cofiring of biomass in coal boilers has the advantage of lowering the emission of sulfur oxides (SOx), nitrogen oxides (NOx) and net lifecycle carbon, relative to sole fired coal. However, the widespread application of cofiring with coal has been hindered by the occurrence of alkali deposits that cause slag and corrosion in boiler heat transfer surfaces in the coal boilers [5].
• In biochemical conversion processes the biomass material is broken down into sugars using either enzymes or chemical processes. These sugars are then fermented to make ethanol [6].
40 2017 Indiana Renewable Energy Resources Study - State Utility Forecasting Group
• In thermochemical conversion heat is used to break down the biomass material into intermediate products (synthetic gas) which can then be converted into fuels using heat, pressure and catalysts. Two common thermochemical processes are gasification and pyrolysis. Gasification is a high temperature conversion of solids into a flammable mixture of gases. Pyrolysis is a process of thermal decomposition of biomass at high temperatures in the absence of oxygen into charcoal, bio-oil and synthetic gas [7].
To take full advantage of the strengths of the different biomass-to-energy conversion processes, the DOE Biomass Program is funding the construction of integrated biorefineries that combine all processes in one plant and produce multiple products. By producing multiple products, the integrated biorefineries, like refineries in the petroleum industry, will be able to take advantage of the differences in feed stocks and intermediate products to maximize the value obtained from the biomass feedstock. There are currently 32 DOE funded integrated biorefinery related projects spread across the United States working to develop the various bio-processing technologies needed. Two design-scale projects are used to demonstrate the integrated technologies at bench scale before scaling them to the pilot project level. At the fifteen pilot-scale projects these technologies are verified at a scale of at least one dry metric ton a day before being passed to the demonstration-scale facilities. The demonstration scale facilities are sized to a scale sufficient to provide data and equipment specifications for the final commercial level pioneer projects. There are eight demonstration-scale and seven pioneer-scale projects spread across the United States. Table 3-1 is a list of integrated biorefinery projects [8].
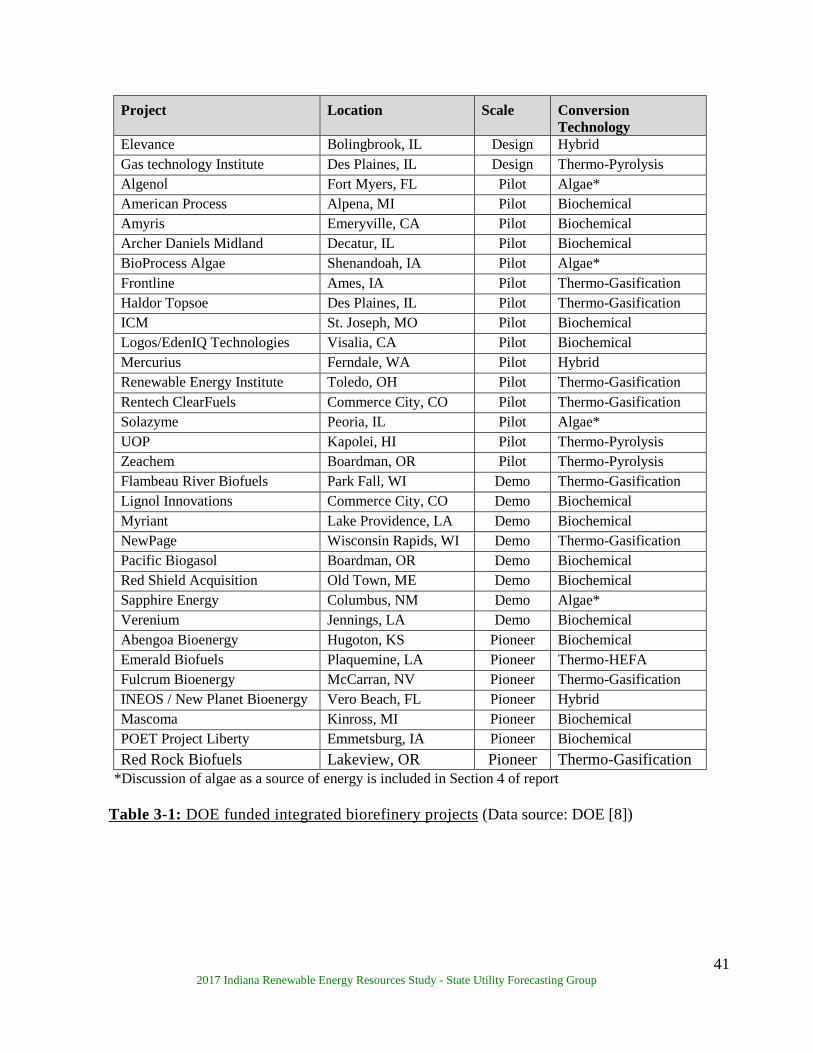
41 2017 Indiana Renewable Energy Resources Study - State Utility Forecasting Group
Project Location Scale Conversion Technology
Elevance Bolingbrook, IL Design Hybrid Gas technology Institute Des Plaines, IL Design Thermo-Pyrolysis Algenol Fort Myers, FL Pilot Algae* American Process Alpena, MI Pilot Biochemical Amyris Emeryville, CA Pilot Biochemical Archer Daniels Midland Decatur, IL Pilot Biochemical BioProcess Algae Shenandoah, IA Pilot Algae* Frontline Ames, IA Pilot Thermo-Gasification Haldor Topsoe Des Plaines, IL Pilot Thermo-Gasification ICM St. Joseph, MO Pilot Biochemical Logos/EdenIQ Technologies Visalia, CA Pilot Biochemical Mercurius Ferndale, WA Pilot Hybrid Renewable Energy Institute Toledo, OH Pilot Thermo-Gasification Rentech ClearFuels Commerce City, CO Pilot Thermo-Gasification Solazyme Peoria, IL Pilot Algae* UOP Kapolei, HI Pilot Thermo-Pyrolysis Zeachem Boardman, OR Pilot Thermo-Pyrolysis Flambeau River Biofuels Park Fall, WI Demo Thermo-Gasification Lignol Innovations Commerce City, CO Demo Biochemical Myriant Lake Providence, LA Demo Biochemical NewPage Wisconsin Rapids, WI Demo Thermo-Gasification Pacific Biogasol Boardman, OR Demo Biochemical Red Shield Acquisition Old Town, ME Demo Biochemical Sapphire Energy Columbus, NM Demo Algae* Verenium Jennings, LA Demo Biochemical Abengoa Bioenergy Hugoton, KS Pioneer Biochemical Emerald Biofuels Plaquemine, LA Pioneer Thermo-HEFA Fulcrum Bioenergy McCarran, NV Pioneer Thermo-Gasification INEOS / New Planet Bioenergy Vero Beach, FL Pioneer Hybrid Mascoma Kinross, MI Pioneer Biochemical POET Project Liberty Emmetsburg, IA Pioneer Biochemical Red Rock Biofuels Lakeview, OR Pioneer Thermo-Gasification
*Discussion of algae as a source of energy is included in Section 4 of report Table 3-1: DOE funded integrated biorefinery projects (Data source: DOE [8])
42 2017 Indiana Renewable Energy Resources Study - State Utility Forecasting Group
3.2 Economics of energy crops For large scale production of dedicated energy crops to occur, the price and profitability of the energy crops will have to be competitive with the current crops and other cropland uses. DOE, in the 2016 Billion-Ton Report, used the U.S. agricultural sector simulation model (POLYSYS) to estimate the quantities of the various energy crops that would be produced at various prices. The POLYSYS model is a detailed model of the U.S. agricultural sector that includes crop supply at the county level, national crop demand and prices, national livestock demand and prices, and agricultural income. Six types of energy crops are modeled in the POLYSYS simulation for the results presented in the 2016 Billion-Ton Report – three perennial grasses (switchgrass, miscanthus, and energy cane), an annual energy crop (biomass sorghum) and two types of short rotation woody crops, one that is rotated by coppicing7 (willow and eucalyptus) and one by other non-coppicing methods (poplar and pine). Switchgrass, miscanthus, and energy cane were modeled for 10-year, 15-year, and 7-year rotations, respectively. Hybrid poplar, pine and eucalyptus were modeled as growing on an 8-year rotation each, and willow was modeled as a coppiced crop over a 32-year period with harvest every 4 years. Figure 3-2 shows the production of herbaceous and woody energy crops under the Billion-Ton study base-case scenario8 in selected years at various farm-gate prices. At a price of $40 per dry ton energy crops do not enter the market until 2030. In 2030 they comprise approximately 21 percent of the 59 million tons of biomass offered to the market and 46 percent of the 108 million tons offered in 2040. At $60 a small of amount of biomass from energy crops enter the market in 2022. At this price 62 percent of the 388 million tons of biomass offered in 2030 to the market is from energy crops, primarily herbaceous energy crops and in 2040 seventy percent of the 588 million tons offered to the market is from energy crops. When prices increase to $80 per ton energy crops dominate the market supplying 70 percent of the biomass in 2030 and 75 percent in 2040.
7 Coppicing is a method of woody crop management that takes advantage of the property that some plants such as willows have where new growth occurs from the stump or roots when the plant is cut down. 8 The base-case scenario in the 2016 Billion-Ton Report assumes 1% energy crop yield improvements per year.

43 2017 Indiana Renewable Energy Resources Study - State Utility Forecasting Group
Figure 3-2: Production of energy crops at various farm-gate prices for select years (Source: DOE [1])
Figure 3-3 and 3-4 show the total potential availability of herbaceous and woody energy crops expected to be produced in 2022, 2030, and 2040 under the Billion-Ton study base case scenario.
Figure 3-3: Supply curves of potential herbaceous energy crop production for select years under base-case assumptions (Source: DOE [1])

44 2017 Indiana Renewable Energy Resources Study - State Utility Forecasting Group
Figure 3-4: Supply curves of potential woody energy crop production for select years under base-case assumptions9 (Source: DOE [1]) In addition to the series of Billion-Ton studies, DOE has developed a spatial web-accessible database, the Bioenergy Knowledge Discovery Framework (KDF), which brings together data from the various DOE supported bioenergy research efforts across the U.S [9]. The research projects whose data is integrated into the KDF include
• Biomass Resource Potential research prepared by the Oak Ridge National Laboratory whose results are presented in the 2016 Billion-Ton Update report referred to above,
• The Sun Grant Initiative Resource Assessment project that collects data from the energy crops field trials,
• The Feedstock Supply and Logistics Analysis research being conducted at the Idaho National Laboratory,
• The Microalgae Biofuel Potential project taking place at the Pacific Northwest National Laboratory,
• The Regional Land-Use Change Modeling project based at the Great Lakes Bioenergy Center,
• The International Projects Partnership based at the Oak Ridge National Laboratory that is working to identify areas of biodiversity concern to be avoided when planting energy crops,
9 The backward sloping supply curves in 2030 and 2040 show that at high biomass prices it is more profitable for the farmer to grow herbaceous energy crops (shown in Figure 3-3) than woody energy crops.
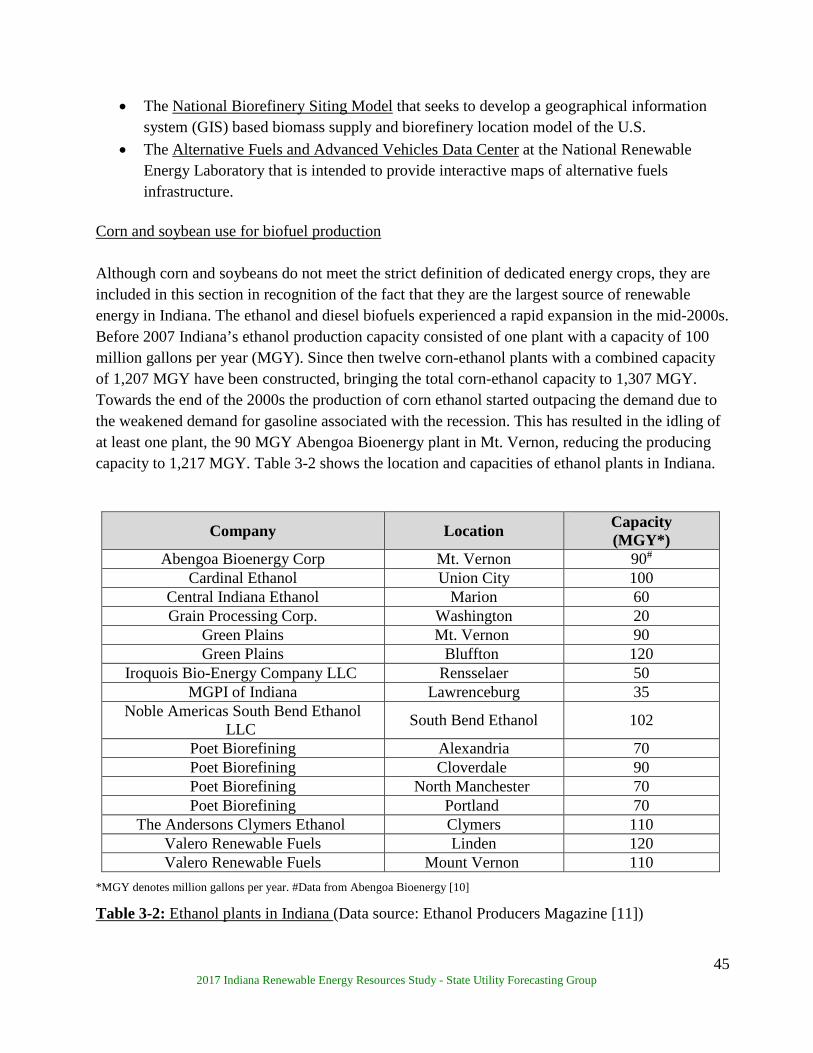
45 2017 Indiana Renewable Energy Resources Study - State Utility Forecasting Group
• The National Biorefinery Siting Model that seeks to develop a geographical information system (GIS) based biomass supply and biorefinery location model of the U.S.
• The Alternative Fuels and Advanced Vehicles Data Center at the National Renewable Energy Laboratory that is intended to provide interactive maps of alternative fuels infrastructure.
Corn and soybean use for biofuel production Although corn and soybeans do not meet the strict definition of dedicated energy crops, they are included in this section in recognition of the fact that they are the largest source of renewable energy in Indiana. The ethanol and diesel biofuels experienced a rapid expansion in the mid-2000s. Before 2007 Indiana’s ethanol production capacity consisted of one plant with a capacity of 100 million gallons per year (MGY). Since then twelve corn-ethanol plants with a combined capacity of 1,207 MGY have been constructed, bringing the total corn-ethanol capacity to 1,307 MGY. Towards the end of the 2000s the production of corn ethanol started outpacing the demand due to the weakened demand for gasoline associated with the recession. This has resulted in the idling of at least one plant, the 90 MGY Abengoa Bioenergy plant in Mt. Vernon, reducing the producing capacity to 1,217 MGY. Table 3-2 shows the location and capacities of ethanol plants in Indiana.
Company Location Capacity (MGY*)
Abengoa Bioenergy Corp Mt. Vernon 90# Cardinal Ethanol Union City 100
Central Indiana Ethanol Marion 60 Grain Processing Corp. Washington 20
Green Plains Mt. Vernon 90 Green Plains Bluffton 120
Iroquois Bio-Energy Company LLC Rensselaer 50 MGPI of Indiana Lawrenceburg 35
Noble Americas South Bend Ethanol LLC South Bend Ethanol 102
Poet Biorefining Alexandria 70 Poet Biorefining Cloverdale 90 Poet Biorefining North Manchester 70 Poet Biorefining Portland 70
The Andersons Clymers Ethanol Clymers 110 Valero Renewable Fuels Linden 120 Valero Renewable Fuels Mount Vernon 110
*MGY denotes million gallons per year. #Data from Abengoa Bioenergy [10]
Table 3-2: Ethanol plants in Indiana (Data source: Ethanol Producers Magazine [11])
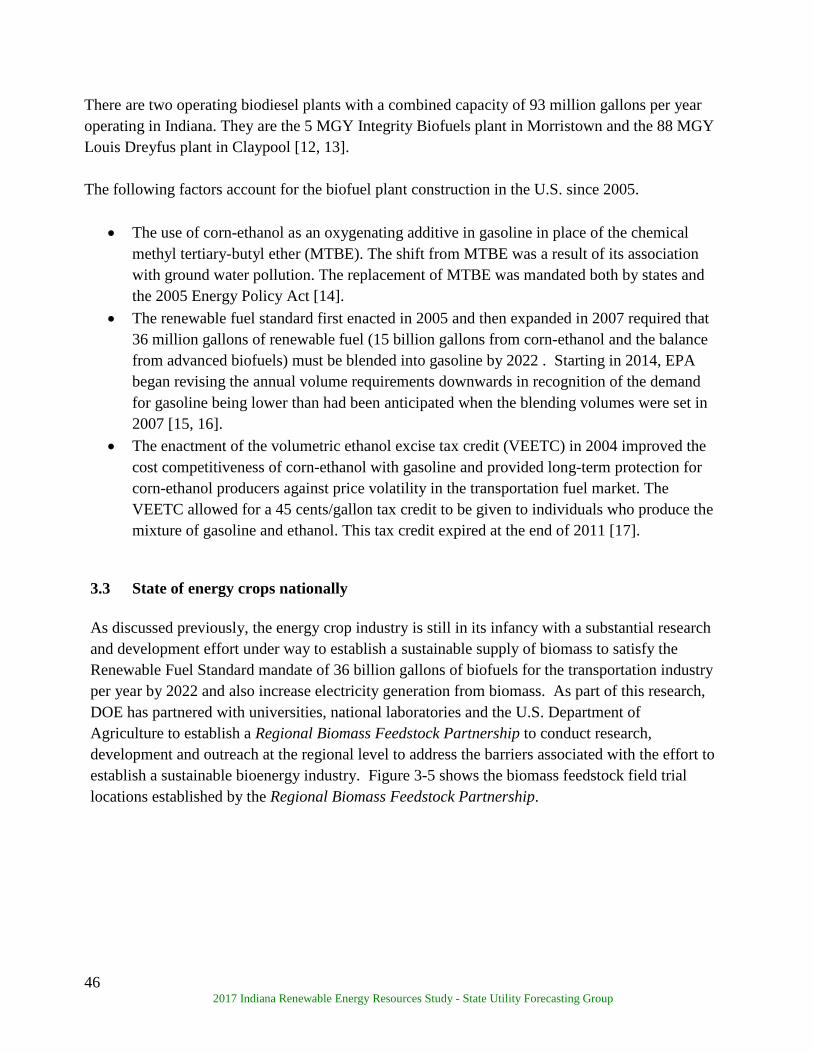
46 2017 Indiana Renewable Energy Resources Study - State Utility Forecasting Group
There are two operating biodiesel plants with a combined capacity of 93 million gallons per year operating in Indiana. They are the 5 MGY Integrity Biofuels plant in Morristown and the 88 MGY Louis Dreyfus plant in Claypool [12, 13]. The following factors account for the biofuel plant construction in the U.S. since 2005.
• The use of corn-ethanol as an oxygenating additive in gasoline in place of the chemical methyl tertiary-butyl ether (MTBE). The shift from MTBE was a result of its association with ground water pollution. The replacement of MTBE was mandated both by states and the 2005 Energy Policy Act [14].
• The renewable fuel standard first enacted in 2005 and then expanded in 2007 required that 36 million gallons of renewable fuel (15 billion gallons from corn-ethanol and the balance from advanced biofuels) must be blended into gasoline by 2022 . Starting in 2014, EPA began revising the annual volume requirements downwards in recognition of the demand for gasoline being lower than had been anticipated when the blending volumes were set in 2007 [15, 16].
• The enactment of the volumetric ethanol excise tax credit (VEETC) in 2004 improved the cost competitiveness of corn-ethanol with gasoline and provided long-term protection for corn-ethanol producers against price volatility in the transportation fuel market. The VEETC allowed for a 45 cents/gallon tax credit to be given to individuals who produce the mixture of gasoline and ethanol. This tax credit expired at the end of 2011 [17].
3.3 State of energy crops nationally As discussed previously, the energy crop industry is still in its infancy with a substantial research and development effort under way to establish a sustainable supply of biomass to satisfy the Renewable Fuel Standard mandate of 36 billion gallons of biofuels for the transportation industry per year by 2022 and also increase electricity generation from biomass. As part of this research, DOE has partnered with universities, national laboratories and the U.S. Department of Agriculture to establish a Regional Biomass Feedstock Partnership to conduct research, development and outreach at the regional level to address the barriers associated with the effort to establish a sustainable bioenergy industry. Figure 3-5 shows the biomass feedstock field trial locations established by the Regional Biomass Feedstock Partnership.
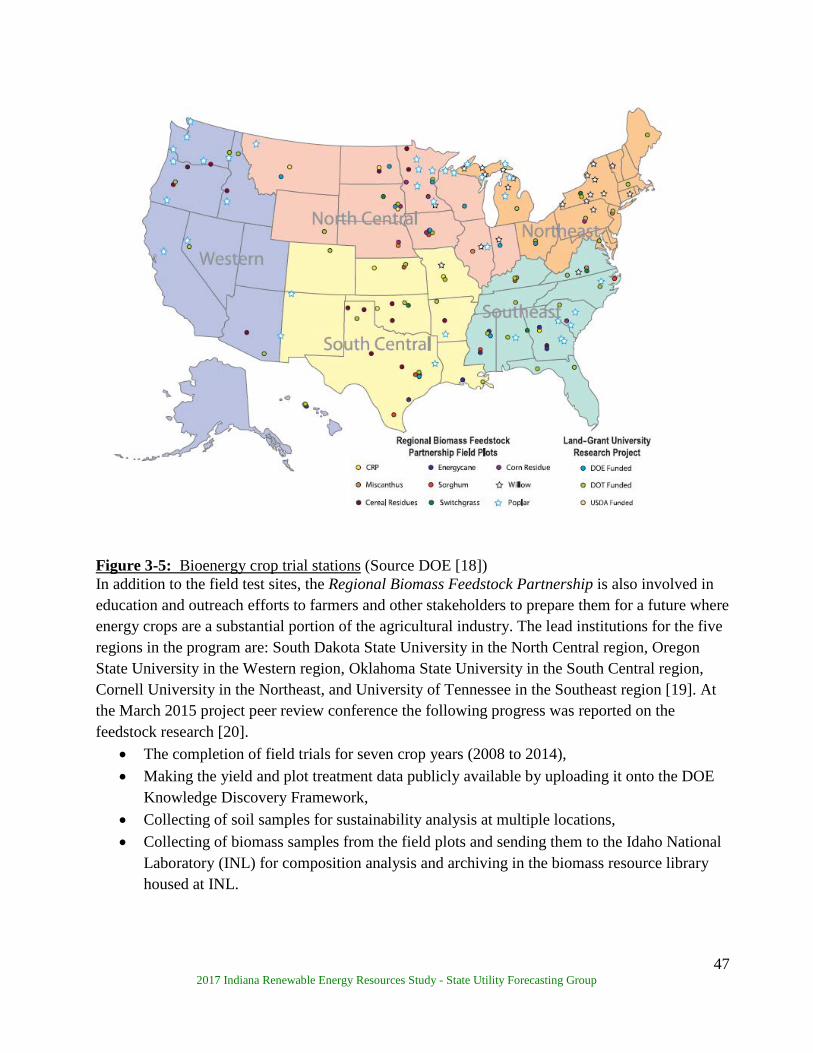
47 2017 Indiana Renewable Energy Resources Study - State Utility Forecasting Group
Figure 3-5: Bioenergy crop trial stations (Source DOE [18]) In addition to the field test sites, the Regional Biomass Feedstock Partnership is also involved in education and outreach efforts to farmers and other stakeholders to prepare them for a future where energy crops are a substantial portion of the agricultural industry. The lead institutions for the five regions in the program are: South Dakota State University in the North Central region, Oregon State University in the Western region, Oklahoma State University in the South Central region, Cornell University in the Northeast, and University of Tennessee in the Southeast region [19]. At the March 2015 project peer review conference the following progress was reported on the feedstock research [20].
• The completion of field trials for seven crop years (2008 to 2014), • Making the yield and plot treatment data publicly available by uploading it onto the DOE
Knowledge Discovery Framework, • Collecting of soil samples for sustainability analysis at multiple locations, • Collecting of biomass samples from the field plots and sending them to the Idaho National
Laboratory (INL) for composition analysis and archiving in the biomass resource library housed at INL.

48 2017 Indiana Renewable Energy Resources Study - State Utility Forecasting Group
3.4 Energy crops in Indiana The results from the DOE Billion-Ton model show Indiana and other corn-belt states such as Iowa and Illinois being major producers of agricultural crop residues such as corn stover and only a limited amount of energy crops. Figure 3-6 shows the projected pattern of biomass feedstock production by the year 2030 at a biomass farm-gate price of $60 per dry ton.
Figure 3-6: Estimated shares of energy crops and agricultural residues supplied at $60 per dry ton in 2030 (Source: DOE [4]) Figure 3-7 shows the quantities of energy crops projected to be produced in Indiana in 2030 at biomass farm-gate prices of $50, $60, $70 and $80 per dry ton. At a biomass price of $60 per dry ton, Indiana’s projected production of all energy crops combined is 1.5 million dry tons. In comparison, the amount of agricultural residue biomass produced at $60 per dry ton in 2030 is projected to be 9 million dry tons. As can be seen in the figure, perennial grasses are the preferred energy crop in Indiana, followed by woody crops. At prices above $70 per dry ton some annual crops (e.g., sorghum) enter into the crop mix.
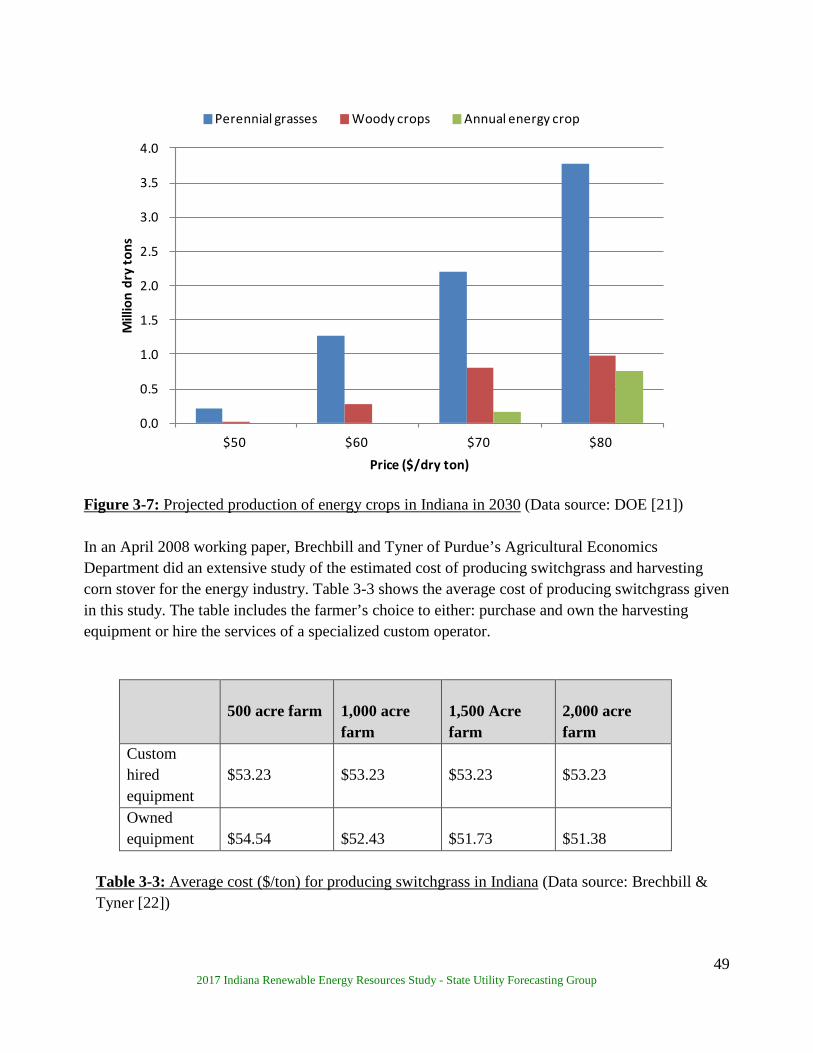
49 2017 Indiana Renewable Energy Resources Study - State Utility Forecasting Group
Figure 3-7: Projected production of energy crops in Indiana in 2030 (Data source: DOE [21])
In an April 2008 working paper, Brechbill and Tyner of Purdue’s Agricultural Economics Department did an extensive study of the estimated cost of producing switchgrass and harvesting corn stover for the energy industry. Table 3-3 shows the average cost of producing switchgrass given in this study. The table includes the farmer’s choice to either: purchase and own the harvesting equipment or hire the services of a specialized custom operator.
500 acre farm
1,000 acre farm
1,500 Acre farm
2,000 acre farm
Custom hired equipment
$53.23
$53.23
$53.23
$53.23
Owned equipment
$54.54
$52.43
$51.73
$51.38
Table 3-3: Average cost ($/ton) for producing switchgrass in Indiana (Data source: Brechbill & Tyner [22])
0.0
0.5
1.0
1.5
2.0
2.5
3.0
3.5
4.0
$50 $60 $70 $80
Mill
ion
dry
tons
Price ($/dry ton)
Perennial grasses Woody crops Annual energy crop
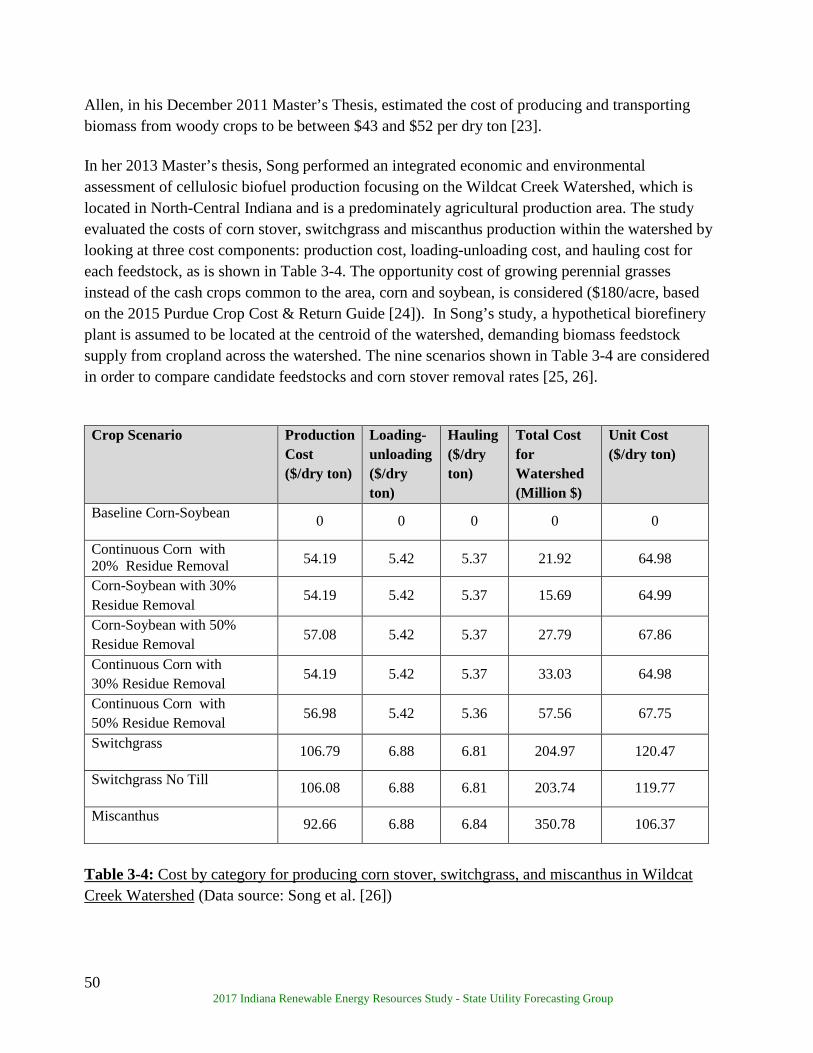
50 2017 Indiana Renewable Energy Resources Study - State Utility Forecasting Group
Allen, in his December 2011 Master’s Thesis, estimated the cost of producing and transporting biomass from woody crops to be between $43 and $52 per dry ton [23].
In her 2013 Master’s thesis, Song performed an integrated economic and environmental assessment of cellulosic biofuel production focusing on the Wildcat Creek Watershed, which is located in North-Central Indiana and is a predominately agricultural production area. The study evaluated the costs of corn stover, switchgrass and miscanthus production within the watershed by looking at three cost components: production cost, loading-unloading cost, and hauling cost for each feedstock, as is shown in Table 3-4. The opportunity cost of growing perennial grasses instead of the cash crops common to the area, corn and soybean, is considered ($180/acre, based on the 2015 Purdue Crop Cost & Return Guide [24]). In Song’s study, a hypothetical biorefinery plant is assumed to be located at the centroid of the watershed, demanding biomass feedstock supply from cropland across the watershed. The nine scenarios shown in Table 3-4 are considered in order to compare candidate feedstocks and corn stover removal rates [25, 26].
Crop Scenario Production
Cost ($/dry ton)
Loading-unloading ($/dry ton)
Hauling ($/dry ton)
Total Cost for Watershed (Million $)
Unit Cost ($/dry ton)
Baseline Corn-Soybean 0 0 0 0 0
Continuous Corn with 20% Residue Removal 54.19 5.42 5.37 21.92 64.98
Corn-Soybean with 30% Residue Removal
54.19 5.42 5.37 15.69 64.99
Corn-Soybean with 50% Residue Removal 57.08 5.42 5.37 27.79 67.86
Continuous Corn with 30% Residue Removal
54.19 5.42 5.37 33.03 64.98
Continuous Corn with 50% Residue Removal 56.98 5.42 5.36 57.56 67.75
Switchgrass 106.79 6.88 6.81 204.97 120.47
Switchgrass No Till 106.08 6.88 6.81 203.74 119.77
Miscanthus 92.66 6.88 6.84 350.78 106.37
Table 3-4: Cost by category for producing corn stover, switchgrass, and miscanthus in Wildcat Creek Watershed (Data source: Song et al. [26])
51 2017 Indiana Renewable Energy Resources Study - State Utility Forecasting Group
3.5 Incentives for energy crops The following incentives have been available to encourage the use of energy crops. Federal Incentives
Renewable Electricity Production Tax Credit (PTC) provides a 2.3 cents/kWh tax credit for
closed-loop biomass energy technologies for ten years. Dedicated energy crops fall under the closed-loop biomass category. The PTC for closed-loop biomass expired at the end of 2016, but is still available for projects that commenced construction before the end of 2016 [27].
U.S. DOE Loan Guarantee Program (Section 1703, Title IV of Energy Policy Act of 2005) provides loan guarantees for large scale innovative, high technology risk renewable energy projects that reduce the emission of pollutants [27].
Modified Accelerated Cost-Recovery System (MACRS) allows businesses to recover investments in qualified renewable energy technologies through depreciation deductions. A 50 percent first year bonus depreciation first provided for by the Economic Stimulus Act of 2008 has been extended to 2019. The bonus depreciation is reduced to 40 percent for 2018 and to 30 percent for 2019 [27].
USDA Rural Energy for America Program (REAP) promotes energy efficiency and renewable energy for agricultural producers and rural small businesses through the use of grants and loan guarantees for energy efficiency improvements and renewable energy systems. The program covers up to 25 percent of costs [27].
USDA Biorefinery Assistance Program offers loan guarantees for the development, construction or retrofitting of commercial-sized biorefineries. The program finances 80 percent of the cost of the biorefinery up to a maximum of $250 million [27].
Clean Renewable Energy Bonds (CREBs) are tax credit bonds designed to offset the tax liability of not-for-profit entities such as public utilities, and local and state governments that, because of their structure, do not benefit from the traditional renewable energy production tax credit (PTC) [27].
Qualified Energy Conservation Bonds (QECBs) are qualified tax credit bonds that state, local and tribal governments may use to finance renewable energy projects and other energy conservation measures. Unlike the Clean Renewable Energy Bonds (CREBS) QECBs are not subject to U.S. Department of Treasury approval. The volume of the bonds is allocated to states in proportion to the state’s percentage of the U.S. population [27].
High Energy Cost Grant Program administered by USDA is aimed at improving the electricity supply infrastructure in rural areas having home energy costs exceeding 275 percent of the national average. Eligible infrastructure includes renewable resources generation [27].
52 2017 Indiana Renewable Energy Resources Study - State Utility Forecasting Group
Green Power Purchasing Goal requires that 30 percent of energy used by federal agencies must be obtained from renewable resources by 2025 [27].
Indiana Incentives
Net Metering Rule allows utility customers with renewable resource facilities with a
maximum capacity of 1 MW to receive a credit for net excess generation in the next billing cycle [27]. Indiana Senate Bill 309 signed into law in May 2017 made changes to the net metering rule to modify the compensation after June 30, 2022 to 1.25 times the utility’s average wholesale cost for the most recent year. Generators installed before the end of 2017 shall continue to receive full retail credit until July 1, 2047 and those installed in the years 2018 to 2022 shall receive full retail credit for their generation until July 1, 2032 [28, 29].
Community Conservation Challenge Grant provides $20,000-$80,000 in grants for community energy conservation projects that reduce energy consumption or displace the use of traditional energy sources [30].
Sales and Use Tax Exemption for Electrical Generating Equipment exempts transactions involving manufacturing machinery, tools, and equipment used for the production of tangible personal property, which includes electricity, from state gross retail tax. However, only wind energy has clearly specified rules from the Department of Revenue [27].
Clean Energy Portfolio Goal sets a voluntary goal of obtaining 4 percent between 2013 and 2018, 7 percent between 2019 and 2024, and 10 percent by 2025, of electricity from clean energy sources based on 2010 retail sales. Participation in the goal makes utilities eligible for incentives that can be used to pay for the compliance projects. The deadline for applying for the 2013 to 2018 incentive has expired [27].
Northern Indiana Public Service Company (NIPSCO) offers feed-in tariff incentive rates for electricity generated from renewable resources for up to 15 years. The payment for biomass projects that are selected in the first lot in the capacity allocation process is $0.0918/kWh. NIPSCO was still accepting applications for the first capacity application process for biomass projects when this report was written [27, 31, 32].
3.6 References
1. U.S. Department of Energy (DOE). 2016 Billion-Ton Report: Advancing Domestic Resources for a Thriving Bioeconomy, Volume 1: Economic Availability of Feedstocks. M. H. Langholtz, B. J. Stokes, and L. M. Eaton (Leads), ORNL/TM-2016/160. Oak Ridge National Laboratory, Oak Ridge, TN. 448p. doi:10.2172/1271651 https://energy.gov/eere/bioenergy/downloads/2016-billion-ton-report-advancing-domestic-resources-thriving-bioeconomy https://energy.gov/sites/prod/files/2016/12/f34/2016_billion_ton_report_12.2.16_0.pdf
53 2017 Indiana Renewable Energy Resources Study - State Utility Forecasting Group
2. DOE. Biotechnology Office fact sheet. Reshaping American energy – a look back at BETO’s accomplishments in 2013. http://www.energy.gov/sites/prod/files/2014/03/f14/accomplishments_two_pager.pdf
3. DOE Energy Efficiency and Renewable Energy Office (EERE). Biotechnology office multi-year program plan. March 2016. http://www.energy.gov/sites/prod/files/2016/03/f30/mypp_beto_march2016_2.pdf
4. DOE. U.S. Billion-Ton Update: Biomass Supply for a Bioenergy and Bioproducts Industry, 2011. R.D. Perlack and B.J. Stokes (Leads), ORNL/TM-2011/224. Oak Ridge National Laboratory, Oak Ridge, TN. 227p. http://www1.eere.energy.gov/bioenergy/pdfs/billion_ton_update.pdf
5. EERE. Biopower technical strategy workshop summary report. http://www.energy.gov/eere/bioenergy/downloads/biopower-technical-strategy-workshop-summary-report http://www.energy.gov/sites/prod/files/2014/04/f14/biopower_workshop_report_december_2010.pdf
6. EERE. Processing and conversion http://www.energy.gov/eere/bioenergy/processing-and-conversion
7. National Renewable Energy Laboratory (NREL). Thermochemical Conversion Capabilities http://www.nrel.gov/bioenergy/thermochemical-conversion-techno-economic-analysis.html
8. EERE. Integrated biorefineries fact sheet. http://www.energy.gov/eere/bioenergy/integrated-biorefineries
9. EERE. The bioenergy knowledge discovery framework. KDF fact sheet. https://www.energy.gov/sites/prod/files/2014/03/f14/kdf_fact_sheet.pdf
10. Abengoa Bioenergy. http://www.abengoabioenergy.com/web/en/acerca_de/oficinas_e_instalaciones/bioetanol/eeuu/Indiana/index.html
11. Ethanol producer’s magazine. U.S. ethanol plants. Updated May 12, 2017. http://www.ethanolproducer.com/plants/listplants/US/Operational/All/
12. Biodiesel, America’s advanced biofuel. Updated June, 2017. http://biodiesel.org/production/plants/plants-listing
13. Louis Dreyfus Company Biodiesel. June 16, 2017. http://www.ldclaypool.com/index.cfm?show=10&mid=8
14. EIA. U.S. ethanol production and the Renewable Fuel Standard RIN bank http://www.eia.gov/todayinenergy/detail.cfm?id=11551
15. EPA. Renewable Fuel Standard. http://www.epa.gov/otaq/fuels/renewablefuels/index.htm
16. International Council on Clean Transportation. How the Renewable Fuel Standard works http://www.theicct.org/sites/default/files/publications/ICCTBriefing_RFS2_20140211.pdf
17. Transportation Policy.net. U.S. Biofuels Tax Credits http://transportpolicy.net/index.php?title=US:_Fuels:_Biofuel_tax_credits
54 2017 Indiana Renewable Energy Resources Study - State Utility Forecasting Group
18. DOE Biotechnologies Office 2015 Project Peer Review. Sun Grant/DOE Regional Biomass Feedstock Partnership: Herbaceous Energy Crops and CRP Land for Biomass Production (Award # GO85041; WBS 7.6.2.5). March 2015. https://energy.gov/sites/prod/files/2015/04/f21/terrestrial_feedstocks_owens_7625%28herbaceous%29.pdf
19. Sun Grant Initiative. https://ag.tennessee.edu/sungrantinitiative/Pages/default.aspx 20. EERE. DOE Bioenergy Technologies Office. 2015 Project Peer Review. SunGrant/DOE
Regional Biomass Feedstock Partnership (Award # GO85041; WBS 7.6.2.5). http://www.energy.gov/sites/prod/files/2015/04/f21/terrestrial_feedstocks_owens_ 7625.pdf
21. DOE. Bioenergy Knowledge Discovery Framework. https://www.bioenergykdf.net/ 22. Brechbill, S. and Tyner, W. Department of Agricultural Economics, Purdue University. The
economics of biomass collection, transportation, and supply to Indiana cellulosic and electric utility facilities. Working paper #08-03, April 2008. http://www.agecon.purdue.edu/papers http://www.agecon.purdue.edu/papers/biofuels/Working_Paper_Fina.pdf
23. Allen, B. W. An economic and emissions analysis of electricity generation using biomass feedstock in co-fired and direct fired facilities. Master of Science Thesis, Purdue University August 2011. http://gradworks.umi.com/15/02/1502105.html
24. Dobbins, C. L., Langemeier, M. R., Miller, W. A., Nielsen, B., Vyn, T. J., Casteel, S., Johnson, B., and Wise, K. 2014. 2015 Purdue crop cost & return guide. Rep., Purdue Extension, West Lafayette, IN.
25. Song, Jingyu. A Spatially Explicit Watershed Scale Optimization of Cellulosic Biofuels Production. Master of Science Thesis, Purdue University December 2013. http://docs.lib.purdue.edu/dissertations/AAI1553620/
26. Song, J., Gramig, B., Cibin, R., and Chaubey, I. 2016. Integrated economic and environmental assessment of cellulosic biofuel production in an agricultural watershed. https://link.springer.com/article/10.1007%2Fs12155-017-9817-8
27. Database of State Incentives for Renewables & Efficiency (DSIRE). http://www.dsireusa.org/ 28. Indiana General Assembly, 2017 Session. Senate Bill 309
https://iga.in.gov/legislative/2017/bills/senate/309#digest-heading 29. The Journal Gazette, June 26 2017. Holcomb signs solar energy bill.
http://www.journalgazette.net/news/local/indiana/20170503/holcomb-signs-solar-energy-bill 30. Indiana Office of Energy Development. Community Conservation Challenge.
https://secure.in.gov/oed/2645.htm 31. NIPSCO. March 4, 2015.
http://www.nipsco.com/docs/default-source/electric-tariffs-122711-docs/rate-665 32. NIPSCO. 2017. Feed-in Tariff Program. https://www.nipsco.com/our-services/renewable-
energy-projects/feed-in-tariff-program
55 2017 Indiana Renewable Energy Resources Study - State Utility Forecasting Group
4. Organic Waste Biomass 4.1 Introduction This section presents the use of biomass in the form of organic waste and residues as a source of renewable energy, as opposed to the previous section (Section 3) that presented biomass in the form of dedicated energy cops. Unlike the dedicated energy crops industry, organic waste biomass is already in widespread use as a source of renewable energy, historically being second only to hydroelectricity as the source of renewable energy consumed in the U.S. The organic waste biomass in this section is separated into two main categories: that which is in use currently as an energy source and that which is being considered for use in the future. The types of organic waste biomass already in use as energy sources include:
Residues from the forestry and wood products industry, including material left from logging, residues from the paper and pulp industry and residues from primary wood milling;
Municipal solid waste (MSW), which is the organic portion of the post-consumer waste collected in community garbage collection services;
Gas extracted from landfills, which is naturally occurring gas resulting from decomposition of landfill material;
Livestock manure, mainly from large swine and dairy farms where it is used to produce gas in bio digesters; and
Municipal wastewater, or sewage, which is used to produce gas in bio digesters.
Organic waste biomass resources that are not yet in large-scale use as energy sources, but are being considered for future use, include:
• Agricultural crop residues, such as stalks, leaves and other material left in the fields when
conventional crops such as corn are harvested; and • Aquatic plants, such as algae that have high oil content that can be converted to biodiesel.
Residues from the forestry and wood products industry and municipal solid waste are typically used to produce electricity and heat. These feed stocks are burned directly in a boiler to produce steam that is used to drive a turbine to generate electricity and/or steam that is used directly for heat.
56 2017 Indiana Renewable Energy Resources Study - State Utility Forecasting Group
The other sources of organic waste based energy that are currently in use all take advantage of the production of biogas that contains a significant percentage of methane as the waste breaks down through either natural or managed decay processes. This is the case for landfill gas, livestock manure or municipal waste water that is processed through an anaerobic digester. Anaerobic digestion of biomass waste consists of the breakdown of organic wastes by microorganisms in an oxygen deficient environment that produces biogas that can be burned as an energy source. Just like traditional fossil fuels, biogas can be used as a transportation fuel through an internal combustion engine or to generate electricity through a combustion turbine or a steam turbine. An additional benefit to converting biogas to energy is that it prevents the methane from being emitted into the atmosphere. Because methane is over 20 times more potent than carbon dioxide as a heat trapping greenhouse gas, its conversion to energy provides an added environmental benefit [1]. Biomass, including agricultural crop residues, is expected to play a significant role in the energy supply portfolio in the U.S. in the future. One of the characteristics that makes biomass a very attractive source of renewable energy is its ability to be converted both to electricity and to fuel for the transportation industry. Studies, like the DOE funded Billion-Ton Study referred to in Section 3 [2], have shown that substantial energy resources in the form of biomass from crop residues could be harvested under appropriate economic conditions. Agricultural residues have the added advantage that they do not require any further cultivation or the use of additional cropland, they therefore present a potential near-term feedstock into the bioenergy industry. According to the DOE in the 2016 Billion-Ton Report most of the cellulosic plants completed to date have focused on agricultural residues, primarily corn stover for feedstock. They include the POET-DSM plant in Emmetsburg, Iowa, the Abengoa plant in Hugoston, Kansas and the Dupont plant in Nevada, Iowa [2]. Large scale farming of algae is another area being considered as a potential source of bioenergy. Algae are simple organisms, ranging from microscopic-sized algae to seaweeds that grow to over 100 feet long. Like other plants, they utilize energy from the sun through photosynthesis to convert carbon dioxide from the air into biomass usable for energy production. Algae have several advantages over other biomass as a source of energy and especially in the production of biodiesel. These advantages include [3 - 5]:
• Algae grows more rapidly and has higher photosynthetic efficiency than other biomass; • It has a much higher oil content than other biomass (20 to 80 times more than soybeans); • It is not a food crop; • It can be grown in water with very high salt concentration that is not usable for other
agriculture; • It can be grown in otherwise non-arable land such as deserts;
57 2017 Indiana Renewable Energy Resources Study - State Utility Forecasting Group
• It has the potential for recycling of CO2 from fossil fueled power plants; and • Both biofuels and valuable co-products can be produced from algae.
Algae can be grown in either open ponds or in enclosed bioreactors. Although open pond algae farms are much more cost competitive, they have the disadvantages of being vulnerable to contamination by faster growing native algae, water loss through evaporation and exposure to extreme weather variations. Enclosed bioreactors overcome these drawbacks by growing the algae entirely enclosed in transparent containers of various forms. Not surprisingly, the enclosed bioreactors’ main disadvantage is cost; bioreactors are much more expensive to build than open ponds. One potential application for the use of algae is the coupling of an algae bioreactor with a coal power plant to allow the power plant to provide the carbon dioxide needed for algae growth. In this way a combined benefit of producing bioenergy while reducing carbon dioxide emissions is achieved. Such an experiment was conducted at the Arizona Public Service Red Hawk power plant in 2006 and 2007 [6]. The production of algae for energy is still in the development stage. The federal government through the DOE biotechnologies research office is continuing to invest in funding the research and development to develop technologies needed to economically and sustainably produce, harvest, and convert algae into biofuels with a goal of producing 5 billion gallons of algal biodiesel per year by the year 2030 [5]. 4.2 Economics of organic waste biomass Most of the current waste biomass energy is generated and consumed in the paper and pulp industry where the paper and pulp making byproducts are combusted in combined heat and power plants to supplement the electricity and steam supply of the paper and pulp mills. Several factors have combined to make the use of these residues and byproducts as an energy source economically attractive at pulp and paper mills. They include:
• The burning of the pulp making residue (black liquor) serves not only to generate energy, but also to recover process chemicals,
• The co-location of electricity and steam demand in the mills greatly increases the efficiency of the energy conversion process, and
• The ability to sell excess generation through either the favorable provisions of the Public Utility Regulatory Policies Act of 1978 or more recently through the open transmission access associated with wholesale electricity markets provides a market for times when the plant’s generation exceeds internal demand.
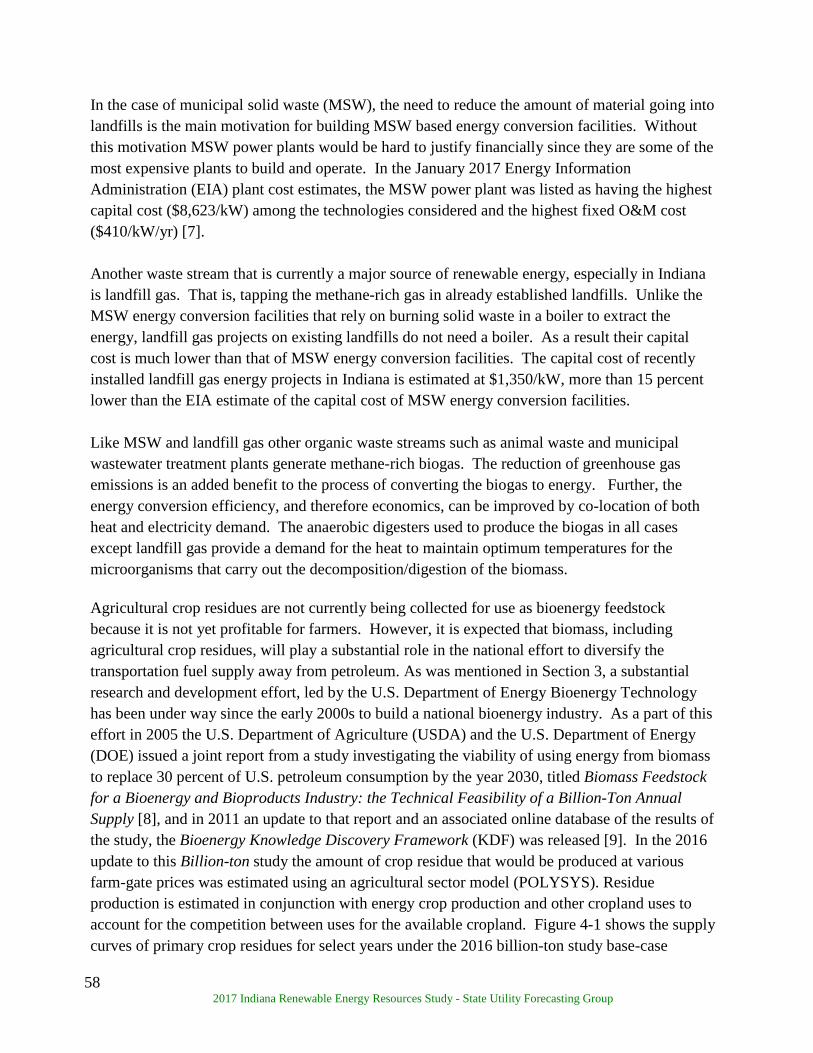
58 2017 Indiana Renewable Energy Resources Study - State Utility Forecasting Group
In the case of municipal solid waste (MSW), the need to reduce the amount of material going into landfills is the main motivation for building MSW based energy conversion facilities. Without this motivation MSW power plants would be hard to justify financially since they are some of the most expensive plants to build and operate. In the January 2017 Energy Information Administration (EIA) plant cost estimates, the MSW power plant was listed as having the highest capital cost ($8,623/kW) among the technologies considered and the highest fixed O&M cost ($410/kW/yr) [7]. Another waste stream that is currently a major source of renewable energy, especially in Indiana is landfill gas. That is, tapping the methane-rich gas in already established landfills. Unlike the MSW energy conversion facilities that rely on burning solid waste in a boiler to extract the energy, landfill gas projects on existing landfills do not need a boiler. As a result their capital cost is much lower than that of MSW energy conversion facilities. The capital cost of recently installed landfill gas energy projects in Indiana is estimated at $1,350/kW, more than 15 percent lower than the EIA estimate of the capital cost of MSW energy conversion facilities. Like MSW and landfill gas other organic waste streams such as animal waste and municipal wastewater treatment plants generate methane-rich biogas. The reduction of greenhouse gas emissions is an added benefit to the process of converting the biogas to energy. Further, the energy conversion efficiency, and therefore economics, can be improved by co-location of both heat and electricity demand. The anaerobic digesters used to produce the biogas in all cases except landfill gas provide a demand for the heat to maintain optimum temperatures for the microorganisms that carry out the decomposition/digestion of the biomass.
Agricultural crop residues are not currently being collected for use as bioenergy feedstock because it is not yet profitable for farmers. However, it is expected that biomass, including agricultural crop residues, will play a substantial role in the national effort to diversify the transportation fuel supply away from petroleum. As was mentioned in Section 3, a substantial research and development effort, led by the U.S. Department of Energy Bioenergy Technology has been under way since the early 2000s to build a national bioenergy industry. As a part of this effort in 2005 the U.S. Department of Agriculture (USDA) and the U.S. Department of Energy (DOE) issued a joint report from a study investigating the viability of using energy from biomass to replace 30 percent of U.S. petroleum consumption by the year 2030, titled Biomass Feedstock for a Bioenergy and Bioproducts Industry: the Technical Feasibility of a Billion-Ton Annual Supply [8], and in 2011 an update to that report and an associated online database of the results of the study, the Bioenergy Knowledge Discovery Framework (KDF) was released [9]. In the 2016 update to this Billion-ton study the amount of crop residue that would be produced at various farm-gate prices was estimated using an agricultural sector model (POLYSYS). Residue production is estimated in conjunction with energy crop production and other cropland uses to account for the competition between uses for the available cropland. Figure 4-1 shows the supply curves of primary crop residues for select years under the 2016 billion-ton study base-case
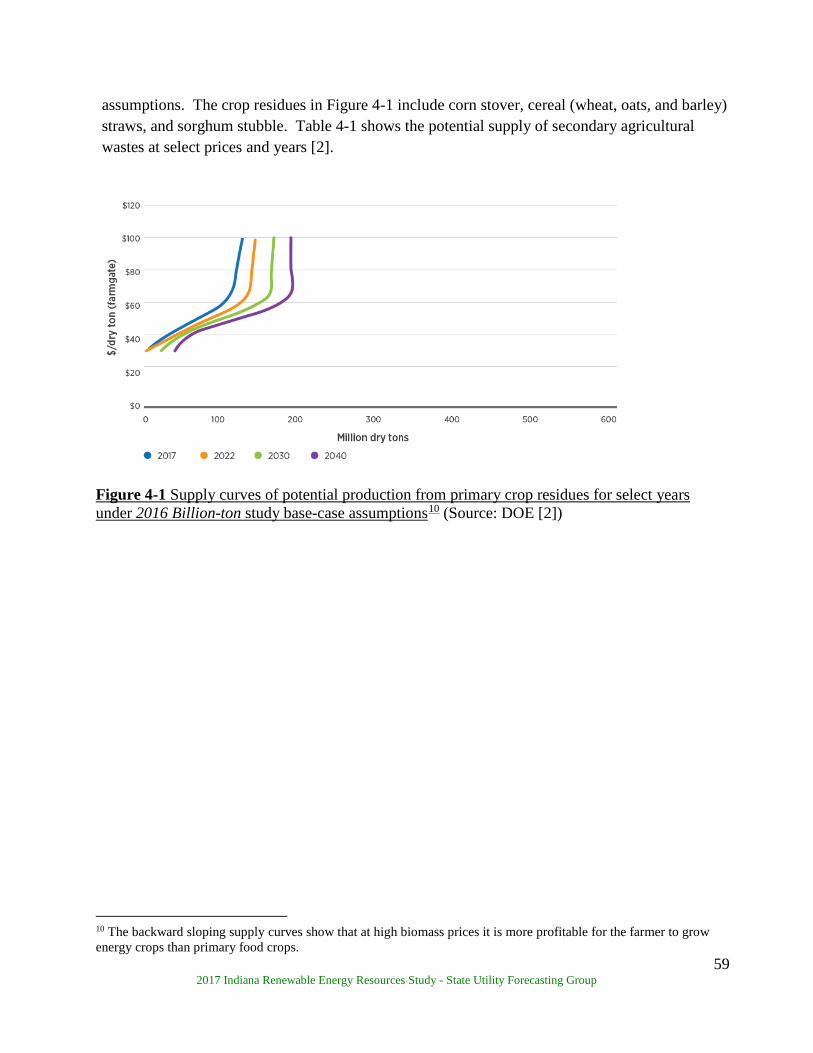
59 2017 Indiana Renewable Energy Resources Study - State Utility Forecasting Group
assumptions. The crop residues in Figure 4-1 include corn stover, cereal (wheat, oats, and barley) straws, and sorghum stubble. Table 4-1 shows the potential supply of secondary agricultural wastes at select prices and years [2].
Figure 4-1 Supply curves of potential production from primary crop residues for select years under 2016 Billion-ton study base-case assumptions10 (Source: DOE [2])
10 The backward sloping supply curves show that at high biomass prices it is more profitable for the farmer to grow energy crops than primary food crops.
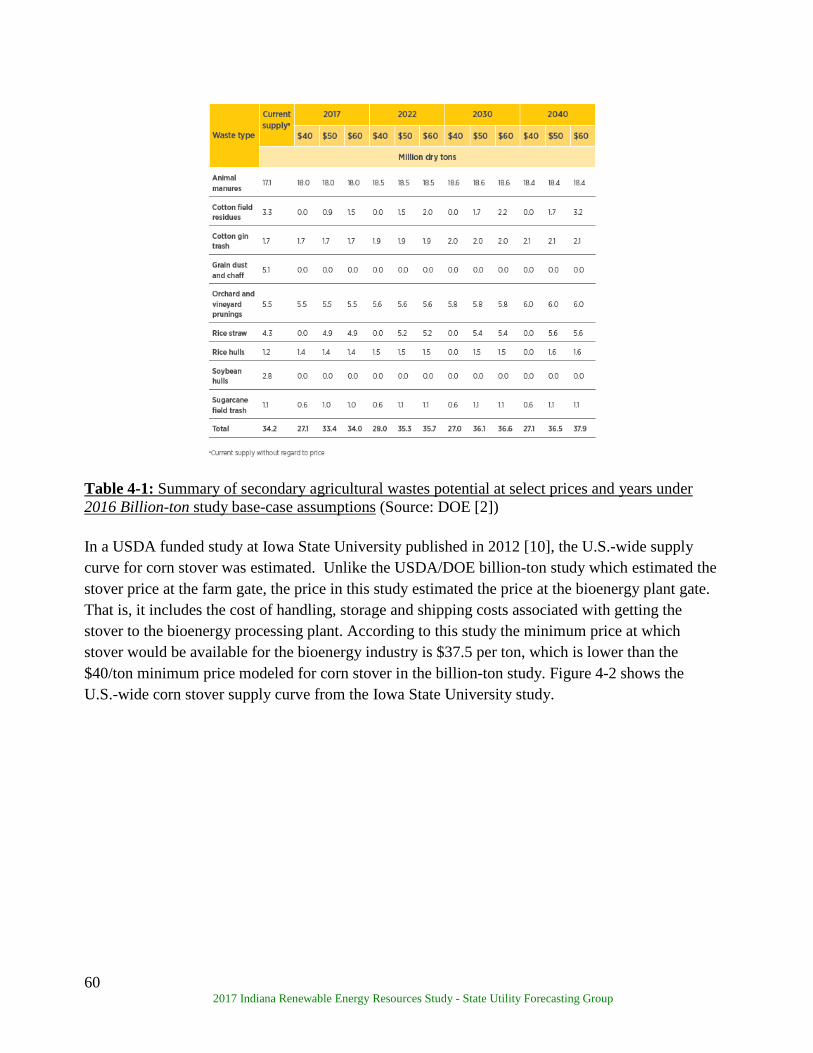
60 2017 Indiana Renewable Energy Resources Study - State Utility Forecasting Group
Table 4-1: Summary of secondary agricultural wastes potential at select prices and years under 2016 Billion-ton study base-case assumptions (Source: DOE [2]) In a USDA funded study at Iowa State University published in 2012 [10], the U.S.-wide supply curve for corn stover was estimated. Unlike the USDA/DOE billion-ton study which estimated the stover price at the farm gate, the price in this study estimated the price at the bioenergy plant gate. That is, it includes the cost of handling, storage and shipping costs associated with getting the stover to the bioenergy processing plant. According to this study the minimum price at which stover would be available for the bioenergy industry is $37.5 per ton, which is lower than the $40/ton minimum price modeled for corn stover in the billion-ton study. Figure 4-2 shows the U.S.-wide corn stover supply curve from the Iowa State University study.

61 2017 Indiana Renewable Energy Resources Study - State Utility Forecasting Group
Figure 4-2: U.S. corn stover supply curve (Source: USDA [10]) Although the concept of using algae for energy production has been proven at the laboratory level, no commercial scale sustainable production facility has been established yet. In 2009 DOE, using funds provided for by the American Recovery and Reinvestment Act of 2009, established the National Alliance for Advanced Biofuels and Bioproducts (NAABB), a consortium of industry, universities and national laboratories to advance research in various facets of the algal biofuels industry [11]. According to the NAABB final report, the consortium has developed and demonstrated, at a pilot level, technology improvements which when combined can reduce the cost of producing algal biodiesel from $240/gallon to $7.50/gallon. It still remains for this technology to be applied at a commercial scale [12]. 4.3 State of organic waste biomass nationally Historically organic waste biomass, and in particular residues from the wood products industry, has been one of the main sources of renewable energy in the U.S. As can be seen in Figure 4-3, wood and wood-derived fuels have been second only to hydroelectricity as a source of renewable energy. Until the increase in wind and biofuels in the last decade, wood and wood-derived fuels comprised nearly half of the renewable energy consumed in the U.S. In 2015 wood was relegated to fourth place as the source of renewable energy consumed in the U.S., contributing 19 percent
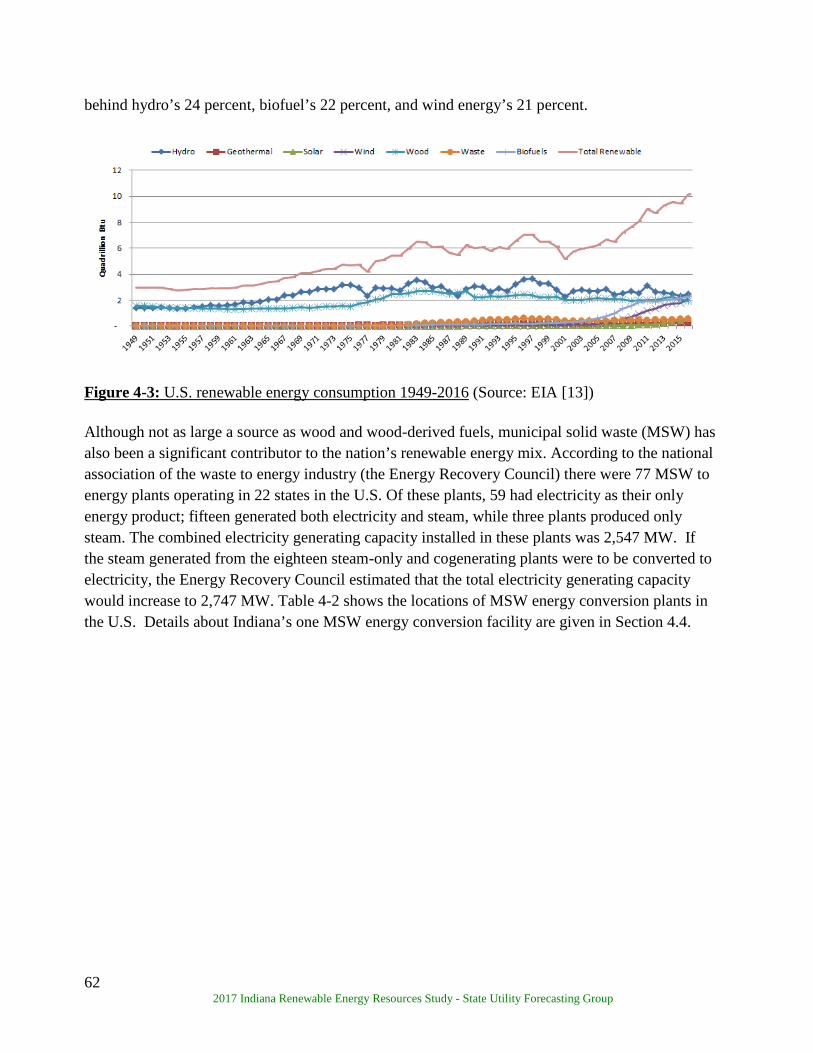
62 2017 Indiana Renewable Energy Resources Study - State Utility Forecasting Group
behind hydro’s 24 percent, biofuel’s 22 percent, and wind energy’s 21 percent.
Figure 4-3: U.S. renewable energy consumption 1949-2016 (Source: EIA [13]) Although not as large a source as wood and wood-derived fuels, municipal solid waste (MSW) has also been a significant contributor to the nation’s renewable energy mix. According to the national association of the waste to energy industry (the Energy Recovery Council) there were 77 MSW to energy plants operating in 22 states in the U.S. Of these plants, 59 had electricity as their only energy product; fifteen generated both electricity and steam, while three plants produced only steam. The combined electricity generating capacity installed in these plants was 2,547 MW. If the steam generated from the eighteen steam-only and cogenerating plants were to be converted to electricity, the Energy Recovery Council estimated that the total electricity generating capacity would increase to 2,747 MW. Table 4-2 shows the locations of MSW energy conversion plants in the U.S. Details about Indiana’s one MSW energy conversion facility are given in Section 4.4.
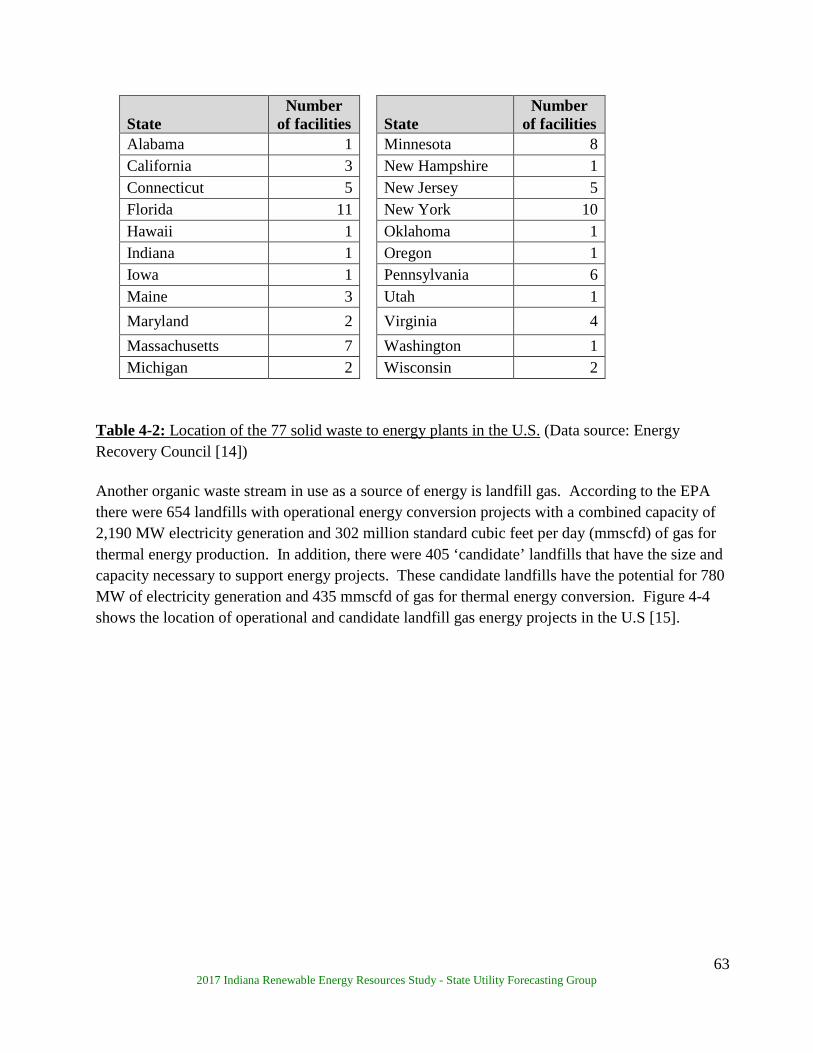
63 2017 Indiana Renewable Energy Resources Study - State Utility Forecasting Group
State Number
of facilities
State Number
of facilities Alabama 1 Minnesota 8 California 3 New Hampshire 1 Connecticut 5 New Jersey 5 Florida 11 New York 10 Hawaii 1 Oklahoma 1 Indiana 1 Oregon 1 Iowa 1 Pennsylvania 6 Maine 3 Utah 1 Maryland 2 Virginia 4 Massachusetts 7 Washington 1 Michigan 2 Wisconsin 2
Table 4-2: Location of the 77 solid waste to energy plants in the U.S. (Data source: Energy Recovery Council [14]) Another organic waste stream in use as a source of energy is landfill gas. According to the EPA there were 654 landfills with operational energy conversion projects with a combined capacity of 2,190 MW electricity generation and 302 million standard cubic feet per day (mmscfd) of gas for thermal energy production. In addition, there were 405 ‘candidate’ landfills that have the size and capacity necessary to support energy projects. These candidate landfills have the potential for 780 MW of electricity generation and 435 mmscfd of gas for thermal energy conversion. Figure 4-4 shows the location of operational and candidate landfill gas energy projects in the U.S [15].

64 2017 Indiana Renewable Energy Resources Study - State Utility Forecasting Group
Legend mmscfd – million standard cubic feet per day; MMTCO2e/yr – million metric ton of carbon dioxide-equivalent per year Figure 4-4: Landfill gas projects (Source: EPA [15]) Livestock manure is in use currently as an energy source with 274 anaerobic digester biogas recovery systems in operation on livestock farms in the U.S. as of May 2016. The majority of these digesters (209) were on dairy farms, but there were also 40 on swine farms, 10 on beef farms, 8 on poultry farms, and 7 on mixed cattle/swine farms [16]. In a 2011 report Market Opportunities for Biogas Recovery Systems at U.S. Livestock Facilities EPA estimated that there were 8,241 dairy and swine farms that could support biogas recovery systems with a combined potential electric generating capacity of 1,667 MW supplying approximately 13 million MWh of electricity per year [17]. Table 4-3 shows the top states with the potential for electricity generation from livestock farms. Biogas is more readily recovered from swine and dairy farms because the manure is handled in the wet slurry state that is hospitable to the waste-digesting microorganisms.

65 2017 Indiana Renewable Energy Resources Study - State Utility Forecasting Group
Number of Candidate
Farms
Methane Emissions Reductions (Thousand
Tons)
Methane Production Potential
(billion ft3/ year)
Energy Generation
Potential (Thousand
mmBtu/ year)
Electricity Generation
Potential (Thousand MWh/year)
Swine Farms Iowa 1,997 301 21.5 6,243 1,829 North Carolina 939 203 13.2 3,826 1,121 Minnesota 707 63 7.3 2,119 621 Illinois 350 39 4.3 1,240 363 Missouri 154 34 3.5 1,028 301 Indiana 296 31 3.5 1,011 296 Oklahoma 56 51 3.4 997 292 Nebraska 177 27 3.2 927 272 Kansas 80 22 2.3 681 199 Texas 10 25 1.6 477 140 Remaining 40 States 830 109 10.6 3,096 907
Sub Total 5,596 905 74.4 21,645 6,341 Dairy Farms California 889 341 27.9 8,104 2,375 Idaho 203 99 8.9 2,601 762 New Mexico 110 64 5.3 1,553 455 Texas 155 66 5.0 1,463 429 Wisconsin 251 41 4.5 1,316 386 Washington 125 35 3.4 1,003 294 Arizona 54 44 3.1 898 263 Michigan 107 26 2.9 838 246 New York 111 18 2.1 603 177 Colorado 54 22 2.0 595 174 Remaining 40 States 588 152 14.6 4,244 1,243
Sub Total 2,647 908 79.7 23,218 6,804 U.S. Total 8,243 1,813 154.1 44,863 13,145
Table 4-3: Top ten states for potential electricity generation from swine and dairy farms (Data source: AgStar [17])
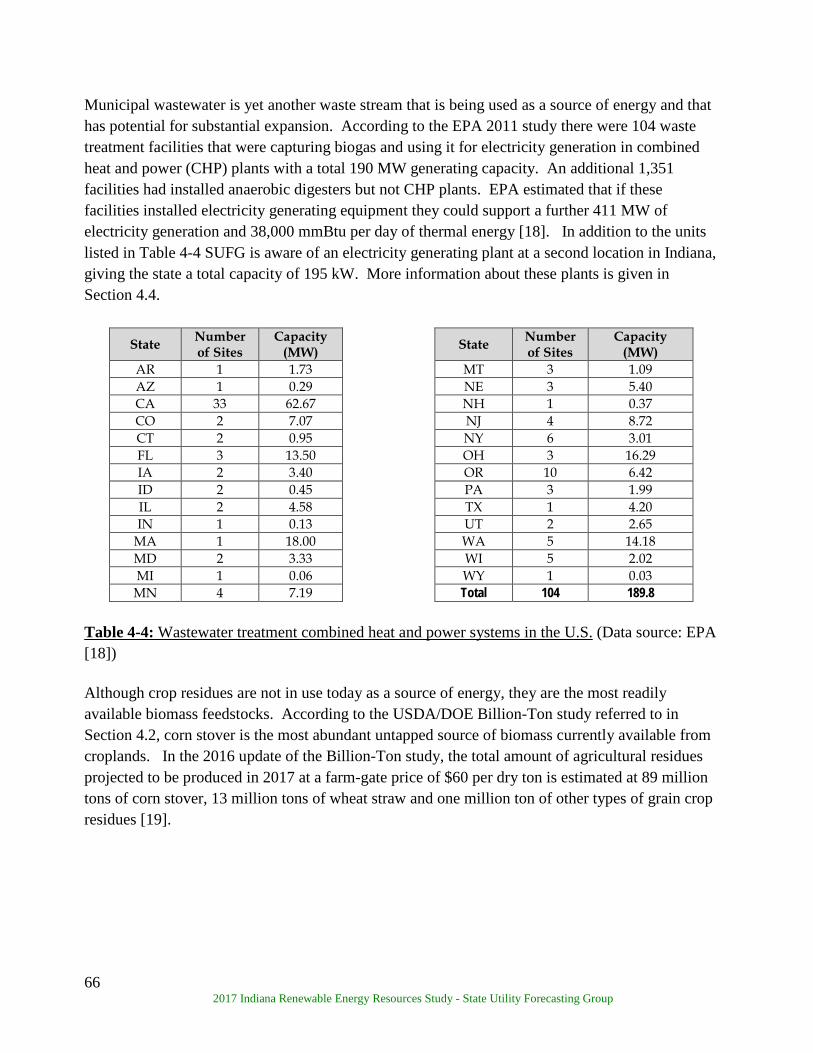
66 2017 Indiana Renewable Energy Resources Study - State Utility Forecasting Group
Municipal wastewater is yet another waste stream that is being used as a source of energy and that has potential for substantial expansion. According to the EPA 2011 study there were 104 waste treatment facilities that were capturing biogas and using it for electricity generation in combined heat and power (CHP) plants with a total 190 MW generating capacity. An additional 1,351 facilities had installed anaerobic digesters but not CHP plants. EPA estimated that if these facilities installed electricity generating equipment they could support a further 411 MW of electricity generation and 38,000 mmBtu per day of thermal energy [18]. In addition to the units listed in Table 4-4 SUFG is aware of an electricity generating plant at a second location in Indiana, giving the state a total capacity of 195 kW. More information about these plants is given in Section 4.4.
State Number of Sites
Capacity (MW) State Number
of Sites Capacity
(MW) AR 1 1.73 MT 3 1.09 AZ 1 0.29 NE 3 5.40 CA 33 62.67 NH 1 0.37 CO 2 7.07 NJ 4 8.72 CT 2 0.95 NY 6 3.01 FL 3 13.50 OH 3 16.29 IA 2 3.40 OR 10 6.42 ID 2 0.45 PA 3 1.99 IL 2 4.58 TX 1 4.20 IN 1 0.13 UT 2 2.65
MA 1 18.00 WA 5 14.18 MD 2 3.33 WI 5 2.02 MI 1 0.06 WY 1 0.03 MN 4 7.19 Total 104 189.8
Table 4-4: Wastewater treatment combined heat and power systems in the U.S. (Data source: EPA [18]) Although crop residues are not in use today as a source of energy, they are the most readily available biomass feedstocks. According to the USDA/DOE Billion-Ton study referred to in Section 4.2, corn stover is the most abundant untapped source of biomass currently available from croplands. In the 2016 update of the Billion-Ton study, the total amount of agricultural residues projected to be produced in 2017 at a farm-gate price of $60 per dry ton is estimated at 89 million tons of corn stover, 13 million tons of wheat straw and one million ton of other types of grain crop residues [19].
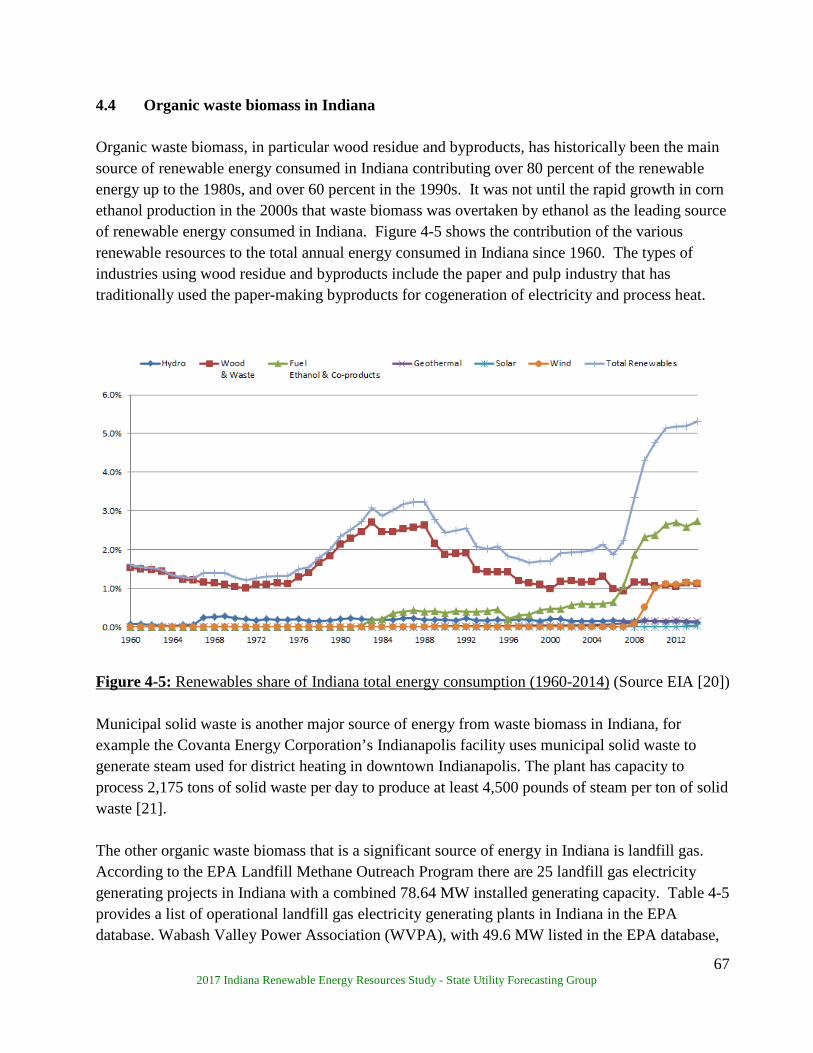
67 2017 Indiana Renewable Energy Resources Study - State Utility Forecasting Group
4.4 Organic waste biomass in Indiana Organic waste biomass, in particular wood residue and byproducts, has historically been the main source of renewable energy consumed in Indiana contributing over 80 percent of the renewable energy up to the 1980s, and over 60 percent in the 1990s. It was not until the rapid growth in corn ethanol production in the 2000s that waste biomass was overtaken by ethanol as the leading source of renewable energy consumed in Indiana. Figure 4-5 shows the contribution of the various renewable resources to the total annual energy consumed in Indiana since 1960. The types of industries using wood residue and byproducts include the paper and pulp industry that has traditionally used the paper-making byproducts for cogeneration of electricity and process heat.
Figure 4-5: Renewables share of Indiana total energy consumption (1960-2014) (Source EIA [20]) Municipal solid waste is another major source of energy from waste biomass in Indiana, for example the Covanta Energy Corporation’s Indianapolis facility uses municipal solid waste to generate steam used for district heating in downtown Indianapolis. The plant has capacity to process 2,175 tons of solid waste per day to produce at least 4,500 pounds of steam per ton of solid waste [21]. The other organic waste biomass that is a significant source of energy in Indiana is landfill gas. According to the EPA Landfill Methane Outreach Program there are 25 landfill gas electricity generating projects in Indiana with a combined 78.64 MW installed generating capacity. Table 4-5 provides a list of operational landfill gas electricity generating plants in Indiana in the EPA database. Wabash Valley Power Association (WVPA), with 49.6 MW listed in the EPA database,
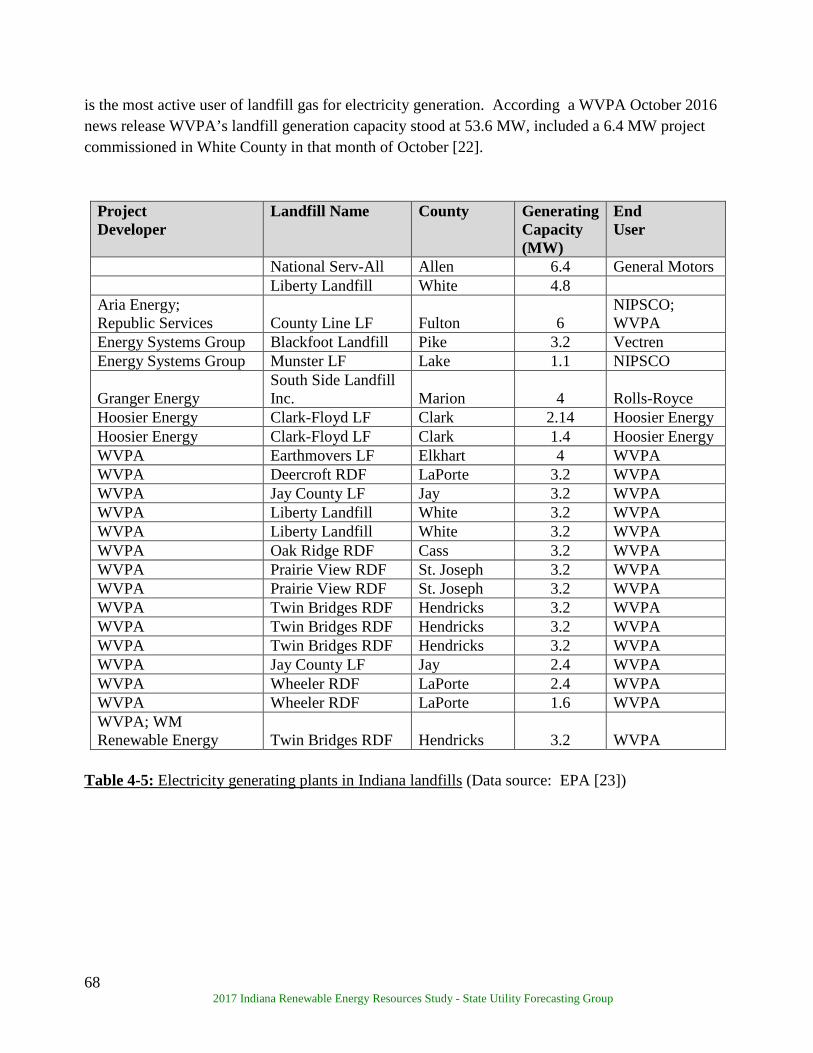
68 2017 Indiana Renewable Energy Resources Study - State Utility Forecasting Group
is the most active user of landfill gas for electricity generation. According a WVPA October 2016 news release WVPA’s landfill generation capacity stood at 53.6 MW, included a 6.4 MW project commissioned in White County in that month of October [22].
Project Developer
Landfill Name County Generating Capacity (MW)
End User
National Serv-All Allen 6.4 General Motors Liberty Landfill White 4.8 Aria Energy; Republic Services County Line LF Fulton 6
NIPSCO; WVPA
Energy Systems Group Blackfoot Landfill Pike 3.2 Vectren Energy Systems Group Munster LF Lake 1.1 NIPSCO
Granger Energy South Side Landfill Inc. Marion 4 Rolls-Royce
Hoosier Energy Clark-Floyd LF Clark 2.14 Hoosier Energy Hoosier Energy Clark-Floyd LF Clark 1.4 Hoosier Energy WVPA Earthmovers LF Elkhart 4 WVPA WVPA Deercroft RDF LaPorte 3.2 WVPA WVPA Jay County LF Jay 3.2 WVPA WVPA Liberty Landfill White 3.2 WVPA WVPA Liberty Landfill White 3.2 WVPA WVPA Oak Ridge RDF Cass 3.2 WVPA WVPA Prairie View RDF St. Joseph 3.2 WVPA WVPA Prairie View RDF St. Joseph 3.2 WVPA WVPA Twin Bridges RDF Hendricks 3.2 WVPA WVPA Twin Bridges RDF Hendricks 3.2 WVPA WVPA Twin Bridges RDF Hendricks 3.2 WVPA WVPA Jay County LF Jay 2.4 WVPA WVPA Wheeler RDF LaPorte 2.4 WVPA WVPA Wheeler RDF LaPorte 1.6 WVPA WVPA; WM Renewable Energy Twin Bridges RDF Hendricks 3.2 WVPA
Table 4-5: Electricity generating plants in Indiana landfills (Data source: EPA [23])
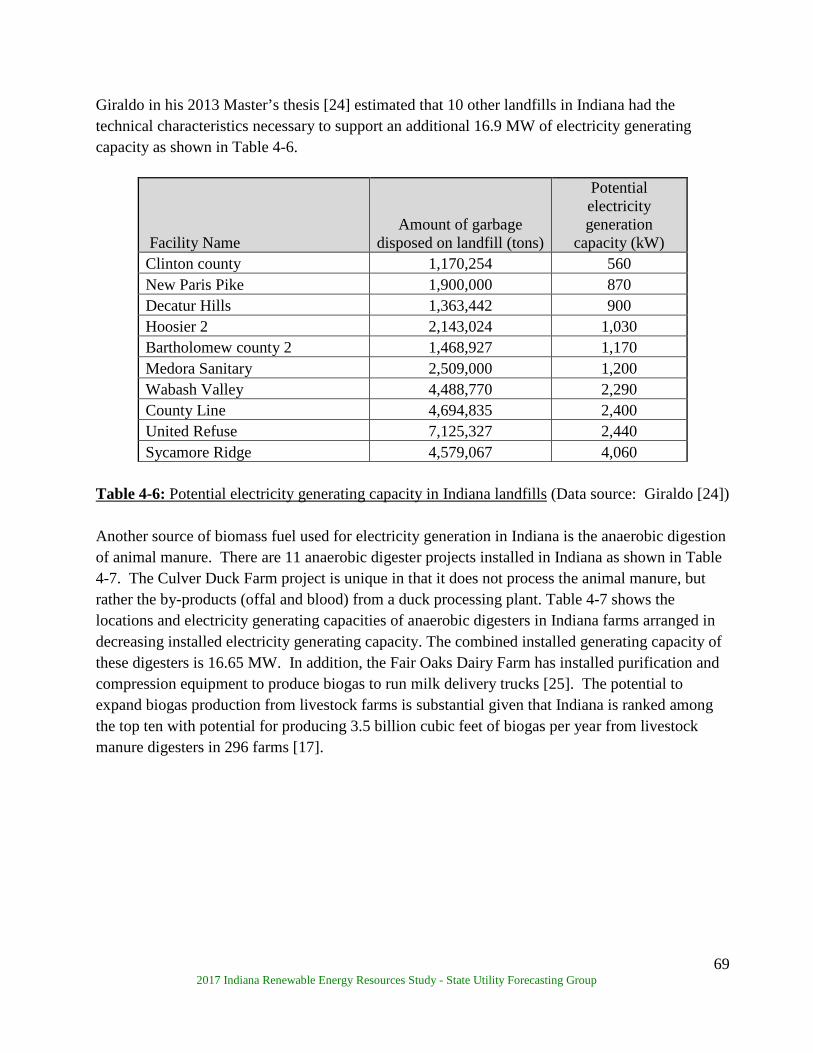
69 2017 Indiana Renewable Energy Resources Study - State Utility Forecasting Group
Giraldo in his 2013 Master’s thesis [24] estimated that 10 other landfills in Indiana had the technical characteristics necessary to support an additional 16.9 MW of electricity generating capacity as shown in Table 4-6.
Facility Name Amount of garbage
disposed on landfill (tons)
Potential electricity generation
capacity (kW) Clinton county 1,170,254 560 New Paris Pike 1,900,000 870 Decatur Hills 1,363,442 900 Hoosier 2 2,143,024 1,030 Bartholomew county 2 1,468,927 1,170 Medora Sanitary 2,509,000 1,200 Wabash Valley 4,488,770 2,290 County Line 4,694,835 2,400 United Refuse 7,125,327 2,440 Sycamore Ridge 4,579,067 4,060
Table 4-6: Potential electricity generating capacity in Indiana landfills (Data source: Giraldo [24]) Another source of biomass fuel used for electricity generation in Indiana is the anaerobic digestion of animal manure. There are 11 anaerobic digester projects installed in Indiana as shown in Table 4-7. The Culver Duck Farm project is unique in that it does not process the animal manure, but rather the by-products (offal and blood) from a duck processing plant. Table 4-7 shows the locations and electricity generating capacities of anaerobic digesters in Indiana farms arranged in decreasing installed electricity generating capacity. The combined installed generating capacity of these digesters is 16.65 MW. In addition, the Fair Oaks Dairy Farm has installed purification and compression equipment to produce biogas to run milk delivery trucks [25]. The potential to expand biogas production from livestock farms is substantial given that Indiana is ranked among the top ten with potential for producing 3.5 billion cubic feet of biogas per year from livestock manure digesters in 296 farms [17].
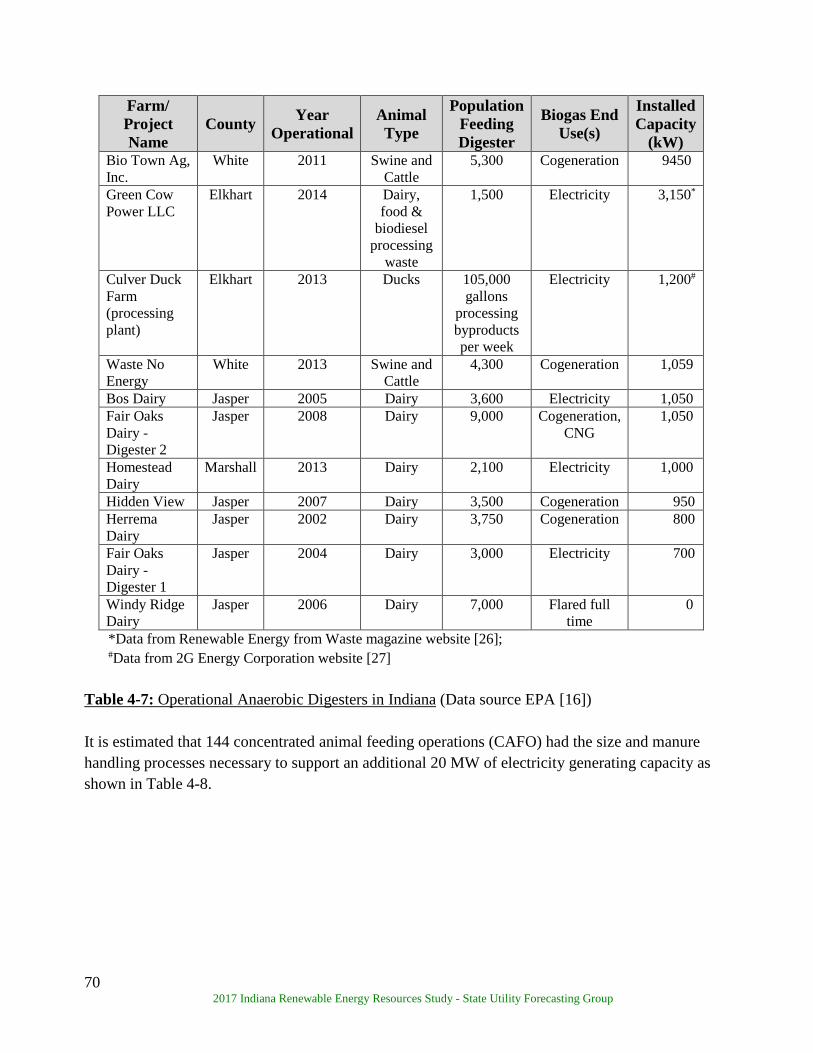
70 2017 Indiana Renewable Energy Resources Study - State Utility Forecasting Group
Farm/ Project Name
County Year Operational
Animal Type
Population Feeding Digester
Biogas End Use(s)
Installed Capacity
(kW) Bio Town Ag, Inc.
White 2011 Swine and Cattle
5,300 Cogeneration 9450
Green Cow Power LLC
Elkhart 2014 Dairy, food &
biodiesel processing
waste
1,500 Electricity 3,150*
Culver Duck Farm (processing plant)
Elkhart 2013 Ducks 105,000 gallons
processing byproducts per week
Electricity 1,200#
Waste No Energy
White 2013 Swine and Cattle
4,300 Cogeneration 1,059
Bos Dairy Jasper 2005 Dairy 3,600 Electricity 1,050 Fair Oaks Dairy - Digester 2
Jasper 2008 Dairy 9,000 Cogeneration, CNG
1,050
Homestead Dairy
Marshall 2013 Dairy 2,100 Electricity 1,000
Hidden View Jasper 2007 Dairy 3,500 Cogeneration 950 Herrema Dairy
Jasper 2002 Dairy 3,750 Cogeneration 800
Fair Oaks Dairy - Digester 1
Jasper 2004 Dairy 3,000 Electricity 700
Windy Ridge Dairy
Jasper 2006 Dairy 7,000 Flared full time
0
*Data from Renewable Energy from Waste magazine website [26]; #Data from 2G Energy Corporation website [27]
Table 4-7: Operational Anaerobic Digesters in Indiana (Data source EPA [16]) It is estimated that 144 concentrated animal feeding operations (CAFO) had the size and manure handling processes necessary to support an additional 20 MW of electricity generating capacity as shown in Table 4-8.
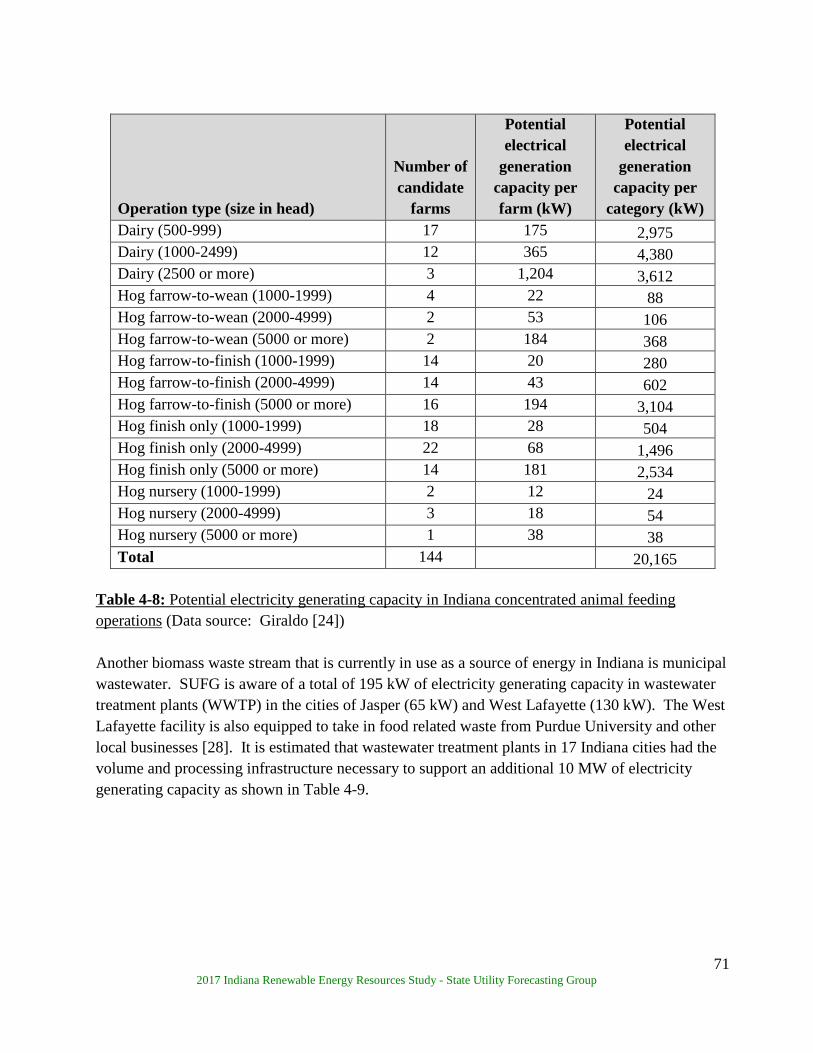
71 2017 Indiana Renewable Energy Resources Study - State Utility Forecasting Group
Operation type (size in head)
Number of candidate
farms
Potential electrical
generation capacity per farm (kW)
Potential electrical
generation capacity per
category (kW) Dairy (500-999) 17 175 2,975 Dairy (1000-2499) 12 365 4,380 Dairy (2500 or more) 3 1,204 3,612 Hog farrow-to-wean (1000-1999) 4 22 88 Hog farrow-to-wean (2000-4999) 2 53 106 Hog farrow-to-wean (5000 or more) 2 184 368 Hog farrow-to-finish (1000-1999) 14 20 280 Hog farrow-to-finish (2000-4999) 14 43 602 Hog farrow-to-finish (5000 or more) 16 194 3,104 Hog finish only (1000-1999) 18 28 504 Hog finish only (2000-4999) 22 68 1,496 Hog finish only (5000 or more) 14 181 2,534 Hog nursery (1000-1999) 2 12 24 Hog nursery (2000-4999) 3 18 54 Hog nursery (5000 or more) 1 38 38 Total 144 20,165
Table 4-8: Potential electricity generating capacity in Indiana concentrated animal feeding operations (Data source: Giraldo [24]) Another biomass waste stream that is currently in use as a source of energy in Indiana is municipal wastewater. SUFG is aware of a total of 195 kW of electricity generating capacity in wastewater treatment plants (WWTP) in the cities of Jasper (65 kW) and West Lafayette (130 kW). The West Lafayette facility is also equipped to take in food related waste from Purdue University and other local businesses [28]. It is estimated that wastewater treatment plants in 17 Indiana cities had the volume and processing infrastructure necessary to support an additional 10 MW of electricity generating capacity as shown in Table 4-9.

72 2017 Indiana Renewable Energy Resources Study - State Utility Forecasting Group
Facility name Average flow (MGD)
Potential electricity generation capacity (kW)
Noblesville WWTP 5.0 130 Speedway WWTP 5.5 143 Shelbyville WWTP 6.8 177 Elkhart WWTP 8.3 216 J.B. Gifford WWTP 8.5 221 William Edwin Ross WWTP 9.0 234 Anderson WWTP 12.0 312 Mishawaka WWTP 12.0 312 Evansville Eastside WWTP 18.0 468 Muncie WWTP 19.0 494 Lafayette WWTP 20.7 537 Terre Haute WWTP 24.0 624 Hammond WWTP 27.0 702 City of South Bend WWTP 36.0 936 Gary Sanitary District 50.0 1,300 Fort Wayne WPCP 62.0 1,612 Carmel South WWTP 95.0 2,470
Total 10,888 Table 4-9: Potential electricity generating capacity in Indiana wastewater treatment plants (Data source: Giraldo [24]) Figure 4-6 shows the amount of agricultural and forest biomass residue potentially available for energy production in Indiana in 2030 at various bioenergy feedstock prices according to the 2016 billion-study KDF database referred to earlier in this section. As can be seen in the figure, the most abundant residue available is corn stover increasing from approximately 4.9 million dry tons per year at an offer price of $50 per dry ton to 6.2 million dry tons per year at the higher price $60 per dry ton.
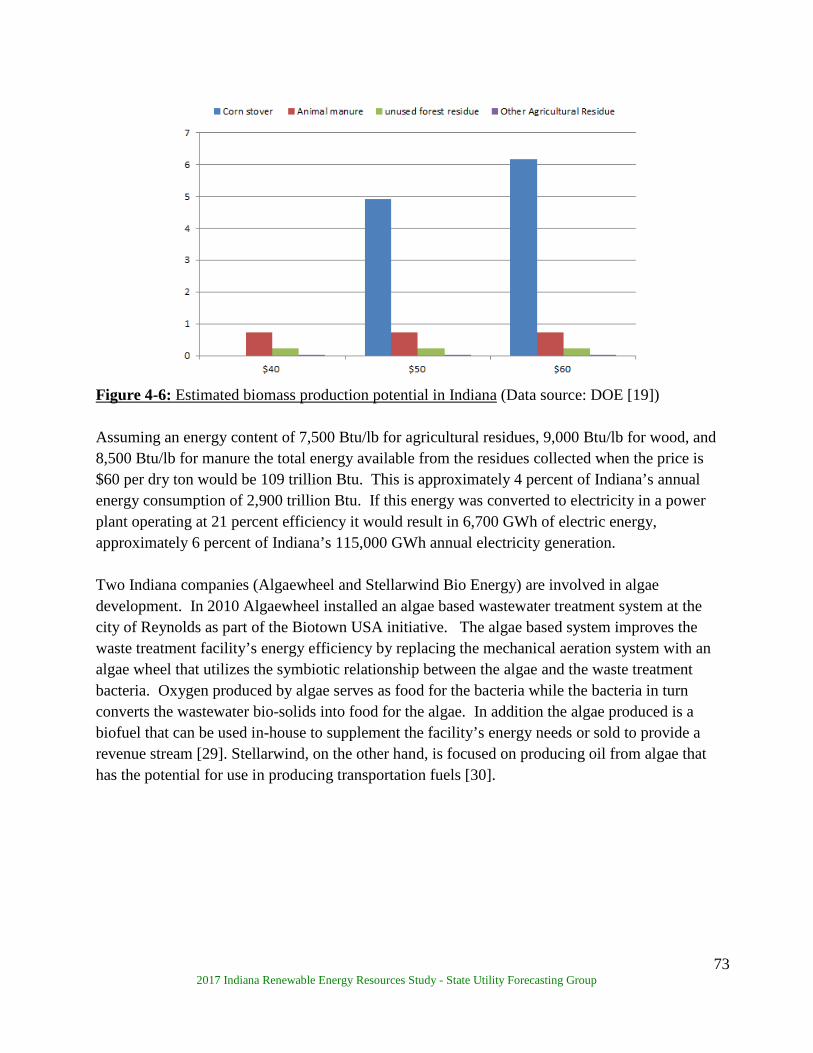
73 2017 Indiana Renewable Energy Resources Study - State Utility Forecasting Group
Figure 4-6: Estimated biomass production potential in Indiana (Data source: DOE [19]) Assuming an energy content of 7,500 Btu/lb for agricultural residues, 9,000 Btu/lb for wood, and 8,500 Btu/lb for manure the total energy available from the residues collected when the price is $60 per dry ton would be 109 trillion Btu. This is approximately 4 percent of Indiana’s annual energy consumption of 2,900 trillion Btu. If this energy was converted to electricity in a power plant operating at 21 percent efficiency it would result in 6,700 GWh of electric energy, approximately 6 percent of Indiana’s 115,000 GWh annual electricity generation. Two Indiana companies (Algaewheel and Stellarwind Bio Energy) are involved in algae development. In 2010 Algaewheel installed an algae based wastewater treatment system at the city of Reynolds as part of the Biotown USA initiative. The algae based system improves the waste treatment facility’s energy efficiency by replacing the mechanical aeration system with an algae wheel that utilizes the symbiotic relationship between the algae and the waste treatment bacteria. Oxygen produced by algae serves as food for the bacteria while the bacteria in turn converts the wastewater bio-solids into food for the algae. In addition the algae produced is a biofuel that can be used in-house to supplement the facility’s energy needs or sold to provide a revenue stream [29]. Stellarwind, on the other hand, is focused on producing oil from algae that has the potential for use in producing transportation fuels [30].

74 2017 Indiana Renewable Energy Resources Study - State Utility Forecasting Group
4.5 Incentives for organic waste biomass The following incentives have been available to assist in the use of organic waste biomass. Federal Incentives Renewable Electricity Production Tax Credit (PTC) provides 1.2 cents/kWh for open-loop
biomass, landfill gas and municipal solid waste energy technologies. Organic waste biomass falls under the open-loop category. The PTC for open-loop biomass expired on December 31, 2016 but is still available for projects whose construction was started before the end of 2016 [31].
U.S. DOE Loan Guarantee Program (Section 1703, Title IV of Energy Policy Act of 2005) provides loan guarantees for large scale innovative, high technology risk renewable energy projects that reduce the emission of pollutants [31].
Business Energy Investment Tax Credit (ITC) credits up to 30 percent of expenditures on qualified renewable energy systems. Municipal solid waste is the only biomass that qualifies for the ITC [31].
Modified Accelerated Cost-Recovery System (MACRS) allows businesses to recover investments in qualified renewable energy technologies through depreciation deductions. A 50 percent first year bonus depreciation first provided for by the Economic Stimulus Act of 2008 has been extended to 2019. The bonus depreciation is reduced to 40 percent for 2018 and to 30 percent for 2019 [31].
USDA Rural Energy for America Program (REAP) promotes energy efficiency and renewable energy for agricultural producers and rural small businesses through the use of grants and loan guarantees for energy efficiency improvements and renewable energy systems. The program covers up to 25 percent of costs [31].
USDA Biorefinery Assistance Program offers loan guarantees for the development, construction or development of commercial-sized biorefineries. The program finances 80 percent of the cost of the biorefinery up to a maximum of $250 million [31].
Clean Renewable Energy Bonds (CREBs) are tax credit bonds designed to offset the tax liability of not-for-profit entities such as public utilities, and local and state governments that, because of their structure, do not benefit from the traditional renewable energy production tax credit (PTC) [31].
Qualified Energy Conservation Bonds (QECBs) are qualified tax credit bonds that state, local and tribal governments may use to finance renewable energy projects and other energy conservation measures. Unlike the Clean Renewable Energy Bonds (CREBS) QECBs are not subject to U.S. Department of Treasury approval. The bonds are allocated to states in proportion to the state’s percentage of the U.S. population [31].

75 2017 Indiana Renewable Energy Resources Study - State Utility Forecasting Group
High Energy Cost Grant Program administered by USDA is aimed at improving the electricity supply infrastructure in rural areas having home energy costs exceeding 275 percent of the national average. Eligible infrastructure includes renewable resources generation [31].
Green Power Purchasing Goal requires that 30 percent of energy used by federal agencies must be obtained from renewable resources by 2025 [31].
Indiana Incentives
Net Metering Rule allows utility customers with renewable resource facilities with a
maximum capacity of 1 MW to receive a credit for net excess generation in the next billing cycle [31]. Indiana Senate Bill 309 signed into law in May 2017 made changes to the net metering rule to modify the compensation after June 30, 2022 to 1.25 times the utility’s average wholesale cost for the most recent year. Generators installed before the end of 2017 shall continue to receive full retail credit until July 1, 2047 and those installed in the years 2018 to 2022 shall receive full retail credit for their generation until July 1, 2032 [32, 33].
Community Conservation Challenge Grant provides $20,000-$80,000 in grants for community energy conservation projects that reduce energy consumption or displace the use of traditional energy sources [34].
Sales and Use Tax Exemption for Electrical Generating Equipment exempts transactions involving manufacturing machinery, tools, and equipment used for the production of tangible personal property, which includes electricity, from state gross retail tax. However, only wind energy has clearly specified rules from the Department of Revenue [31].
Clean Energy Portfolio Goal sets a voluntary goal of obtaining 4 percent between 2013 and 2018, 7 percent between 2019 and 2024, and 10 percent by 2025, of electricity from clean energy sources based on 2010 retail sales. Participation in the goal makes utilities eligible for incentives that can be used to pay for the compliance projects. The deadline to apply for incentives in the 2013 to 2018 period has expired [31].
Northern Indiana Public Service Company (NIPSCO) offers feed-in tariff incentive rates for electricity generated from renewable resources for up to 15 years. The payment for biomass projects that are selected in the first lot in the capacity allocation process is $0.0918/kWh [31, 35, 36].
76 2017 Indiana Renewable Energy Resources Study - State Utility Forecasting Group
4.6 References
1. U.S. Environmental Protection Agency (EPA). Overview of Greenhouse Gases. https://www.epa.gov/ghgemissions/overview-greenhouse-gases
2. DOE. 2016. 2016 Billion-Ton Report: Advancing Domestic Resources for a Thriving Bioeconomy, Volume 1: Economic Availability of Feedstocks. M. H. Langholtz, B. J. Stokes, and L. M. Eaton (Leads), ORNL/TM-2016/160. Oak Ridge National Laboratory, Oak Ridge, TN. 448p. https://energy.gov/eere/bioenergy/downloads/2016-billion-ton-report-advancing-domestic-resources-thriving-bioeconomy https://energy.gov/sites/prod/files/2016/12/f34/2016_billion_ton_report_12.2.16_0.pdf
3. National Renewable Energy Laboratory (NREL). A look back at the U.S. Department of Energy’s aquatic species program: Biodiesel from algae. 1998. http://www.nrel.gov/docs/legosti/fy98/24190.pdf
4. U.S. Department of Energy (DOE). National algal biofuels technology roadmap. May 2010. https://www1.eere.energy.gov/bioenergy/pdfs/algal_biofuels_roadmap.pdf
5. DOE Biotechnologies Office. Algal biofuelsfact sheet. September 2014 http://energy.gov/sites/prod/files/2014/09/f18/algal_biofuels_factsheet.pdf
6. Greentechmedia. http://www.greentechmedia.com/articles/read/aps-gets-70.5m-to-feed-captured-carbon-to-algae
7. Energy Information Administration (EIA). Annual Energy Outlook 2017 Table 8.2. Cost and performance characteristics of new generating technologies. January 2017. https://www.eia.gov/forecasts/aeo/assumptions/pdf/table_8.2.pdf
8. DOE and U.S. Department of Agriculture (USDA). Biomass as feedstock for a bioenergy and bioproducts industry: the technical feasibility of a billion-ton annual supply. April 2005. https://www1.eere.energy.gov/bioenergy/pdfs/final_billionton_vision_report2.pdf
9. DOE. 2011 U.S. Billion-Ton Update: Biomass Supply for a Bioenergy and Bioproducts Industry. R.D. Perlack and B.J. Stokes (Leads), ORNL/TM-2011/224. Oak Ridge National Laboratory, Oak Ridge, TN. 448p. doi:10.2172/1271651. https://www.energy.gov/sites/prod/files/2015/01/f19/billion_ton_update_0.pdf
10. USDA. Biomass supply from corn residues: estimates and critical review of procedures http://www.usda.gov/oce/reports/ http://www.usda.gov/oce/reports/energy/Biomass%20Supply%20From%20Corn%20Residues-Nov-2012.pdf
11. DOE Biotechnologies Office. National Alliance for Advanced Biofuels and Bioproducts Synopsis (NAABB) Final Report. June 2014 http://www.energy.gov/eere/bioenergy/downloads/national-alliance-advanced-biofuels-and-bioproducts-synopsis-naabb-final
12. National Alliance for Advanced Biofuels and Bioproducts (NAABB). Synopsis. Final report. June 2014. http://www.energy.gov/sites/prod/files/2014/07/f18/naabb_synopsis_report_0.pdf
13. EIA. April 2017 Monthly Energy Review Table 10.1 https://www.eia.gov/totalenergy/data/monthly/#renewable
77 2017 Indiana Renewable Energy Resources Study - State Utility Forecasting Group
14. Energy Recovery Council. 2016 directory of waste-to-energy facilities http://energyrecoverycouncil.org/wp-content/uploads/2016/05/ERC-2016-directory.pdf
15. EPA. Landfill Methane Outreach Program. https://www.epa.gov/lmop/landfill-gas-energy-project-data-and-landfill-technical-data#states
16. EPA, AgStar. Biogas recovery in the agriculture sector. https://www.epa.gov/agstar https://www.epa.gov/agstar/livestock-anaerobic-digester-database
17. AgStar. Market opportunities for biogas recovery systems at U.S. livestock facilities. https://www.epa.gov/sites/production/files/2014-12/documents/biogas_recovery_systems_screenres.pdf
18. EPA Combined Heat and Power Partnership, Opportunities for combined heat and power at wastewater treatment facilities: market analysis and lessons learned. https://www.epa.gov/chp/opportunities-combined-heat-and-power-wastewater-treatment-facilities-market-analysis-and
19. DOE. Bioenergy Knowledge Discovery Framework, Billion-ton 2016 Data Explorer. https://bioenergykdf.net/content/billion-ton-2016-data-explorer
20. EIA. State Energy Data System (SEDS). Table CT2. Primary Energy Consumption Estimates, 1960-2014, Indiana. https://www.eia.gov/state/seds/data.php?incfile=/state/seds/sep_use/total/use_tot_INcb.html&sid=IN
21. Covanta Energy Corporation. https://www.covanta.com/Our-Facilities/Covanta-Indianapolis
22. Wabash Valley Power Association. October 31, 2017 news release. https://www.wvpa.com/wabash-valley-power-dedicates-16th-landfill-gas-energy-project/.
23. EPA. Landfill Methane Outreach Program (LMOP). https://www.epa.gov/lmop/landfill-gas-energy-project-data-and-landfill-technical-data https://www.epa.gov/sites/production/files/2017-02/opprjslmopdata.xlsx
24. Juan S. Giraldo. An economic analysis of electricity generation potential from biogas resources in the state of Indiana. Master of Science Thesis, Purdue University May 2013. http://search.proquest.com/docview/1436218937?pq-origsite=gscholar http://www.purdue.edu/discoverypark/energy/assets/pdfs/SUFG/publications/SUFG_Biogas.
pdf 25. EPA. Fair Oaks Dairy Digester. https://www.epa.gov/sites/production/files/2014-
12/documents/fair_oaks_agstar_site_profile_508_022614.pdf 26. Waste Today Magazine
http://www.wastetodaymagazine.com/ https://www.rewmag.com/article/green-cow-power-converting-farm-waste-dvo-digesters/
27. 2G Energy. Culver Ducks Farm Project. http://www.2g-energy.com/projects/culver-duck-farms-inc/
78 2017 Indiana Renewable Energy Resources Study - State Utility Forecasting Group
28. West Lafayette wastewater treatment plant. http://www.westlafayette.in.gov/department/division.php?structureid=188
29. AlgaeWheel North America. http://www.algaewheel.com/ https://www.purdue.edu/discoverypark/energy/assets/pdfs/energy-camp-presentations/Biotown%20Tour_AlgaeWheel__Presentation.pdf
30. Stellarwind Bio Energy LLC. http://www.oilgae.com/blog/2009/03/stellarwind-bioenergy-oil-from-algae.html
31. Database of State Incentives for Renewables and Efficiency (DSIRE). http://www.dsireusa.org/
32. Indiana General Assembly, 2017 Session. Senate Bill 309 https://iga.in.gov/legislative/2017/bills/senate/309#digest-heading
33. The Journal Gazette, June 26 2017. Holcomb signs solar energy bill. http://www.journalgazette.net/news/local/indiana/20170503/holcomb-signs-solar-energy-bill
34. Indiana Office of Energy Development. Community Conservation Challenge. https://secure.in.gov/oed/2645.htm
35. NIPSCO. March 4, 2015. http://www.nipsco.com/docs/default-source/electric-tariffs-122711-docs/rate-665.
36. NIPSCO. 2017. Feed-in Tariff Program. https://www.nipsco.com/our-services/renewable-energy-projects/feed-in-tariff-program

79 2017 Indiana Renewable Energy Resources Study - State Utility Forecasting Group
5. Solar Energy 5.1 Introduction Solar energy is captured and converted into various forms of energy in two main ways: directly to electricity using photovoltaic cells and indirectly using solar thermal conversion technologies. The two conversion methods and associated technologies are presented in this report, starting with solar thermal conversion technologies in this section followed by photovoltaic cells in Section 6. Solar thermal energy is captured using solar collectors, of which there are two main types: concentrating and non-concentrating collectors. Concentrating collectors use mirrors of various configurations to focus the solar energy onto a receiver containing a working fluid that is used to transfer the heat to a conversion engine. Concentrating collectors are typically used for electricity generating projects while non-concentrating collectors are typically used for applications such as water and space heating. The most commonly used non-concentrating collectors are flat-plate designs. Flat-plate collectors consist of a flat-plate absorber, a transparent cover that allows solar energy to pass through while reducing heat loss, a heat-transport fluid flowing through tubes, and a heat insulating backing. Figure 5-1 shows the basic components of a flat-plate collector. Other non-concentrating collectors include evacuated-tube collectors and integral collector-storage systems [1].
Figure 5-1: Cross-section layout of a flat-plate collector (Source: SolarServer [1])
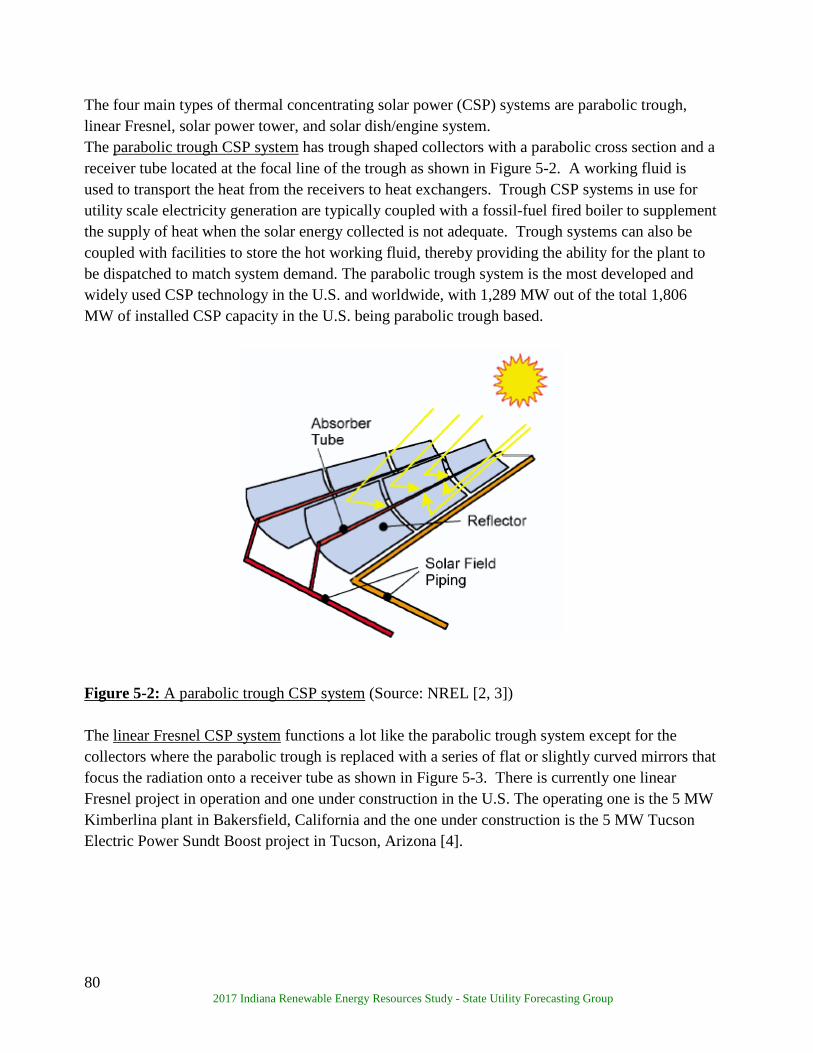
80 2017 Indiana Renewable Energy Resources Study - State Utility Forecasting Group
The four main types of thermal concentrating solar power (CSP) systems are parabolic trough, linear Fresnel, solar power tower, and solar dish/engine system. The parabolic trough CSP system has trough shaped collectors with a parabolic cross section and a receiver tube located at the focal line of the trough as shown in Figure 5-2. A working fluid is used to transport the heat from the receivers to heat exchangers. Trough CSP systems in use for utility scale electricity generation are typically coupled with a fossil-fuel fired boiler to supplement the supply of heat when the solar energy collected is not adequate. Trough systems can also be coupled with facilities to store the hot working fluid, thereby providing the ability for the plant to be dispatched to match system demand. The parabolic trough system is the most developed and widely used CSP technology in the U.S. and worldwide, with 1,289 MW out of the total 1,806 MW of installed CSP capacity in the U.S. being parabolic trough based.
Figure 5-2: A parabolic trough CSP system (Source: NREL [2, 3]) The linear Fresnel CSP system functions a lot like the parabolic trough system except for the collectors where the parabolic trough is replaced with a series of flat or slightly curved mirrors that focus the radiation onto a receiver tube as shown in Figure 5-3. There is currently one linear Fresnel project in operation and one under construction in the U.S. The operating one is the 5 MW Kimberlina plant in Bakersfield, California and the one under construction is the 5 MW Tucson Electric Power Sundt Boost project in Tucson, Arizona [4].
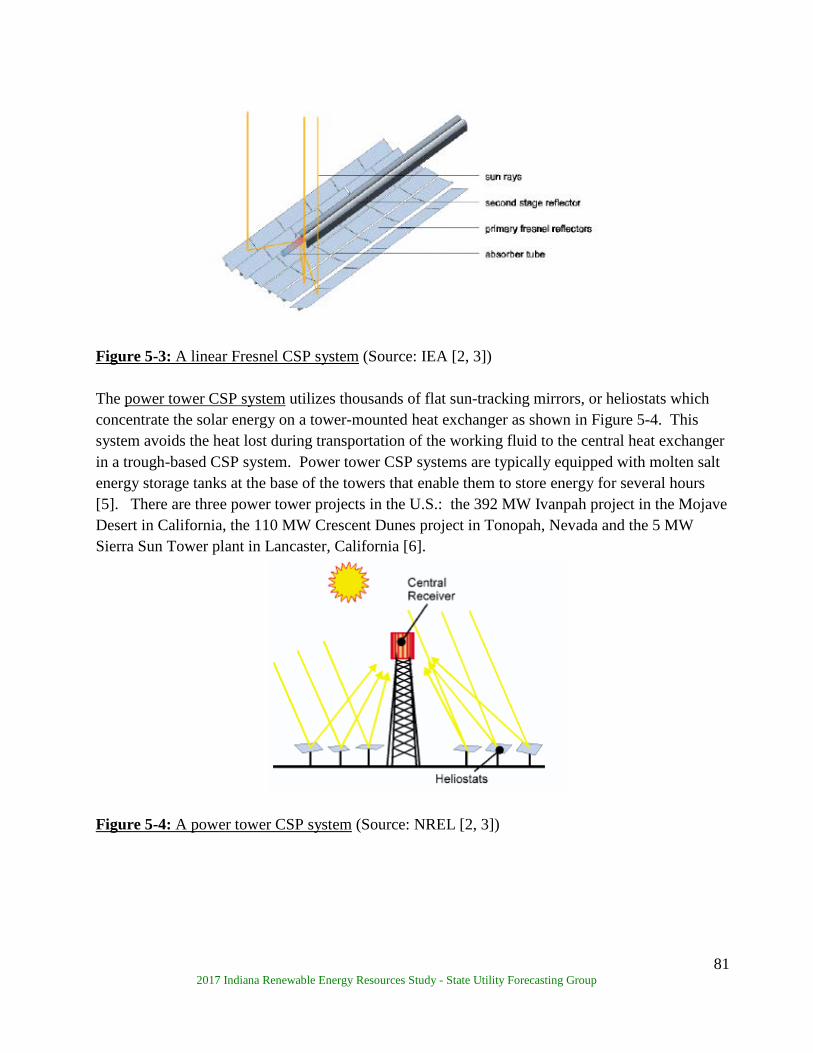
81 2017 Indiana Renewable Energy Resources Study - State Utility Forecasting Group
Figure 5-3: A linear Fresnel CSP system (Source: IEA [2, 3])
The power tower CSP system utilizes thousands of flat sun-tracking mirrors, or heliostats which concentrate the solar energy on a tower-mounted heat exchanger as shown in Figure 5-4. This system avoids the heat lost during transportation of the working fluid to the central heat exchanger in a trough-based CSP system. Power tower CSP systems are typically equipped with molten salt energy storage tanks at the base of the towers that enable them to store energy for several hours [5]. There are three power tower projects in the U.S.: the 392 MW Ivanpah project in the Mojave Desert in California, the 110 MW Crescent Dunes project in Tonopah, Nevada and the 5 MW Sierra Sun Tower plant in Lancaster, California [6].
Figure 5-4: A power tower CSP system (Source: NREL [2, 3])
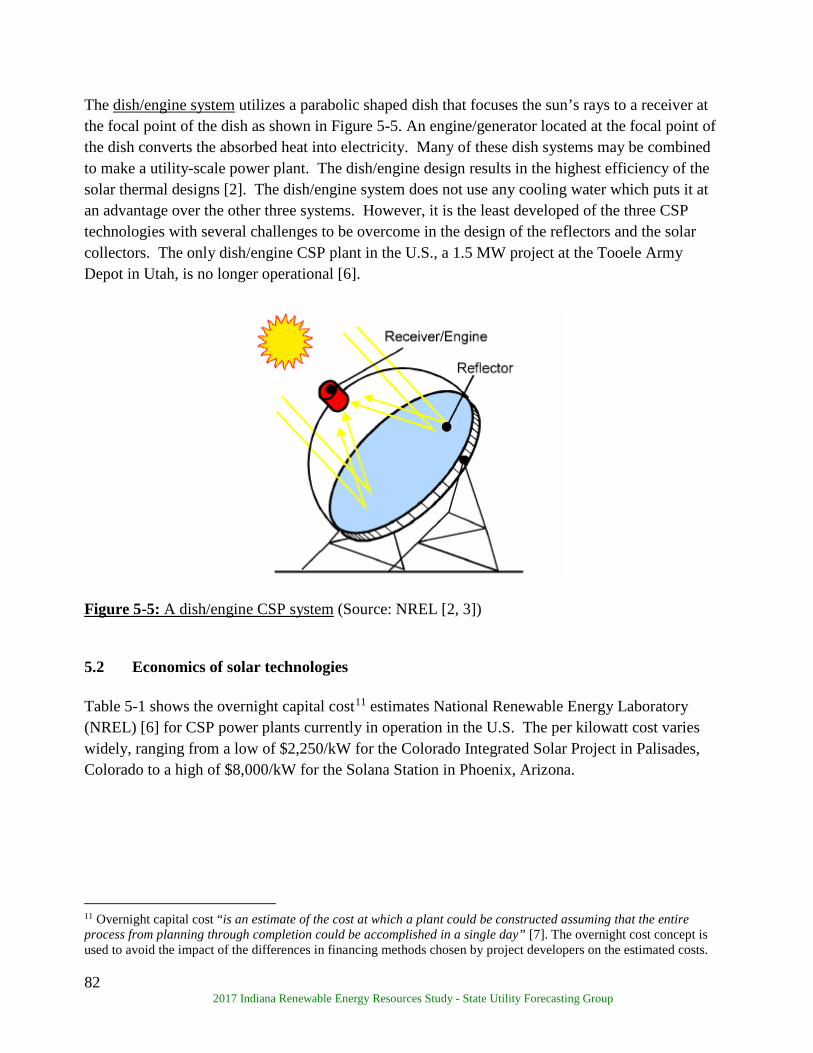
82 2017 Indiana Renewable Energy Resources Study - State Utility Forecasting Group
The dish/engine system utilizes a parabolic shaped dish that focuses the sun’s rays to a receiver at the focal point of the dish as shown in Figure 5-5. An engine/generator located at the focal point of the dish converts the absorbed heat into electricity. Many of these dish systems may be combined to make a utility-scale power plant. The dish/engine design results in the highest efficiency of the solar thermal designs [2]. The dish/engine system does not use any cooling water which puts it at an advantage over the other three systems. However, it is the least developed of the three CSP technologies with several challenges to be overcome in the design of the reflectors and the solar collectors. The only dish/engine CSP plant in the U.S., a 1.5 MW project at the Tooele Army Depot in Utah, is no longer operational [6].
Figure 5-5: A dish/engine CSP system (Source: NREL [2, 3]) 5.2 Economics of solar technologies Table 5-1 shows the overnight capital cost11 estimates National Renewable Energy Laboratory (NREL) [6] for CSP power plants currently in operation in the U.S. The per kilowatt cost varies widely, ranging from a low of $2,250/kW for the Colorado Integrated Solar Project in Palisades, Colorado to a high of $8,000/kW for the Solana Station in Phoenix, Arizona.
11 Overnight capital cost “is an estimate of the cost at which a plant could be constructed assuming that the entire process from planning through completion could be accomplished in a single day” [7]. The overnight cost concept is used to avoid the impact of the differences in financing methods chosen by project developers on the estimated costs.
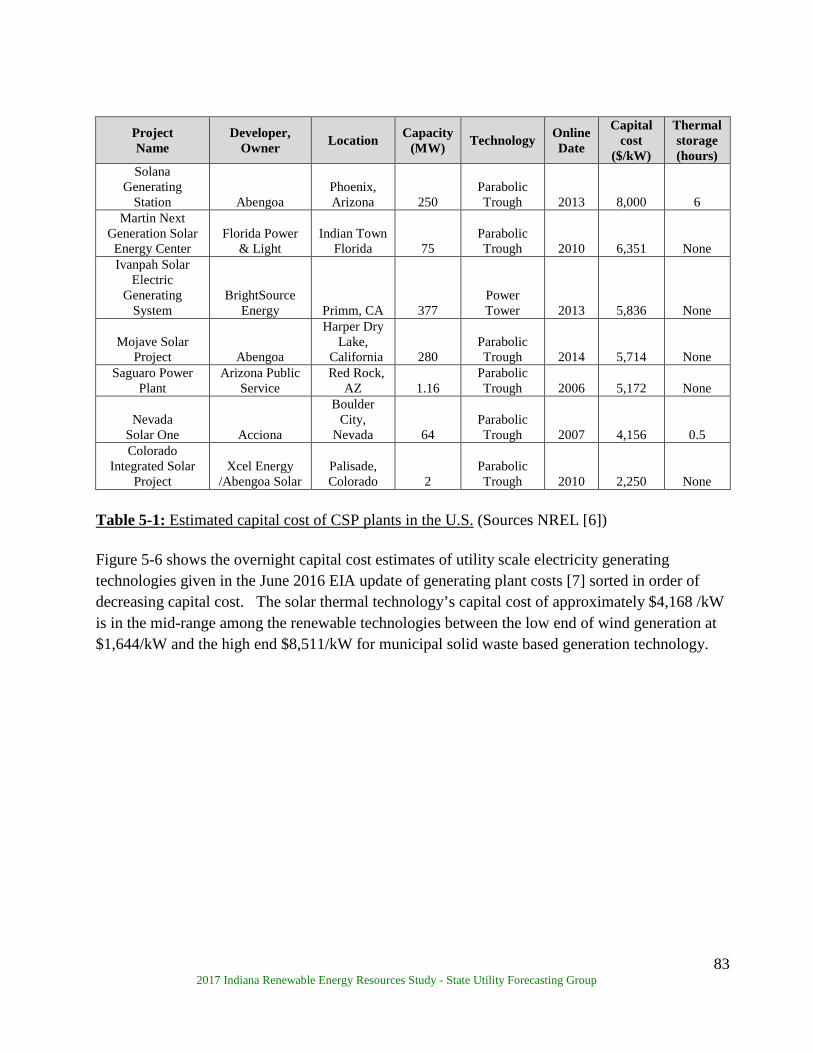
83 2017 Indiana Renewable Energy Resources Study - State Utility Forecasting Group
Project Name
Developer, Owner Location Capacity
(MW) Technology Online Date
Capital cost
($/kW)
Thermal storage (hours)
Solana Generating
Station Abengoa Phoenix, Arizona 250
Parabolic Trough 2013 8,000 6
Martin Next Generation Solar Energy Center
Florida Power & Light
Indian Town Florida 75
Parabolic Trough 2010 6,351 None
Ivanpah Solar Electric
Generating System
BrightSource Energy Primm, CA 377
Power Tower 2013 5,836 None
Mojave Solar Project Abengoa
Harper Dry Lake,
California 280 Parabolic Trough 2014 5,714 None
Saguaro Power Plant
Arizona Public Service
Red Rock, AZ 1.16
Parabolic Trough 2006 5,172 None
Nevada Solar One Acciona
Boulder City,
Nevada 64 Parabolic Trough 2007 4,156 0.5
Colorado Integrated Solar
Project Xcel Energy
/Abengoa Solar Palisade, Colorado 2
Parabolic Trough 2010 2,250 None
Table 5-1: Estimated capital cost of CSP plants in the U.S. (Sources NREL [6]) Figure 5-6 shows the overnight capital cost estimates of utility scale electricity generating technologies given in the June 2016 EIA update of generating plant costs [7] sorted in order of decreasing capital cost. The solar thermal technology’s capital cost of approximately $4,168 /kW is in the mid-range among the renewable technologies between the low end of wind generation at $1,644/kW and the high end $8,511/kW for municipal solid waste based generation technology.
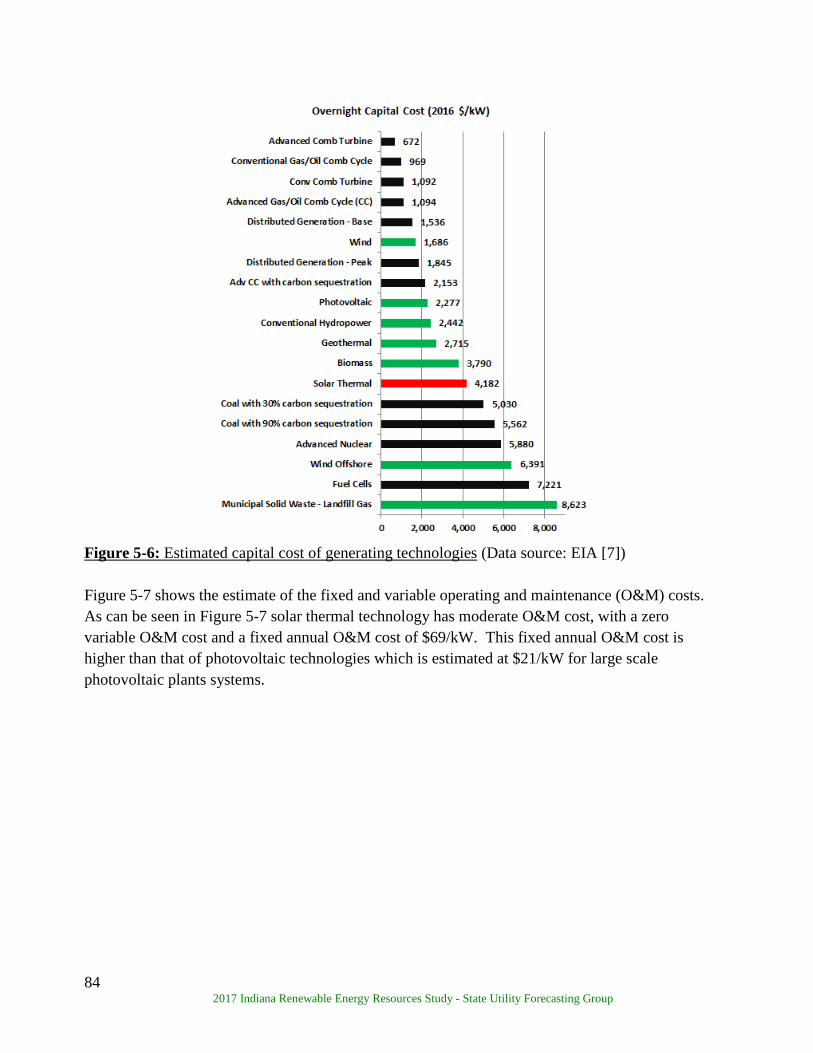
84 2017 Indiana Renewable Energy Resources Study - State Utility Forecasting Group
Figure 5-6: Estimated capital cost of generating technologies (Data source: EIA [7]) Figure 5-7 shows the estimate of the fixed and variable operating and maintenance (O&M) costs. As can be seen in Figure 5-7 solar thermal technology has moderate O&M cost, with a zero variable O&M cost and a fixed annual O&M cost of $69/kW. This fixed annual O&M cost is higher than that of photovoltaic technologies which is estimated at $21/kW for large scale photovoltaic plants systems.
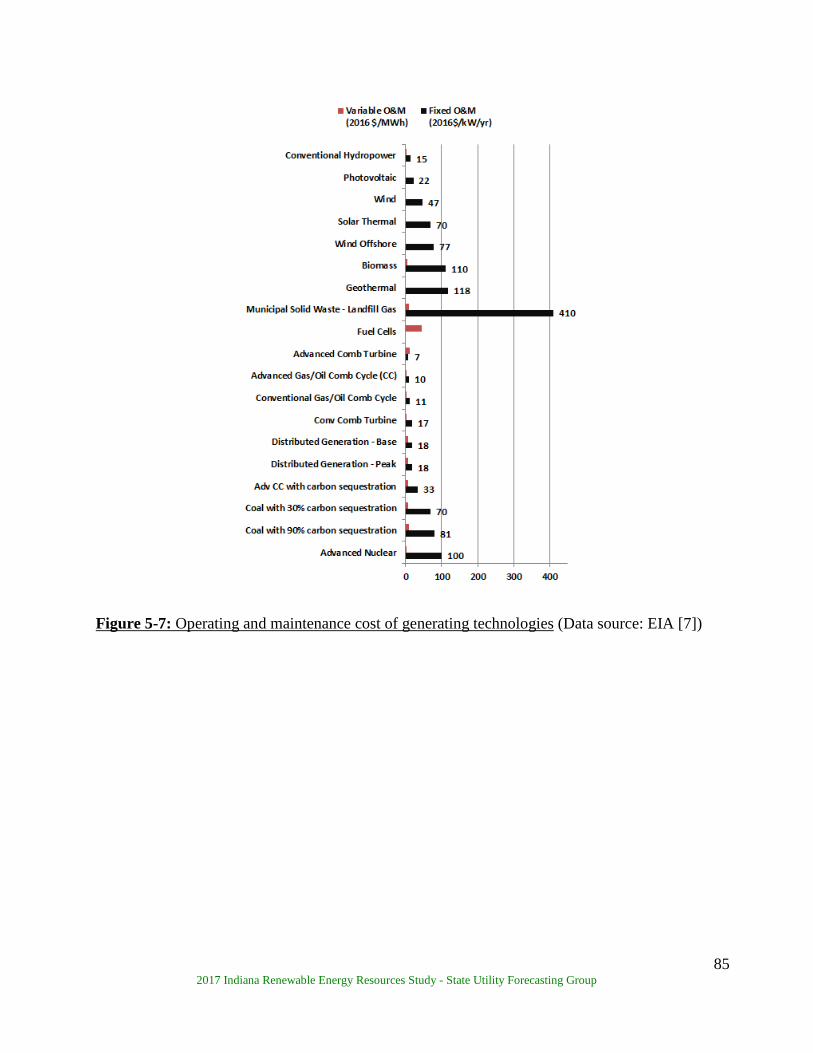
85 2017 Indiana Renewable Energy Resources Study - State Utility Forecasting Group
Figure 5-7: Operating and maintenance cost of generating technologies (Data source: EIA [7])
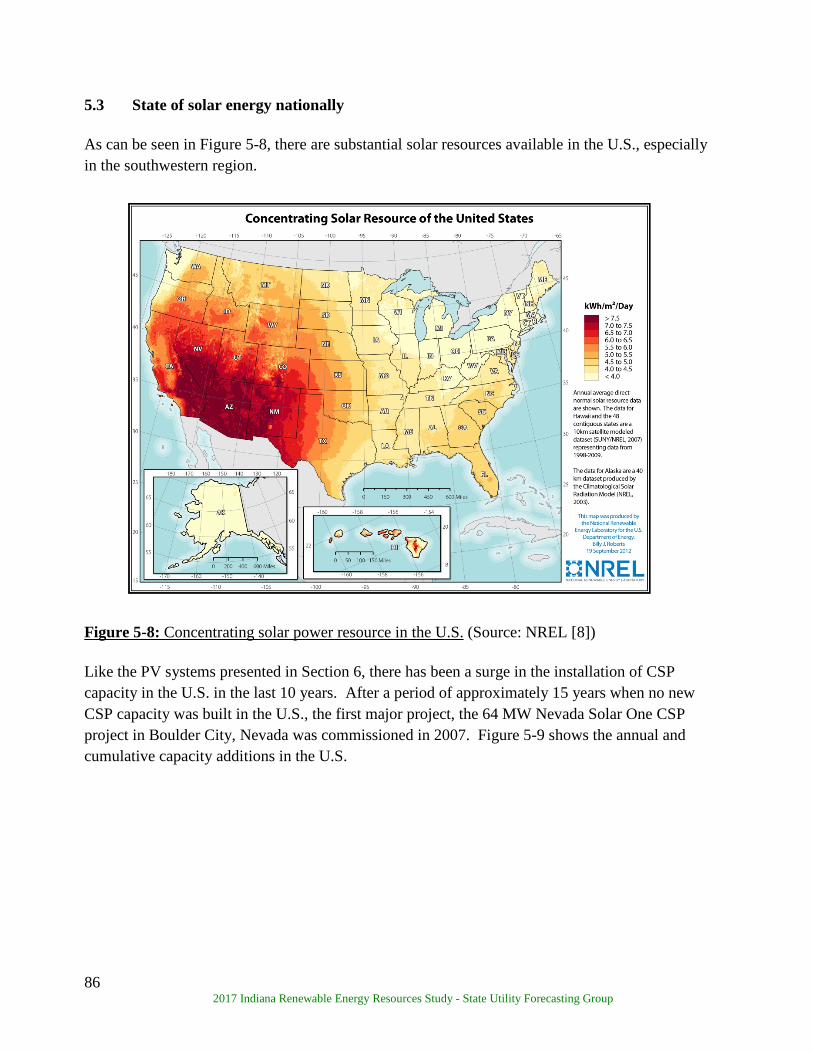
86 2017 Indiana Renewable Energy Resources Study - State Utility Forecasting Group
5.3 State of solar energy nationally As can be seen in Figure 5-8, there are substantial solar resources available in the U.S., especially in the southwestern region.
Figure 5-8: Concentrating solar power resource in the U.S. (Source: NREL [8]) Like the PV systems presented in Section 6, there has been a surge in the installation of CSP capacity in the U.S. in the last 10 years. After a period of approximately 15 years when no new CSP capacity was built in the U.S., the first major project, the 64 MW Nevada Solar One CSP project in Boulder City, Nevada was commissioned in 2007. Figure 5-9 shows the annual and cumulative capacity additions in the U.S.

87 2017 Indiana Renewable Energy Resources Study - State Utility Forecasting Group
Figure 5-9: Solar thermal power capacity installed in the U.S. (Data sources: NREL [6], SEIA [9], IREC [10], Go Solar [11]) Since 2005 a total of thirteen CSP projects with a combined installed capacity of 1,445 MW have been added, bringing the total CSP installed capacity in the U.S. to 1,799 MW. Five of these large projects, with a combined capacity of 1,282 MW, were completed in 2013 - 2015. The largest of these is the 392 MW Ivanpah power tower in the Mojave Desert in California. The other four are the 280 MW Solana project near Gila Bend, Arizona; the 250 MW Genesis project in Riverside County, California; the 250 MW Mojave solar project also located in the Mojave Desert of California and the 110 MW Crescent Dunes project in Tonopah, Nevada. Table 5-2 contains a list of CSP projects in operation in the U.S. as of the writing of this report.

88 2017 Indiana Renewable Energy Resources Study - State Utility Forecasting Group
Project Name State Capacity (MW) Technology Online
Date Solar Energy Generating Systems (SEGS) I
CA 14 Parabolic Trough 1985
SEGS II CA 30 Parabolic Trough 1986 SEGS III CA 30 Parabolic Trough 1987 SEGS IV CA 30 Parabolic Trough 1987 SEGS V CA 30 Parabolic Trough 1988 SEGS VI CA 30 Parabolic Trough 1989 SEGS VII CA 30 Parabolic Trough 1989 SEGS VIII CA 80 Parabolic Trough 1990 SEGS IX CA 80 Parabolic Trough 1991 Saguaro Solar Power Plant AZ 1 Parabolic Trough 2005 Nevada Solar One NV 64 Parabolic Trough 2007 Nevada Solar One Expansion NV 11 Parabolic Trough 2009 Kimberlina CA 5 Linear Fresnel 2009 Sierra SunTower CA 5 Power Tower 2009 Martin Next Generation Solar FL 75 Parabolic Trough 2010 Solana AZ 280 Parabolic Trough 2013 Ivanpah Solar Energy CA 392 Power Tower 2014 Genesis Solar Energy Project CA 250 Parabolic Trough 2014 Mojave Solar CA 250 Parabolic Trough 2014 Crescent Dunes NV 110 Power Tower 2015
Table 5-2: Operating concentrating solar power plants in the U.S. (Data sources: NREL [6], SEIA [9], CSPToday [12]) 5.4 Solar energy in Indiana As can be seen in the U.S. solar radiation map (Figure 5-8), Indiana is in a region of the country that has comparatively low annual average solar radiation. This combined with the relatively low retail electricity rates makes Indiana a less than ideal location for multi-megawatt CSP plants compared to such states as California, Arizona, Nevada, and Florida. The 1,799 MW of solar thermal power plants in the U.S. are located in four states as follows: California – 1,256 MW, Arizona – 281 MW, Nevada – 187 and Florida – 75 MW. However, there is some potential for water heating applications of solar thermal technologies in Indiana. Figure 5-10 shows the solar radiation available to a flat collector facing south in Indiana. Flat plate collectors are typically used for water heating applications. As can be seen in the figure, the southern half of the state has more radiation available.
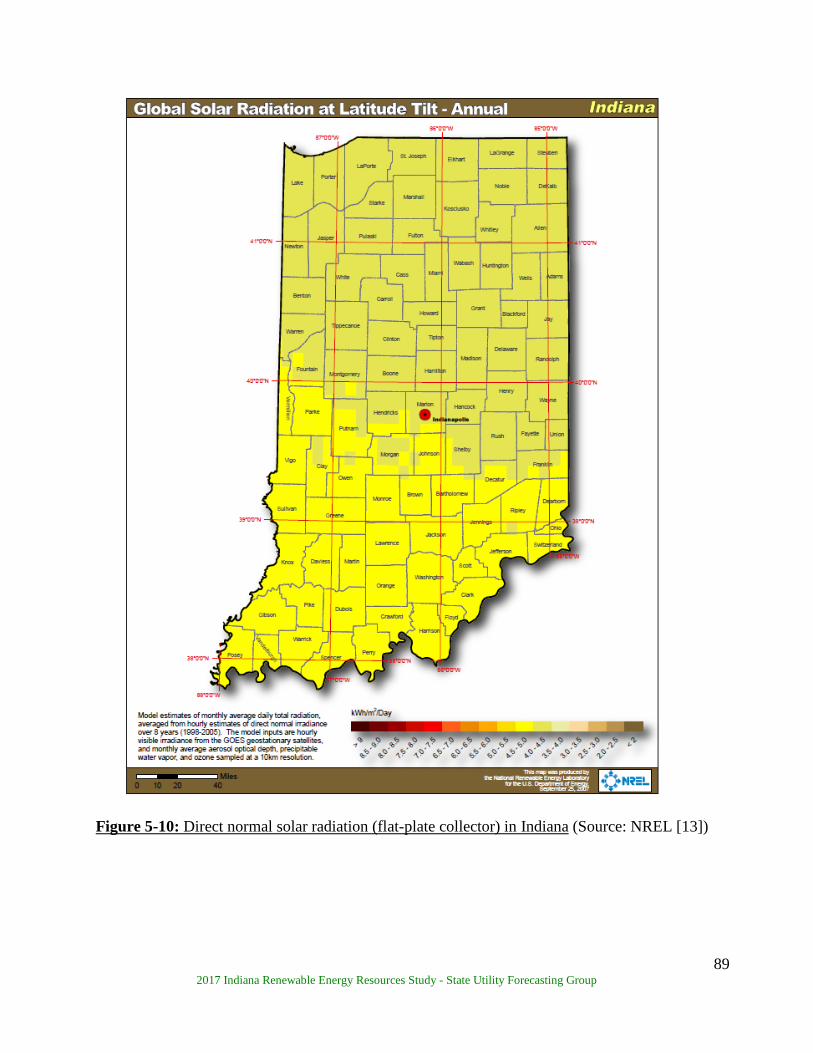
89 2017 Indiana Renewable Energy Resources Study - State Utility Forecasting Group
Figure 5-10: Direct normal solar radiation (flat-plate collector) in Indiana (Source: NREL [13])
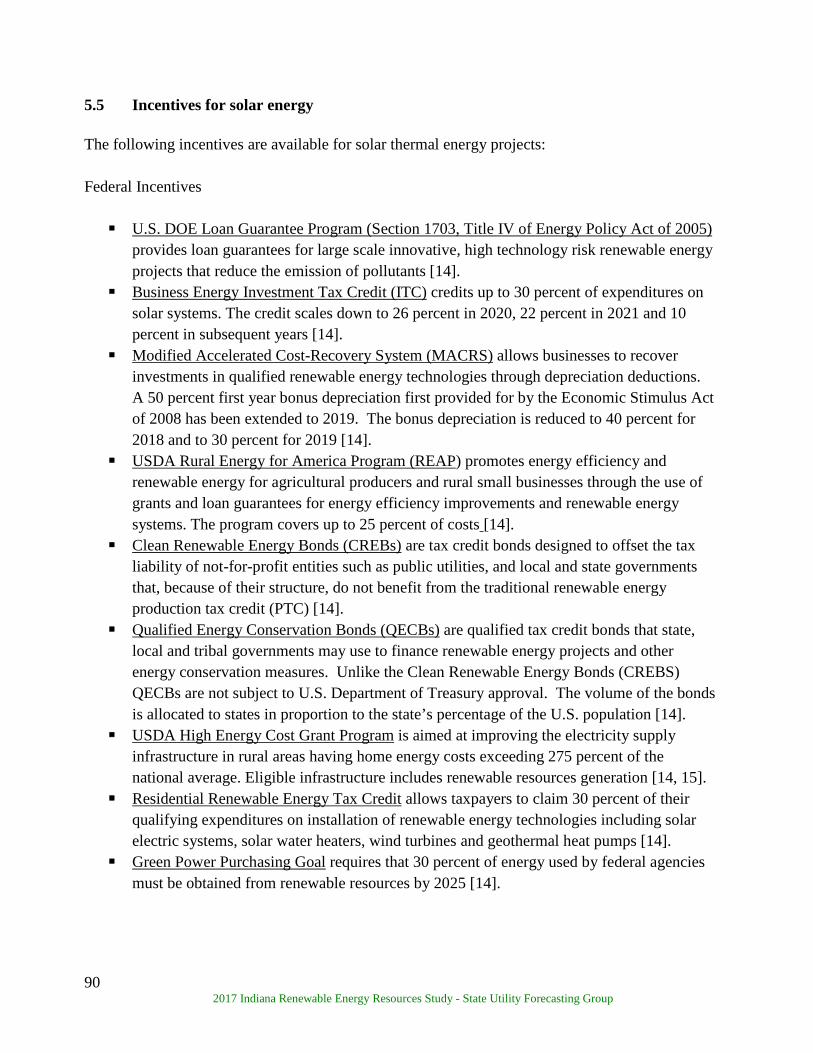
90 2017 Indiana Renewable Energy Resources Study - State Utility Forecasting Group
5.5 Incentives for solar energy
The following incentives are available for solar thermal energy projects: Federal Incentives
U.S. DOE Loan Guarantee Program (Section 1703, Title IV of Energy Policy Act of 2005)
provides loan guarantees for large scale innovative, high technology risk renewable energy projects that reduce the emission of pollutants [14].
Business Energy Investment Tax Credit (ITC) credits up to 30 percent of expenditures on solar systems. The credit scales down to 26 percent in 2020, 22 percent in 2021 and 10 percent in subsequent years [14].
Modified Accelerated Cost-Recovery System (MACRS) allows businesses to recover investments in qualified renewable energy technologies through depreciation deductions. A 50 percent first year bonus depreciation first provided for by the Economic Stimulus Act of 2008 has been extended to 2019. The bonus depreciation is reduced to 40 percent for 2018 and to 30 percent for 2019 [14].
USDA Rural Energy for America Program (REAP) promotes energy efficiency and renewable energy for agricultural producers and rural small businesses through the use of grants and loan guarantees for energy efficiency improvements and renewable energy systems. The program covers up to 25 percent of costs [14].
Clean Renewable Energy Bonds (CREBs) are tax credit bonds designed to offset the tax liability of not-for-profit entities such as public utilities, and local and state governments that, because of their structure, do not benefit from the traditional renewable energy production tax credit (PTC) [14].
Qualified Energy Conservation Bonds (QECBs) are qualified tax credit bonds that state, local and tribal governments may use to finance renewable energy projects and other energy conservation measures. Unlike the Clean Renewable Energy Bonds (CREBS) QECBs are not subject to U.S. Department of Treasury approval. The volume of the bonds is allocated to states in proportion to the state’s percentage of the U.S. population [14].
USDA High Energy Cost Grant Program is aimed at improving the electricity supply infrastructure in rural areas having home energy costs exceeding 275 percent of the national average. Eligible infrastructure includes renewable resources generation [14, 15].
Residential Renewable Energy Tax Credit allows taxpayers to claim 30 percent of their qualifying expenditures on installation of renewable energy technologies including solar electric systems, solar water heaters, wind turbines and geothermal heat pumps [14].
Green Power Purchasing Goal requires that 30 percent of energy used by federal agencies must be obtained from renewable resources by 2025 [14].
91 2017 Indiana Renewable Energy Resources Study - State Utility Forecasting Group
Energy Efficiency Mortgage can be used by homeowners to finance a variety of energy efficiency measures, including renewable energy technologies, in new or existing homes. The federal government supports these loans by insuring them through the Federal Housing Authority or the Department of Veterans Affairs [14].
Indiana Incentives
Net Metering Rule qualifies renewable resource facilities with a maximum capacity of 1
MW for net metering. The net excess generation is credited to the customer in the next billing cycle [14]. Indiana Senate Bill 309 signed into law in May 2017 made changes to the net metering rule to modify the compensation after June 30, 2022 to 1.25 times the utility’s average wholesale cost for the most recent year. Generators installed before the end of 2017 shall continue to receive full retail credit until July 1, 2047 and those installed in the years 2018 to 2022 shall receive full retail credit for their generation until July 1, 2032 [16, 17].
Solar Access Laws prevent planning and zoning authorities from prohibiting or unreasonably restricting the use of solar energy. Indiana’s solar-easement provisions do not create an automatic right to sunlight, though they allow parties to voluntarily enter into solar-easement contracts which are enforceable by law [14].
Renewable Energy Property Tax Exemption provides property tax exemptions for solar thermal, PV, wind, hydroelectric and geothermal systems [14].
Community Conservation Challenge Grant provides $20,000-$80,000 in grants for community energy conservation projects that reduce energy consumption or displace the use of traditional energy sources [18].
Clean Energy Portfolio Goal sets a voluntary goal of obtaining 4 percent between 2013 and 2018, 7 percent between 2019 and 2024, and 10 percent by 2025, of electricity from clean energy sources based on 2010 retail sales. Participation in the goal makes utilities eligible for incentives that can be used to pay for the compliance projects. The deadline to apply for incentives in the 2013 to 2018 period has expired [14].
Northern Indiana Public Service Company (NIPSCO) offers feed-in tariff incentive rates for electricity generated from renewable resources for up to 15 years. The payment for solar systems from 5kW to under 10kW is $0.17/kWh for the projects selected in the first capacity allocation lottery (allocation 1) and $0.1564/kW for subsequent ones (allocation 2). The payment for solar systems larger than 10kW up to 200kW is $0.15/kWh for projects in allocation 1 and $0.138 for those in allocation 2. The 4 MW cap for intermediate solar allocation 1 has been met. [14, 19, 20].
92 2017 Indiana Renewable Energy Resources Study - State Utility Forecasting Group
5.6 References
1. Solar Server, Online Portal to Solar Energy. http://www.solarserver.com/knowledge/basic-knowledge/solar-collectors.html
2. National Renewable Energy Laboratory (NREL). Fuel from the sky: solar energy’s potential for Western energy supply. http://www.nrel.gov/docs/fy02osti/32160.pdf
3. International Energy Agency. SolarPACES solar thermal power systems network. http://www.solarpaces.org/csp-technology
4. TEP News, July 2016. https://www.tep.com/news/pluggedin/areva/ 5. U.S. Department of Energy, Energy Efficiency and Renewable Energy (EERE). Solar Energy
technologies program: Multi-year program plan 2007 – 2011. January 2006. http://www1.eere.energy.gov/solar/pdfs/set_myp_2007-2011_proof_1.pdf
6. NREL. Concentrating solar projects. http://www.nrel.gov/csp/solarpaces/ 7. U.S. Energy Information Administration (EIA). Cost and performance characteristics of new
generating technologies, Annual Energy Outlook 2017, Table 8.2. January 2017. https://www.eia.gov/forecasts/aeo/assumptions/pdf/table_8.2.pdf
8. NREL. http://www.nrel.gov/gis/solar.html 9. Solar Energy Industries Association (SEIA), Major projects list. August 19, 2014; February 23,
2015; May 28, 2015 http://www.seia.org/research-resources/major-solar-projects-list
10. Interstate Renewable Energy Council (IREC). 2011 updates and trends http://www.irecusa.org/2012/08/irec-releases-its-solar-market-trends-report-for-2011/
11. Go Solar California. History of Solar Energy in California http://www.gosolarcalifornia.ca.gov/about/gosolar/california.php
12. CSP Today. http://social.csptoday.com/tracker/projects/table?country[]=USA 13. NREL. MapSearch. http://www.nrel.gov/gis/
http://en.openei.org/w/index.php?title=File:NREL-eere-pv-h-indiana.pdf 14. Database of State Incentives for Renewables and Efficiency (DSIRE). http://www.dsireusa.org/ 15. U.S. Department of Agriculture, Rural Development, Electric Programs.
http://www.rd.usda.gov/programs-services/high-energy-cost-grants 16. Indiana General Assembly, 2017 Session. Senate Bill 309
https://iga.in.gov/legislative/2017/bills/senate/309#digest-heading 17. The Journal Gazette, June 26 2017. Holcomb signs solar energy bill.
http://www.journalgazette.net/news/local/indiana/20170503/holcomb-signs-solar-energy-bill 18. Indiana Office of Energy Development. Community Conservation Challenge.
https://secure.in.gov/oed/2645.htm 19. NIPSCO. March 4, 2015. http://www.nipsco.com/docs/default-source/electric-tariffs-122711-
docs/rate-665. 20. NIPSCO. 2017.
https://www.nipsco.com/our-services/renewable-energy-projects/feed-in-tariff-program

93 2017 Indiana Renewable Energy Resources Study - State Utility Forecasting Group
6. Photovoltaic Cells 6.1 Introduction Unlike the solar thermal systems discussed in Section 5 of this report, photovoltaic (PV) cells convert solar energy directly into electricity without having to first convert it to heat. In addition, since PV cells use both direct and indirect sunlight, their use is more geographically widespread than solar thermal systems that require access to direct solar radiation. Figure 6-1 shows the layout and functioning of a PV cell. When the photons in sunlight strike the surface of a photovoltaic cell, some of them are absorbed. The absorbed photons cause free electrons to migrate in the cell, thus causing “holes.” The resulting imbalance of charge between the cell’s front and back surfaces creates a voltage potential like the negative and positive terminals of a battery. When these two surfaces are connected through an external load, electricity flows [1].
Figure 6-1: Photovoltaic cell operation (Source: EIA [2])

94 2017 Indiana Renewable Energy Resources Study - State Utility Forecasting Group
The photovoltaic cell is the basic building block of a PV system. Individual cells range in surface area from 0.25 to 16 square inches across with a power output of 1 to 2 watts (W). To increase the power output of the PV unit, the cells are interconnected into a packaged, weather-tight module, typically with a 50-100 W power output as shown in Figure 6-2. Several PV modules are then connected to form an array. A complete PV system will include other components such as inverters12 and mounting systems [1, 3].
Figure 6-2: Illustration of a cell, module and array of a PV system (Source: EERE [3]) There are currently three main types of PV cell technologies in commercial use: crystalline silicon, thin-film and concentrating PV cells. Other PV cells being developed use new materials instead of silicon, including solar dyes, solar inks and organic polymers. The crystalline silicon cell is the most common PV cell technology and was the first PV technology to be developed. It was developed in the 1950s and was initially used to power satellites and smaller items like watches and electronic calculators. As the prices of PV systems declined, their use spread to other areas such as highway signs and other facilities remote from the electricity grid. In more recent years PV power systems have gained more widespread application as grid-connected generating resources with over 40 gigawatts (GW) of grid-connected PV systems installed in the U.S. since 2000 [4]. Unlike crystalline silicon cells, thin-film cells are made by depositing thin layers of non-crystalline (amorphous) silicon or other photovoltaic material on low-cost substrate material. As a result, thin-film PV cells have a lower cost per unit of area than crystalline silicon cells. However, since they have a lower energy conversion efficiency, this cost advantage is reduced by the required larger surface area relative to a crystalline silicon PV system with the same power rating. One of the main advantages of thin-film PV cells is that they can be made into flexible panels that are easily fitted onto building structures such as roofing shingles, facades and glazing on sky lights
12 Inverters change the direct current (DC) produced by the PV array to alternating current (AC) for household or business use or for injection into the power grid.

95 2017 Indiana Renewable Energy Resources Study - State Utility Forecasting Group
The third category of photovoltaic cell technology in commercial use is the concentrating photovoltaic cell (CPV) technology. CPV systems use optical lenses to focus the sun’s rays onto small, high efficiency PV cells thus reducing the amount of photovoltaic material needed. Unlike the other photovoltaic technologies, CPV systems require direct sunlight and therefore their viability is restricted to sunny locations. At the writing of this report the SUFG was aware of twelve CPV systems in operation in the U.S. with a combined capacity of 60 MW [5]. The largest of these is the 35 MW Alamosa Solar Generating Station installed in Alamosa, Colorado in 2012. Figure 6-3 shows the layout of a CPV cell.
Figure 6-3: Illustration of concentrating photovoltaic cell (Source: Green Rhino Energy [6])
Figure 6-4 shows an overview of the costs, efficiencies, and energy output per unit of surface area of various PV cell technologies given by the International Energy Agency (IEA) in their 2010 roadmap. As can be seen in the figure, the crystalline silicon technology occupies a mid-range in the cost/efficiency continuum, thin-film technology’s lower cost comes with a lower efficiency and the CPV technology’s higher efficiency is coupled with proportionally higher cost. Figure 6-4 also shows the costs and efficiency of organic polymer cells; however, this technology is still in the development phase. According to DOE limitations in their efficiency and their long-term reliability remain significant barriers to their commercial deployment [7].
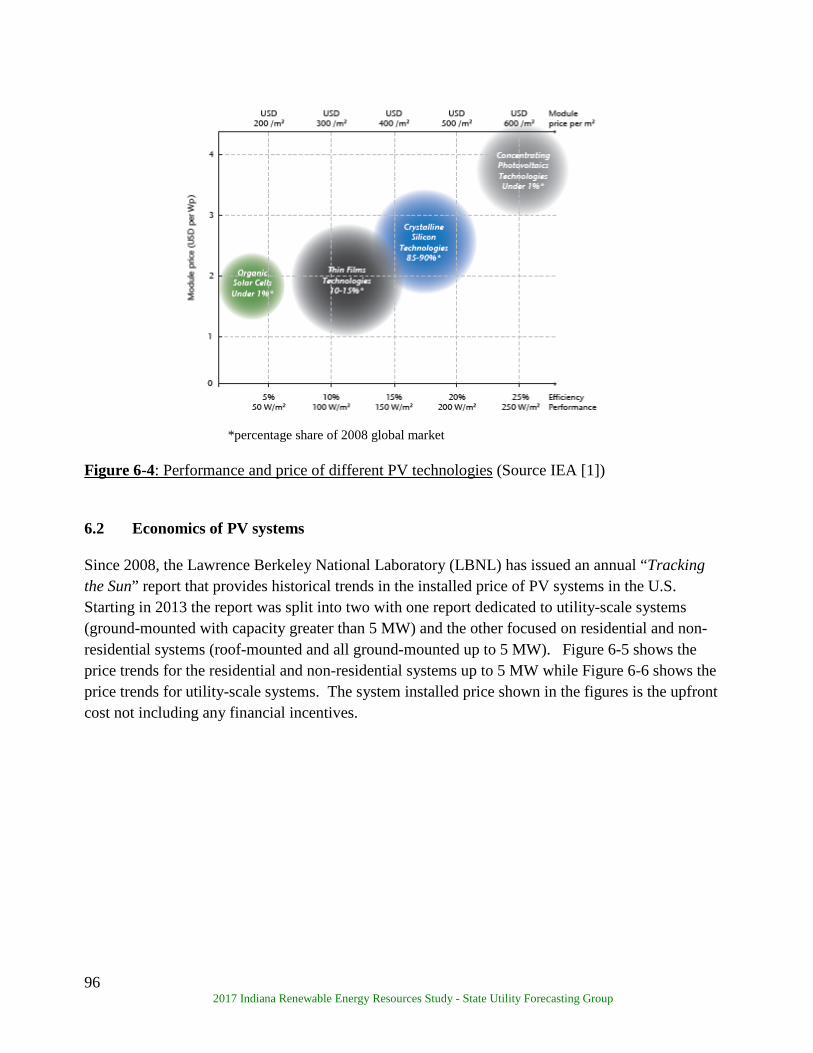
96 2017 Indiana Renewable Energy Resources Study - State Utility Forecasting Group
*percentage share of 2008 global market Figure 6-4: Performance and price of different PV technologies (Source IEA [1]) 6.2 Economics of PV systems Since 2008, the Lawrence Berkeley National Laboratory (LBNL) has issued an annual “Tracking the Sun” report that provides historical trends in the installed price of PV systems in the U.S. Starting in 2013 the report was split into two with one report dedicated to utility-scale systems (ground-mounted with capacity greater than 5 MW) and the other focused on residential and non-residential systems (roof-mounted and all ground-mounted up to 5 MW). Figure 6-5 shows the price trends for the residential and non-residential systems up to 5 MW while Figure 6-6 shows the price trends for utility-scale systems. The system installed price shown in the figures is the upfront cost not including any financial incentives.
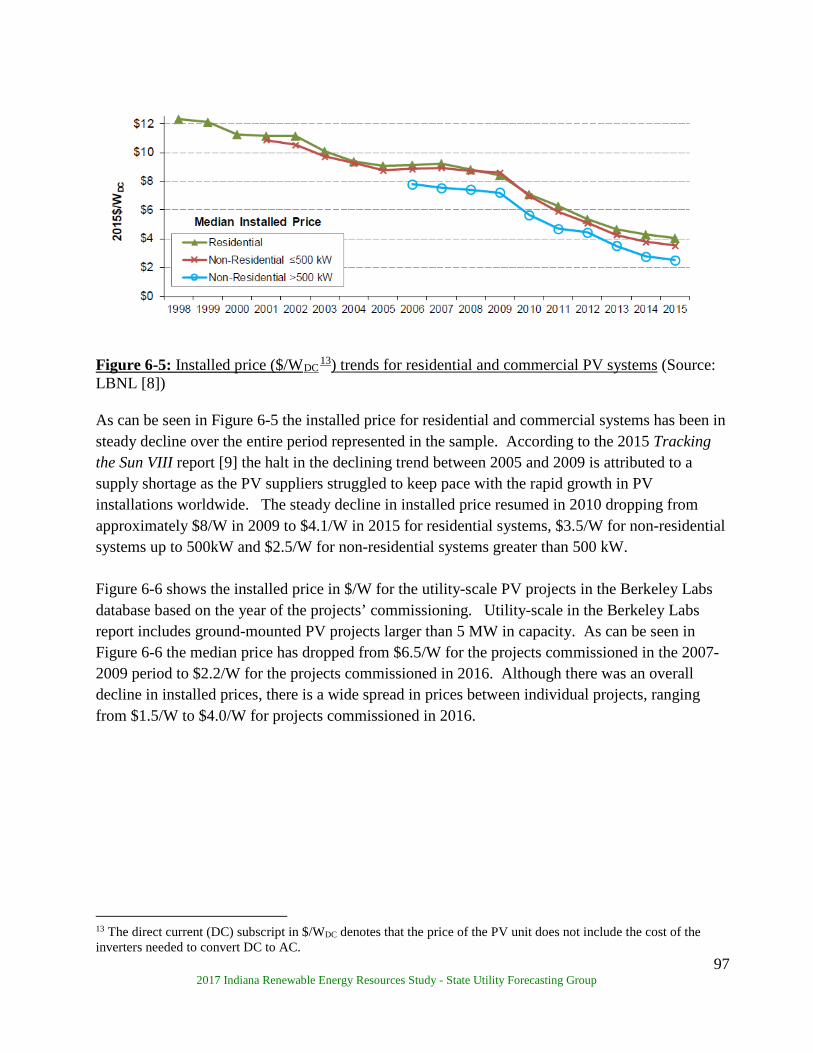
97 2017 Indiana Renewable Energy Resources Study - State Utility Forecasting Group
Figure 6-5: Installed price ($/WDC
13) trends for residential and commercial PV systems (Source: LBNL [8]) As can be seen in Figure 6-5 the installed price for residential and commercial systems has been in steady decline over the entire period represented in the sample. According to the 2015 Tracking the Sun VIII report [9] the halt in the declining trend between 2005 and 2009 is attributed to a supply shortage as the PV suppliers struggled to keep pace with the rapid growth in PV installations worldwide. The steady decline in installed price resumed in 2010 dropping from approximately $8/W in 2009 to $4.1/W in 2015 for residential systems, $3.5/W for non-residential systems up to 500kW and $2.5/W for non-residential systems greater than 500 kW. Figure 6-6 shows the installed price in $/W for the utility-scale PV projects in the Berkeley Labs database based on the year of the projects’ commissioning. Utility-scale in the Berkeley Labs report includes ground-mounted PV projects larger than 5 MW in capacity. As can be seen in Figure 6-6 the median price has dropped from $6.5/W for the projects commissioned in the 2007-2009 period to $2.2/W for the projects commissioned in 2016. Although there was an overall decline in installed prices, there is a wide spread in prices between individual projects, ranging from $1.5/W to $4.0/W for projects commissioned in 2016.
13 The direct current (DC) subscript in $/WDC denotes that the price of the PV unit does not include the cost of the inverters needed to convert DC to AC.

98 2017 Indiana Renewable Energy Resources Study - State Utility Forecasting Group
Figure 6-6: Installed price of utility-scale PV systems over time (Source: LBNL [10]) Figure 6-7 shows the construction cost in $/kW for PV systems installed in the U.S. in 2015 according to a report released by EIA on May 19, 2017 [11]. The data included in the EIA report is for PV systems 1 MW or more installed on the utility side of the meter. The capacity-weighted average cost for the projects installed in 2015 included in the EIA report is $2,921/kW. This is 5 percent lower than the $3.08/W capacity-weighted average cost of the projects installed in 2015 included in the Berkeley Labs report shown in Figure 6-6.
Figure 6-7: Average cost of PV systems of at least 1 MW installed in the U.S. in 2013 (Data Source: EIA [11])
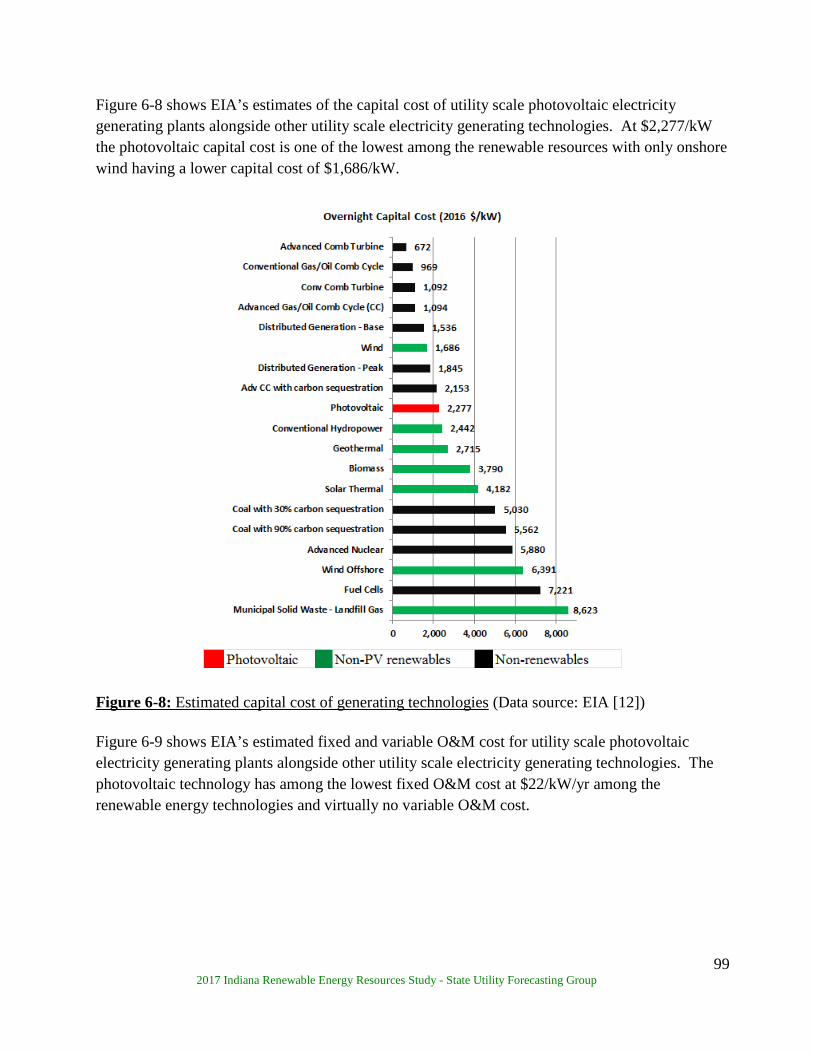
99 2017 Indiana Renewable Energy Resources Study - State Utility Forecasting Group
Figure 6-8 shows EIA’s estimates of the capital cost of utility scale photovoltaic electricity generating plants alongside other utility scale electricity generating technologies. At $2,277/kW the photovoltaic capital cost is one of the lowest among the renewable resources with only onshore wind having a lower capital cost of $1,686/kW.
Figure 6-8: Estimated capital cost of generating technologies (Data source: EIA [12]) Figure 6-9 shows EIA’s estimated fixed and variable O&M cost for utility scale photovoltaic electricity generating plants alongside other utility scale electricity generating technologies. The photovoltaic technology has among the lowest fixed O&M cost at $22/kW/yr among the renewable energy technologies and virtually no variable O&M cost.

100 2017 Indiana Renewable Energy Resources Study - State Utility Forecasting Group
Figure 6-9: Estimated fixed and variable O&M cost of generating technologies (Data source: EIA [12]) 6.3 State of PV systems nationally PV installed capacity in the U.S. has been increasing rapidly in the last few years, growing from a mere 4 MW in 2000 to 40,611 MW at the end of 2016. Figure 6-10 shows the annual and the cumulative installed capacity of grid-connected PV systems in the U.S.
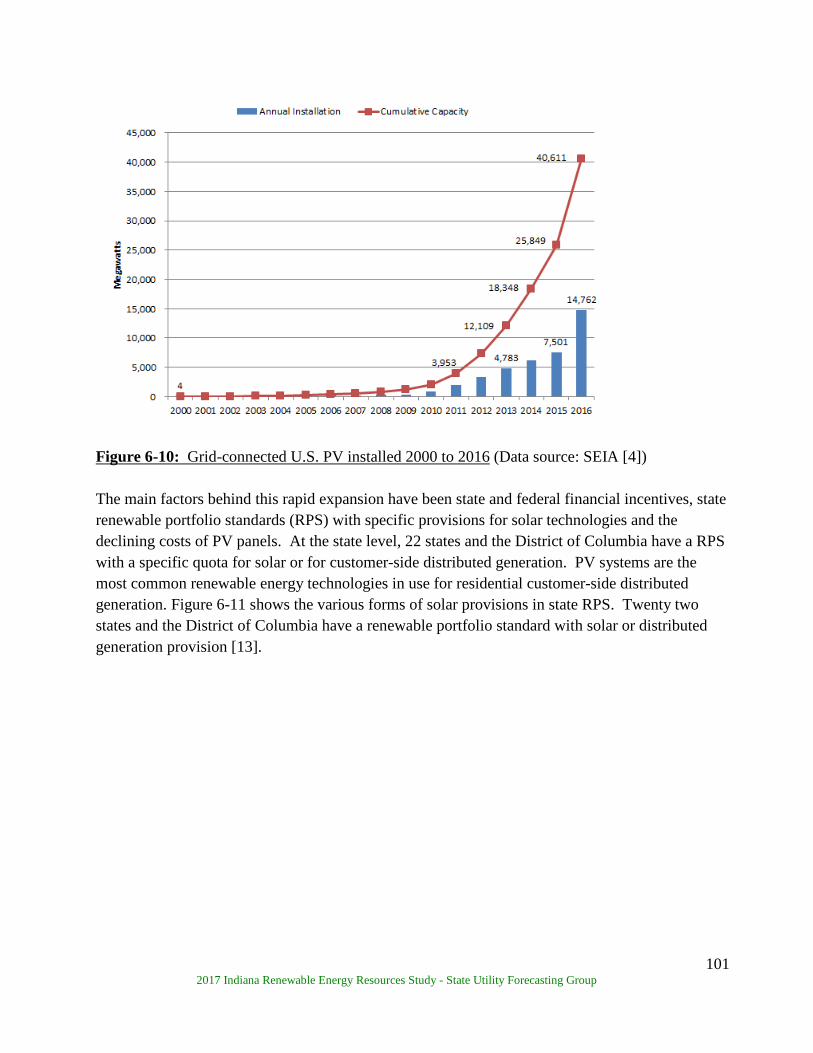
101 2017 Indiana Renewable Energy Resources Study - State Utility Forecasting Group
Figure 6-10: Grid-connected U.S. PV installed 2000 to 2016 (Data source: SEIA [4]) The main factors behind this rapid expansion have been state and federal financial incentives, state renewable portfolio standards (RPS) with specific provisions for solar technologies and the declining costs of PV panels. At the state level, 22 states and the District of Columbia have a RPS with a specific quota for solar or for customer-side distributed generation. PV systems are the most common renewable energy technologies in use for residential customer-side distributed generation. Figure 6-11 shows the various forms of solar provisions in state RPS. Twenty two states and the District of Columbia have a renewable portfolio standard with solar or distributed generation provision [13].
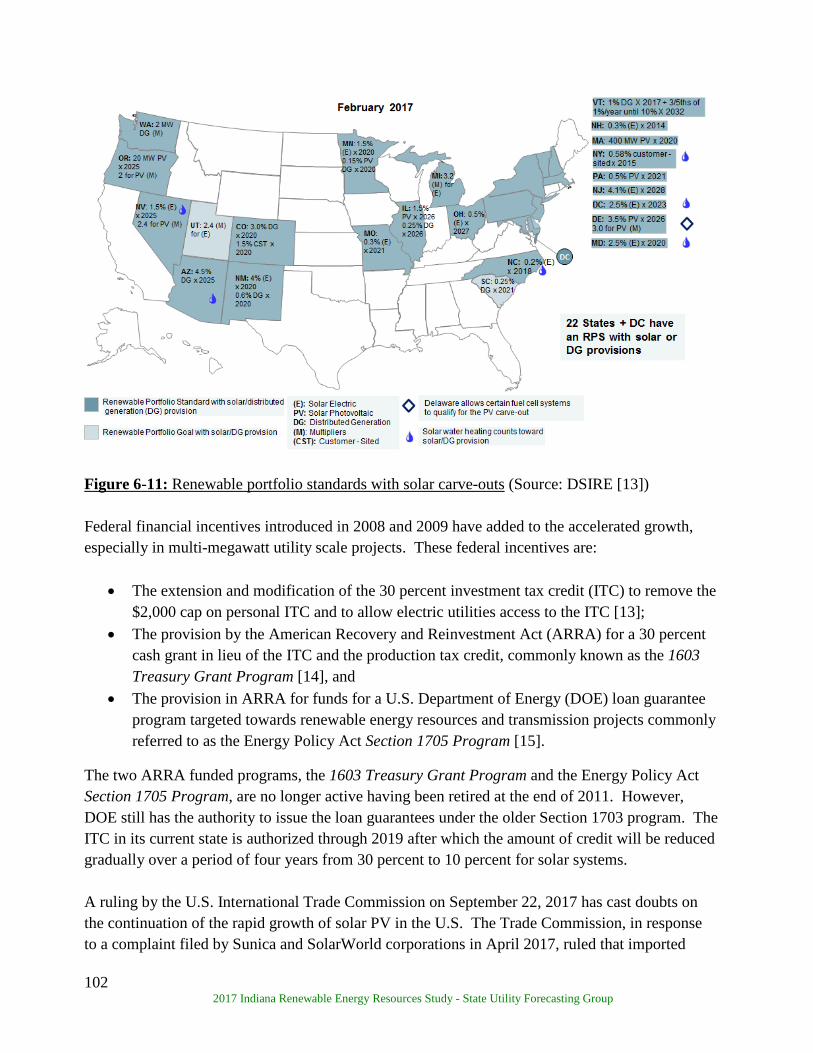
102 2017 Indiana Renewable Energy Resources Study - State Utility Forecasting Group
Figure 6-11: Renewable portfolio standards with solar carve-outs (Source: DSIRE [13]) Federal financial incentives introduced in 2008 and 2009 have added to the accelerated growth, especially in multi-megawatt utility scale projects. These federal incentives are:
• The extension and modification of the 30 percent investment tax credit (ITC) to remove the $2,000 cap on personal ITC and to allow electric utilities access to the ITC [13];
• The provision by the American Recovery and Reinvestment Act (ARRA) for a 30 percent cash grant in lieu of the ITC and the production tax credit, commonly known as the 1603 Treasury Grant Program [14], and
• The provision in ARRA for funds for a U.S. Department of Energy (DOE) loan guarantee program targeted towards renewable energy resources and transmission projects commonly referred to as the Energy Policy Act Section 1705 Program [15].
The two ARRA funded programs, the 1603 Treasury Grant Program and the Energy Policy Act Section 1705 Program, are no longer active having been retired at the end of 2011. However, DOE still has the authority to issue the loan guarantees under the older Section 1703 program. The ITC in its current state is authorized through 2019 after which the amount of credit will be reduced gradually over a period of four years from 30 percent to 10 percent for solar systems. A ruling by the U.S. International Trade Commission on September 22, 2017 has cast doubts on the continuation of the rapid growth of solar PV in the U.S. The Trade Commission, in response to a complaint filed by Sunica and SolarWorld corporations in April 2017, ruled that imported
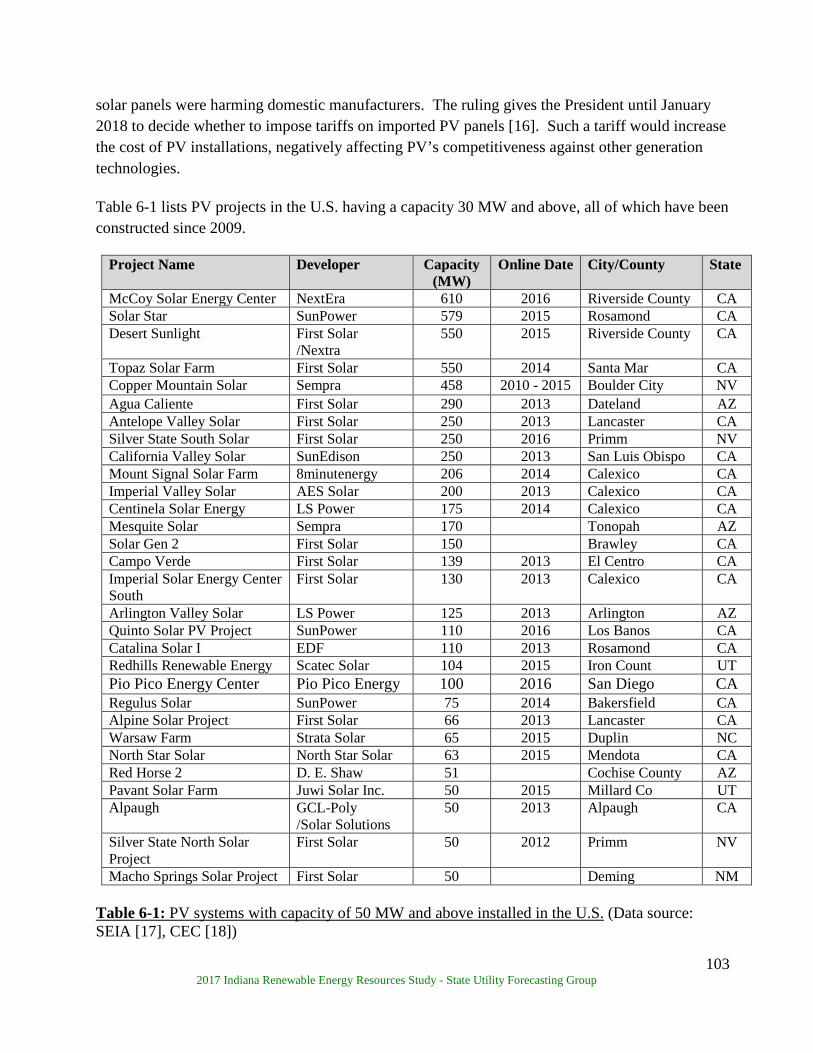
103 2017 Indiana Renewable Energy Resources Study - State Utility Forecasting Group
solar panels were harming domestic manufacturers. The ruling gives the President until January 2018 to decide whether to impose tariffs on imported PV panels [16]. Such a tariff would increase the cost of PV installations, negatively affecting PV’s competitiveness against other generation technologies. Table 6-1 lists PV projects in the U.S. having a capacity 30 MW and above, all of which have been constructed since 2009.
Project Name Developer Capacity (MW)
Online Date City/County State
McCoy Solar Energy Center NextEra 610 2016 Riverside County CA Solar Star SunPower 579 2015 Rosamond CA Desert Sunlight First Solar
/Nextra 550 2015 Riverside County CA
Topaz Solar Farm First Solar 550 2014 Santa Mar CA Copper Mountain Solar Sempra 458 2010 - 2015 Boulder City NV Agua Caliente First Solar 290 2013 Dateland AZ Antelope Valley Solar First Solar 250 2013 Lancaster CA Silver State South Solar First Solar 250 2016 Primm NV California Valley Solar SunEdison 250 2013 San Luis Obispo CA Mount Signal Solar Farm 8minutenergy 206 2014 Calexico CA Imperial Valley Solar AES Solar 200 2013 Calexico CA Centinela Solar Energy LS Power 175 2014 Calexico CA Mesquite Solar Sempra 170 Tonopah AZ Solar Gen 2 First Solar 150 Brawley CA Campo Verde First Solar 139 2013 El Centro CA Imperial Solar Energy Center South
First Solar 130 2013 Calexico CA
Arlington Valley Solar LS Power 125 2013 Arlington AZ Quinto Solar PV Project SunPower 110 2016 Los Banos CA Catalina Solar I EDF 110 2013 Rosamond CA Redhills Renewable Energy Scatec Solar 104 2015 Iron Count UT Pio Pico Energy Center Pio Pico Energy 100 2016 San Diego CA Regulus Solar SunPower 75 2014 Bakersfield CA Alpine Solar Project First Solar 66 2013 Lancaster CA Warsaw Farm Strata Solar 65 2015 Duplin NC North Star Solar North Star Solar 63 2015 Mendota CA Red Horse 2 D. E. Shaw 51 Cochise County AZ Pavant Solar Farm Juwi Solar Inc. 50 2015 Millard Co UT Alpaugh GCL-Poly
/Solar Solutions 50 2013 Alpaugh CA
Silver State North Solar Project
First Solar 50 2012 Primm NV
Macho Springs Solar Project First Solar 50 Deming NM Table 6-1: PV systems with capacity of 50 MW and above installed in the U.S. (Data source: SEIA [17], CEC [18])
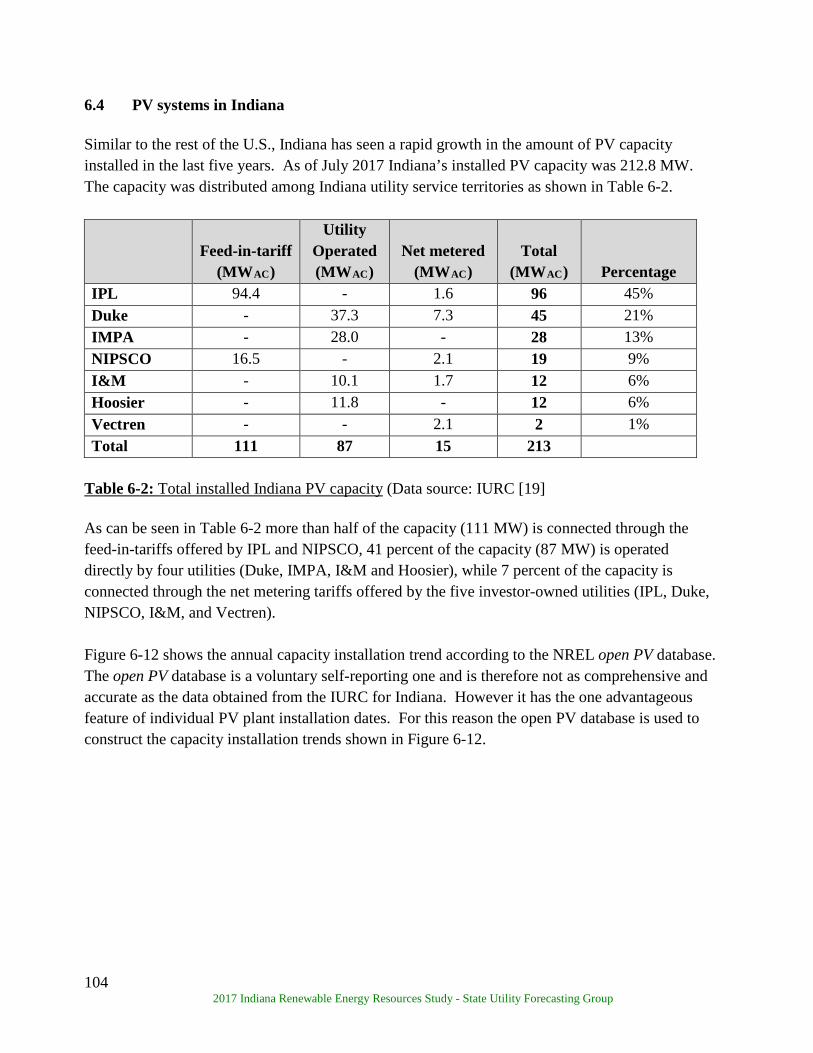
104 2017 Indiana Renewable Energy Resources Study - State Utility Forecasting Group
6.4 PV systems in Indiana Similar to the rest of the U.S., Indiana has seen a rapid growth in the amount of PV capacity installed in the last five years. As of July 2017 Indiana’s installed PV capacity was 212.8 MW. The capacity was distributed among Indiana utility service territories as shown in Table 6-2.
Feed-in-tariff (MWAC)
Utility Operated (MWAC)
Net metered (MWAC)
Total (MWAC) Percentage
IPL 94.4 - 1.6 96 45% Duke - 37.3 7.3 45 21% IMPA - 28.0 - 28 13% NIPSCO 16.5 - 2.1 19 9% I&M - 10.1 1.7 12 6% Hoosier - 11.8 - 12 6% Vectren - - 2.1 2 1% Total 111 87 15 213
Table 6-2: Total installed Indiana PV capacity (Data source: IURC [19] As can be seen in Table 6-2 more than half of the capacity (111 MW) is connected through the feed-in-tariffs offered by IPL and NIPSCO, 41 percent of the capacity (87 MW) is operated directly by four utilities (Duke, IMPA, I&M and Hoosier), while 7 percent of the capacity is connected through the net metering tariffs offered by the five investor-owned utilities (IPL, Duke, NIPSCO, I&M, and Vectren). Figure 6-12 shows the annual capacity installation trend according to the NREL open PV database. The open PV database is a voluntary self-reporting one and is therefore not as comprehensive and accurate as the data obtained from the IURC for Indiana. However it has the one advantageous feature of individual PV plant installation dates. For this reason the open PV database is used to construct the capacity installation trends shown in Figure 6-12.
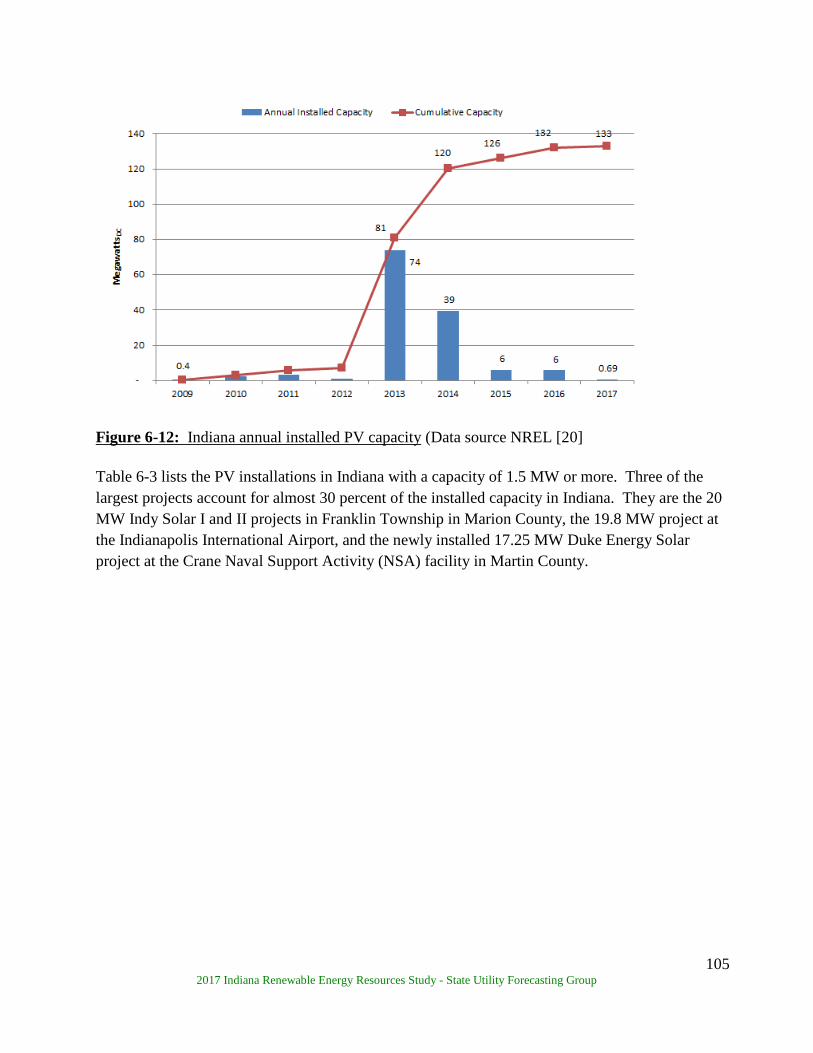
105 2017 Indiana Renewable Energy Resources Study - State Utility Forecasting Group
Figure 6-12: Indiana annual installed PV capacity (Data source NREL [20] Table 6-3 lists the PV installations in Indiana with a capacity of 1.5 MW or more. Three of the largest projects account for almost 30 percent of the installed capacity in Indiana. They are the 20 MW Indy Solar I and II projects in Franklin Township in Marion County, the 19.8 MW project at the Indianapolis International Airport, and the newly installed 17.25 MW Duke Energy Solar project at the Crane Naval Support Activity (NSA) facility in Martin County.
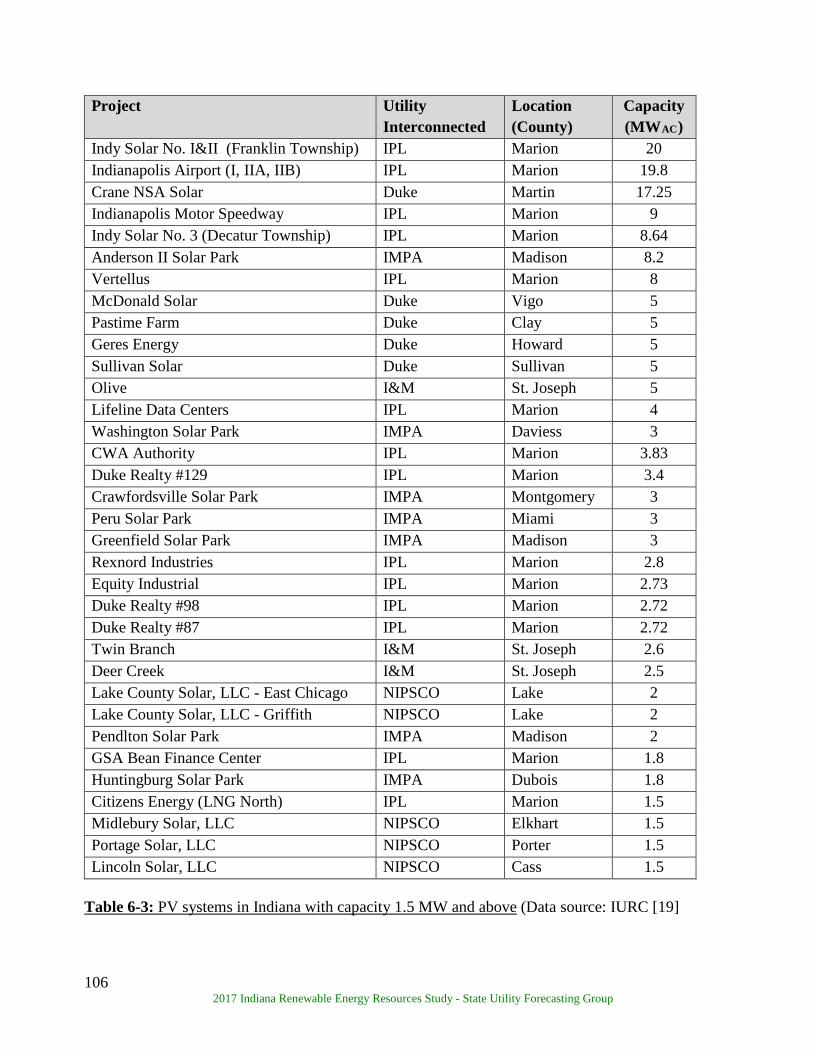
106 2017 Indiana Renewable Energy Resources Study - State Utility Forecasting Group
Project Utility Interconnected
Location (County)
Capacity (MWAC)
Indy Solar No. I&II (Franklin Township) IPL Marion 20 Indianapolis Airport (I, IIA, IIB) IPL Marion 19.8 Crane NSA Solar Duke Martin 17.25 Indianapolis Motor Speedway IPL Marion 9 Indy Solar No. 3 (Decatur Township) IPL Marion 8.64 Anderson II Solar Park IMPA Madison 8.2 Vertellus IPL Marion 8 McDonald Solar Duke Vigo 5 Pastime Farm Duke Clay 5 Geres Energy Duke Howard 5 Sullivan Solar Duke Sullivan 5 Olive I&M St. Joseph 5 Lifeline Data Centers IPL Marion 4 Washington Solar Park IMPA Daviess 3 CWA Authority IPL Marion 3.83 Duke Realty #129 IPL Marion 3.4 Crawfordsville Solar Park IMPA Montgomery 3 Peru Solar Park IMPA Miami 3 Greenfield Solar Park IMPA Madison 3 Rexnord Industries IPL Marion 2.8 Equity Industrial IPL Marion 2.73 Duke Realty #98 IPL Marion 2.72 Duke Realty #87 IPL Marion 2.72 Twin Branch I&M St. Joseph 2.6 Deer Creek I&M St. Joseph 2.5 Lake County Solar, LLC - East Chicago NIPSCO Lake 2 Lake County Solar, LLC - Griffith NIPSCO Lake 2 Pendlton Solar Park IMPA Madison 2 GSA Bean Finance Center IPL Marion 1.8 Huntingburg Solar Park IMPA Dubois 1.8 Citizens Energy (LNG North) IPL Marion 1.5 Midlebury Solar, LLC NIPSCO Elkhart 1.5 Portage Solar, LLC NIPSCO Porter 1.5 Lincoln Solar, LLC NIPSCO Cass 1.5
Table 6-3: PV systems in Indiana with capacity 1.5 MW and above (Data source: IURC [19]
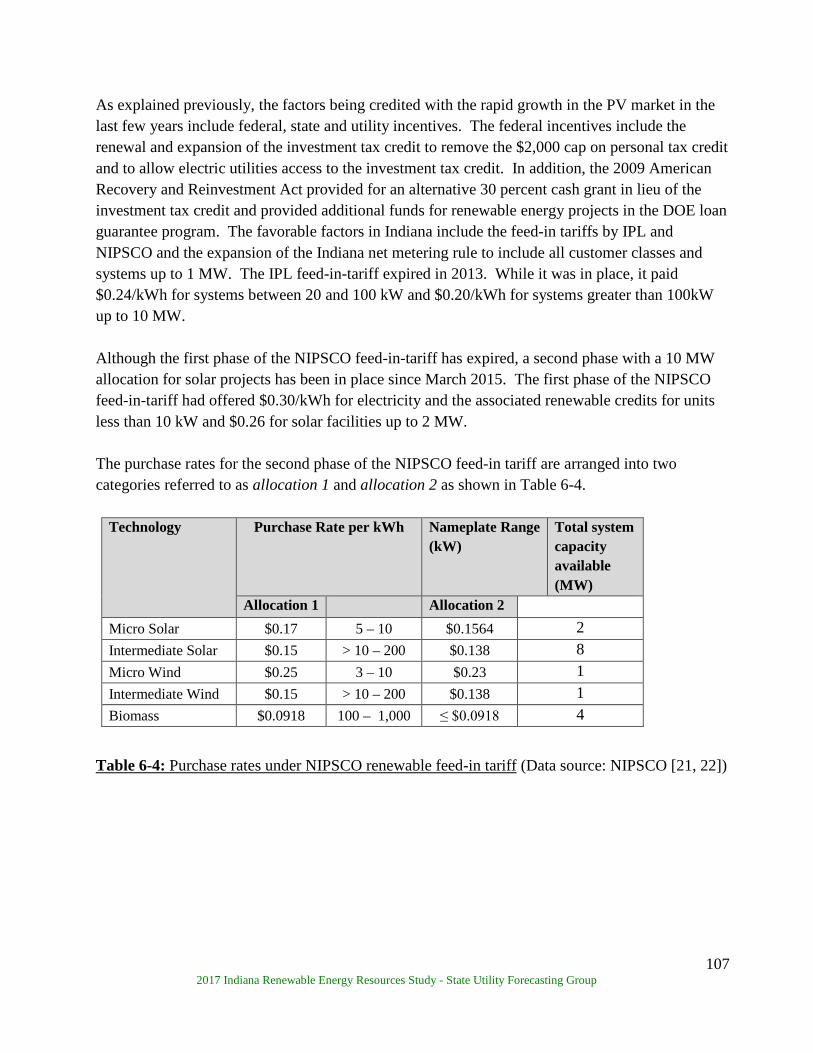
107 2017 Indiana Renewable Energy Resources Study - State Utility Forecasting Group
As explained previously, the factors being credited with the rapid growth in the PV market in the last few years include federal, state and utility incentives. The federal incentives include the renewal and expansion of the investment tax credit to remove the $2,000 cap on personal tax credit and to allow electric utilities access to the investment tax credit. In addition, the 2009 American Recovery and Reinvestment Act provided for an alternative 30 percent cash grant in lieu of the investment tax credit and provided additional funds for renewable energy projects in the DOE loan guarantee program. The favorable factors in Indiana include the feed-in tariffs by IPL and NIPSCO and the expansion of the Indiana net metering rule to include all customer classes and systems up to 1 MW. The IPL feed-in-tariff expired in 2013. While it was in place, it paid $0.24/kWh for systems between 20 and 100 kW and $0.20/kWh for systems greater than 100kW up to 10 MW. Although the first phase of the NIPSCO feed-in-tariff has expired, a second phase with a 10 MW allocation for solar projects has been in place since March 2015. The first phase of the NIPSCO feed-in-tariff had offered $0.30/kWh for electricity and the associated renewable credits for units less than 10 kW and $0.26 for solar facilities up to 2 MW. The purchase rates for the second phase of the NIPSCO feed-in tariff are arranged into two categories referred to as allocation 1 and allocation 2 as shown in Table 6-4. Technology Purchase Rate per kWh Nameplate Range
(kW) Total system capacity available (MW)
Allocation 1 Allocation 2 Micro Solar $0.17 5 – 10 $0.1564 2 Intermediate Solar $0.15 > 10 – 200 $0.138 8 Micro Wind $0.25 3 – 10 $0.23 1 Intermediate Wind $0.15 > 10 – 200 $0.138 1 Biomass $0.0918 100 – 1,000 ≤ $0.0918 4
Table 6-4: Purchase rates under NIPSCO renewable feed-in tariff (Data source: NIPSCO [21, 22])
108 2017 Indiana Renewable Energy Resources Study - State Utility Forecasting Group
The total capacity allocated for the NIPSCO feed-in-tariff phase two is 16 MW assigned to the two purchase rate categories (allocation 1 and allocation 2) as follows
• For micro solar, micro wind and intermediate wind projects, the full system capacity limit for the technology as shown in Table 6-4 was made available to allocation 1 by a lottery process. If any room is available after this process more projects will be accepted into the feed-in-tariff under the allocation 2 category with a lower purchase rate as shown in Table 6-4.
• For intermediate solar (10 – 200kW), half of the 8 MW cap is available for allocation 1 which ran from March 4, 2015 to March 4, 2017. The remaining 4 MW capacity was made available under the allocation 2 rate beginning March 4, 2017. As of the writing of this report the full 8 MW allocation for intermediate solar systems had been met and the application process for both allocation 1 and 2 closed [23].
• For biomass projects, half the system wide capacity limit for the technology had been made available for the allocation 1 category from March 4, 2015 to March 4, 2017. The other half is available in a reverse auction under the allocation 2 category from March 4, 2017.
6.5 Incentives for PV systems Federal Incentives U.S. DOE Loan Guarantee Program (Section 1703, Title IV of Energy Policy Act of 2005)
provides loan guarantees for large scale innovative, high technology risk renewable energy projects that reduce the emission of pollutants [13].
Business Energy Investment Tax Credit (ITC) credits up to 30 percent of expenditures, with no maximum credit, on solar PV installations. The credit scales down to 26 percent in 2020, 22 percent in 2021 and 10 percent in subsequent years [13].
Modified Accelerated Cost-Recovery System (MACRS) + Bonus Depreciation allows businesses to recover investments in qualified renewable energy technologies through depreciation deductions. A 50 percent first year bonus depreciation, provided by the Economic Stimulus Act of 2008, has been extended to 2019. The bonus depreciation is reduced to 40 percent for 2018 and to 30 percent for 2019 [13].
USDA Rural Energy for America Program (REAP) promotes energy efficiency and renewable energy for agricultural producers and rural small businesses through the use of grants and loan guarantees for energy efficiency improvements and renewable energy systems. The program covers up to 25 percent of costs [13].
109 2017 Indiana Renewable Energy Resources Study - State Utility Forecasting Group
Clean Renewable Energy Bonds (CREBs) are tax credit bonds designed to offset the tax liability of not-for-profit entities such as public utilities, and local and state governments that, because of their structure, do not benefit from the traditional renewable energy production tax credit (PTC) [13].
Qualified Energy Conservation Bonds (QECBs) are qualified tax credit bonds that state, local and tribal governments may use to finance renewable energy projects and other energy conservation measures. Unlike the Clean Renewable Energy Bonds (CREBS) QECBs are not subject to U.S. Department of Treasury approval. The volume of the bonds is allocated to states in proportion to the state’s percentage of the U.S. population [13].
High Energy Cost Grant Program administered by USDA is aimed at improving the electricity supply infrastructure in rural areas having home energy costs exceeding 275 percent of the national average. Eligible infrastructure includes renewable resources generation [13, 24].
Residential Renewable Energy Tax Credit allows taxpayers to claim 30 percent of their qualifying expenditures on installation of renewable energy technologies including solar electric systems, solar water heaters, wind turbines and geothermal heat pumps [13].
Green Power Purchasing Goal requires that 30 percent of energy used by federal agencies must be obtained from renewable resources by 2025 [13].
Energy Efficiency Mortgage program provides mortgages that can be used by homeowners to finance a variety of energy efficiency measures, including renewable energy technologies, in a new or existing home. The federal government supports these loans by insuring them through the Federal Housing Authority or the Department of Veterans Affairs [13].
Indiana Incentives
Net Metering Rule qualifies renewable resources with a maximum capacity of 1 MW for
net metering in Indiana. The net excess generation is credited to the customer in the next billing cycle. The aggregate capacity limit is set at 1 percent of the utility’s most recent summer peak [13]. Indiana Senate Bill 309 signed into law in May 2017 made changes to the net metering rule to modify the compensation after June 30, 2022 to 1.25 times the utility’s average wholesale cost for the most recent year. Generators installed before the end of 2017 shall continue to receive full retail credit until July 1, 2047 and those installed in the years 2018 to 2022 shall receive full retail credit for their generation until July 1, 2032 [25, 26].
Solar Access Laws prevent planning and zoning authorities from prohibiting or unreasonably restricting the use of solar energy. Indiana’s solar-easement provisions do not create an automatic right to sunlight; they allow parties to voluntarily enter into solar-easement contracts which are enforceable by law [13].
Renewable Energy Property Tax Exemption provides property tax exemptions for solar thermal, PV, wind, hydroelectric and geothermal systems [13].
110 2017 Indiana Renewable Energy Resources Study - State Utility Forecasting Group
Community Conservation Challenge Grant provides $25,000-$100,000 in grants for community energy conservation projects that reduce energy consumption or displace the use of traditional energy source [27].
Sales and Use Tax Exemption for Electrical Generating Equipment exempts transactions involving manufacturing machinery, tools, and equipment used for the production of tangible personal property, which includes electricity, from state gross retail tax. However, only wind energy has clearly specified rules from the Department of Revenue [13].
Clean Energy Portfolio Goal sets a voluntary goal of obtaining 4 percent between 2013 and 2018, 7 percent between 2019 and 2024, and 10 percent by 2025, of electricity from clean energy sources based on 2010 retail sales. Participation in the goal makes utilities eligible for incentives that can be used to pay for the compliance projects. The deadline to apply for incentives in the 2013 to 2018 period has expired [13].
Northern Indiana Public Service Company (NIPSCO) offers feed-in tariff incentive rates for electricity generated from renewable resources for up to 15 years. The payment for solar systems from 5kW to under 10kW is $0.17/kWh for the projects selected in the first capacity allocation lottery (allocation 1) and $0.1564/kW for subsequent ones (allocation 2). The payment for solar systems larger than 10kW up to 200kW is $0.15/kWh for projects in allocation 1 and $0.138 for those in allocation 2. The 8 MW allocation for intermediate solar has been met for both allocation 1 and 2 has been met [13, 21, 22, 23].
6.6 References 1. International Energy Agency (IEA) Technology roadmap, solar photovoltaic energy, October
2010. http://www.iea.org/publications/freepublications/publication/pv_roadmap.pdf. 2. Asia-Pacific Economic Cooperation. Virtual Center for Environmental Technology Exchange.
http://www.apec-vc.or.jp/e/modules/tinyd00/index.php?id=74 3. U.S. Department of Energy, Office of Energy Efficiency and Renewable Energy, Department
of Energy (EERE). PV systems. http://energy.gov/eere/energybasics/articles/photovoltaic-system-basics.
4. SEIA. U.S. solar market insight report, 2016 year-in-review, executive summary . http://www.seia.org/research-resources/us-solar-market-insight http://www.seia.org/sites/default/files/Dn4u8Zl5snSMI2016YIR.pdf
5. CPV consortium. http://cpvconsortium.org/projects?country=United%20States 6. Green Rhino Energy. Concentrating Photovoltaics (CPV).
http://www.greenrhinoenergy.com/solar/technologies/pv_concentration.php 7. EERE. Organic Photovoltaics Research.
http://energy.gov/eere/sunshot/organic-photovoltaics-research 8. Lawrence Berkeley National Laboratory. Tracking the sun IX: The Installed Price of
Residential and Non-Residential Photovoltaic Systems in the United States. https://emp.lbl.gov/publications/tracking-sun-ix-installed-price
111 2017 Indiana Renewable Energy Resources Study - State Utility Forecasting Group
https://emp.lbl.gov/sites/all/files/tracking_the_sun_ix_report.pdf https://emp.lbl.gov/sites/all/files/lbnl-1006036_data_file.xlsx
9. Lawrence Berkeley National Laboratory. Tracking the sun VIII: The Installed Price of Residential and Non-Residential Photovoltaic Systems in the United States. https://emp.lbl.gov/publications/tracking-sun-viii-installed-price https://emp.lbl.gov/sites/default/files/lbnl-188238.pdf
10. Utility-Scale Solar 2016: An Empirical Analysis of Project Cost, Performance, and Pricing Trends in the United States. https://emp.lbl.gov/publications/utility-scale-solar-2016-empirical https://emp.lbl.gov/sites/default/files/utility-scale_solar_2016_report.pdf https://emp.lbl.gov/sites/default/files/utility-scale_solar_2016_slides.pdf https://emp.lbl.gov/sites/default/files/utility-scale_solar_2016_public_data_file.xlsx
11. U.S. Energy Information Administration (EIA). Construction cost data for electric generators installed in 2015. May 2017. https://www.eia.gov/electricity/generatorcosts/ https://www.eia.gov/electricity/generatorcosts/xls/generator_costs_2015.xlsx
12. EIA. Annual Energy Outlook 2017 Table 8.2. Cost and performance characteristics of new generating technologies. January 2017. https://www.eia.gov/forecasts/aeo/assumptions/pdf/table_8.2.pdf
13. Database of State Incentives for Renewables and Efficiency (DSIRE). http://www.dsireusa.org/
14. SEIA. http://www.seia.org/policy/finance-tax/1603-treasury-program 15. U.S. Department of Energy, Loan Programs Office Section 1705 Loan Program.
http://energy.gov/lpo/services/section-1705-loan-program 16. Bloomberg Politics September 22, 2017. Uncertainty Grips Solar as Industry Awaits Trump's
Tariff Ruling. https://www.bloomberg.com/news/articles/2017-09-22/itc-votes-in-favor-of-imposing-tariffs-on-u-s-solar-imports
17. SEIA. Major projects list. April 4, 2016. 18. California Energy Commission. Energy facilities Status. June 2, 2017.
http://www.energy.ca.gov/sitingcases/all_projects.html 19. George Stevens. Indiana Utility Regulatory Commission. 20. NREL. The open PV Project. http://openpv.nrel.gov/ 21. NIPSCO. March 4, 2015. http://www.nipsco.com/docs/default-source/electric-tariffs-122711-
docs/rate-665. 22. NIPSCO. 2017. Feed-in Tariff Program.
https://www.nipsco.com/our-services/renewable-energy-projects/feed-in-tariff-program 23. Email communication with NIPSCO staff. June 6, 2017. 24. U.S. Department of Agriculture, Rural Development, Electric
Programs. http://www.rd.usda.gov/programs-services/high-energy-cost-grants.

112 2017 Indiana Renewable Energy Resources Study - State Utility Forecasting Group
25. Indiana General Assembly, 2017 Session. Senate Bill 309 https://iga.in.gov/legislative/2017/bills/senate/309#digest-heading
26. The Journal Gazette, June 26 2017. Holcomb signs solar energy bill. http://www.journalgazette.net/news/local/indiana/20170503/holcomb-signs-solar-energy-bill
27. Indiana Office of Energy Development. Community Conservation Challenge. https://secure.in.gov/oed/2645.htm
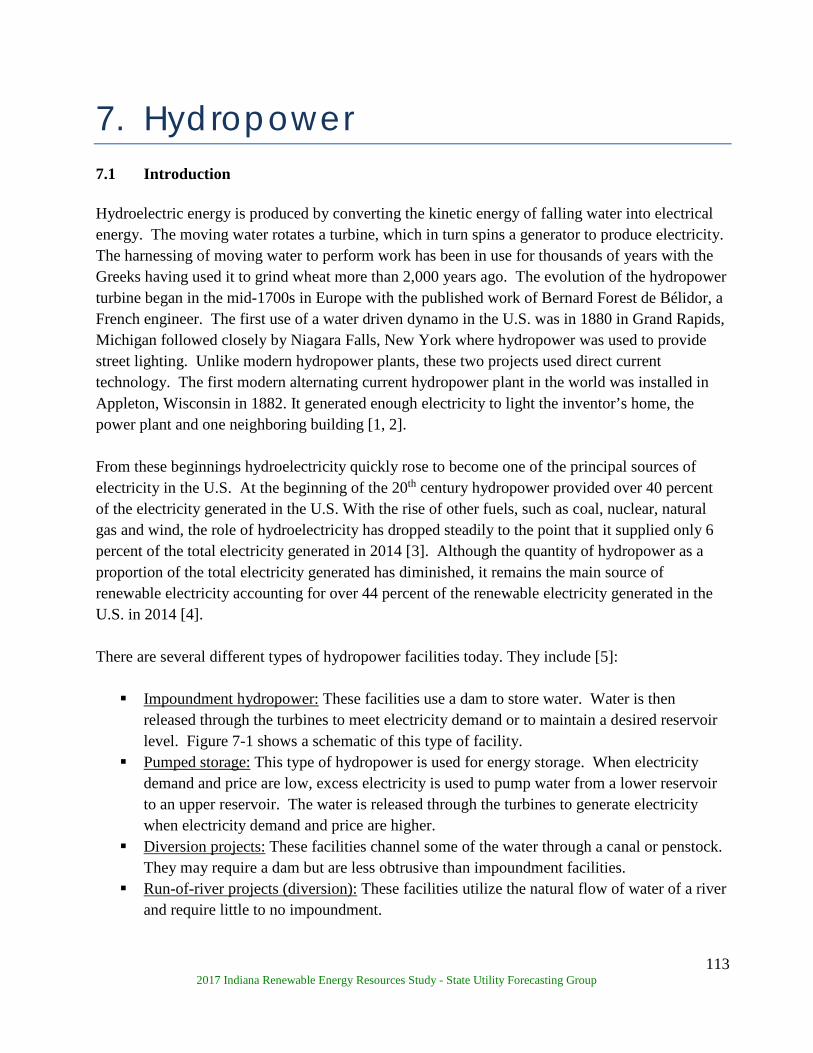
113 2017 Indiana Renewable Energy Resources Study - State Utility Forecasting Group
7. Hydropower 7.1 Introduction Hydroelectric energy is produced by converting the kinetic energy of falling water into electrical energy. The moving water rotates a turbine, which in turn spins a generator to produce electricity. The harnessing of moving water to perform work has been in use for thousands of years with the Greeks having used it to grind wheat more than 2,000 years ago. The evolution of the hydropower turbine began in the mid-1700s in Europe with the published work of Bernard Forest de Bélidor, a French engineer. The first use of a water driven dynamo in the U.S. was in 1880 in Grand Rapids, Michigan followed closely by Niagara Falls, New York where hydropower was used to provide street lighting. Unlike modern hydropower plants, these two projects used direct current technology. The first modern alternating current hydropower plant in the world was installed in Appleton, Wisconsin in 1882. It generated enough electricity to light the inventor’s home, the power plant and one neighboring building [1, 2]. From these beginnings hydroelectricity quickly rose to become one of the principal sources of electricity in the U.S. At the beginning of the 20th century hydropower provided over 40 percent of the electricity generated in the U.S. With the rise of other fuels, such as coal, nuclear, natural gas and wind, the role of hydroelectricity has dropped steadily to the point that it supplied only 6 percent of the total electricity generated in 2014 [3]. Although the quantity of hydropower as a proportion of the total electricity generated has diminished, it remains the main source of renewable electricity accounting for over 44 percent of the renewable electricity generated in the U.S. in 2014 [4]. There are several different types of hydropower facilities today. They include [5]: Impoundment hydropower: These facilities use a dam to store water. Water is then
released through the turbines to meet electricity demand or to maintain a desired reservoir level. Figure 7-1 shows a schematic of this type of facility.
Pumped storage: This type of hydropower is used for energy storage. When electricity demand and price are low, excess electricity is used to pump water from a lower reservoir to an upper reservoir. The water is released through the turbines to generate electricity when electricity demand and price are higher.
Diversion projects: These facilities channel some of the water through a canal or penstock. They may require a dam but are less obtrusive than impoundment facilities.
Run-of-river projects (diversion): These facilities utilize the natural flow of water of a river and require little to no impoundment.
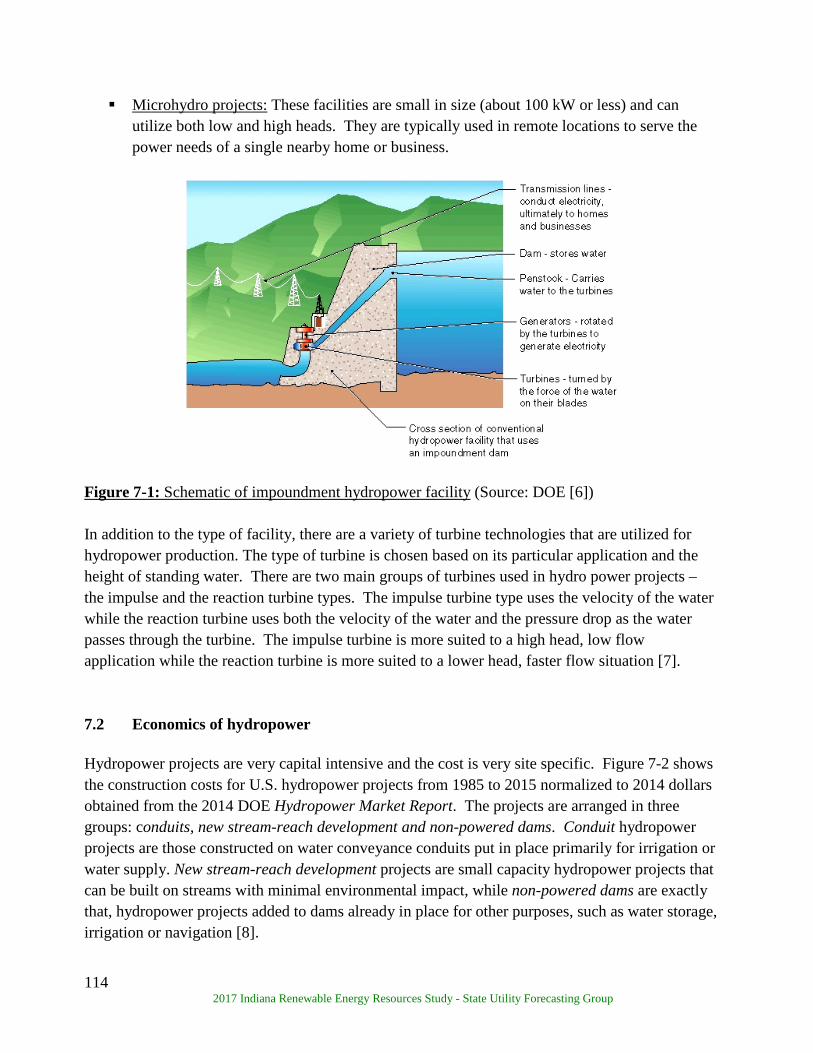
114 2017 Indiana Renewable Energy Resources Study - State Utility Forecasting Group
Microhydro projects: These facilities are small in size (about 100 kW or less) and can utilize both low and high heads. They are typically used in remote locations to serve the power needs of a single nearby home or business.
Figure 7-1: Schematic of impoundment hydropower facility (Source: DOE [6])
In addition to the type of facility, there are a variety of turbine technologies that are utilized for hydropower production. The type of turbine is chosen based on its particular application and the height of standing water. There are two main groups of turbines used in hydro power projects – the impulse and the reaction turbine types. The impulse turbine type uses the velocity of the water while the reaction turbine uses both the velocity of the water and the pressure drop as the water passes through the turbine. The impulse turbine is more suited to a high head, low flow application while the reaction turbine is more suited to a lower head, faster flow situation [7]. 7.2 Economics of hydropower Hydropower projects are very capital intensive and the cost is very site specific. Figure 7-2 shows the construction costs for U.S. hydropower projects from 1985 to 2015 normalized to 2014 dollars obtained from the 2014 DOE Hydropower Market Report. The projects are arranged in three groups: conduits, new stream-reach development and non-powered dams. Conduit hydropower projects are those constructed on water conveyance conduits put in place primarily for irrigation or water supply. New stream-reach development projects are small capacity hydropower projects that can be built on streams with minimal environmental impact, while non-powered dams are exactly that, hydropower projects added to dams already in place for other purposes, such as water storage, irrigation or navigation [8].
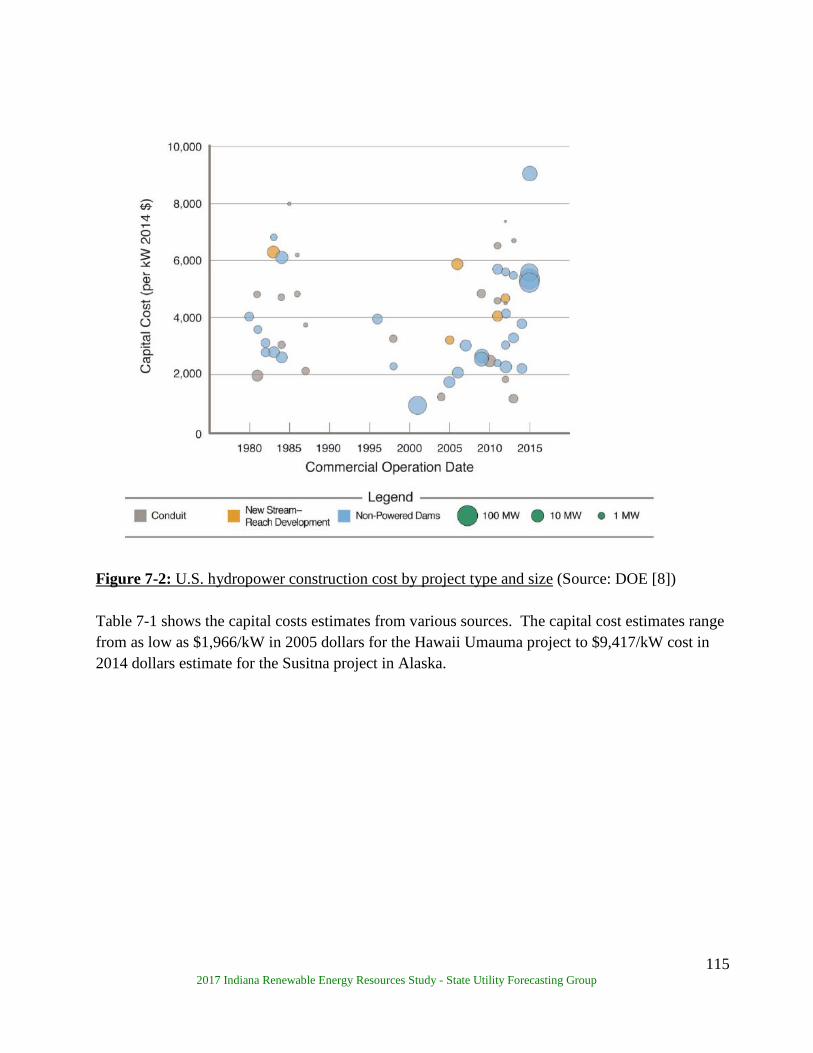
115 2017 Indiana Renewable Energy Resources Study - State Utility Forecasting Group
Figure 7-2: U.S. hydropower construction cost by project type and size (Source: DOE [8]) Table 7-1 shows the capital costs estimates from various sources. The capital cost estimates range from as low as $1,966/kW in 2005 dollars for the Hawaii Umauma project to $9,417/kW cost in 2014 dollars estimate for the Susitna project in Alaska.
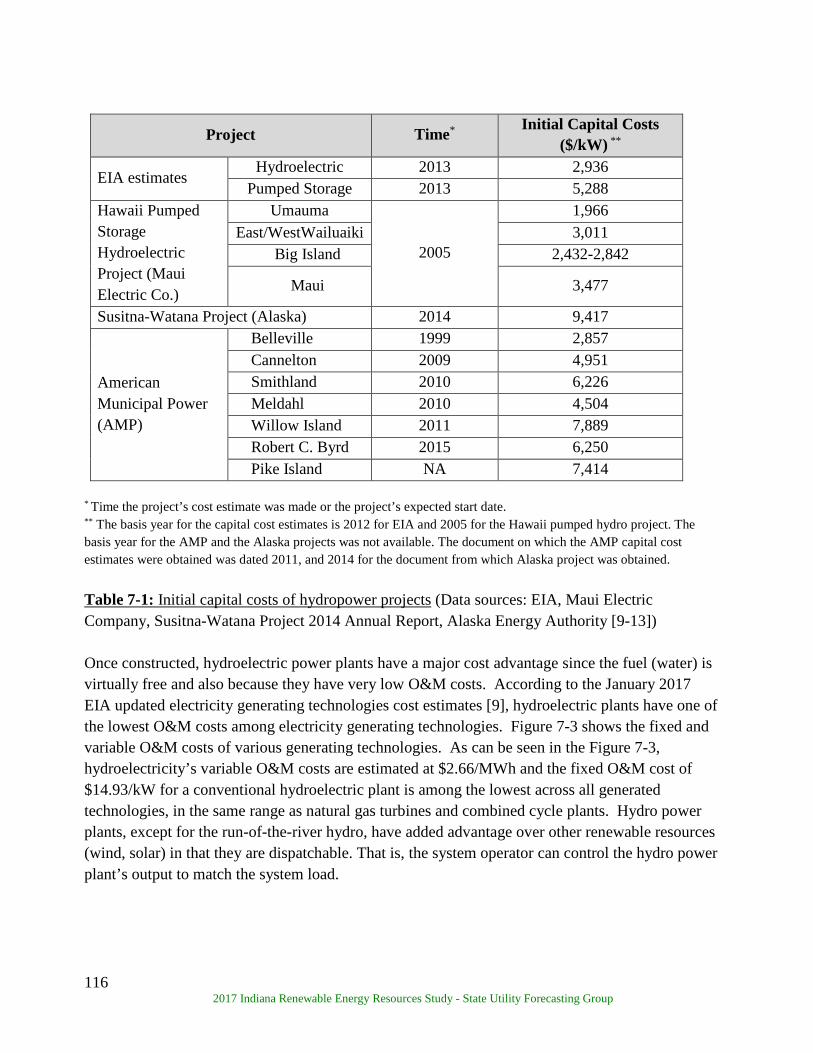
116 2017 Indiana Renewable Energy Resources Study - State Utility Forecasting Group
Project Time* Initial Capital Costs ($/kW) **
EIA estimates Hydroelectric 2013 2,936
Pumped Storage 2013 5,288 Hawaii Pumped Storage Hydroelectric Project (Maui Electric Co.)
Umauma
2005
1,966 East/WestWailuaiki 3,011
Big Island 2,432-2,842
Maui 3,477
Susitna-Watana Project (Alaska) 2014 9,417
American Municipal Power (AMP)
Belleville 1999 2,857 Cannelton 2009 4,951 Smithland 2010 6,226 Meldahl 2010 4,504 Willow Island 2011 7,889 Robert C. Byrd 2015 6,250 Pike Island NA 7,414
* Time the project’s cost estimate was made or the project’s expected start date. ** The basis year for the capital cost estimates is 2012 for EIA and 2005 for the Hawaii pumped hydro project. The basis year for the AMP and the Alaska projects was not available. The document on which the AMP capital cost estimates were obtained was dated 2011, and 2014 for the document from which Alaska project was obtained. Table 7-1: Initial capital costs of hydropower projects (Data sources: EIA, Maui Electric Company, Susitna-Watana Project 2014 Annual Report, Alaska Energy Authority [9-13]) Once constructed, hydroelectric power plants have a major cost advantage since the fuel (water) is virtually free and also because they have very low O&M costs. According to the January 2017 EIA updated electricity generating technologies cost estimates [9], hydroelectric plants have one of the lowest O&M costs among electricity generating technologies. Figure 7-3 shows the fixed and variable O&M costs of various generating technologies. As can be seen in the Figure 7-3, hydroelectricity’s variable O&M costs are estimated at $2.66/MWh and the fixed O&M cost of $14.93/kW for a conventional hydroelectric plant is among the lowest across all generated technologies, in the same range as natural gas turbines and combined cycle plants. Hydro power plants, except for the run-of-the-river hydro, have added advantage over other renewable resources (wind, solar) in that they are dispatchable. That is, the system operator can control the hydro power plant’s output to match the system load.

117 2017 Indiana Renewable Energy Resources Study - State Utility Forecasting Group
Figure 7-3: Variable and fixed O&M costs of generating technologies (Data source: EIA [9]) 7.3 State of hydropower nationally Hydropower has historically been the primary source of renewable energy in the U.S. Figure 7-4 shows the amount of electricity generated from renewable resources from 1949 to 2016. In the early parts of the 20th century, hydroelectricity accounted for virtually all the renewable electricity consumed in the U.S. with all other renewable resources combined contributing less than one percent up to 1974. Although this dominance of hydroelectricity has steadily eroded over time, it still accounts for almost half of the renewable electricity generated and a quarter of the renewable energy consumed in the U.S. In 2016 hydroelectricity accounted for 44 percent of the renewable electricity generated and 24 percent of the total renewable energy consumed in the U.S.
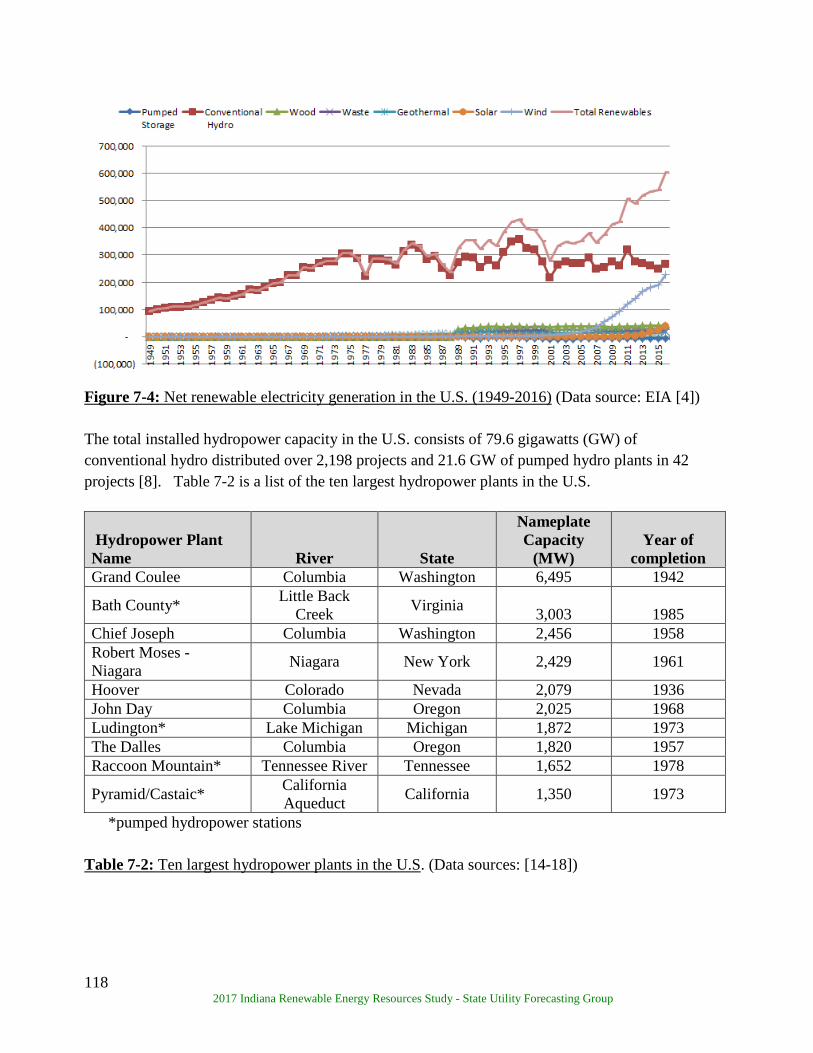
118 2017 Indiana Renewable Energy Resources Study - State Utility Forecasting Group
Figure 7-4: Net renewable electricity generation in the U.S. (1949-2016) (Data source: EIA [4]) The total installed hydropower capacity in the U.S. consists of 79.6 gigawatts (GW) of conventional hydro distributed over 2,198 projects and 21.6 GW of pumped hydro plants in 42 projects [8]. Table 7-2 is a list of the ten largest hydropower plants in the U.S.
Hydropower Plant Name River State
Nameplate Capacity
(MW) Year of
completion Grand Coulee Columbia Washington 6,495 1942
Bath County* Little Back Creek Virginia 3,003 1985
Chief Joseph Columbia Washington 2,456 1958 Robert Moses - Niagara Niagara New York 2,429 1961
Hoover Colorado Nevada 2,079 1936 John Day Columbia Oregon 2,025 1968 Ludington* Lake Michigan Michigan 1,872 1973 The Dalles Columbia Oregon 1,820 1957 Raccoon Mountain* Tennessee River Tennessee 1,652 1978
Pyramid/Castaic* California Aqueduct California 1,350 1973
*pumped hydropower stations
Table 7-2: Ten largest hydropower plants in the U.S. (Data sources: [14-18])

119 2017 Indiana Renewable Energy Resources Study - State Utility Forecasting Group
Table 7-3 shows the top ten hydro states ranked by their hydroelectricity output in 2015 and Table 7-4 shows the top ten hydro states ranked by installed hydro capacity at the end of 2015. Approximately sixty percent of the hydroelectricity generation in 2015 was from the top four states of Washington, Oregon, New York, and California.
1. Washington 73,404,916 6. Alabama 9,861,804 2. Oregon 31,253,851 7. Tennessee 9,581,240 3. New York 26,014,520 8. Idaho 8,756,622 4. California 13,808,498 9. Arizona 6,535,722 5. Montana 9,887,729 10. South Dakota 4,850,485
Table 7-3: Top ten U.S. hydropower generating states in 2015 (MWh) (Data source: EIA [19])
1. Washington 21,242 6. Montana 2,758 2. California 10,186 7. Arizona 2,721 3. Oregon 8,525 8. Idaho 2,708 4. New York 4,712 9. Tennessee 2,619 5. Alabama 3,271 10. Georgia 2,048
Table 7-4: Top ten U.S. hydropower capacity states at end of 2015 (MW) (Data source: EIA [20])
In 2012 DOE released an assessment of the hydropower potential available at hydro sites that had dams already in place but no power generation equipment installed. According to the DOE there were a total of 80,000 such non-powered dams providing services such as navigation, water supply and recreation. The combined electricity generating potential at these sites was assessed at 12 GW [21]. Figure 7-5 shows the location of the non-powered dams with a hydropower potential greater than 1 MW. Table 7-5 shows the hydropower potential from non-powered dams for the states in the contiguous U.S.

120 2017 Indiana Renewable Energy Resources Study - State Utility Forecasting Group
Figure 7-5: Non-powered dams with potential capacity over 1 MW (Source: DOE [21])
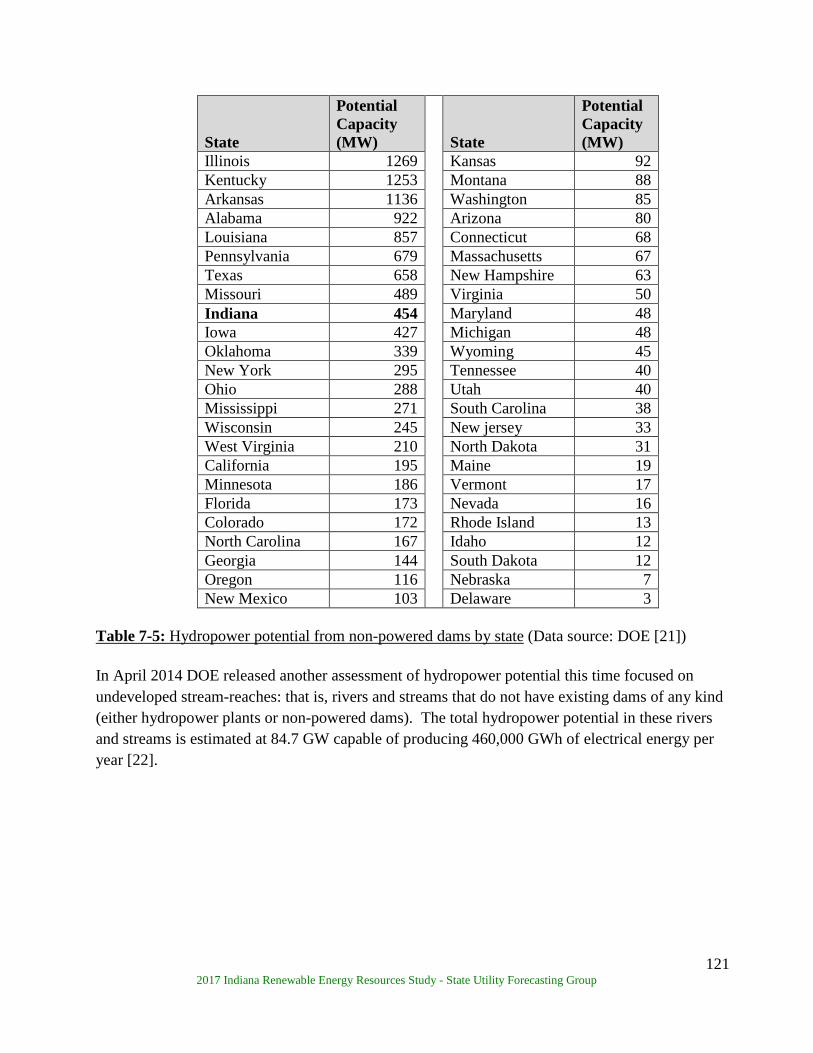
121 2017 Indiana Renewable Energy Resources Study - State Utility Forecasting Group
State
Potential Capacity (MW) State
Potential Capacity (MW)
Illinois 1269 Kansas 92 Kentucky 1253 Montana 88 Arkansas 1136 Washington 85 Alabama 922 Arizona 80 Louisiana 857 Connecticut 68 Pennsylvania 679 Massachusetts 67 Texas 658 New Hampshire 63 Missouri 489 Virginia 50 Indiana 454 Maryland 48 Iowa 427 Michigan 48 Oklahoma 339 Wyoming 45 New York 295 Tennessee 40 Ohio 288 Utah 40 Mississippi 271 South Carolina 38 Wisconsin 245 New jersey 33 West Virginia 210 North Dakota 31 California 195 Maine 19 Minnesota 186 Vermont 17 Florida 173 Nevada 16 Colorado 172 Rhode Island 13 North Carolina 167 Idaho 12 Georgia 144 South Dakota 12 Oregon 116 Nebraska 7 New Mexico 103 Delaware 3
Table 7-5: Hydropower potential from non-powered dams by state (Data source: DOE [21]) In April 2014 DOE released another assessment of hydropower potential this time focused on undeveloped stream-reaches: that is, rivers and streams that do not have existing dams of any kind (either hydropower plants or non-powered dams). The total hydropower potential in these rivers and streams is estimated at 84.7 GW capable of producing 460,000 GWh of electrical energy per year [22].
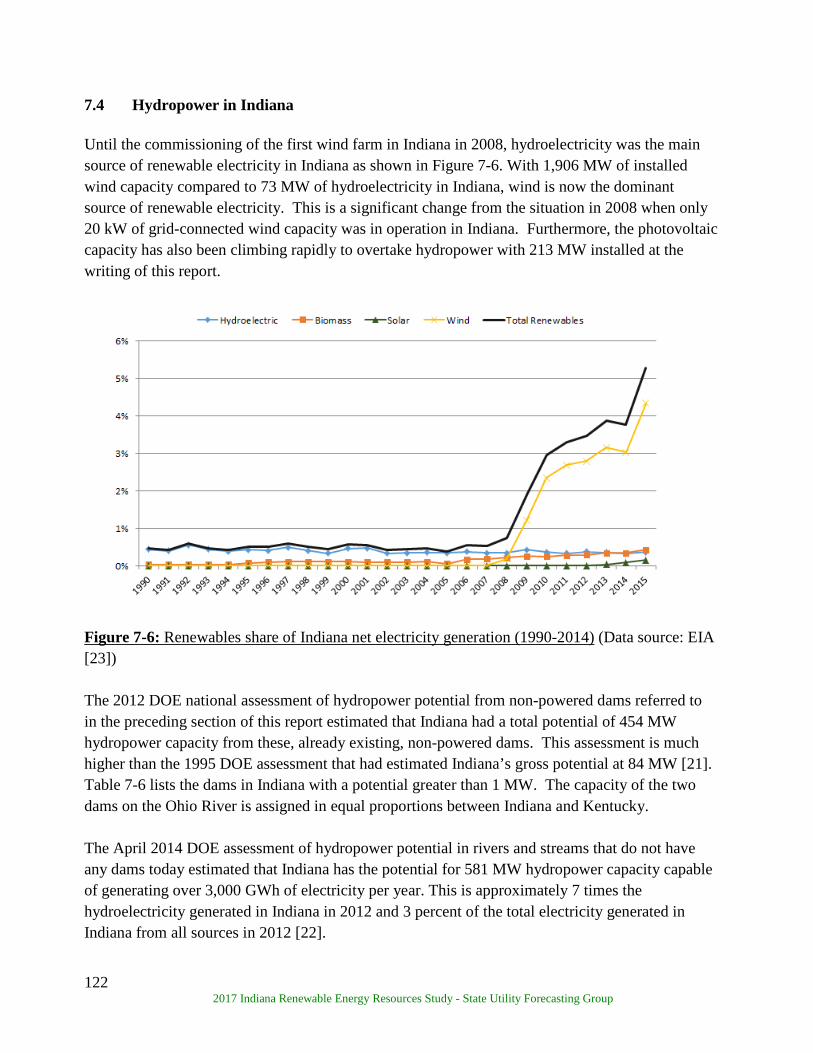
122 2017 Indiana Renewable Energy Resources Study - State Utility Forecasting Group
7.4 Hydropower in Indiana Until the commissioning of the first wind farm in Indiana in 2008, hydroelectricity was the main source of renewable electricity in Indiana as shown in Figure 7-6. With 1,906 MW of installed wind capacity compared to 73 MW of hydroelectricity in Indiana, wind is now the dominant source of renewable electricity. This is a significant change from the situation in 2008 when only 20 kW of grid-connected wind capacity was in operation in Indiana. Furthermore, the photovoltaic capacity has also been climbing rapidly to overtake hydropower with 213 MW installed at the writing of this report.
Figure 7-6: Renewables share of Indiana net electricity generation (1990-2014) (Data source: EIA [23])
The 2012 DOE national assessment of hydropower potential from non-powered dams referred to in the preceding section of this report estimated that Indiana had a total potential of 454 MW hydropower capacity from these, already existing, non-powered dams. This assessment is much higher than the 1995 DOE assessment that had estimated Indiana’s gross potential at 84 MW [21]. Table 7-6 lists the dams in Indiana with a potential greater than 1 MW. The capacity of the two dams on the Ohio River is assigned in equal proportions between Indiana and Kentucky. The April 2014 DOE assessment of hydropower potential in rivers and streams that do not have any dams today estimated that Indiana has the potential for 581 MW hydropower capacity capable of generating over 3,000 GWh of electricity per year. This is approximately 7 times the hydroelectricity generated in Indiana in 2012 and 3 percent of the total electricity generated in Indiana from all sources in 2012 [22].

123 2017 Indiana Renewable Energy Resources Study - State Utility Forecasting Group
Dam Name County City River Hydropower
Potential (MW)
John T. Myers locks and dams Posey Mt. Vernon Ohio River 395
Newburgh locks and dams Henderson Newburgh Ohio River 319
Mississinewa Lake dam Miami Peru Mississinewa River 14
J. Edward Roush Lake dam Huntington Huntington Wabash River 9
Salamonie Lake dam Wabash Lagro Salamonie River 9
Brookville Lake dam Franklin Brookville White Water River (East fork) 8
Monroe Lake dam Monroe Guthrie Salt Creek 8
White River dam Marion Indianapolis White River 3
Patoka Lake dam Dubois Jasper Patoka River 3
Cagles Mill Lake dam Putman Bowling Green Mill Creek 2
Cecil M. Harden Lake dam Parke Mansfield Raccoon Creek 2
Ball Band dam St. Joseph Mishawaka St. Joseph River 2
Seymour Water Co. dam Jackson Seymour White Water River (East fork) 2
Eagles Creek Reservoir dam Marion Clermont Eagle Creek 2
West fork White River dam Morgan Martinsville White River 2
Harding St. power plant dam Marion Indianapolis White River 2
Versailles State Park dam Ripley Versailles Laughery Creek 1.4
Emerichsville dam Marion Indianapolis White River 1.3
Broad Ripple dam Marion Indianapolis White River 1.3
Geist Reservoir dam Marion Indianapolis Fall Creek 1.3
Cedarville dam Allen Cedarville St. Joseph River 1.3
Hosey (Maumee River) dam Allen Fort Wayne Maumee River 1.2 Table 7-6: Indiana non-powered dams with potential capacity over 1 MW (Data source: DOE [22])
124 2017 Indiana Renewable Energy Resources Study - State Utility Forecasting Group
American Municipal Power (AMP), a wholesale electricity supplier to municipal utilities in Ohio, Pennsylvania, Michigan, Virginia, Kentucky and West Virginia is in the process of developing five run-of-the-river hydroelectric projects along the Ohio River. Three of the projects, the 105 MW Melhahl, the 44 MW Willow Island, and the 88 MW Cannelton projects were completed in 2016; while the 76 MW Smithland is currently under construction. One of the projects, the 48 MW Robert Byrd is in the licensing process. The Cannelton project is located on the Indiana/Kentucky section of the river and the adjoining city of Cannelton, Indiana has joined as a member of AMP [24]. 7.5 Incentives for hydropower Federal Incentives
Renewable Electricity Production Tax Credit (PTC) provides a 1.2 cents/kWh tax credit for
small irrigation hydroelectric facilities for ten years of operation. The PTC expired at the end of 2016 but is available for systems whose construction started before the end of 2016 [25].
U.S. DOE Loan Guarantee Program (Section 1703, Title IV of Energy Policy Act of 2005) provides loan guarantees for large scale innovative, high technology risk renewable energy projects that reduce the emission of pollutants [25].
USDA Rural Energy for America Program (REAP) promotes energy efficiency and renewable energy for agricultural producers and rural small businesses through the use of grants and loan guarantees for energy efficiency improvements and renewable energy systems. The program covers up to 25 percent of costs [25].
Clean Renewable Energy Bonds (CREBs) are tax credit bonds designed to offset the tax liability of not-for-profit entities such as public utilities, and local and state governments that, because of their structure, do not benefit from the traditional renewable energy production tax credit (PTC) [25].
Qualified Energy Conservation Bonds (QECBs) are qualified tax credit bonds that state, local and tribal governments may use to finance renewable energy projects and other energy conservation measures. Unlike the Clean Renewable Energy Bonds (CREBS) QECBs are not subject to U.S. Department of Treasury approval. The volume of the bonds is allocated to states in proportion to the state’s percentage of the U.S. population [25].
High Energy Cost Grant Program administered by USDA is aimed at improving the electricity supply infrastructure in rural areas having home energy costs exceeding 275 percent of the national average. Eligible infrastructure includes renewable resources generation [25, 26].
125 2017 Indiana Renewable Energy Resources Study - State Utility Forecasting Group
Green Power Purchasing Goal requires that 30 percent of energy used by federal agencies must be obtained from renewable resources by 2025 [25].
Indiana Incentives Net Metering Rule qualifies renewable resource facilities with a maximum capacity of 1
MW for net metering. The net excess generation is credited to the customer in the next billing cycle [25]. ]. Indiana Senate Bill 309 signed into law in May 2017 made changes to the net metering rule to modify the compensation after June 30, 2022 to 1.25 times the utility’s average wholesale cost for the most recent year. Generators installed before the end of 2017 shall continue to receive full retail credit until July 1, 2047 and those installed in the years 2018 to 2022 shall receive full retail credit for their generation until July 1, 2032 [27, 28].
Renewable Energy Property Tax Exemption provides property tax exemptions for solar, wind, hydroelectric and geothermal systems [25].
Sales and Use Tax Exemption for Electrical Generating Equipment exempts transactions involving manufacturing machinery, tools, and equipment used for the production of tangible personal property, which includes electricity, from state gross retail tax. However, only wind energy has clearly specified rules from the Department of Revenue [25].
Clean Energy Portfolio Goal sets a voluntary goal of obtaining 4 percent between 2013 and 2018, 7 percent between 2019 and 2024, and 10 percent by 2025, of electricity from clean energy sources based on 2010 retail sales. Participation in the goal makes utilities eligible for incentives that can be used to pay for the compliance projects. The deadline to apply for incentives in the 2013 to 2018 period has expired. The deadline to apply for incentives in the 2013 to 2018 period has expired [25].
7.6 References 1. U.S. Department of Energy, Office of Energy Efficiency and Renewable Energy (EERE).
History of hydropower. http://energy.gov/eere/water/history-hydropower 2. The Library of Congress. http://www.americaslibrary.gov/jb/gilded/jb_gilded_hydro_1.html 3. U.S. Department of the Interior, Bureau of Reclamation. The history of hydropower
development in the United States. http://www.usbr.gov/power/edu/history.html 4. EIA. May 2017 Monthly Energy Review. Table 7.2a.
http://www.eia.gov/totalenergy/data/monthly/#electricity 5. EERE. Hydropower: Setting our course for our energy
future. http://www.nrel.gov/docs/fy04osti/34916.pdf 6. U.S. Department of Energy, Office of Energy Efficiency and Renewable Energy (EERE).
Types of hydropower plants. http://energy.gov/eere/water/types-hydropower-plants.
126 2017 Indiana Renewable Energy Resources Study - State Utility Forecasting Group
7. U.S. Department of Energy, Office of Energy Efficiency and Renewable Energy (EERE). Types of hydropower turbines. http://energy.gov/eere/water/types-hydropower-turbines
8. EERE. 2014 Hydropower Market Report. http://energy.gov/eere/water/downloads/2014-hydropower-market-report
9. U.S. Energy Information Administration (EIA). Cost and performance characteristics of new generating technologies. January 2017. https://www.eia.gov/forecasts/aeo/assumptions/pdf/table_8.2.pdf
10. Maui Electric Company, Ltd. Hawaii pumped storage hydroelectric project: Advisory group meeting, November 1, 2005.
11. Susitna-Watana Hydro. http://www.susitna-watanahydro.org/?attachment_id=5018 12. Alaska Energy Authority. Susitna-Watana Hydro. Report to the Legislature, 2014.
http://www.susitna-watanahydro.org/wp-content/uploads/2015/01/SWD110-Annual-Report-2014_FINAL3.pdf
13. AMP. Organization and generation project overview, June 2011. 14. EIA. Electricity Generating Capacity. Released April 2017.
https://www.eia.gov/electricity/data/eia860m/ https://www.eia.gov/electricity/data/eia860m/xls/april_generator2017.xlsx
15. Dominion Energy. Bath County Pumped Storage. https://www.dominionenergy.com/about-us/making-energy/renewables/water/bath-county-pumped-storage-station
16. Hydroworld. Major Overhaul Boosts Performance at Ludington Pumped-Storage Plant. http://www.hydroworld.com/articles/hr/print/volume-35/issue-9/cover-story/major-overhaul-boosts-performance-at-ludington-pumped-storage-plant.html
17. TVA. Raccoon Mountain. https://www.tva.com/Energy/Our-Power-System/Hydroelectric/Raccoon-Mountain
18. LAPWD. South SWP Hydropower Relicensing. http://south-swp-hydropower-relicensing.com/project/
19. EIA. U.S. Net Generation by State by Type of Producer by Energy Source. https://www.eia.gov/electricity/data/state/ https://www.eia.gov/electricity/data/state/annual_generation_state.xls
20. EIA. Existing Nameplate and Net Summer Capacity by Energy Source, Producer Type and State. https://www.eia.gov/electricity/data/state/ https://www.eia.gov/electricity/data/state/existcapacity_annual.xls
21. DOE. An Assessment of Energy Potential at Non-Powered Dams in the United States. http://nhaap.ornl.gov/content/non-powered-dam-potential http://www1.eere.energy.gov/water/pdfs/npd_report.pdf
22. New Stream-reach Development. A Comprehensive Assessment of Hydropower Energy Potential in the United States. http://nhaap.ornl.gov/nsd#NSDfindings, http://nhaap.ornl.gov/sites/default/files/ORNL_NSD_FY14_Final_Report.pdf
127 2017 Indiana Renewable Energy Resources Study - State Utility Forecasting Group
23. EIA. Indiana Electricity Profile Table 5, Release date: January 2017. https://www.eia.gov/electricity/state/indiana/ https://www.eia.gov/electricity/state/indiana/xls/in.xlsx
24. American Municipal Power (AMP). Hydroelectric power http://www.amppartners.org/generation/hydro
25. Database of State Incentives for Renewables and Efficiency (DSIRE). http://www.dsireusa.org/
26. U.S. Department of Agriculture, Rural Development, Electric Programs. http://www.rd.usda.gov/programs-services/high-energy-cost-grants
27. Indiana General Assembly, 2017 Session. Senate Bill 309. https://iga.in.gov/legislative/2017/bills/senate/309#digest-heading
28. The Journal Gazette, June 26 2017. Holcomb signs solar energy bill. http://www.journalgazette.net/news/local/indiana/20170503/holcomb-signs-solar-energy-bill