
State Plan target - Office of Environment and Heritage - NSW
18
State of the catchments 2010 Border Rivers–Gwydir region Riverine ecosystems A detailed technical report describes the methods used to derive the information contained in this report. At the time of publication of the State of the catchments (SOC) 2010 reports, the technical reports were being prepared for public release. When complete, they will be available on the NOW website: www.water.nsw.gov.au. Note: All data on natural resource condition, pressures and management activity included in this SOC report, as well as the technical report, was collected up to January 2009. State Plan target By 2015 there is an improvement in the condition of riverine ecosystems. Background The Border Rivers–Gwydir region (Figure 1) occupies an area of approximately 50,000 km² and comprises two major catchments: the Border Rivers and Gwydir River. The Border Rivers catchment is located on the New South Wales–Queensland border, with an area of about 24,000 km². The NSW portion of the Border Rivers rises in the hilly and rugged granite and basalt areas of the New England tablelands from an elevation of 1300 m above sea level. The Gwydir River catchment covers approximately 26,500 km² and is located in the south-west of the region. The Gwydir River rises in the New England tablelands between Uralla and Guyra at an elevation of 1050 m above sea level. The Border Rivers catchment consists of a number of major upland tributaries and flows westward onto a flat plain with numerous effluent channels. In the north-east the Macintyre River rises in the Waterloo Range and is 300 km in length. The Severn River is a major tributary upstream of the Macintyre River and flows through Pindari Dam. Immediately to the north and flowing into the Macintyre River is the Dumaresq River. The Dumaresq River is 214 km in length and is formed by joining the Severn River, which rises in Queensland, and Tenterfield Creek, which rises in the tablelands west of Tenterfield. Other tributaries are Mole River and Beardy River.
Transcript of State Plan target - Office of Environment and Heritage - NSW

State of the catchments 2010
Border Rivers–Gwydir region
Riverine ecosystems
A detailed technical report describes the methods used to derive the information contained in this report. At the time of publication of the State of the catchments (SOC) 2010 reports, the technical reports were being prepared for public release. When complete, they will be available on the NOW website: www.water.nsw.gov.au.
Note: All data on natural resource condition, pressures and management activity included in this SOC report, as well as the technical report, was collected up to January 2009.
State Plan target
By 2015 there is an improvement in the condition of riverine ecosystems.
Background
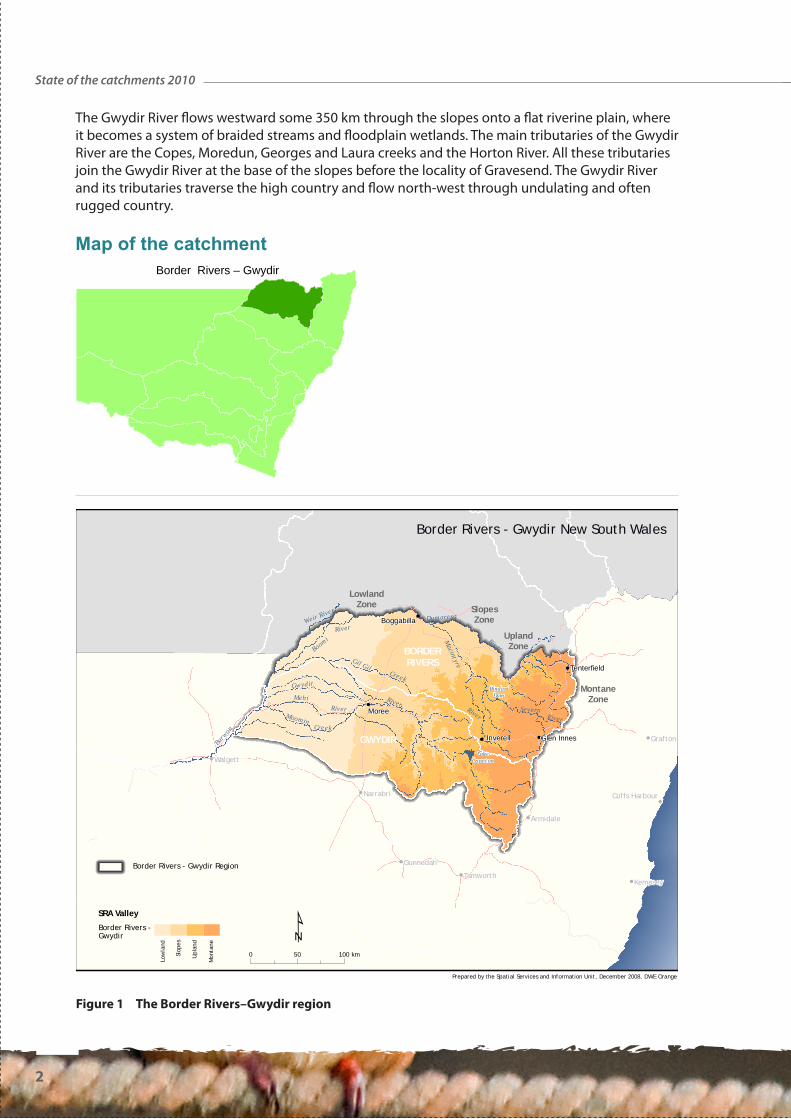
The Border Rivers–Gwydir region (Figure 1) occupies an area of approximately 50,000 km² and comprises two major catchments: the Border Rivers and Gwydir River. The Border Rivers catchment is located on the New South Wales–Queensland border, with an area of about 24,000 km². The NSW portion of the Border Rivers rises in the hilly and rugged granite and basalt areas of the New England tablelands from an elevation of 1300 m above sea level. The Gwydir River catchment covers approximately 26,500 km² and is located in the south-west of the region. The Gwydir River rises in the New England tablelands between Uralla and Guyra at an elevation of 1050 m above sea level.
The Border Rivers catchment consists of a number of major upland tributaries and flows westward onto a flat plain with numerous effluent channels. In the north-east the Macintyre River rises in the Waterloo Range and is 300 km in length. The Severn River is a major tributary upstream of the Macintyre River and flows through Pindari Dam. Immediately to the north and flowing into the Macintyre River is the Dumaresq River. The Dumaresq River is 214 km in length and is formed by joining the Severn River, which rises in Queensland, and Tenterfield Creek, which rises in the tablelands west of Tenterfield. Other tributaries are Mole River and Beardy River.
State of the catchments 2010
2
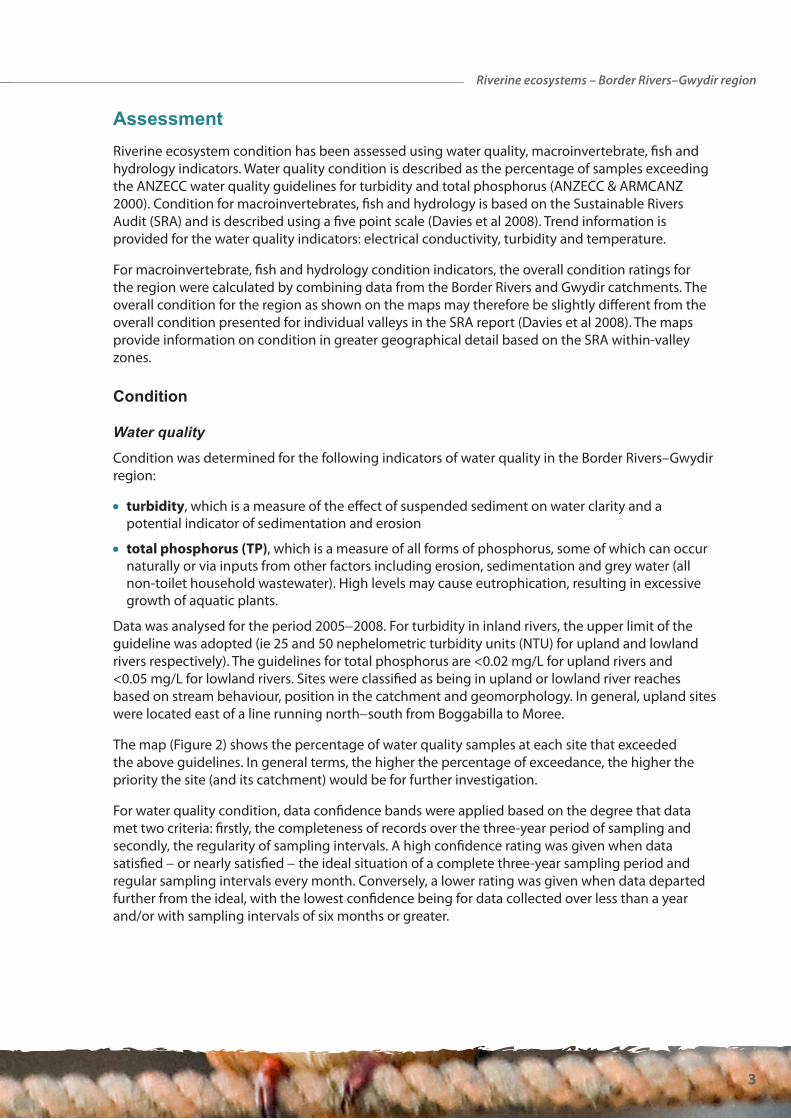
The Gwydir River flows westward some 350 km through the slopes onto a flat riverine plain, where it becomes a system of braided streams and floodplain wetlands. The main tributaries of the Gwydir River are the Copes, Moredun, Georges and Laura creeks and the Horton River. All these tributaries join the Gwydir River at the base of the slopes before the locality of Gravesend. The Gwydir River and its tributaries traverse the high country and flow north-west through undulating and often rugged country.
Map of the catchment
Figure 1 The Border Rivers–Gwydir region
Border Rivers – Gwydir
MontaneZone
UplandZone
SlopesZone
LowlandZone
Moree
Inverell Glen Innes
Boggabilla
Tenterfield
LakeCopeton
PindariDam
NAMOI
BORDERRIVERS
GWYDIRBarw
on
Macintyre
Severn
Gwydir
River
Dumaresq
Creek
Gil Gil
Mehi
Weir River
River
River
Moomin
River
Boomi
Creek
River
River
Walgett
Grafton
Kempsey
Armidale
Tamworth
Gunnedah
Narrabri Coffs Harbour
Prepared by the Spatial Services and Information Unit, December 2008, DWE Orange
Border Rivers - Gwydir New South WalesBorder Rivers - Gwydir New South Wales
0 50 100 km
SRA Valley
Border Rivers -Gwydir
Low
land
Slop
es
Upl
and
Mon
tane
Border Rivers - Gwydir Region
3
Riverine ecosystems – Border Rivers–Gwydir region
AssessmentRiverine ecosystem condition has been assessed using water quality, macroinvertebrate, fish and hydrology indicators. Water quality condition is described as the percentage of samples exceeding the ANZECC water quality guidelines for turbidity and total phosphorus (ANZECC & ARMCANZ 2000). Condition for macroinvertebrates, fish and hydrology is based on the Sustainable Rivers Audit (SRA) and is described using a five point scale (Davies et al 2008). Trend information is provided for the water quality indicators: electrical conductivity, turbidity and temperature.
For macroinvertebrate, fish and hydrology condition indicators, the overall condition ratings for the region were calculated by combining data from the Border Rivers and Gwydir catchments. The overall condition for the region as shown on the maps may therefore be slightly different from the overall condition presented for individual valleys in the SRA report (Davies et al 2008). The maps provide information on condition in greater geographical detail based on the SRA within-valley zones.
Condition
Water quality
Condition was determined for the following indicators of water quality in the Border Rivers–Gwydir region:
• turbidity, which is a measure of the effect of suspended sediment on water clarity and a potential indicator of sedimentation and erosion
• total phosphorus (TP), which is a measure of all forms of phosphorus, some of which can occur naturally or via inputs from other factors including erosion, sedimentation and grey water (all non-toilet household wastewater). High levels may cause eutrophication, resulting in excessive growth of aquatic plants.
Data was analysed for the period 2005-2008. For turbidity in inland rivers, the upper limit of the guideline was adopted (ie 25 and 50 nephelometric turbidity units (NTU) for upland and lowland rivers respectively). The guidelines for total phosphorus are <0.02 mg/L for upland rivers and <0.05 mg/L for lowland rivers. Sites were classified as being in upland or lowland river reaches based on stream behaviour, position in the catchment and geomorphology. In general, upland sites were located east of a line running north-south from Boggabilla to Moree.
The map (Figure 2) shows the percentage of water quality samples at each site that exceeded the above guidelines. In general terms, the higher the percentage of exceedance, the higher the priority the site (and its catchment) would be for further investigation.
For water quality condition, data confidence bands were applied based on the degree that data met two criteria: firstly, the completeness of records over the three-year period of sampling and secondly, the regularity of sampling intervals. A high confidence rating was given when data satisfied - or nearly satisfied - the ideal situation of a complete three-year sampling period and regular sampling intervals every month. Conversely, a lower rating was given when data departed further from the ideal, with the lowest confidence being for data collected over less than a year and/or with sampling intervals of six months or greater.

State of the catchments 2010
4
Trends (Figure 3) were determined for the following indicators of water quality in the Border Rivers–Gwydir region:
• water temperature, which is affected by altitude, shading, channel width and depth, flow, water impoundment, groundwater discharge and climate
• electrical conductivity (EC), which measures the ability of water to carry an electrical current. This ability depends on a number of factors including the presence and concentration of salts
• turbidity, which is a measure of the effect of suspended sediment on water clarity and a potential indicator of sedimentation and erosion.
The period of record ranges from the late 1960s through to the current day for EC; early to mid 1970s and 1981 through to the current day for temperature; and 1977 and 1981 through to the current day for turbidity.
The NSW discrete water quality data archive (ie Triton database managed by NSW Office of Water [NOW]) was evaluated using a long-term trend analysis (30-35 years), providing a preliminary understanding of the behaviour of EC, water temperature and turbidity trends within the study area. This understanding is vital for providing the context for future data collection, analysis and reporting.
To quantify the level of confidence in the trend results, a debit point system was used to assess operational issues, excessive data gaps, data collection and archival issues (NOW in prep.). This provided the basis for applying a low, medium or high data confidence ranking.
There were many water quality monitoring sites in the Border Rivers and Gwydir River catchments relative to other regions. The percentage of samples that exceeded total phosphorus guidelines ranged from moderate to very high across the whole region (Figure 2). Turbidity results varied greatly across the region, from sites with no exceedances through to sites with many exceedances. Turbidity results were generally (but not always) lower at sites in the upper catchments and downstream of major storages.
Data confidence Commentary
TP – high For TP, sites generally have 28 samples collected during the sample period. Confidence in the degree of representativeness of these data for the period of record is high.
Turbidity – high For turbidity, sites generally have over 28 samples collected during the sample period. Confidence in the degree of representativeness of these data for the period of record is high.
Water quality trend
Over half the results showed stable trends in water quality (Figure 3). A few sites had a decreasing trend in surface water temperature, located in the mid and upper catchment. A handful of sites also showed a decreasing trend in EC over the last decade. Turbidity results were the least reliable; however, several sites across the region had rising trends.

5
Riverine ecosystems – Border Rivers–Gwydir region
Mon
tane
Zone
Upl
and
Zone
Slop
esZo
ne
Low
land
Zone M
oree
Inve
rell
Gle
n In
nes
Bogg
abill
a
Tent
erfie
ld
Lake
Cope
tonPi
ndar
iDa
m
NA
MO
IBORD
ERRI
VERS
GW
YDIR
Barw
on
Macintyre
Seve
rn
Gw
ydir
Rive
r
Dum
ares
q
Cree
k
Gil G
il
Meh
iWei
r Ri
ver
Rive
r
Rive
r
Moo
min
Rive
r
Boom
i
Cree
k
Rive
r
Rive
r
Wal
gett
Gra
fton
Kem
psey
Arm
idal
e
Tam
wor
th
Gun
neda
h
Nar
rabr
iCo
ffs
Har
bour
Prep
ared
by
the
Spat
ial S
ervi
ces
and
Info
rmat
ion
Uni
t, D
ecem
ber
2008
, D
WE
Ora
nge
Bord
er R
iver
s -
Gw
ydir
New
Sou
th W
ales
Bord
er R
iver
s -
Gw
ydir
New
Sou
th W
ales
050
100
km
SRA
Valle
y
Bord
er R
iver
s -
Gw
ydir
Lowland
Slopes
Upland
Montane
WAT
ER Q
UAL
ITY
WAT
ER Q
UAL
ITY
CON
DIT
ION
CON
DIT
ION
Tent
erfi
eld
Cre
ekat
Clif
ton
943
Mol
e Ri
ver
at D
onal
dson
9417
Reed
y C
reek
at D
umar
esq
8410
0
Dum
ares
q Ri
ver
at R
osen
eath
991
Bear
dy R
iver
at H
ayst
ack
2686
Dum
ares
q Ri
ver
Bons
haw
Wei
r26
91
Dum
ares
q Ri
ver
at M
auro
2691
Mac
inty
re R
iver
at H
oldf
ast
3197
Mac
inty
re R
iver
at S
alis
bury
Bri
dge
2162
Mac
inty
re R
iver
at T
erre
wah
3268
Mac
inty
re R
iver
at K
onow
na54
61
Caro
le C
reek
near
Gar
ah62
76
Barw
on R
iver
at M
ungi
ndi
5355
Gil
Gil
Cre
ekat
Gal
low
ay96
100
Gw
ydir
Riv
er a
tAl
lam
bie
Brid
ge52
76
Meh
i Ri
ver
at B
ront
e88
100
Moo
min
Cre
ekat
Iff
ley
100
100
Thal
aba
Cree
k at
Mer
ryw
ineb
one
8791
Moo
min
Cre
ekat
Gle
ndel
lo83
89
Gw
ydir
Riv
er a
tBr
agee
n C
ross
ing
6262
Gw
ydir
Riv
er a
tYa
rram
an B
ridg
e10
52
Meh
i Ri
ver
at M
oree
2179
Tyca
nnah
Cre
ek a
tH
orse
shoe
Lag
oon
1310
0
Gw
ydir
Riv
er a
tG
rave
send
Roa
d Br
idge
4696
Hor
ton
Rive
r at
Ride
r (K
illa
ra)
3689
War
iald
a Cr
eek
at W
aria
lda
3610
0
Mya
ll Cr
eek
at M
olro
y14
69
Gw
ydir
Riv
erat
Pin
egro
ve0
100
Gw
ydir
Riv
erU
/S C
opet
on D
am14
89
Gw
ydir
Riv
erat
Bun
darr
a14
94
Roum
alla
Cre
ekat
Kin
gsto
wn
2172
Mac
inty
re R
iver
at I
nver
ell
5010
0
Seve
rn R
iver
at
Stra
thbo
gie
1197
Seve
rn R
iver
at P
inda
ri4
96
Seve
rn R
iver
D/S
Pind
ari
at R
oad
Brid
ge3
100
Fraz
ers
Cre
ekat
Ash
ford
2486
Mac
inty
re R
iver
at W
alla
ngra
4410
0
Gw
ydir
Riv
erat
Yar
row
yck
872
Laur
a Cr
eek
U/S
Bun
darr
a14
97
Gw
ydir
Riv
erD/
S C
opet
on D
am0
100
Bord
er R
iver
s -
Gw
ydir
Reg
ion
Tur
bidi
ty
Gui
delin
e Va
lues
Low
land
sit
es *
50
NT
UU
plan
d si
tes
* 25
NTU
LEG
END
Num
bers
in t
he b
oxes
are
the
per
cent
age
of r
esul
ts t
hat
exce
ed A
NZE
CC
guid
elin
es
Tot
al P
hosp
horu
s
Gui
delin
e Va
lues
Low
land
sit
es *
0.0
5mg/
LU
plan
d si
tes
* 0.
02 m
g/L
* re
fer
to t
ext
in r
epor
t
Figure 2 Water quality condition across the Border Rivers–Gwydir region

State of the catchments 2010
6
Figure 3 Water quality trend across the Border Rivers–Gwydir region

7
Riverine ecosystems – Border Rivers–Gwydir region
Data confidence Commentary
EC – low Data confidence for EC was diminished mostly due to data collection issues across the catchment and excessive data gaps at several sites.
Temp – medium Data confidence for temperature was diminished mostly due to data collection and archival issues across the catchments, and also significant data gaps at several sites.
Turbidity – low Data confidence for turbidity was diminished mostly due to data collection and archival issues across the catchments, and also significant data gaps at close to half the sites.
Aquatic biota
The condition of aquatic biota was assessed using the following measures of riverine ecosystem health:
• macroinvertebrate assemblages, which consist of larval and adult insects, molluscs, worms and crustaceans and are an important component of river ecosystems
• fish assemblages, which consist of native and introduced species.
Macroinvertebrate assemblages
The Macroinvertebrate Condition Index (Figure 4) integrates indicators of ‘expectedness’ (the proportion of expected families found) and the SIGNAL observed/expected (O/E) score (a score based on the sensitivities of families to pollution or other disturbances). For more details on the method see Davies et al (2008).
Fish assemblages
The Fish Condition Index (Figure 5) integrates indicators of ‘expectedness’ (the actual presence of native species relative to the species expected under the reference condition) and ‘nativeness’ (proportion of the fish population that is native rather than alien).
The site selection, sampling and analytical procedure used were largely as described in the SRA report (Davies et al 2008).
Although the same analytical procedure was used, there are some slight variations between the results presented here and the results presented in Davies et al (2008). There are several possible reasons for this:
• the use of the most recent data (some of which has not yet been reported by the SRA program)
• the exclusion of data collected from neighbouring states for cross-border valleys, unless fewer than four data points occurred in the NSW section of each zone
• in many cases, more data was available for this reporting than was used for SRA analysis, and the extra samples resulted in slightly different median metrics from those reported by the SRA (Davies et al 2008)
• a state-wide stream network (5 ML day Stein stream network version 2.92: Fenner School of Environment and Society, Australian National University, unpublished) was used to weight zone data when calculating valley and regional statistics. This varies slightly from the stream network used for the SRA.

State of the catchments 2010
8
MontaneZone
UplandZone
SlopesZone
LowlandZone
BORDERRIVERS
GWYDIRCreek
Boomi
Moomin
Weir River
Mehi
Gwydir
Barw
on
River
Gil GilCreek
River
RiverDumaresq
River
Macintyre
RiverSevern
RiverMoree
Inverell Glen Innes
Boggabilla
Tenterfield
LakeCopeton
PindariDam
Walgett
Grafton
Kempsey
Armidale
Tamworth
Gunnedah
Narrabri Coffs Harbour
Prepared by the Spatial Services and Information Unit, December 2008, DWE Orange
Border Rivers - Gwydir New South WalesBorder Rivers - Gwydir New South Wales
0 50 100 km
Overall Macroinvertebrate Conditionin Border Rivers - Gwydir Region
SRAValleyCondition
GOO D
MODER ATE
PO OR
VERY POOR
EXTREMELYPOOR
MACROINVERTEBRATEMACROINVERTEBRATECONDITIONCONDITION
Border Rivers - Gwydir Region
Figure 4 Macroinvertebrate condition across the Border Rivers–Gwydir region
Data confidence Commentary
Not assessed Condition data derived from the Sustainable Rivers Audit (see www.mdbc.gov.au/SRA/river_health_check_-_sra_report_one).
Fish conditionThe overall fish condition was poor (Figure 5), with both nativeness (the proportion of the fish assemblage that is native versus introduced fish) and expectedness (the proportion of species collected during sampling that were expected to have occurred in each basin zone before European colonisation) being poor. Of the individual catchment zones, both slopes zones and Border Rivers uplands were in moderate condition, the highlands and lowland zones in both catchments were in poor condition and the Gwydir uplands zone was in very poor condition. Nativeness was moderate in the Border Rivers slopes and uplands, poor in the Gwydir slopes and lowlands in both catchments, very poor in the Border Rivers highlands and extremely poor in the Gwydir uplands and highlands. Expectedness was moderate in both slopes zones, the Border Rivers uplands and the Gwydir highlands, poor in both lowlands zones and the Border Rivers highlands and very poor in the Gwydir River uplands.

9
Riverine ecosystems – Border Rivers–Gwydir region
Figure 5 Fish condition across the Border Rivers–Gwydir region
Data confidence Commentary
Low to medium All data was collected within the three-year period between 1 January 2006 and 31 December 2008.
Data confidence within individual altitude zones varies from medium in the lowlands and slopes zones, where variability across individual sites was moderate, to low in the uplands and highlands zones where the fish index varied substantially across individual sites. Data confidence in the regional scale fish condition index is low due to substantial inter-site variability across the region.
Hydrology
Hydrologic condition (Figure 6) measures the ecologically significant aspects of the flow regime including volume, variability, extreme flow events and seasonality. Changes to flow regimes have significant potential to influence riverine ecosystems.
‘The Border Rivers Valley was in moderate to good hydrological condition (Lowland Zone: moderate to good; Slopes, Upland and Montane Zones: good). Overall, the flow regime of the Border Rivers Valley was characterised by reductions in the magnitude of high-flow events and annual volumes, as well as small shifts in seasonality. There was little change, however, in low- and zero-flow events and variability. This reflects the diversion of significant volumes of water from the system and the effect of differentially harvesting high flows’ (MDBC 2008).
MontaneZone
UplandZone
SlopesZone
LowlandZone
BORDERRIVERS
GWYDIR
Boomi
RiverWeir River
Barw
on
Creek
Moomin
Mehi
Gwydir
River
Gil Gil
RiverRiver
Macintyre
River
Dumaresq
River
SevernMoree
Inverell Glen Innes
Boggabilla
Tenterfield
LakeCopeton
PindariDam
River
Walgett
Grafton
Kempsey
Armidale
Tamworth
Gunnedah
Narrabri Coffs Harbour
Prepared by the Spatial Services and Information Unit, December 2008, DWE Orange
Border Rivers - Gwydir New South WalesBorder Rivers - Gwydir New South Wales
0 50 100 km
FISHFISHCONDITIONCONDITION
Overall Fish Condition in Border Rivers - Gwydir Region
SRAValleyCondition
GOO D
MODER ATE
PO OR
VERY POOR
EXTREMELYPOOR
Border Rivers - Gwydir Region

State of the catchments 2010
10
‘The Gwydir Valley was in moderate to good hydrological condition (Lowland Zone: moderate; Slopes Zone: poor; Upland: moderate to poor). The single Montane Zone site was in very poor condition. In general, the flow regime is characterised by substantial reductions in annual volumes and high flow magnitudes with changes in seasonality in most tributaries and the Gwydir below Copeton Dam’ (MDBC 2008).
Hydrology condition
Data confidence Commentary
Altitude zone condition – medium
Condition data derived from the Sustainable Rivers Audit (see www.mdbc.gov.au/SRA/river_health_check_-_sra_report_one).
Overall region condition – medium
Condition data interpreted from the Sustainable Rivers Audit combining the conditions of the Gwydir and Border Rivers SRA Valleys.
Figure 6 Hydrologic condition across the Border Rivers–Gwydir region
MontaneZone
UplandZone
SlopesZone
LowlandZone
BORDERRIVERS
GWYDIR
Moree
Inverell Glen Innes
Boggabilla
Tenterfield
LakeCopeton
PindariDam
Riv
er
Mehi
Gwydir
Weir River
Dumaresq
Macintyre
Boom
i
Watercourse
River
Severn
Barw
on
River
River
River
River
Gingham
River
Walgett
Grafton
Kempsey
Armidale
Tamworth
Gunnedah
Narrabri Coffs Harbour
Prepared by the Spatial Services Unit, November 2008, DWE Orange.
Border Rivers - Gwydir New South WalesBorder Rivers - Gwydir New South Wales
0 50 100 km
Overall Hydrology Conditionin Border Rivers - Gwydir Region
SRAValleyCondition
GOO D
MODER ATE
PO OR
VERY POOR
EXTREMELYPOOR
HYDROLOGYHYDROLOGYCONDITIONCONDITION
Border Rivers - Gwydir Region

11
Riverine ecosystems – Border Rivers–Gwydir region
Pressures
Introduction of pest species
Alien fish species
Alien fish apply pressure to native fish species, populations and communities as they compete for available resources (habitat and food). Some alien fish also prey on native fish.
Alien fish species assessment is derived using the nativeness indicator output from SRA models (see Davies et al 2008). Nativeness comprises three metrics:
• proportion of total biomass of native species
• proportion of individuals that are native
• proportion of species that are native.
Rankings range from 0 to 100; the lower the number, the greater the pressure from alien fish. The nativeness ranking is the average score of sites within each zone.
Valley name Altitude zone Nativeness ranking
Border Rivers Lowlands 41
Slopes 61
Uplands 66
Highlands 31
Gwydir Lowlands 48
Slopes 54
Uplands 12
Highlands 8
Water management
Alteration of natural temperature patterns
The temperature of water within aquatic environments, such as rivers, affects natural ecological processes. Water storages (dams) have the potential to release water that can be unseasonably cold during the warmer months. The change in water temperature in the river system downstream of a dam is referred to as cold water pollution (CWP) (Preece 2004). The table below shows storages that are likely to be associated with CWP, their priority and to what extent downstream effects (>5ºC peak depression) will be detected (where available) (Preece 2004). It should be noted that the

State of the catchments 2010
12
known extent downstream is still uncertain and further monitoring will improve those temperature profiles.
Dam Priority Extent downstream Impacted river
Pindari High Not available Severn
Copeton High 300 km Gwydir
Pindari Dam on the Severn River provides regulated water supply for irrigators. This storage experiences strong thermal stratification, cooling water downstream upon release (Preece 2004).
Copeton Dam on the Gwydir River provides the Gwydir Valley with water for irrigation from deep water storage that has strong thermal stratification. Water discharge from the dam causes CWP in downstream river reaches (Preece 2004). This dam has been identified as a priority for action.
The NSW Government is working with dam owners, community groups and environmental scientists to identify the areas most seriously affected, and to find methods to mitigate or prevent cold water pollution. The NSW Office of Water (NOW), in partnership with other key agencies, is implementing a strategy to control cold water pollution from dams identified for priority action in NSW.
Artificial barriers to fish passage
Many fish species migrate up and down rivers to breed or find alternate habitat during extreme events such as drought. Construction of weirs, dams and road crossings can limit or prevent migration, resulting in loss or depletion of certain fish species upstream of such barriers.
In 2006, Industry & Investment NSW (I&I) undertook a detailed review of weir barriers to fish passage for each CMA. Primary objectives included identification of high priority barriers that have major impact on fish passage and aquatic habitat condition, priority ranking for remediation, and recommendations for appropriate remediation action. Below is a summary of the findings, which were updated by I&I in December 2008. It lists the priority ranking, and the increase in habitat area available to migratory fish, should the barrier be remediated.
Rank Barrier name Watercourse Potential increase in habitat area (km)
1 Cunningham Weir Dumaresq River 59
2 Moree Weir Mehi River 30
3a Boomi Weir Macintyre River 120
3b Boggabilla Weir Macintyre River 200
5 Tareelaroi Regulator Mehi River 250

13
Riverine ecosystems – Border Rivers–Gwydir region
6 Bonshaw Weir Dumaresq River 67
7 Boolooroo Weir Gwydir River 30
8 Glenarbon Weir Dumaresq River 11
Other pressures with the potential to impact on riverine ecosystem condition are listed below.
Agricultural and urban development
• Polluted runoff from agricultural, industrial and domestic sources
• Livestock grazing.
Loss of native vegetation
• Clearing of riparian vegetation
• Clearing of catchment vegetation
• De-snagging of instream channels
• Decline in natural replenishment of instream wood.
Introduction of pest species
• Aquatic and riparian weeds.
Water management
• Alteration of natural flow patterns.
Climate change
• Ability for biota to adjust to environmental changes
• Possible alterations to life cycle cues
• Unknown environmental tolerances of biota.
Management activity
State level
The State Plan natural resource management (NRM) targets are being addressed through state, regional and local partnerships. The catchment action plans (CAPs) and the investment programs that support them are the key documents that coordinate and drive the effort to improve natural resources across NSW. The CAPs describe the whole-of-Government approach to address each of the state-wide targets at the regional level. The Border Rivers–Gwydir CAP can be found at www.brg.cma.nsw.gov.au/index.php?page=catchment-action-plan.
The riverine condition attributes have been grouped against management activities that are being applied to address associated pressures. Associating the management activities in this way identifies the actions being undertaken to address the specific pressures impacting on riverine condition.
At times, it is difficult to isolate the influence of individual and multiple pressures on some riverine

State of the catchments 2010
14
condition attributes. Improvement of many condition attributes can also be derived from a single management activity. For example, riparian vegetation rehabilitation can influence the condition of water quality and the habitat for macroinvertebrates and fish. Managing altered river flow through water sharing plans (WSPs) can also improve water quality and then improve habitat for aquatic biota. Hence, the benefits from some of the listed management activities should not be considered in isolation. Where management activities clearly address a broad range of condition/pressure outcomes, these are listed against ‘multiple condition/pressure actions’.
Hydrology
The riverine ecosystems target is being addressed at the state level largely through improved water sharing between users and the environment through WSPs and water purchase for the environment.
WSPs have been the key mechanisms in NSW for balancing competing interests in water management. The WSPs:
• share water between users, and between users and the environment
• increase allocations for the environment and other public purposes
• provide longer term, more secure, and tradeable property rights to facilitate investment and increase business returns from the water used.
WSPs have resulted in notable improvements in the management of NSW water resources by limiting use in the regulated rivers to 200 GL below the Murray Darling Basin cap, and by providing flow patterns that are more like natural flow regimes. The recovery of additional environmental water through programs such as RiverBank and The Living Murray Initiative has also helped to sustain or improve NSW wetlands.
However, many riverine ecosystems are still under stress from altered flow regimes, and from land-use practices that adversely affect water quality and aquatic habitat. The key initiatives being undertaken to meet this challenge are:
• the completion of the remaining WSPs in the Murray Darling Basin by 2011 and elsewhere before 2013
• progressing the recovery of water for the environment in the short term through RiverBank and The Living Murray, and in the longer term in cooperation with the Australian Government through the Water for the Future initiative
• adjusting future WSPs to account for climate change impacts and the Murray Darling Basin Plan currently being prepared by the Murray Darling Basin Authority.
Water quality
The following actions are being undertaken to address water quality issues:
• progress strategies to maintain valued ecological processes such as the Cold Water Pollution Mitigation Strategy, protecting riparian zones in urban areas and the NSW Wetlands Policy
• maintain water quality that is ‘fit-for-purpose’ through the NSW Diffuse Source Water Pollution Strategy, stormwater management and regulation of point source pollution
• effectively implement the monitoring, evaluation and reporting strategy
• provide a framework for councils to develop stormwater management objectives
• provide decision support tools and information to land managers

15
Riverine ecosystems – Border Rivers–Gwydir region
• develop regional water quality guidelines
• undertake ongoing water quality monitoring at strategic locations to assess the long-term trends and changes in condition.
Some of the specific NSW Government actions to address the targets in the Border Rivers–Gwydir region include the WSPs discussed earlier, as well as RiverBank, the Rivers Environmental Restoration Program and the Wetland Recovery Programs, which have purchased 10,461 ML of entitlements in the Gwydir valley to be used to enhance wetland and river health (see www.environment.nsw.gov.au/environmentalwater/index.htm).
Multiple condition/pressure actions
The Department of Planning (DOP) advocates that the planning system, in conjunction with relevant agencies and local government, has an important role in NRM and protection of environmental values.
The planning process creates a strategic framework to identify, assess and prioritise land-uses and to assist with strategic investment in the revitalisation/management of natural resource values. The framework and investment reflect two streams in the integration of NRM and environmental protection – a ‘strategic planning stream’ and an ‘investment stream’. These connections occur at a regional and local level and are important in the delivery of regional strategies (prepared by DOP) and local growth management strategies, local environmental plans (LEPs) and state of the environment reports (prepared by local councils).
The DOP state level measures that may enhance riverine condition include state environmental planning policies (SEPPs) (eg Rural Lands SEPP).
DOP also provides a regional context for planning through the development of regional growth strategies to guide sustainable growth and protect valuable natural and cultural assets. The development of regional strategies is undertaken with the involvement of the CMAs.
Regional level
At the regional level the Border Rivers–Gwydir CMA is undertaking the following activities in relation to the riverine ecosystems theme:
Water quality
• A change in land management actions on over 6000 hectares (ha) of land to improve water quality
• Over the 12 months subsequent to this reporting date, the CMA will target subcatchments near Inverell, and at Myall Creek and Halls Creek. The CMA will work with landholders to improve water quality through establishing riparian vegetation, mitigating erosion and improving aquatic biodiversity
• Instream salinity has been reduced through improved management of more than 500 ha of land near riparian systems
• Salt loads have been further reduced by projects that have upgraded the waste handling equipment at the Bindaree Beef processing plant at Inverell
• Rehabilitation of the Mole River Arsenic Mine
• Provision of incentives to community members at Gravesend and Bundarra to upgrade leaking septic systems
State of the catchments 2010
16
• Installation of a reverse osmosis plant to remove salt from artesian spa water at the Moree baths.
Multiple condition/pressure actions
• Erosion on more than 200 ha of riparian land has been remediated
• More than 3000 ha of riparian vegetation have been established through regeneration and replanting
• More than 700 off-stream watering points have been established to reduce erosion of river banks
• The 2007 NSW River Health Conference has been sponsored
• A cross border demonstration reach project has been established with the Queensland Murray–Darling Committee.
A number of other groups are undertaking significant work to address pressures in the region that are contributing to better outcomes for riverine ecosystems including:
• all Landcare groups have been proactive in promoting improved management of riparian areas. The Upper Gwydir Landcare group has completed riparian zone restoration projects along the Gwydir River at Bingara
• the Gwydir Valley Irrigators Association has run workshops on improving water use efficiency for, and actively promoted management of, water that provides improvements in production and environmental outcomes
• the Australian Cotton Research Centre has promoted water use efficiency through siphon-less irrigation systems, and educated growers on deep drainage and salinity management.
Local level
DOP provides for local planning measures and activities to address a number of pressures including:
• working with DECCW, NOW and I&I in developing standard NRM clauses for councils to incorporate into their new LEPs as part of the NSW Government’s planning reform initiative
• preparing a practice note to provide guidance to councils on the environmental protection zones in the standard LEP instrument and how they should be applied in the preparation of LEPs. DOP is working on similar guidance for waterways and riparian corridors
• working with local councils as they develop their local strategic plans.

17
Riverine ecosystems – Border Rivers–Gwydir region
Further reading
ANZECC & ARMCANZ 2000, Australian and New Zealand guidelines for fresh and marine water quality. National Water Quality Management Strategy Paper No 4, Australian and New Zealand Environment and Conservation Council & Agriculture and Resource Management Council of Australia and New Zealand, Canberra, [www.mincos.gov.au/publications/australian_and_new_zealand_guidelines_for_fresh_and_marine_water_quality].
Davies PE, Harris JH, Hillman TJ & Walker KF 2008, SRA Report 1: A Report on the Ecological Health of Rivers in the Murray–Darling Basin, 2004–2007, Prepared by the Independent Sustainable Rivers Audit Group for the Murray–Darling Basin Ministerial Council.
MDBC 2008, Murray–Darling Basin Rivers: Ecosystem Health Check, 2004–2007. A summary report based on the Independent Sustainable Rivers Audit Group’s SRA Report 1: A Report on the Ecological Health of Rivers in the Murray–Darling Basin, 2004–2007, submitted to the Murray–Darling Basin Ministerial Council in May 2008.
Murray-Darling Basin Commission 2008, [www.mdbc.gov.au].
NOW in prep, ‘Evaluation of water quality data and historical trends in New South Wales, Australia: Technical report for the Riverine Ecosystem Theme, as part of the New South Wales Monitoring, Evaluation and Reporting Strategy’, NSW Office of Water, Sydney.
NSW Department of Primary Industries 2006, Reducing the Impact of Weirs on Aquatic Habitat – New South Wales Detailed Weir Review. Lower Murray Darling CMA region, Report to the New South Wales Environmental Trust. NSW Department of Primary Industries, Flemington, NSW.
NSW Office of Water, Triton Water Quality Database, Parramatta, Sydney, NSW.
Preece R 2004, Cold water pollution below dams in New South Wales – A desktop assessment, Water Management Division, Department of Infrastructure, Planning and Natural Resources, Sydney.

State of the catchments 2010
18
Published by: Department of Environment, Climate Change and Water NSW, 59–61 Goulburn Street. PO Box A290, Sydney South 1232.
Ph: (02) 9995 5000 (switchboard). Ph: 131 555 (environment information and publications requests).
Ph: 1300 361 967 (national parks, climate change and energy efficiency information and publications requests).
Fax: (02) 9995 5999. TTY: (02) 9211 4723.
Email: [email protected] Website: www.environment.nsw.gov.au
DECCW 2010/352 ISBN 978 1 74232 665 8 November 2010
Cover photo: DECCW – ‘kingfisher’


