
STATE PLAN PEER REVIEW CRITERIA Peer Review Notes Template€¦ · · 2017-12-15PEER REVIEW...
46
STATE PLAN PEER REVIEW CRITERIA Peer Review Notes Template STATE: Puerto Rico U.S. Department of Education
Transcript of STATE PLAN PEER REVIEW CRITERIA Peer Review Notes Template€¦ · · 2017-12-15PEER REVIEW...

STATE PLAN
PEER REVIEW CRITERIA
Peer Review Notes Template
STATE: Puerto Rico
U.S. Department of Education

2
Background
Peer reviewers apply their professional judgment and experiences when responding to the questions in
response to the criteria below. Consistent with section 1111(a)(4)(C) of the Elementary and Secondary
Education Act of 1965 (ESEA), as amended by the Every Student Succeeds Act (ESSA), peer reviewers
will conduct an objective review of State plans in their totality and out of respect for State and local
judgments, with the goal of supporting State- and local-led innovation and providing objective feedback
on the technical, educational, and overall quality of a State plan, including the validity and reliability of
each element of the State plan. Peer reviewer notes inform the written determination of the Secretary
regarding the consolidated State plan.
Role of the Peer Reviewers
Each peer reviewer will independently review a consolidated State plan with respect to the criteria for
Title I, Part A and Title III, Part A and record his or her responses to the questions. Each peer
reviewer will note where changes may be necessary for a State educational agency (SEA) to fully
address statutory and regulatory requirements and may also present suggestions to improve the State
plan or to highlight best practices. Each peer reviewer will create his or her individual
recommendations to guide the in-person review. These individual recommendations are submitted to
the Department but will not be shared with the State. A panel of peer reviewers will meet in person to discuss each SEA’s plan. The panel of peer
reviewers will generate one set of peer review notes that reflects its collective review and evaluation
of the SEA’s consolidated State plan, but the panel is not required to reach consensus. The notes
should reflect all peer reviewer perspectives on each requirement.
After the peer review is completed, each SEA will receive the final peer review notes that include the peer
reviewers’ responses to the questions and any recommendations to improve the SEA’s consolidated State
plan. The peer review notes: 1) constitute the official record of the peer review panel’s responses to
questions regarding how an SEA’s State plan addresses the statutory and regulatory requirements; 2)
provide technical assistance to the SEA on how to improve its State plan; and 3) recommend to the
Secretary what, if any, additional information to request from the SEA. Taking into consideration the
peer reviewers’ recommendations, the Department will provide feedback to each SEA that outlines any
areas the SEA must address prior to the Secretary’s approval of its consolidated State plan. If a State plan
cannot be approved, the Department will offer the SEA an opportunity to revise and resubmit its State
plan and have a hearing, consistent with ESEA section 8451.
Consistent with ESEA section 1111(a) (5), the Department will make publicly available all peer review
guidance, training, and final panel notes. The names of peer reviewers will be made publicly available at
the completion of the review of all consolidated State plans. The peer reviewers for any individual State
will not be made publicly available.
How to Use This Document
The peer review criteria are intended to: 1) support States as they develop their consolidated State plans,
and 2) inform peer reviewer panels as they evaluate each consolidated State plan. This document outlines
the required elements that an SEA must address in its State plan in order to fully meet the applicable
statutory and regulatory requirements. If an SEA has provided insufficient information for peer reviewers
to determine whether any requirement is fully addressed, peer reviewers should indicate that the SEA has
not fully addressed that requirement and identify what additional information or clarification may be
needed. Note that responses to some elements are required only if the specific circumstances addressed in
the question are applicable to the SEA submitting the consolidated State plan (e.g., if the SEA establishes
an extended-year adjusted cohort graduation rate in addition to a four-year adjusted cohort graduation rate

3
in item A.4.iii.b.2 below). For these particular questions, if the circumstances addressed in the question
do not apply to the SEA, the SEA is not required to answer the question in order to fully address the
statutory and regulatory requirements.
Instructions
Each peer reviewer should include individual review notes in the space provided below each consolidated
State plan requirement. For each consolidated State plan requirement, a peer reviewer will provide:
Peer Analysis: Describe the peer reviewer’s justification for why an SEA did or did not meet the
requirement;
Strengths: Summarize the strengths of an SEA’s response to the State plan requirement;
Weaknesses: Summarize the weaknesses of an SEA’s response to the State plan requirement,
including issues, lack of clarity, and possible suggestions for technical assistance; and
Assessment: Determine if the SEA met the State plan requirement (indicated by Yes/No)
o If the peer reviewer indicates ‘No’ above, the peer reviewer must describe the specific
information or clarification that a State must provide in order to meet the requirement.
The peer reviewer notes should address all of the required elements of each State plan requirement in this
document, but need not address each element individually (i.e., the peer reviewer notes should holistically
review A.3.i about the SEA’s definition for native languages, incorporating each of the four bulleted
items in this element but need not individually respond to each bullet).

4
SECTION A: TITLE I, PART A: IMPROVING BASIC PROGRAMS
OPERATED BY LEAS
A.1: Challenging State Academic Standards and Assessments
Note: State Plan template item A.1 is submitted as part of the separate assessment peer review process
consistent with ESEA section 1111(b) and 34 CFR § 200.2(d), and thus has no applicable peer review
criteria in this document.
A.2: Eighth Grade Math Exception (ESEA section 1111(b) (2) (C) and 34 CFR § 200.5(b)
(4))
Note: State Plan template items A.2.i and A.2.ii require binary yes/no responses from SEAs, and thus
have no applicable peer review criteria.
A.2.iii: Strategies (ESEA section 1111(b) (2) (C); 34 CFR § 200.5(b) (4))
If applicable,1 does the SEA describe, regarding the 8
th grade math exception, its strategies to provide
all students in the State the opportunity to be prepared for and take advanced mathematics coursework
in middle school (e.g., appropriate data and evidence that the strategies are likely to provide all
students in the State that opportunity)?
Peer Response Peer Analysis N/A – PRDE does not administer an end of course mathematics assessment
and as a result is not requesting an exemption (as indicated on p. 24 of State
plan).
Strengths
Weaknesses
Did the SEA meet
all requirements? ☐ Yes (# peer reviewer(s))
☐ No (# peer reviewer(s))
☒ N/A
If no, describe the
specific information
or clarification that
an SEA must
1 In order for an SEA to exempt an 8th grade student from the mathematics assessment typically administered in 8th grade under
ESEA section 1111(b)(2)(B)(v)(I)(aa), it must ensure that: a. the student instead takes the end-of-course mathematics assessment
the State administers to high school students under ESEA section 1111(b)(2)(B)(v)(I)(bb); b. the student’s performance on the
high school assessment is used in the year in which the student takes the assessment for purposes of measuring academic
achievement under ESEA section 1111(c)(4)(B)(i) and participation in assessments under ESEA section 1111(c)(4)(E); and c. in
high school: (1) the student takes a State-administered end-of-course assessment or nationally recognized high school academic
assessment as defined in 34 CFR § 200.3(d) in mathematics that is more advanced than the assessment the State administers for
8th graders under ESEA section 1111(b)(2)(B)(v)(I)(bb); (2) the State provides for appropriate accommodations consistent with
34 CFR § 200.6(b) and (f); and (3) the student’s performance on the more advanced mathematics assessment is used for purposes
of measuring academic achievement under ESEA section 1111(c)(4)(B)(i) and participation in assessments under ESEA section
1111(c)(4)(E).

5
provide to fully meet
this requirement
A.3: Native Language Assessments (ESEA section 1111(b) (2) (F) and 34 CFR § 200.6(f) (2)
(ii) and (f) (4))
A.3.i: Definition
Does the SEA provide its definition of “languages other than English that are present to a significant
extent in the participating student population”?
Does the SEA identify the specific languages that meet that definition?
Does the SEA’s definition include at least the most populous language other than English spoken by
the State’s participating student population?
In determining which languages are present to a significant extent in the participating student
population, does the SEA describe how it considered languages other than English that are spoken by
distinct populations of English learners, including English learners who are migratory, English
learners who were not born in the United States, and English learners who are Native Americans?
In determining which languages are present to a significant extent in the participating student
population, does the SEA describe how it considered languages other than English that are spoken by
a significant portion of the participating student population in one or more of the State’s LEAs, as
well as languages spoken by a significant portion of the participating student population across grade
levels?
Peer Response Peer Analysis PRDE’s definition of “languages other than Spanish that are present to a
significant extent in the participating student population” is a language that is
present in greater than 30% or more percent of the population (p. 26).
According to the state plan response, no languages meet this definition. Data
provided by the State indicate that 1,490 out of 365,181 students are Spanish
learners (0.004% of the population), and that 95% of these are speakers of
English. This most populous language is excluded by the State’s definition. No
mention is made in the state plan of student populations in particular LEAs
(because Puerto Rico is a unitary system). The SEA did not provide evidence
on the distribution languages other than Spanish across particular grade levels.
The peers also commented that 30% seems like a high percentage, both in
absolute terms, and relative to the bar set in other states. (By this definition,
more than 100,000 students would need to speak a language other than
Spanish in order for the language to be considered significant.) Given the
small number of Spanish learners in Puerto Rico, peers realize that reducing
the percentage will likely not affect practice. Nevertheless, the peers
recommend that the percentage be more in line with what other States have
proposed. Furthermore, peers were of the opinion that it would be advisable
for Puerto Rico to justify the rationale for its definition of ‘significant’ and to
monitor its population to ensure that its definition is appropriate over time.
Strengths The SEA’s definition of significant languages is clear and concise, as is the
presentation of the data on language background of Spanish learners in the
state.
Weaknesses The most populous non-Spanish language is not included with the State’s

6
definition. The SEA did not provide evidence on the distribution of languages
other than Spanish across particular grade levels.
Peers noted that the definition of significance also seems quite high.
Did the SEA meet
all requirements? ☐ Yes (# peer reviewer(s))
☒ No (4 peer reviewer(s))
If no, describe the
specific information
or clarification that
an SEA must
provide to fully
meet this
requirement
The most populous non-Spanish language (English) must be included
in the State’s definition.
Peers recommend that the SEA provide evidence on the distribution of
languages other than Spanish across particular grade levels.
Peers recommend that the SEA justify its definition of ‘significance’
and revise it to be more in line with what other states do.
A.3.ii: Existing Assessments in Languages other than English
Does the SEA identify any existing assessments that it makes available in languages other than
English, and specify for which grades and content areas those assessments are available?
Peer Response Peer Analysis The state has no existing assessments in languages other than Spanish (p. 27).
However, the State plan response indicates that assessments are going to be
developed in English for students enrolled in the Bilingual Initiative. It seems
that the bilingual program is only available in grades K-3, so there will be
math, science, and English assessments at grade 3.
Strengths The SEA’s response is concise and recognizes demand for the development of
English assessments for its dual immersion program.
Weaknesses N/A
Did the SEA meet
all requirements? ☒ Yes (4 peer reviewer(s))
☐ No (# peer reviewer(s))
If no, describe the
specific information
or clarification that
an SEA must
provide to fully meet
this requirement
A.3.iii: Assessments not Available and Needed
Does the SEA indicate the languages other than English that are present to a significant extent in the
participating student population, as defined by the SEA and identified under A.3.i of the consolidated
State plan, for which yearly student academic assessments are not available and are needed?
Peer Response Peer Analysis According to the state plan, for a language other than Spanish to be present to
a significant extent in the participating student population, there would need to
be “30% or more of the student population” speaking a particular language (p.

7
26). By this metric, the state plan indicates that there are no languages present
to a significant extent; therefore, there are no assessments that are unavailable
but needed in other languages.
Strengths The response is clear and concise.
Weaknesses The SEA will need to revise its definition to include the most populous
language other than Spanish present to a significant extent in its population
(i.e., English).
Did the SEA meet
all requirements? ☒ Yes (4 peer reviewer(s))
☐ No (# peer reviewer(s))
If no, describe the
specific information
or clarification that
an SEA must
provide to fully meet
this requirement
A.3.iv: Efforts to Develop Assessments
Does the SEA describe how it will make every effort to develop assessments in, at minimum,
languages other than English that are present to a significant extent in the participating student
population, as defined by the SEA and identified under A.3.i of the consolidated State plan template?
Does the SEA’s description of how it will make every effort to develop assessments in, at a
minimum, languages other than English that are present to a significant extent in the participating
student population include the State’s plan and timeline for developing such assessments?
Does the SEA’s description of how it will make every effort to develop assessments in, at a
minimum, languages other than English that are present to a significant extent in the participating
student population include a description of the process the State used to:
o 1) gather meaningful input on the need for assessments in languages other than English;
o 2) collect and respond to public comment; and
o 3) Consult with educators, parents and families of English learners, students, as appropriate
and other stakeholders?
If applicable, does the SEA’s description of how it will make every effort to develop assessments in,
at a minimum, languages other than English that are present to a significant extent in the participating
student population include an explanation of the reasons (e.g., legal barriers) the State has not been
able to complete the development of such assessments despite making every effort?
Peer Response Peer Analysis Since the SEA does not have any languages other than English that it
considers to be present to a significant extent, it does not detail any plans for
developing assessments in other languages. However, the response to section
A.3.ii mentions assessments in English being developed for the bilingual
program, but there is no information provided about that process by which
assessments are developed.
Strengths The SEA is proactively developing assessments for its bilingual program.
Weaknesses The SEA will need to revise its definition to include the most populous
language other than Spanish present to a significant extent in its population
(i.e., English).
8
There is a lack of description of the process that will be followed to develop
tests in languages other than Spanish.
Did the SEA meet
all requirements? ☒ Yes (4 peer reviewer(s))
☐ No (# peer reviewer(s))
If no, describe the
specific information
or clarification that
an SEA must
provide to fully meet
this requirement
A.4: Statewide Accountability Systems & School Support and Improvement (ESEA section
1111(c) and (d))
A.4.i: Subgroups (ESEA section 1111(b) (3), 1111(c) (2))
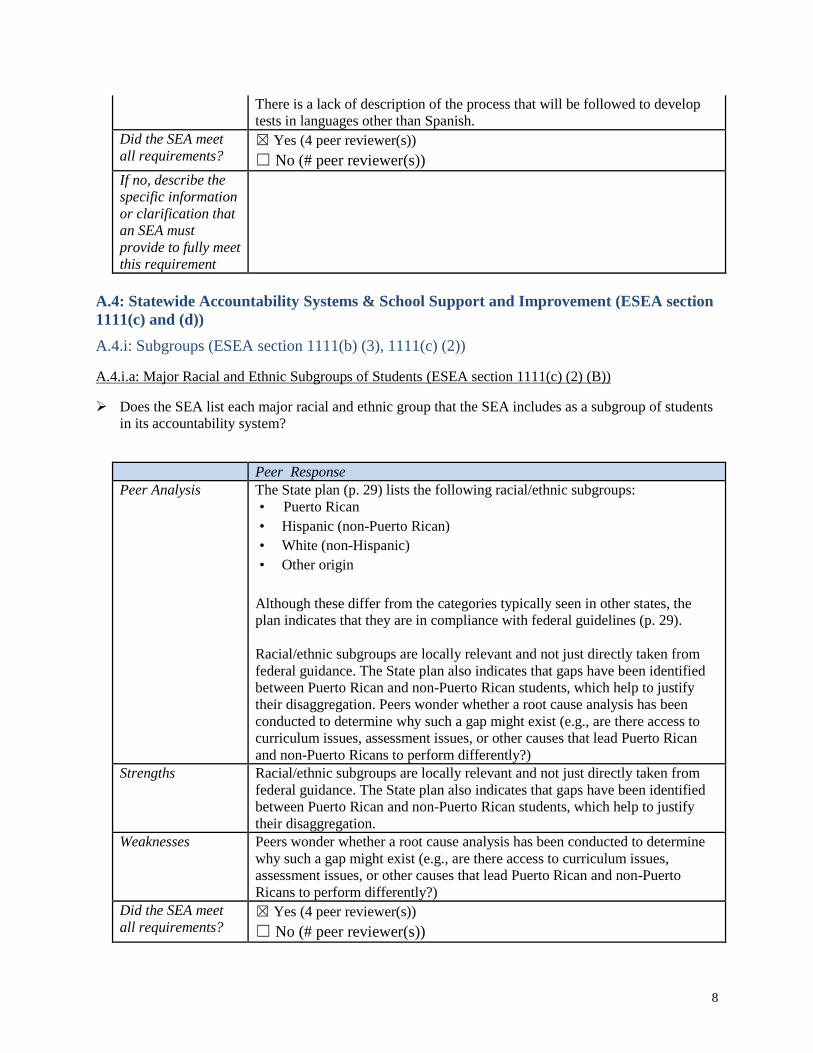
A.4.i.a: Major Racial and Ethnic Subgroups of Students (ESEA section 1111(c) (2) (B))
Does the SEA list each major racial and ethnic group that the SEA includes as a subgroup of students
in its accountability system?
Peer Response Peer Analysis The State plan (p. 29) lists the following racial/ethnic subgroups:
• Puerto Rican
• Hispanic (non-Puerto Rican)
• White (non-Hispanic)
• Other origin
Although these differ from the categories typically seen in other states, the
plan indicates that they are in compliance with federal guidelines (p. 29).
Racial/ethnic subgroups are locally relevant and not just directly taken from
federal guidance. The State plan also indicates that gaps have been identified
between Puerto Rican and non-Puerto Rican students, which help to justify
their disaggregation. Peers wonder whether a root cause analysis has been
conducted to determine why such a gap might exist (e.g., are there access to
curriculum issues, assessment issues, or other causes that lead Puerto Rican
and non-Puerto Ricans to perform differently?)
Strengths Racial/ethnic subgroups are locally relevant and not just directly taken from
federal guidance. The State plan also indicates that gaps have been identified
between Puerto Rican and non-Puerto Rican students, which help to justify
their disaggregation.
Weaknesses Peers wonder whether a root cause analysis has been conducted to determine
why such a gap might exist (e.g., are there access to curriculum issues,
assessment issues, or other causes that lead Puerto Rican and non-Puerto
Ricans to perform differently?)
Did the SEA meet
all requirements? ☒ Yes (4 peer reviewer(s))
☐ No (# peer reviewer(s))

9
If no, describe the
specific information
or clarification that
an SEA must
provide to fully meet
this requirement
A.4.i.b: Additional Subgroups at SEA Discretion
If applicable, does the SEA describe any additional subgroups of students other than the statutorily
required subgroups (i.e., economically disadvantaged students, students from each major racial and
ethnic group, children with disabilities, and English learners) included in its statewide accountability
system?
Peer Response Peer Analysis N/A - PRDE did not include any additional subgroup populations (p. 29).
Strengths
Weaknesses
Did the SEA meet
all requirements? ☐ Yes (# peer reviewer(s))
☐ No (# peer reviewer(s))
☒ N/A
If no, describe the
specific information
or clarification that
an SEA must
provide to fully meet
this requirement
A.4.i.c: Previously Identified English Learners
Note: State Plan template item A.4.i.c requires a binary yes/no response from SEAs, and thus has no
applicable peer review criteria.
A.4.i.d: If Applicable, Exception for Recently Arrived English Learners
Note: This peer review criterion applies only if a State selects the third option in item A.4.i.d in the
consolidated State plan template for recently arrived English learners under which the State applies the
exception under ESEA section 1111(b)(3)(A)(i) or the exception under ESEA section 1111(b)(3)(A)(ii) to
a recently arrived English learner.
Does the SEA describe how it will choose which exception applies to a recently arrived English
learner (e.g., a statewide procedure that considers English language proficiency level in determining
which, if any, exception applies)?
Peer Response Peer Analysis PR selected the first option in item A.4.i.d in the consolidated State plan
template (p. 30), which would normally render this criterion not
applicable. However, PR provided additional description below the
checkbox that makes it sound as though they should have selected the

10
third option. PR should clarify whether their practice is in fact
consistent with option i or iii.
Strengths
Weaknesses
Did the SEA meet
all requirements? ☐ Yes (# peer reviewer(s))
☐ No (# peer reviewer(s))
☒ N/A
If no, describe the
specific information
or clarification that
an SEA must
provide to fully meet
this requirement
A.4.ii: Minimum N-Size (ESEA section 1111(c) (3) (A))
A.4.ii.a: Minimum N-Size for Accountability (ESEA section 1111(c) (3) (A) (i))
Does the SEA provide the minimum number of students that the State determines is necessary to meet
the requirements of any provisions under Title I, Part A of the ESEA that require disaggregation of
information by each subgroup of students for accountability purposes, including annual meaningful
differentiation and identification of schools?
Is the minimum number of students the same State-determined number for all students and for each
subgroup of students in the State (i.e., economically disadvantaged students, students from each major
racial and ethnic group, children with disabilities, and English learners) for accountability purposes?
Peer Response Peer Analysis An N size of 10 is the minimum for reporting and for subgroup disaggregation
(p. 31). It applies to all students and to all subgroups. The state plan also
reports a minimum N size of 5 for accountability classifications based on all
students. Peers understand that the minimum N sizes for accountability must
be the same for all students and for subgroups. PRDE has consulted with
Institute of Statistics and have determined the N sizes are sufficient to meet the
level of reliability needed and that ensure that most students are included and
considered (p. 32)
Strengths The State plan clearly and concisely responds to this element. Through
analysis, PRDE has established the minimum N sizes to ensure that all
students – most particularly typically underserved students – are accounted for
in the accountability system. PRDE took measures to ensure the integrity of
the data – including its reliability and validity. While a small N size includes a
higher risk for variability that is not often in control of the district, PRDE
prioritized ensuring that all students’ needs are met.
Weaknesses There is no specific justification for the establishment of different N sizes for
different purposes. Furthermore, this difference does not appear to comply
with federal guidelines, which require that the minimum N sizes for
accountability must be the same for all students and for subgroups.
Did the SEA meet
all requirements? ☐ Yes (# peer reviewer(s))
☒ No (4 peer reviewer(s))

11
If no, describe the
specific information
or clarification that
an SEA must
provide to fully meet
this requirement
PRDE should modify the minimum accountability N sizes for all students and
all subgroups so that they are the same. Peers recommend that this N be 10
rather than 5, as explained in subsequent sections.
A.4.ii.b: Statistical Soundness of Minimum N-Size (ESEA section 1111(c) (3) (A) (i))
Is the selected minimum number of students statistically sound? 2
Peer Response Peer Analysis The State plan indicates that PRDE consulted with IES and got stakeholder
feedback from the TAC to determine an appropriate minimum N size that
would provide sufficiently detailed information but also protect student
privacy. Table 4 (p. 32) shows what percentage of students in each subgroup
would be included at minimum N sizes of 5, 10, 15, 20, and 30. (Peers noted
that the table actually indicates “N<10, N<5, etc.” and we wondered whether
this is a typo and should be “N≤10, 5, etc.”)
Smaller minimum Ns are likely less sound than larger minimum Ns. Results
will be highly unstable from year to year. Also, the rationale for n=5 is
somewhat suspect given the absolute numbers under consideration, i.e. while
the percentages of some subgroups increase a lot, the absolute numbers remain
small (p.32 table 4). Small Ns (as PR notes) result in highly unstable and
imprecise estimates of group performance. Results will not be more valid
because validity relates to claims based on results, but with results heavily
influenced by changes in yearly student populations, the claim that a school
has improved (or decreased) will be conflated with changes in population.
Strengths The SEA’s willingness to err on the side of inclusion is laudable. However,
there is a trade-off between inclusion and reliability that must be considered.
Weaknesses It would be illustrative if the State provided data on what percent of schools do
not have to report on each subgroup. One way to mitigate the concern of
reliability of the N size would be to continue to monitor subgroups as a whole
and not just within individual schools.
Small minimum Ns (as PR notes) result in highly unstable and imprecise
estimates of group performance. Results will not be more valid because
2 Consistent with ESEA section 1111(i), information collected or disseminated under ESEA section 1111 shall be
collected and disseminated in a manner that protects the privacy of individuals consistent with section 444 of the
General Education Provisions Act (20 U.S.C. 1232g, commonly known as the “Family Educational Rights and
Privacy Act of 1974”). When selecting a minimum n-size for reporting, States should consult the Institute of
Education Sciences report “Best Practices for Determining Subgroup Size in Accountability Systems While
Protecting Personally Identifiable Student Information” to identify appropriate statistical disclosure limitation
strategies for protecting student privacy.

12
validity relates to claims based on results, but with results heavily influenced
by changes in yearly student populations, the claim that a school has improved
(or decreased) will be conflated with changes in population.
Did the SEA meet
all requirements? ☐ Yes (# peer reviewer(s))
☒ No (4 peer reviewer(s))
If no, describe the
specific information
or clarification that
an SEA must
provide to fully
meet this
requirement
Consider increasing the N size to 10 at the school level to provide
stability from year to year at the school level.
Provide data on what percent of schools do not have to report on each
subgroup at different minimum N sizes.
A.4.ii.c: How the SEA Determined Minimum N-Size (ESEA section 1111(c) (3) (A) (ii))
Does the SEA describe how it determined the minimum number of students?
Does the description include how the State collaborated with teachers, principals, other school
leaders, parents, and other stakeholders when determining such minimum number?
Peer Response Peer Analysis The State plan indicates how PRDE decided on its minimum N size, by
considering the number of students that would and would not be included in
reporting at various N sizes (on Table 4 of the state plan). Regarding
stakeholder involvement, the State plan response is not specific, stating only,
“PRDE then consulted with stakeholders and considered the recommendations
of our TAC” (p. 32).
Detailed information is not provided about what stakeholders were consulted,
what information they received, and how they provided feedback on N size.
Strengths The SEA is to be commended for its efforts to include all students.
Weaknesses Detailed information is not provided about what stakeholders were consulted,
what information they received, and how they provided feedback on N size.
Did the SEA meet
all requirements? ☒ Yes (2 peer reviewer(s))
☒ No (2 peer reviewer(s))
If no, describe the
specific information
or clarification that
an SEA must
provide to fully
meet this
requirement
Detailed information needs to be provided about which stakeholders
were consulted, what information they received, and how they provided
feedback on N size. Table 4 (p. 32), which lists inclusion at different N
sizes, should also be clarified because the labels use the < symbol.

13
A.4.ii.d: Minimum N-Size and Ensuring Student Privacy (ESEA section 1111(c) (3) (A) (iii))
Does the SEA describe how it ensures that the minimum number of students will protect the privacy
of individual students?3
Peer Response Peer Analysis The State plan provides a narrative on how the reporting N size of 10 protects
privacy of individual students. However, the plan does not provide suppression
rules.
The plan does not address the privacy requirements for the N size of 5, nor the
potential lack of privacy through the process of school identification. In order
to be consistent with abovementioned recommendations, peers recommend the
adoption of a minimum N size of 10 for all students and for all subgroups.
Strengths The State errs on the side of inclusion.
Weaknesses The State’s response is simply what it does; it does not indicate how its
process ensures privacy. PR does not indicate whether they will suppress
reporting if results are 0 or 100%.
The plan does not address the privacy requirements for the N size of 5, nor the
potential lack of privacy through the process of school identification.
Did the SEA meet
all requirements? ☐ Yes (# peer reviewer(s))
☒ No (4 peer reviewer(s))
If no, describe the
specific information
or clarification that
an SEA must
provide to fully
meet this
requirement
To provide more detailed information about scenarios that could impact
privacy, the plan should provide suppression rules.
In order to be consistent with abovementioned recommendations, peers
recommend the adoption of a minimum N size of 10 for all students and for all
subgroups.
A.4.ii.e: If Applicable, Minimum N-Size for Reporting
If the SEA’s minimum number of students for purposes of reporting is lower than the minimum
number of students for accountability purposes, does the SEA provide the minimum number of
students for purposes of reporting?
Is the SEA’s minimum number of students for purposes of reporting consistent with the requirements
in ESEA section 1111(i), including with respect to privacy and statistical reliability?
3 See footnote 5 above for further guidance.

14
Peer Response Peer Analysis N/A: The SEA’s minimum number of students for purposes of reporting is
equal to or greater than the minimum number of students for accountability
purposes.
Strengths
Weaknesses
Did the SEA meet
all requirements? ☐ Yes (# peer reviewer(s))
☐ No (# peer reviewer(s))
☒ N/A
If no, describe the
specific information
or clarification that
an SEA must
provide to fully meet
this requirement
A.4.iii: Establishment of Long-Term Goals (ESEA section 1111(c) (4) (A))
A.4.iii.a: Academic Achievement (ESEA section 1111(c) (4) (A) (i) (I) (aa))
A.4.iii.a.1: Long-term goals
Does the SEA identify (i.e., by providing a numeric measure) and describe the long-term goals for all
students for improved academic achievement, as measured by grade-level proficiency on the annual
statewide reading/language arts and mathematics assessments (which must apply the same academic
achievement standards to all public school students in the State, except those with the most significant
cognitive disabilities)?
Does the SEA identify and describe long-term goals for each subgroup of students?
Does the SEA’s description include baseline data for all students and for each subgroup of students?
Does the SEA’s description include the timeline for meeting the long-term goals?
Is the timeline the same multi-year length of time for all students and for each subgroup of students?
Are the long-term goals ambitious?
Peer Response Peer Analysis The State plan outlines baseline percentages of students who scored proficient
on the statewide assessment (META-PR) in 2016-17 (for all students and by
subgroup). The plan also lays out five year goals for all students and all
subgroups, as well as interim goals each year (Table 9, p. 42 for Spanish,
Table 10, p. 43 for Math). Historically the State has had about a 1% increase
by subgroup each year, but the goals are for a 12% yearly reduction in the
achievement gap for all students and for each subgroup. Baseline percentages
of students proficient in Spanish reading/language arts range from 31-50% and
the goal is for everyone to be between 72-80%. For math baseline is 26-39%
proficient, with goals ranging from 72-75%.
These are ambitious improvements, especially in light of the historical trends
in achievement demonstrated in the State plan. Peers commend the state for
aggressively pursuing gap closing. However, the goals, which include 12%
improvement each year, seem unrealistic even with systemic education
changes. Such possibly overly ambitious targets could have negative

15
unintended consequences and negatively impact the students and teachers.
The text and the tables (p. 35-37) do not seem to align. Text indicates a 70%
goal for subgroups, but the tables indicate that the lowest goal is 72%.
In order to effect change and for stakeholders to see measurable growth, peers
recommend that Puerto Rico consider extending the time period over which it
wishes to see this improvement (e.g., from five years to ten years), in order for
it to have the best chance for success. Peers recommend that the SEA re-assess
the targets and time frame.
Strengths PRDE has engaged in significant restructuring in order to achieve the long-
term targets for all student populations. PRDE acknowledges the rigorous
targets and describes the need for new curricula and job-embedded, sustained
professional learning and support for educators. Likewise, PRDE recognizes
the need for a comprehensive approach – recognizing research to improving
small schools, the infrastructure support needed, and evidence-based strategies
to support all students’ learning.
Weaknesses Long-term is defined as five years which is a fairly short time horizon. The
overly ambitious goals over a small time span could make it difficult for
schools to achieve, leaving educators disillusioned.
Did the SEA meet
all requirements? ☒ Yes (4 peer reviewer(s))
☐ No (# peer reviewer(s))
If no, describe the
specific information
or clarification that
an SEA must
provide to fully meet
this requirement
A.4.iii.a.2: Measurements of interim progress
Does the SEA provide measurements of interim progress toward meeting the long-term goals for all
students?
Does the SEA provide measurements of interim progress toward meeting the long-term goals for each
subgroup of students?
Peer Response Peer Analysis Interim goals are percentages of all students and students in each subgroup
who are classified as proficient based on Spanish language arts/reading (Table
9) and math (Table 10) assessments each year (p. 42-44). PR intends to use
12% X the gap between baseline and 100%, which results in equal intervals
per year.
Peers agree that the interim goals are clear and measurable but they seem
extremely ambitious (perhaps too ambitious). If interim goals are not
achieved, then long-term goals will be impossible to attain.
Peers recommend that the State modify its interim targets to account for the
non-linear nature of progress (i.e., 12% growth might be attainable one year
but will likely slow over time) and it is important to reflect this in the interim
targets if the long-term targets are to be reached.

16
Strengths These are clear and measurable interim goals for all students and all
subgroups.
Weaknesses Peers agree that the interim goals are clear and measurable but they seem
extremely ambitious (perhaps too ambitious). Peers believe it will be difficult
to maintain such high levels of progress year after year.
The state plan details some rather sweeping -sounding changes that are taking
place in the educational system to improve achievement. The description
sounds as though PRDE is revamping the entire system top to bottom, and it is
unclear whether such radical changes to virtually every aspect of education at
once will be effective. Did the SEA meet
all requirements? ☒ Yes (4 peer reviewer(s))
☐ No (# peer reviewer(s))
If no, describe the
specific information
or clarification that
an SEA must
provide to fully meet
this requirement
A.4.iii.a.3: Improvement necessary to close statewide proficiency gaps
Do the long-term goals and measurements of interim progress for academic achievement take into
account the improvement necessary for subgroups of students who are behind in reaching those goals
to make significant progress in closing statewide proficiency gaps, such that the State’s long-term
goals require greater rates of improvement for subgroups of students that are lower achieving?
Peer Response Peer Analysis By establishing that all student groups should have a reduction in the
achievement gap of 12% per year, there is a greater rate of improvement
expected for lower performing groups than for higher performing ones (Tables
9 and 10).
Strengths The plan does include a faster path in closing the achievement gap in the
subgroups – it is clear and concise.
Weaknesses Overall expectation is unrealistic. The amount of gap closing is unrealistic as
well. PR has identified several programs and structural changes (e.g. hiring
teachers) intended to support improvement. However, given the short timeline
it seems unrealistic that these interventions can all be running with fidelity
instantaneously.
Did the SEA meet
all requirements? ☒ Yes (4 peer reviewer(s))
☐ No (# peer reviewer(s))
If no, describe the
specific information
or clarification that
an SEA must
provide to fully meet
this requirement

17
A.4.iii.b: Graduation Rate (ESEA section 1111(c) (4) (A) (i) (I) (bb))
A.4.iii.b.1: Long-term goals for four-year adjusted cohort graduation rate
Does the SEA identify and describe the long-term goals for the four-year adjusted cohort graduation
rate for all students?
Does the SEA identify and describe the long-term goals for the four-year adjusted cohort graduation
rate for each subgroup of students?
Does the SEA’s description include baseline data for all students and for each subgroup of students?
Does the SEA’s description include the timeline for meeting the long-term goals?
Is the timeline the same multi-year length of time for all students and for each subgroup of students?
Are the long-term goals ambitious?
Peer Response Peer Analysis The State plan discusses a “three-year cohort” rather than a four-year
adjusted cohort. Pursuant to ESEA section 8101(25) (D) (i), which
contains a specific provision for “Schools Starting After Grade 9,
Puerto Rico is allowed to use a three-year adjusted cohort. Peers were
also unclear about how the SEA defines “transfers out” (p. 51).
The plan shows historic graduation rates, which show that overall
graduation has improved over the past decade (from 65% to 75%) and
notable increases in graduation rate for students with disabilities and
Spanish learners (p. 51). But there are also notable declines, especially
for Hispanic non-Puerto Ricans and students of ‘other origin’ over that
time period. It is difficult to understand the meaning of these numbers,
but perhaps the percentages look the way they do because the number of
students in these groups is actually very small.
Baseline data for all students and for each subgroup are provided in
Table 13, p. 52. These are the figures from 2016-17. The long-term goal
is that in 5 years, all students and all subgroups will increase their
graduation rate by 15%, and a statewide average across all students will
be a graduation rate of 90%. The timeline is the same for everyone and
the goals do seem ambitious.
Strengths The baseline data and goals are clearly presented. Peers appreciated the
historical graduation rate data to contextualize the present goals and
plan.
Weaknesses It is not clear how students transferring among districts (and remaining
in public schools) within PR are excluded from the denominator (p.51).
Did the SEA meet
all requirements? ☐ Yes (# peer reviewer(s))
☒ No (4 peer reviewer(s))
If no, describe the
specific information
or clarification that
an SEA must
provide to fully meet
this requirement
The SEA should clarify how “transfers out” (p. 51) are included in their
system.

18
A.4.iii.b.2: If applicable, long-term goals for each extended-year adjusted cohort graduation rate
If applicable (i.e., if the SEA chooses, at its discretion, to establish long-term goals for one or more
extended-year rates), does the SEA identify and describe the long-term goals for each extended-year
adjusted cohort graduation rate for all students?
If applicable (i.e., if the SEA chooses, at its discretion, to establish long-term goals for one or more
extended-year rates), does the SEA identify and describe the long-term goals for each extended-year
adjusted cohort graduation rate for each subgroup of students?
Does the SEA’s description include baseline data for all students and for each subgroup of students?
Does the SEA’s description include the timeline for meeting the long-term goals?
Is the timeline the same multi-year length of time for all students and for each subgroup of students?
Are the long-term goals ambitious?
Are the long-term goals more rigorous than the long-term goals set for the four-year adjusted cohort
graduation rate?
Peer Response Peer Analysis N/A: PRDE does not establish long-term goals for one or more extended-year
rates.
Strengths Weaknesses
Did the SEA meet
all requirements? ☐ Yes (# peer reviewer(s))
☐ No (# peer reviewer(s))
☒ N/A
If no, describe the
specific information
or clarification that
an SEA must
provide to fully meet
this requirement
A.4.iii.b.3: Measurements of interim progress
Does the SEA provide measurements of interim progress toward the long-term goals for the four-year
adjusted cohort graduation rate and any extended-year adjusted cohort graduation rate for all
students?
Does the SEA provide measurements of interim progress toward the long-term goals for the four-year
adjusted cohort graduation rate and any extended-year adjusted cohort graduation rate for each
subgroup of students?
Peer Response Peer Analysis The State lists baseline and interim graduation goals for all students and all
subgroups (p. 57). The interim goals are 3% yearly increases in the graduation
rate for all students and for all subgroups. These are for a three-year cohort
rather than a four-year adjusted cohort, but pursuant to ESEA section 8101(25)
(D) (i), which contains a specific provision for “Schools Starting After Grade
9, this is acceptable.
Strengths PRDE clearly lays out expectations in Table 11. PRDE has indicated specific
initiatives and TA supports to help the state and local districts in achieving this

19
goal. In particular PRDE has analyzed discrepancies in graduation rates across
the subgroups and have identified initiatives to mitigate those differences (p.
56). The plan allows for gradual increases over time rather than relying on one
large increase. Furthermore, a 3% per year increase is ambitious and given the
recent trend of 2% per year, it seems feasible.
Weaknesses Goals appear attainable and measurable, the issue being that they are based on
a three-year and not a four-year adjusted cohort.
Did the SEA meet
all requirements? ☒ Yes (4 peer reviewer(s))
☐No (# peer reviewer(s))
If no, describe the
specific information
or clarification that
an SEA must
provide to fully meet
this requirement
A.4.iii.b.4: Improvement necessary to close statewide graduation rate gaps
Do the long-term goals and measurements of interim progress for the four-year adjusted cohort
graduation rate and any extended-year adjusted cohort graduation rate take into account the
improvement necessary for subgroups of students who are behind in reaching those goals to make
significant progress in closing statewide graduation rate gaps, such that the State’s long-term goals
require greater rates of improvement for subgroups of students that graduate from high school at
lower rates?
Peer Response Peer Analysis The PRDE graduation rate goals are different for all students and student
subgroups. Each subgroup needs to make the same 3% gain in rate each year
to achieve the long-term goal for that subgroup. Subgroups of students that
graduate at a lower rate do not need to make greater rates of improvement (p.
57).
While the early warning system will indeed identify students at risk and
programs like CASA will work to support students to stay in school,
preventing students from dropping out is often a multi-faceted approach. It
will be important for PRDE to monitor data to determine which approaches
have realized success.
Strengths It is commendable that an early warning system will be utilized to prevent
drop outs including a number of metrics to identify students’ at risk of
dropping out.
Weaknesses Expectations are the same for all subgroups, such that greater rates of
improvement are not expected for one subgroup over another.
Did the SEA meet
all requirements? ☐ Yes (# peer reviewer(s))
☒ No (4 peer reviewer(s))
If no, describe the
specific information
or clarification that
an SEA must
provide to fully meet
this requirement
SEA must provide measurements of interim progress that require greater rates
of improvement for some subgroups.

20
A.4.iii.c: English Language Proficiency (ESEA section 1111(c) (4) (A) (ii))
A.4.iii.c.1: Long-term goals
Does the SEA identify and describe the long-term goal for increases in the percentage of English
learners making progress in achieving English language proficiency, as measured by the statewide
English language proficiency assessment?
Does the SEA’s description include baseline data?
Does the SEA’s description include the State-determined timeline for English learners to achieve
English language proficiency?
Is the long-term goal ambitious?
Peer Response Peer Analysis In Puerto Rico, Spanish learners are the equivalent of English learners in the
rest of the U.S. The assessment used to measure Spanish proficiency is the
LAS Links, and a minimum score of 4 overall is considered proficient (p. 58).
The State plan indicates that students typically take between 10 months and 3
years to reach proficiency. Baseline data from 2016-17 show that 23% of the
SL population tested as proficient. Over a five year timeline, the State aims to
increase the SL proficiency rate to 53%, an increase of 6% per year. This
appears ambitious given the historical trends also shown in the plan. Peers
would need additional data in order to determine whether the 53% Spanish
language proficiency rate goal is attainable.
Long term goal is for the percentage proficient to reach 53% by 2022 – a 6%
yearly increase. PRDE has established a maximum 5 year period to gain
proficiency (Table 19).
The plan also lists baseline and long-term goals for progress toward Spanish
language proficiency [SLP] (Table 18, p. 59). A 6% increase per year is set as
the goal for progress toward SLP. Given the small numbers of Spanish
learners overall, this growth goal should be attainable.
Strengths Using a growth to target score is an improvement to setting the growth
expectation at 10pt/yr.
Weaknesses The basic GTT (growth to target) calculation, while based on initial SLP level
(and Scale Score) and adjusting each year – sets targets that will increase
yearly likely causing students to fail to make progress (count towards
progress). This may create disincentives for schools to work with SLs who are
behind. PR also sets long term goals based on percent exiting, but if the
timeline to exit is between 2 and 5 years it may be impossible to achieve the
53% exit rate that has been established.
Did the SEA meet
all requirements? ☒ Yes (4 peer reviewer(s))
☐ No (# peer reviewer(s))
If no, describe the
specific information
or clarification that
an SEA must
provide to fully meet

21
this requirement
A.4.iii.c.2: Measurements of interim progress
Does the SEA provide measurements of interim progress toward the long-term goal for increases in
the percentage of English learners making progress in achieving English language proficiency?
Peer Response Peer Analysis The State plan (p. 61, Table 20) lists baseline proficiency levels for SLs,
yearly interim proficiency goals, and a 5-year goal of 53% proficient in 2022.
PRDE also set progress toward proficiency goals (p. 59-60).
Strengths The interim increases that are projected are gradual, so there is no sudden
precipitous increase at any one point in time. PRDE also outlines some
supports that it will make available to schools that are not meeting the interim
goals that have been set, as well as strategies and interventions to help
Spanish learners. Table 24, p. 66 lists goals that are based on WIDA standards
but it is unclear how these are integrated into the curriculum or related to
student assessment outcomes, since no WIDA test is used.
It is notable that PRDE intends to monitor school functions when SL students
are not progressing as expected. Likewise, PRDE intend to provide a number
of supports to help local schools and teachers support SLs.
Weaknesses Peers question the feasibility of the projected exit rate, given the timelines
allowed for exiting.
PRDE is planning to offer a wide array of resources and supports to promote
SLs – which again is commendable. That said, PRDE should consider the
level of evidence for the strategies and also how to continually collect data to
determine which strategies are having an effective on SLs’ progress.
Did the SEA meet
all requirements? ☒ Yes (4 peer reviewer(s))
☐ No (# peer reviewer(s))
If no, describe the
specific
information or
clarification that
an SEA must
provide to fully
meet this
requirement
A.4.iv: Indicators (ESEA section 1111(c) (4) (B), 1111(c) (4) (E) (ii))
Note: A single indicator may consist of multiple components or measures. Peers must review each such
component or measure for compliance with all of the required elements.
A.4.iv.a: Academic Achievement
Does the SEA describe the Academic Achievement indicator used in its statewide accountability
system, including that the SEA uses the same indicator for all schools in all LEAs across the State?

22
Does the description include how the SEA calculates the indicator, including: 1) that the calculation is
consistent for all schools, in all LEAs, across the State; 2) a description of the weighting of
reading/language arts achievement relative to mathematics achievement; 3) if the State uses one, a
description of the performance index; 4) if, at the high school level, the indicator includes a measure
of student growth, a description of the growth measure (e.g., a growth model); and 5) if the State
averages data, a description of how it averages data across years and/or grades (e.g., does the State
use a uniform averaging procedure across all schools)?
Is the indicator valid and reliable?
Is the indicator based on the SEA’s long-term goals?
Can the indicator be disaggregated for each subgroup of students?
Is the indicator measured by grade-level proficiency on the annual statewide reading/language arts
and mathematics assessments?
Does the indicator measure the performance of at least 95 percent of all students and 95 percent of all
students in each subgroup?
Peer Response Peer Analysis At the elementary and middle school levels, PRDE has three Academic
Achievement indicators: reading/language arts (Spanish) proficiency, math
proficiency, and growth. Growth cannot be an academic achievement indicator
at the elementary and middle school level.
The growth matrix (which PRDE labels as a “transition matrix”) in some
instances awards more points for maintaining a level than for growth. Also, it
appears that growth more than compensates for lack of growth (negative
growth).
Percent of students proficient in Spanish and math proficiency on the META-
PR are equally weighted (50-50) and make up 50% of the indicator together.
Growth makes up the other 50% and is based on a year-to-year comparison of
student performance in Spanish and math. It is not specified what the
breakdown is (but peers assume each student gets 0-6 points for growth in
each content area and this is averaged). These indicators are linked to grade-
level proficiency and are valid and reliable to the extent that the META-PR
assessments are valid and reliable, and disaggregation is possible for each
subgroup.
At the high school level, PRDE also uses Spanish proficiency and math
proficiency as components of the Academic Achievement indicator. These are
weighted the same as at the lower level. But instead of growth, since there is
only one high school test (at grade 11), College Board PEAU test scores are
used as the third component in high school. The State plan indicates on p. 76
that if a school does not have growth or College Board PEAU test data, then
its entire Academic Achievement indicator is from math and Spanish
proficiency. The College Board test is not an appropriate academic
achievement indicator, although it could be used as a school quality indicator.
PRDE does not indicate why some high schools would be missing growth or
College Board data, and this should be clarified. Although the PEAU may be
linked to PRDE’s goals for college readiness, it would not seem to be the most
appropriate measure. Do all students, including 95% of all students and all

23
subgroups, even those in alternative education programs, take the PEAU?
More detail should be provided about who takes the test to substantiate that it
meets the criteria.
The narrative is not clear how the indicator measures the performance of at
least 95% of all students and 95% of students in each subgroup.
Strengths Transition matrix (Diagram 5, p. 74) is transparent and clearly shows how
points are awarded for growth (at the high school level).
Weaknesses Growth cannot be used as an academic achievement indicator at the
elementary and middle school level. However, it can be used as an other
academic indicator.
At the high school level, the College Board test is not an appropriate academic
achievement indicator, although it could be used as a school quality indicator.
The narrative is not clear how the indicator measures the performance of at
least 95% of all students and 95% of students in each subgroup.
Did the SEA meet
all requirements? ☐ Yes (# peer reviewer(s))
☒ No (4 peer reviewer(s))
If no, describe the
specific information
or clarification that
an SEA must
provide to fully meet
this requirement
Growth cannot be used as an academic achievement indicator at the
elementary and middle school level. However, it can be used as an other
academic indicator.
More detail should be provided about who takes the College Board PEAU test,
which is not an appropriate component of academic achievement at the high
school level.
The narrative is not clear how the indicator measures the performance of at
least 95% of all students and 95% of students in each subgroup. The SEA
needs to address this.
A.4.iv.b: Other Academic Indicator for Elementary and Secondary Schools that are Not High Schools
Note: If the SEA uses a different Other Academic indicator for each grade span, peer reviewers must
separately review each indicator that an SEA submits. For example, if an SEA submits one Other
Academic indicator for elementary schools and a different Other Academic indicator for middle schools,
then peer reviewers will provide feedback, using the criteria below, separately for each indicator.
Does the SEA describe the Other Academic indicator used in its statewide accountability system for
public elementary and secondary schools that are not high schools, including that the SEA uses the
same indicator and calculates it in the same way for all elementary and secondary schools that are not
high schools, in all LEAs, across the State, except that the indicator may vary by each grade span?
Does the SEA describe, if applicable, how it averages data across years and/or grades (e.g., does the
State use a uniform averaging procedure across all schools)?
If the SEA uses a different indicator for each grade span, does it describe each indicator, including the
grade span to which it applies?
24
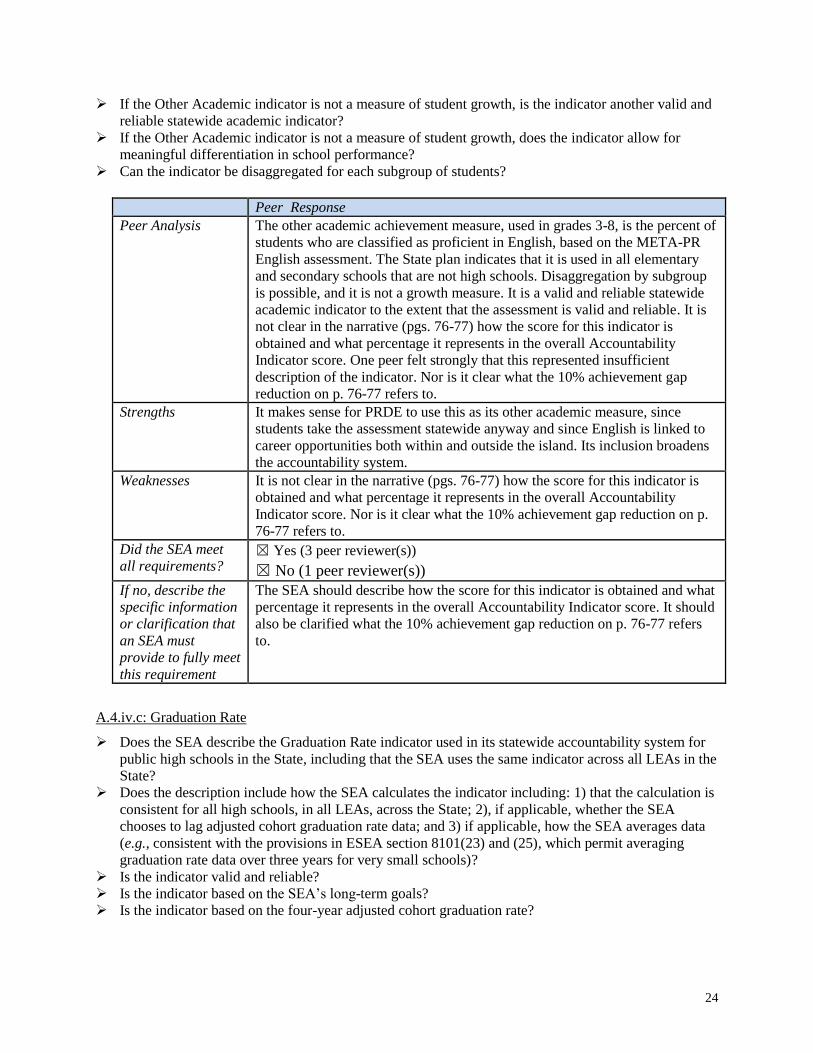
If the Other Academic indicator is not a measure of student growth, is the indicator another valid and
reliable statewide academic indicator?
If the Other Academic indicator is not a measure of student growth, does the indicator allow for
meaningful differentiation in school performance?
Can the indicator be disaggregated for each subgroup of students?
Peer Response Peer Analysis The other academic achievement measure, used in grades 3-8, is the percent of
students who are classified as proficient in English, based on the META-PR
English assessment. The State plan indicates that it is used in all elementary
and secondary schools that are not high schools. Disaggregation by subgroup
is possible, and it is not a growth measure. It is a valid and reliable statewide
academic indicator to the extent that the assessment is valid and reliable. It is
not clear in the narrative (pgs. 76-77) how the score for this indicator is
obtained and what percentage it represents in the overall Accountability
Indicator score. One peer felt strongly that this represented insufficient
description of the indicator. Nor is it clear what the 10% achievement gap
reduction on p. 76-77 refers to.
Strengths It makes sense for PRDE to use this as its other academic measure, since
students take the assessment statewide anyway and since English is linked to
career opportunities both within and outside the island. Its inclusion broadens
the accountability system. Weaknesses It is not clear in the narrative (pgs. 76-77) how the score for this indicator is
obtained and what percentage it represents in the overall Accountability
Indicator score. Nor is it clear what the 10% achievement gap reduction on p.
76-77 refers to.
Did the SEA meet
all requirements? ☒ Yes (3 peer reviewer(s))
☒ No (1 peer reviewer(s))
If no, describe the
specific information
or clarification that
an SEA must
provide to fully meet
this requirement
The SEA should describe how the score for this indicator is obtained and what
percentage it represents in the overall Accountability Indicator score. It should
also be clarified what the 10% achievement gap reduction on p. 76-77 refers
to.
A.4.iv.c: Graduation Rate
Does the SEA describe the Graduation Rate indicator used in its statewide accountability system for
public high schools in the State, including that the SEA uses the same indicator across all LEAs in the
State?
Does the description include how the SEA calculates the indicator including: 1) that the calculation is
consistent for all high schools, in all LEAs, across the State; 2), if applicable, whether the SEA
chooses to lag adjusted cohort graduation rate data; and 3) if applicable, how the SEA averages data
(e.g., consistent with the provisions in ESEA section 8101(23) and (25), which permit averaging
graduation rate data over three years for very small schools)?
Is the indicator valid and reliable?
Is the indicator based on the SEA’s long-term goals?
Is the indicator based on the four-year adjusted cohort graduation rate?

25
If the State, at its discretion, also includes one or more extended-year adjusted cohort graduation
rates, does the description include how the four-year adjusted cohort graduation rate is combined with
that rate or rates within the indicator?
If applicable, does the SEA’s description include how the State includes in its four-year adjusted
cohort graduation rate and any extended-year adjusted cohort graduation rates students with the most
significant cognitive disabilities assessed using an alternate assessment aligned to alternate academic
achievement standards under ESEA section 1111(b) (2) (D) and awarded a State-defined alternate
diploma under ESEA section 8101(23) and (25)?
Can the indicator be disaggregated for each subgroup of students?
Peer Response Peer Analysis The State plan indicates that the graduation rate indicator “is calculated based
on the number of students who earned a regular high school diploma divided
by the total number of students in the three-year cohort” (p. 78). Rates are
disaggregated by subgroup, and the State plan indicates that students with the
most significant cognitive disabilities are not included in these counts (p. 79,
in the sentence immediately before subsection d.)
The state plan does not specify how students with the most significant
cognitive impairments taking the alternate assessments are counted or how
very small schools (which presumably there are) are handled (e.g., whether
and how data are averaged across years).
Table 27 illustrates the baseline graduation rates, including the student
subgroups. PRDE is using a 3 year cohort graduation rate. PRDE has
established a target of improving the graduation rate by 3% annually over 5
years. Furthermore, the graphic on p. 69 does not appear to align with the
narrative (percent English proficiency and graduation rate should not be under
one indicator, as they appear to be in the graphic).
The narrative is not clear on how graduation rate “account[s] for students who
are considered dropouts and transfers” (pg. 78).
It is not clear how valid and reliable the graduation rate calculation is
currently, particularly regarding dropouts and transfers.
Strengths N/A
Weaknesses On page 79, PRDE wrote that they do not consider students with significant
cognitive disabilities obtaining the high school diploma. This is unclear – and
becomes more problematic given that PRDE has not addressed the 95%
participation rate in the academic achievement section.
Did the SEA meet
all requirements? ☐ Yes (# peer reviewer(s))
☒ No (4 peer reviewer(s))
If no, describe the
specific information
or clarification that
an SEA must
provide to fully meet
this requirement
The SEA should clarify what “accounting for students who are considered
dropouts and transfers” (pg. 78) means in the calculation of graduation rates.
The SEA should specify how very small schools (which presumably there are)
are handled (e.g., whether and how data are averaged across years).
26
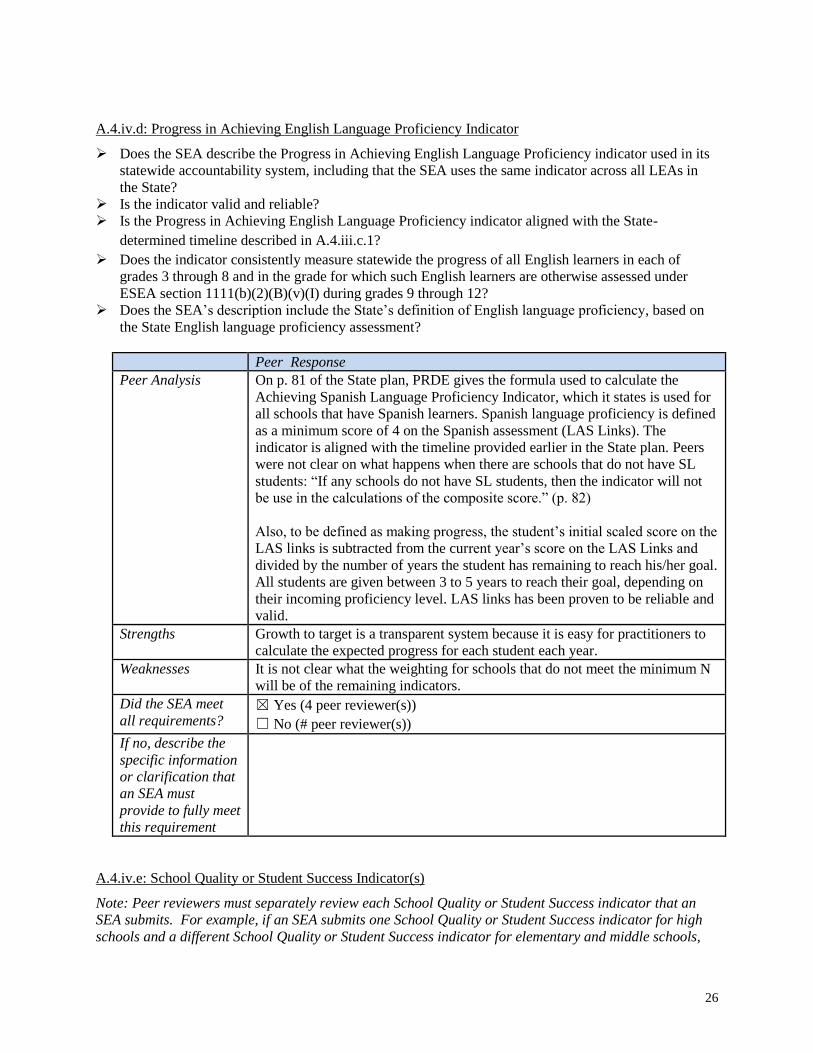
A.4.iv.d: Progress in Achieving English Language Proficiency Indicator
Does the SEA describe the Progress in Achieving English Language Proficiency indicator used in its
statewide accountability system, including that the SEA uses the same indicator across all LEAs in
the State?
Is the indicator valid and reliable?
Is the Progress in Achieving English Language Proficiency indicator aligned with the State-
determined timeline described in A.4.iii.c.1?
Does the indicator consistently measure statewide the progress of all English learners in each of
grades 3 through 8 and in the grade for which such English learners are otherwise assessed under
ESEA section 1111(b)(2)(B)(v)(I) during grades 9 through 12?
Does the SEA’s description include the State’s definition of English language proficiency, based on
the State English language proficiency assessment?
Peer Response Peer Analysis On p. 81 of the State plan, PRDE gives the formula used to calculate the
Achieving Spanish Language Proficiency Indicator, which it states is used for
all schools that have Spanish learners. Spanish language proficiency is defined
as a minimum score of 4 on the Spanish assessment (LAS Links). The
indicator is aligned with the timeline provided earlier in the State plan. Peers
were not clear on what happens when there are schools that do not have SL
students: “If any schools do not have SL students, then the indicator will not
be use in the calculations of the composite score.” (p. 82)
Also, to be defined as making progress, the student’s initial scaled score on the
LAS links is subtracted from the current year’s score on the LAS Links and
divided by the number of years the student has remaining to reach his/her goal.
All students are given between 3 to 5 years to reach their goal, depending on
their incoming proficiency level. LAS links has been proven to be reliable and
valid.
Strengths Growth to target is a transparent system because it is easy for practitioners to
calculate the expected progress for each student each year.
Weaknesses It is not clear what the weighting for schools that do not meet the minimum N
will be of the remaining indicators.
Did the SEA meet
all requirements? ☒ Yes (4 peer reviewer(s))
☐ No (# peer reviewer(s))
If no, describe the
specific information
or clarification that
an SEA must
provide to fully meet
this requirement
A.4.iv.e: School Quality or Student Success Indicator(s)
Note: Peer reviewers must separately review each School Quality or Student Success indicator that an
SEA submits. For example, if an SEA submits one School Quality or Student Success indicator for high
schools and a different School Quality or Student Success indicator for elementary and middle schools,
27
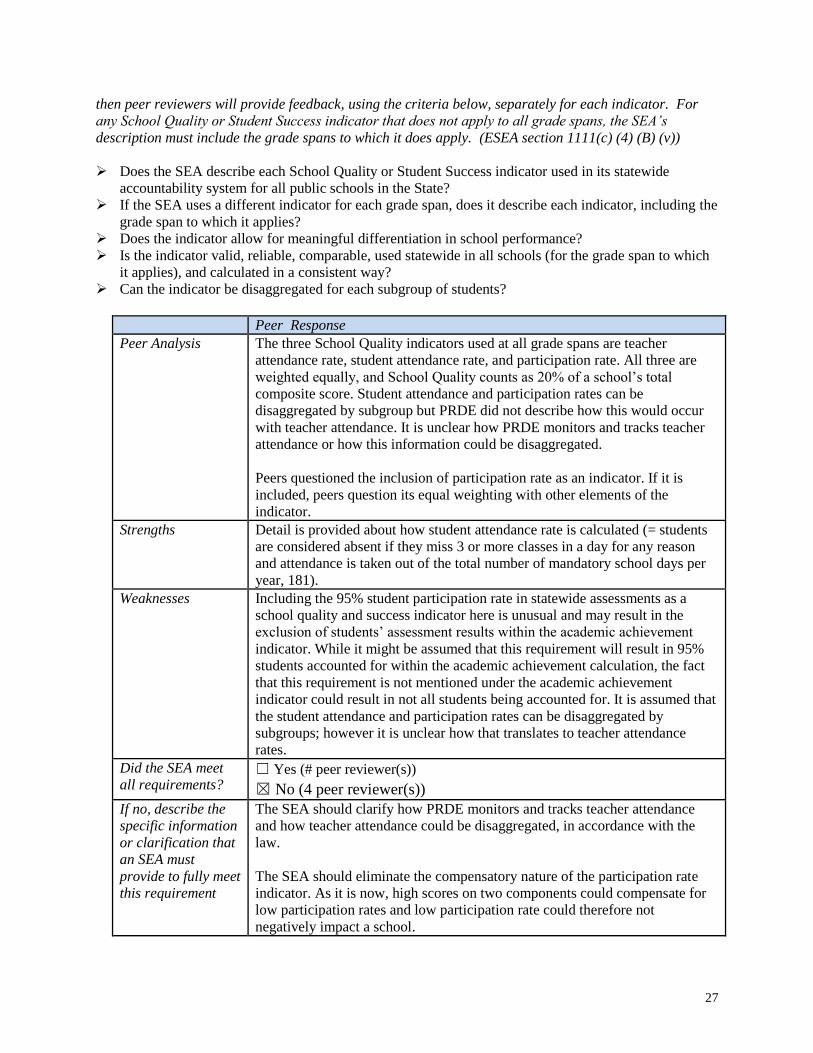
then peer reviewers will provide feedback, using the criteria below, separately for each indicator. For
any School Quality or Student Success indicator that does not apply to all grade spans, the SEA’s
description must include the grade spans to which it does apply. (ESEA section 1111(c) (4) (B) (v))
Does the SEA describe each School Quality or Student Success indicator used in its statewide
accountability system for all public schools in the State?
If the SEA uses a different indicator for each grade span, does it describe each indicator, including the
grade span to which it applies?
Does the indicator allow for meaningful differentiation in school performance?
Is the indicator valid, reliable, comparable, used statewide in all schools (for the grade span to which
it applies), and calculated in a consistent way?
Can the indicator be disaggregated for each subgroup of students?
Peer Response Peer Analysis The three School Quality indicators used at all grade spans are teacher
attendance rate, student attendance rate, and participation rate. All three are
weighted equally, and School Quality counts as 20% of a school’s total
composite score. Student attendance and participation rates can be
disaggregated by subgroup but PRDE did not describe how this would occur
with teacher attendance. It is unclear how PRDE monitors and tracks teacher
attendance or how this information could be disaggregated.
Peers questioned the inclusion of participation rate as an indicator. If it is
included, peers question its equal weighting with other elements of the
indicator.
Strengths Detail is provided about how student attendance rate is calculated (= students
are considered absent if they miss 3 or more classes in a day for any reason
and attendance is taken out of the total number of mandatory school days per
year, 181).
Weaknesses Including the 95% student participation rate in statewide assessments as a
school quality and success indicator here is unusual and may result in the
exclusion of students’ assessment results within the academic achievement
indicator. While it might be assumed that this requirement will result in 95%
students accounted for within the academic achievement calculation, the fact
that this requirement is not mentioned under the academic achievement
indicator could result in not all students being accounted for. It is assumed that
the student attendance and participation rates can be disaggregated by
subgroups; however it is unclear how that translates to teacher attendance
rates.
Did the SEA meet
all requirements? ☐ Yes (# peer reviewer(s))
☒ No (4 peer reviewer(s))
If no, describe the
specific information
or clarification that
an SEA must
provide to fully meet
this requirement
The SEA should clarify how PRDE monitors and tracks teacher attendance
and how teacher attendance could be disaggregated, in accordance with the
law.
The SEA should eliminate the compensatory nature of the participation rate
indicator. As it is now, high scores on two components could compensate for
low participation rates and low participation rate could therefore not
negatively impact a school.

28
A.4.v: Annual Meaningful Differentiation (ESEA section 1111(c) (4) (C))
A.4.v.a: State’s System of Annual Meaningful Differentiation
Does the SEA describe its system of meaningfully differentiating, on an annual basis, all public
schools in the State?
Is the State’s system of annual meaningful differentiation based on all indicators in the State’s
accountability system?
Does the State’s system of annual meaningful differentiation include the performance of all students
and each subgroup of students on each of the indicators in the State’s accountability system?
Peer Response Peer Analysis On p. 89-90, the State plan lists the components it uses in meaningfully
differentiating all public schools. The system outlined is based on all of the
indicators in the accountability system, and the system is said to include the
performance of all students and each subgroup on each indicator. Peers
question the teacher attendance indicator as an appropriate measure, as well as
the College Board (PEAU) scores, which are not linked to their curriculum
and are probably not the most appropriate measure either. 20% of the annual
meaningful differentiation also comes from the percent of students making
progress toward Spanish proficiency (in schools where there are SLs). The
plan indicates, “if the data is unavailable for one of the components of the
school quality indicator, the average of the available variables will be
calculated to generate this indicator” (p. 90). That implies that some schools
might not have student attendance or participation rates. Does this refer to K-2
schools, which necessarily wouldn’t have all of these, or does it mean
something else entirely? This should be clarified.
Although the plan suggests that each subgroup’s performance is factored into
the accountability system (p. 88), it is not clear how this is incorporated into
the composite score.
Strengths N/A
Weaknesses Averaging the available metrics in the school quality indicator when one of the
metrics is unavailable is problematic because it means that school quality
indicators across schools are not equivalent. Inclusion of the participation rate
is also problematic, since if it meaningfully differentiates schools that suggest
significant variation in participation rate.
Did the SEA meet
all requirements? ☐ Yes (# peer reviewer(s))
☒ No (4 peer reviewer(s))
If no, describe the
specific information
or clarification that
an SEA must
provide to fully meet
this requirement
The SEA should clarify how each subgroup’s performance is factored into the
composite score.
The SEA should clarify under what circumstances data is unavailable for one
of the components of the school quality indicator. All components of
meaningful annual differentiation should be available for all schools.
The SEA should eliminate the compensatory nature of the participation rate
indicator. As it is now, high scores on two components could compensate for
low participation rates such that low participation rate might not negatively
impact a school.

29
A.4.v.b: Weighting of Indicators
Does the SEA describe the weighting of each indicator in its system of annual meaningful
differentiation, including how the weighting is adjusted for schools for which an indicator cannot be
calculated due to the minimum number of students (e.g., for the Progress in Achieving English
Language Proficiency indicator)?
Do the Academic Achievement, Other Academic, Graduation Rate, and Progress in Achieving
English Language Proficiency indicators each receive substantial weight individually?
Do the Academic Achievement, Other Academic, Graduation Rate, and Progress in Achieving
English Language Proficiency indicators receive, in the aggregate, much greater weight than the
School Quality or Student Success indicator(s), in the aggregate?
Peer Response Peer Analysis The indicators are weighted in accordance with the requirements of this
element, with substantially more weight given to Academic Achievement,
Other Academic, Graduation Rate, and Progress in Achieving English
Language Proficiency than the School Quality or Student Success indicator(s).
In schools with SLs, school quality receives 20% weight and in schools
without SLs, it receives 25% (p. 91-92).
Given that changes will need to be made to the academic achievement
indicator, the weighting will need to be revisited once the new academic
achievement indicator is in place.
Strengths Equal weighting is strength because no one indicator overly influences or
biases the overall results.
Weaknesses Equal weighting indicates that PR does not have a specific outcome they
intend to drive claims about schools – equal weighting indicates that any
indicator can equally substitute for another.
Did the SEA meet
all requirements? ☒ Yes (4 peer reviewer(s))
☐ No (# peer reviewer(s))
If no, describe the
specific information
or clarification that
an SEA must
provide to fully meet
this requirement
A.4.v.c: If Applicable, Different Methodology for Annual Meaningful Differentiation
If the SEA uses a different methodology or methodologies for annual meaningful differentiation than
the one described in 4.v.a of the State’s plan for schools for which an accountability determination
cannot be made (e.g., P-2 schools), does it describe the different methodology or methodologies,
including how the methodology or methodologies will be used to identify schools for comprehensive
or targeted support and improvement?
Does the SEA’s description of a different methodology indicate the type(s) of schools to which it
applies?
Peer Response Peer Analysis The State’s response to this element does not appear to respond fully to this

30
element (p. 92). It describes schools that do not have Spanish learners, rather
than schools for which an accountability determination cannot be made. PRDE
should respond clearly to this element, indicating whether there are any such
schools and if so, what methodology is used.
Strengths
Weaknesses The response provided does not address schools for which an accountability
determination cannot be made. PR should clarify whether there are such
schools and detail the methodology that it applies, if relevant.
Did the SEA meet
all requirements? ☐ Yes (# peer reviewer(s))
☒ No (4 peer reviewer(s))
If no, describe the
specific information
or clarification that
an SEA must
provide to fully meet
this requirement
PRDE should respond clearly to this element, indicating whether there are any
such schools and if so, what methodology is used.
A.4.vi: Identification of Schools (ESEA section 1111(c) (4) (D), 1111(d) (2) (C)-(D))
A.4.vi.a Comprehensive Support and Improvement Schools—Lowest Performing
Does the SEA describe its methodology to identify not less than the lowest-performing five percent of
all schools receiving Title I, Part A funds in the State for comprehensive support and improvement
including, if applicable, how it averages data (e.g., does the State use a uniform averaging procedure
across all schools)?
Does the SEA’s methodology result in the identification of not less than the lowest-performing five
percent of all schools receiving Title I, Part A funds in the State for comprehensive support and
improvement?
Does the SEA include the year in which it will first identify these schools for comprehensive support
and improvement (i.e., does the timeline comply with the Department’s guidance)?
Peer Response Peer Analysis The State plan indicates how it will identify the lowest performing 5% of all
schools (p. 95). It will begin identifying these schools by the end of June 2018
using 2017-2018 data. The numbers provided in the state plan (p. 95-96) that
detail the schools identified using this methodology indicate frequency counts
rather than percentages, so it is difficult to determine whether more than the
bare minimum of schools is actually identified. This should be clarified.
Furthermore, peers question whether the identification refers to all schools or
to all Title I schools. Also, the PR text (but not table on p. 94) implies that a
school must be in the bottom 5% for three consecutive years to be in CSI. If
CSI are limited to this rule there is no guarantee that there will be 5% of
schools in CSI.
Strengths N/A
Weaknesses The numbers provided in the state plan (p. 95-96) that detail the schools
identified using this methodology indicate frequency counts rather than
percentages, so it is difficult to determine whether more than the bare
minimum of schools is actually identified. This should be clarified.

31
Furthermore, peers question whether the identification refers to all schools or
to all Title I schools. Also, the PR text (but not table on p. 94) implies that a
school must be in the bottom 5% for three consecutive years to be in CSI. If
CSI are limited to this rule there is no guarantee that there will be 5% of
schools in CSI.
Did the SEA meet
all requirements? ☐ Yes (# peer reviewer(s))
☒ No (4 peer reviewer(s))
If no, describe the
specific information
or clarification that
an SEA must
provide to fully meet
this requirement
The SEA should provide percentages to better contextualize the frequency
counts and to substantiate the identification of the requisite schools.
Furthermore, the SEA should clarify whether the identification refers to all
schools or to all Title I schools, and whether a school must be in the bottom
5% for three consecutive years to be in CSI.
A.4.vi.b: Comprehensive Support and Improvement Schools—Low Graduation Rates
Does the SEA describe its methodology to identify all public high schools in the State failing to
graduate one-third or more of their students for comprehensive support and improvement, including:
1) a description of whether the SEA uses one or more extended-year adjusted cohort graduation rates
in addition to the four-year adjusted cohort graduation rate and 2) if applicable, how the SEA
averages data (e.g., does the State use a uniform averaging procedure across all schools)?
Does the SEA’s methodology result in the identification of all public high schools in the State failing
to graduate one-third or more of their students for comprehensive support and improvement?
Does the SEA include the year in which it will first identify these schools for comprehensive support
and improvement (i.e., does the timeline comply with the Department’s guidance)?
Peer Response Peer Analysis Starting in 2018-2019, PRDE will identify all high schools that graduate 67%
or fewer of its students as schools for CSI, using the four-year cohort
graduation rate data for 2017-18.
Strengths The methodology to identify all public high schools with low graduation rates
is clearly and concisely expressed. .
Weaknesses Since PRDE has not yet started using the four-year adjusted cohort, there is
uncertainty about the integrity of the data.
Did the SEA meet
all requirements? ☒ Yes (4 peer reviewer(s))
☐ No (# peer reviewer(s))
If no, describe the
specific information
or clarification that
an SEA must
provide to fully meet
this requirement
A.4.vi.c: Comprehensive Support and Improvement Schools—Additional Targeted Support Not Exiting
Such Status
Does the SEA describe its methodology to identify schools receiving Title I, Part A funds that have
received additional targeted support under ESEA section 1111(d) (2) (C) (i.e., based on identification

32
as a school in which the performance of any subgroup of students, on its own, would lead to
identification as one of the lowest-performing five percent) that have not satisfied the statewide exit
criteria for such schools within a State-determined number of years? Does the SEA’s methodology result in the identification of such schools? Does the SEA include the year in which it will first identify these schools for comprehensive support
and improvement (i.e., does the timeline comply with the Department’s guidance)?
Peer Response Peer Analysis The PRDE Plan describes a process (pgs. 97-98) to identify schools for CSI if
they have one or more subgroups of students performing in the lowest 5% of
schools. Schools may remain in this CSI classification for three years. The
initial identification year will be based on the 2017-18 data and the first
identification will occur in 2020-2021.
Strengths The identification process is straight forward and easy to follow because the
steps are well delineated.
Weaknesses N/A
Did the SEA meet
all requirements? ☒ Yes (4 peer reviewer(s))
☐ No (# peer reviewer(s))
If no, describe the
specific information
or clarification that
an SEA must
provide to fully meet
this requirement
A.4.vi.d: Frequency of Identification
Does the SEA include the frequency with which the State will identify each type of school for
comprehensive support and improvement after the first year of identification?
Does the SEA’s timeline result in identification of these schools at least once every three years?
Peer Response Peer Analysis The State plan indicates that “schools will be reviewed annually” after the
first year of identification (2017-2018), so this meets the requirement that
they be identified at least once every three years (p. 94, 97, 98).
Strengths Annual evaluation exceeds the requirement of this critical element.
Weaknesses N/A
Did the SEA meet
all requirements? ☒ Yes (4 peer reviewer(s))
☐ No (# peer reviewer(s))
If no, describe the
specific information
or clarification that
an SEA must
provide to fully
meet this
requirement

33
A.4.vi.e: Targeted Support and Improvement Schools—“Consistently Underperforming” Subgroups
Does the SEA describe its methodology to identify schools with one or more “consistently
underperforming” subgroups of students, including its definition of “consistently underperforming”?
Does the SEA’s methodology result in the identification of any school with one or more “consistently
underperforming” subgroups of students?
Is the methodology based on all indicators in the statewide system of annual meaningful
differentiation?
Does the SEA identify these schools annually?
Peer Response Peer Analysis A school is identified as having one or more subgroups of students
underperforming if “at least one subgroup, with a minimum of 10 students, is
at the bottom 10% of the composite scores based on all indicators” used for
annual meaningful differentiation (p. 99). Table 29 (p. 95) indicates that
identification occurs annually.
Strengths The definition of consistently underperforming subgroups is clear.
Weaknesses The small minimum N size, combined with annual identification based on one
year’s worth of data could result in unreliable identification. PRDE could
consider aggregating data across years to address this problem, in addition to
revisiting N size as indicated previously.
Did the SEA meet
all requirements? ☒ Yes (4 peer reviewer(s))
☐ No (# peer reviewer(s))
If no, describe the
specific information
or clarification that
an SEA must
provide to fully meet
this requirement
A.4.vi.f: Targeted Support and Improvement Schools—Additional Targeted Support
Does the SEA describe its methodology to identify schools in which the performance of any subgroup
of students, on its own, would lead to identification under ESEA section 1111(c)(4)(D)(i)(I) using the
State’s methodology under ESEA section 1111(c)(4)(D) (i.e., the methodology described above in
A.4.vi.a), including: 1) whether the methodology identifies these schools from among all public
schools in the State or from among only the schools identified as schools with one or more
consistently underperforming subgroups and 2) if applicable, how the SEA averages data (e.g., does
the State use a uniform averaging procedure across all schools)?
Does the SEA’s methodology result in identification of such schools?
Does the SEA include the year in which the State will first identify such schools (i.e., does the
timeline comply with the Department’s guidance)?
Does the SEA include the frequency with which the State will identify such schools after the first year
of identification?
Peer Response Peer Analysis PRDE will begin to identify schools in the 2018-2019 school years. Schools

34
will be identified if “at least one subgroup, with a minimum of 10 students, is
at the bottom 10% of the composite scores based on all indicators” used for
annual meaningful differentiation (p. 99). Peers could not determine whether
these schools will be identified from among all Title I schools or from among
all schools. Peers were also uncertain of the distinction between TSI schools
and TSI-1 schools (p. 101). These issues should be clarified.
The information about identification (first bullet on p. 100 and the last two
sentences of the first paragraph on p. 101) seems incongruous and should be
clarified.
Strengths Identification of the lowest performing 10% exceeds the federal requirement.
Weaknesses Peers could not determine whether schools will be identified from among all
Title I schools or from among all schools. Peers were also uncertain of the
distinction between TSI schools and TSI-1 schools (p. 101).
The information about identification (first bullet on p. 100 and the last two
sentences of the first paragraph on p. 101) seem incongruous and should be
clarified.
Did the SEA meet
all requirements? ☐ Yes (# peer reviewer(s))
☒ No (4 peer reviewer(s))
If no, describe the
specific information
or clarification that
an SEA must
provide to fully meet
this requirement
The SEA should clarify whether schools will be identified from among all
schools (not just Title I schools) or among schools identified as having
consistently underperforming subgroups as it was not clear in the description,
and define TSI vs. TSI-1 schools. Finally, the information about identification
(first bullet on p. 100 and the last two sentences of the first paragraph on p.
101) seems incongruous and should be clarified.
A.4.vi.g: If Applicable, Additional Statewide Categories of Schools
If the State chooses, at its discretion, to include additional statewide categories of schools, does the
SEA describe those categories?
Peer Response Peer Analysis N/A: The state has not included additional categories.
Strengths
Weaknesses
Did the SEA meet
all requirements? ☐ Yes (# peer reviewer(s))
☐ No (# peer reviewer(s))
☒ N/A
If no, describe the
specific information
or clarification that
an SEA must
provide to fully meet
this requirement

35
A.4.vii: Annual Measure of Achievement (ESEA section 1111(c) (4) (E) (iii))
Does the SEA describe how it factors the requirement for 95 percent participation of all students and
95 percent of all students in each subgroup of students in statewide mathematics and
reading/language arts assessments into the statewide accountability system?
If applicable, does the SEA describe how the SEA differentiates its approach based on such factors as
the number of subgroups in the school missing the participation rate requirement, the length of time
over which the school has missed the requirement, or the degree to which the school missed the
requirement (e.g., 92 percent participation rate vs. 70 percent participation)?
Peer Response Peer Analysis The State includes participation rate in its school quality indicator. School
quality has a weight of 20%-25%, depending on the school, and
participation rate is one of three equally weighted components in it, so
participation rate counts relatively little overall to meaningful annual
differentiation. Furthermore, it can also be compensated for with the other
indicators.
No information is given about how the SEA differentiates its approach
based on the extent of the participation problem identified. The only
relevant statement is that if a school misses its participation rate
(presumably for any subgroup) for two consecutive years it must submit a
plan for meeting participation requirements (p. 102).
Strengths After two consecutive years of not meeting the 95% participation rate,
schools are required to submit a remediation plan, and the SEA is to be
commended for this effort.
Weaknesses There does not appear to be any differentiation in the approach based on any
factors.
As noted previously, inclusion of the participation rate in the school quality
indicator could mask schools or subgroups that are not meeting the 95%
participation requirement.
Did the SEA meet
all requirements? ☐ Yes (# peer reviewer(s))
☒ No (4 peer reviewer(s))
If no, describe the
specific information
or clarification that
an SEA must
provide to fully
meet this
requirement
The SEA needs to differentiate its approach based on the extent of the
participation problem identified.
The SEA needs to demonstrate that there are ramifications for any school
not meeting the 95% participation rate.
A.4.viii: Continued Support for School and Local Educational Agency Improvement (ESEA
Section 1111(d) (3) (A))
A.4.viii.a: Exit Criteria for Comprehensive Support and Improvement Schools (ESEA section 1111(d) (3)
(A) (i) (I))

36
Does the SEA describe its statewide exit criteria for schools identified for comprehensive support and
improvement, which may include how the exit criteria are aligned with the State’s long-term goals
and measurements of interim progress?
Does the SEA’s description include the number of years within which schools are expected to meet
such criteria?
Is the number of years no more than four years?
Do the exit criteria ensure continued progress to improve student academic achievement and school
success in the State (e.g., do the exit criteria improve student outcomes and ensure that a school that
exits no longer meets the criteria under which the school was identified)?
Peer Response Peer Analysis Currently PRDE is both an SEA and sole LEA on the island, although it is
creating a revised structure by which regional LEAs will be created (p. 102).
Comprehensive and targeted schools will exit if they no longer meet the
criteria on which they were identified three years post-identification (p. 103).
PR criteria include 2 years of graduation rate of 67%, two years above initial
entrance criteria, no longer chronically low performing, no longer identified in
the lowest 5% of schools, submission of a sustainability plan of progress
made. Peers questioned whether the plan is in addition to meeting the other
applicable criteria or whether a plan of progress alone is sufficient. This
should be clarified.
The state should clarify the role of the sustainability plan in the exit
criteria and should also present linkages to long-term goals (e.g.,
progress is on par with meeting measurements of interim progress at the
school level.)
Strengths The requirement that exiting schools have a sustainability plan is
commendable and helps to ensure that schools will not be continually re-
identified.
Weaknesses State does not present any linkage to long-term goals (e.g., progress is on par
with meeting measurements of interim progress at the school level.)
Did the SEA meet
all requirements? ☒ Yes (4 peer reviewer(s))
☐ No (# peer reviewer(s))
If no, describe the
specific information
or clarification that
an SEA must
provide to fully meet
this requirement
A.4.viii.b: Exit Criteria for Schools Receiving Additional Targeted Support (ESEA section 1111(d) (3)
(A) (i) (II))
Does the SEA describe its statewide exit criteria for schools receiving additional targeted support
under ESEA section 1111(d) (2) (C), which may include how the exit criteria align with the State’s
long-term goals and measurements of interim progress and the requirement that the goals and
measurements of interim progress take into account the improvement necessary to close statewide
proficiency and graduation rate gaps?

37
Does the SEA’s description include the number of years within which schools are expected to meet
such criteria?
Do the exit criteria ensure continued progress to improve student academic achievement and school
success in the State (e.g., do the exit criteria improve student outcomes for the subgroup or subgroups
that led to the school’s identification and ensure that a school that exits no longer meets the criteria
under which the school was identified)?
Peer Response Peer Analysis The state plan indicates that PRDE uses the same exit criteria for targeted
support schools as it does for comprehensive support schools (p. 104-105) and
the time period is the same (3 years). Graduation rate was included but does
not apply since it does not get a school into TSI.
Peers questioned how the requirement of staying in TSI for three years aligns
with exit criteria of two consecutive years. Peers questioned which two years
of performance can be used to exit. The first two? Only the last two? This
should be clarified.
As in the previous section, peers questioned whether there is follow-up on the
sustainability plan or whether mere submission of the plan constitutes
compliance.
Strengths The requirement that exiting states have a sustainability plan is commendable
and helps to ensure that schools will not be continually re-identified.
Weaknesses Peers questioned how the requirement of staying in TSI for three years aligns
with exit criteria of two consecutive years. Peers questioned which two years
of performance can be used to exit. The first two? Only the last two? This
should be clarified.
As in the previous section, peers questioned whether there is follow-up on the
sustainability plan or whether mere submission of the plan constitutes
compliance.
Did the SEA meet
all requirements? ☒ Yes (3 peer reviewer(s))
☒ No (1 peer reviewer(s))
If no, describe the
specific information
or clarification that
an SEA must
provide to fully meet
this requirement
The state should clarify which two years of performance can be used for a
school to exit. It should also indicate whether there is follow-up on the
sustainability plan or whether mere submission of the plan constitutes
compliance.
A.4.viii.c: More Rigorous Interventions (ESEA section 1111(d) (3) (A) (i) (I))
Does the SEA describe the more rigorous State-determined action required for schools
identified for comprehensive support and improvement that fail to meet the SEA’s exit
criteria within a State-determined number of years, which may include interventions that
address school-level operations, such as changes in school staffing and budgeting or the
school day and year?

38
Peer Response Peer Analysis The PRDE Plan provides an extensive discussion of interventions it will use
for schools that fail to meet exit criteria. These strategies fall under the areas
of comprehensive restructuring (which includes closing schools), engaging
external evaluators, use of partnership schools, and new school improvement
plans. The strategies selected will be not universal, but appropriate for the
unique circumstances and strengths and resources for a particular school (p.
105-106).
Peers note that there are comprehensive changes proposed to the system, and
although the peers commend PRDE for this thorough approach, PRDE might
consider a more targeted approach.
Strengths Using external evaluators and developing a response team are beneficial.
Weaknesses Peers note that there are comprehensive changes proposed to the system, and
although we commend PRDE for this thorough approach, PRDE might
consider a more targeted approach.
Did the SEA meet
all requirements? ☒ Yes (4 peer reviewer(s))
☐ No (# peer reviewer(s))
If no, describe the
specific information
or clarification that
an SEA must
provide to fully meet
this requirement
A.4.viii.d: Resource Allocation Review (ESEA section 1111(d) (3) (A) (ii))
Does the SEA describe how it will periodically review resource allocation to support school
improvement in each LEA in the State serving a significant number or percentage of schools
identified for comprehensive or targeted support and improvement?
Peer Response Peer Analysis PRDE will reserve 7% of Title I funding to distribute to LEAs that have a
significant number or percentage of schools in CSI or TSI status. Through an
annual comprehensive review, PRDE will implement a continuous
improvement process for the various component areas, targeting academic and
non-academic resources to schools and identified areas that can be improved
(p. 108).
Strengths PRDE intends to conduct these reviews annually, so that resources can be
directed to where they are needed in a timely manner.
Quarterly review of funds and work plans will help to ensure that funds are
used where they are most needed in an efficient manner.
Weaknesses N/A
Did the SEA meet
all requirements? ☒ Yes (4 peer reviewer(s))
☐ No (# peer reviewer(s))
If no, describe the
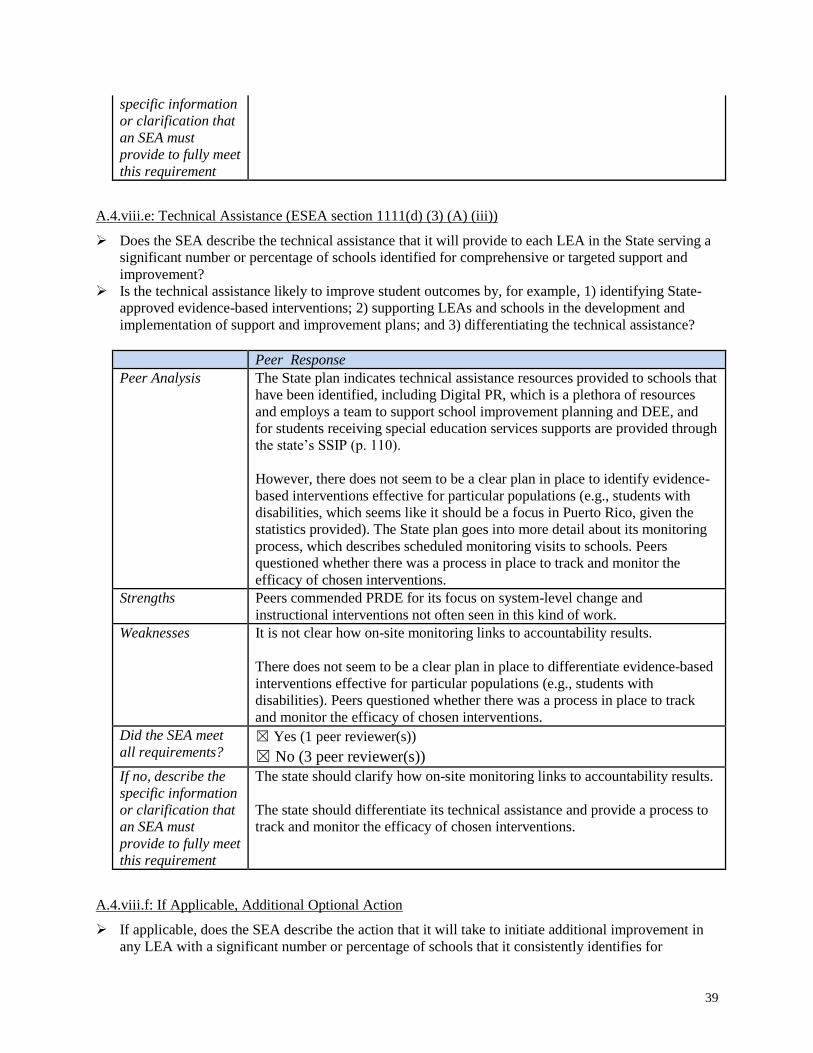
39
specific information
or clarification that
an SEA must
provide to fully meet
this requirement
A.4.viii.e: Technical Assistance (ESEA section 1111(d) (3) (A) (iii))
Does the SEA describe the technical assistance that it will provide to each LEA in the State serving a
significant number or percentage of schools identified for comprehensive or targeted support and
improvement?
Is the technical assistance likely to improve student outcomes by, for example, 1) identifying State-
approved evidence-based interventions; 2) supporting LEAs and schools in the development and
implementation of support and improvement plans; and 3) differentiating the technical assistance?
Peer Response Peer Analysis The State plan indicates technical assistance resources provided to schools that
have been identified, including Digital PR, which is a plethora of resources
and employs a team to support school improvement planning and DEE, and
for students receiving special education services supports are provided through
the state’s SSIP (p. 110).
However, there does not seem to be a clear plan in place to identify evidence-
based interventions effective for particular populations (e.g., students with
disabilities, which seems like it should be a focus in Puerto Rico, given the
statistics provided). The State plan goes into more detail about its monitoring
process, which describes scheduled monitoring visits to schools. Peers
questioned whether there was a process in place to track and monitor the
efficacy of chosen interventions.
Strengths Peers commended PRDE for its focus on system-level change and
instructional interventions not often seen in this kind of work.
Weaknesses It is not clear how on-site monitoring links to accountability results.
There does not seem to be a clear plan in place to differentiate evidence-based
interventions effective for particular populations (e.g., students with
disabilities). Peers questioned whether there was a process in place to track
and monitor the efficacy of chosen interventions.
Did the SEA meet
all requirements? ☒ Yes (1 peer reviewer(s))
☒ No (3 peer reviewer(s))
If no, describe the
specific information
or clarification that
an SEA must
provide to fully meet
this requirement
The state should clarify how on-site monitoring links to accountability results.
The state should differentiate its technical assistance and provide a process to
track and monitor the efficacy of chosen interventions.
A.4.viii.f: If Applicable, Additional Optional Action
If applicable, does the SEA describe the action that it will take to initiate additional improvement in
any LEA with a significant number or percentage of schools that it consistently identifies for

40
comprehensive support and improvement and are not meeting the State’s exit criteria or in any LEA
with a significant number or percentage of schools implementing targeted support and improvement
plans?
Peer Response Peer Analysis The State response to this section appears to be largely a repetition of
information presented in previous sections rather than actual additional
optional action. The language used speaks to PRDE’s intentions and
hypothetical possibilities (e.g., “we will explore the possibility of partnership
schools; we will develop local, effective, and cost-efficient external evaluators
and evaluation systems” (p. 113). If PRDE believes additional optional action
is needed, then peers encourage PRDE to develop a more concrete
implementation plan.
Peers questioned PRDE’s plan to give poorly performing schools more liberty
by being categorized as partnership schools.
Strengths External evaluators may be helpful if recommended changes are required to be
implemented.
Weaknesses Peers questioned PRDE’s plan to give poorly performing schools more liberty
by being categorized as partnership schools.
Did the SEA meet
all requirements? ☒ Yes (2 peer reviewer(s))
☒ No (2 peer reviewer(s))
If no, describe the
specific information
or clarification that
an SEA must
provide to fully meet
this requirement
The State response to this section appears to be largely a repetition of
information presented in previous sections rather than actual additional
optional action. If PRDE believes additional optional action is needed, then
peers encourage PRDE to develop a more concrete implementation plan.
The state should justify its decision to give poorly performing schools more
liberty by categorizing them as partnership schools.
A.5: Disproportionate Rates of Access to Educators (ESEA section 1111(g) (1) (B))
Does the SEA describe the extent, if any that low-income children enrolled in schools assisted under
Title I, Part A are served at disproportionate rates by ineffective, out-of-field, or inexperienced
teachers, which may include the State definition of ineffective, out-of-field, and inexperienced
teachers?
Does the SEA describe the extent, if any, that minority children enrolled in schools assisted under
Title I, Part A are served at disproportionate rates by ineffective, out-of-field, or inexperienced
teachers, which may include the State definition of ineffective, out-of-field, and inexperienced
teachers?

41
Does the SEA describe the measures (e.g., data used to calculate the disproportionate rates) that it will
use to evaluate and publicly report its progress with respect to how low-income and minority children
are not served at disproportionate rates by ineffective, out-of-field, and inexperienced teachers?4
Peer Response
Peer Analysis The State plan outlines a number of challenges that face PRDE in retaining
highly qualified teachers, particularly in certain schools and/or geographic
areas. The SEA lists definitions of ineffective, out-of-field, and inexperienced
teachers (Table 30, p. 121) but there is no narrative discussing the table. PRDE
does not appear to have been evaluating teachers on this basis so far. Therefore
there are no data on the extent to which low-income or minority children are
served disproportionately by such teachers, but they did note that historically
low-income students are served at disproportionate rates by ineffective, out-of-
field, and inexperienced teachers. Once the evaluations described have begun,
data should be provided to this effect.
The State plan also indicates that it reports some teacher quality measures on
its website (p. 124) but it is unclear that these reports show the extent to which
low-income and minority children are or are not served at disproportionate
rates by ineffective, out-of-field, and inexperienced teachers or what the
reporting mechanism will be once evaluations have begun.
The Plan describes strategies to address disproportionate representation (pgs.
115-119), along with a teacher and principal support system.
Peers also noted that PRDE’s definition of inexperienced teachers is teachers
with less than 5 years of experience. The median time in the profession is five
years, so by definition this means that most teachers will be inexperienced.
PRDE could consider the ramifications of this definition.
Peers noted that efforts to ensure equitable access to effective teachers were
not linked to or referenced in the comprehensive systems of support (or in the
accountability system).
Strengths PRDE went beyond the federal requirements, defining its own minority
populations, which differ somewhat from the mainland U.S. The response also
listed a number of good initiatives to address teacher quality.
Weaknesses There are no data on the extent to which low-income or minority children are
served disproportionately by such teachers, but they did note that historically
low-income students are served at disproportionate rates by ineffective, out-of-
field, and inexperienced teachers.
4 Consistent with ESEA section 1111(g)(1)(B), this description should not be construed as requiring a State to develop or
implement a teacher, principal or other school leader evaluation system.
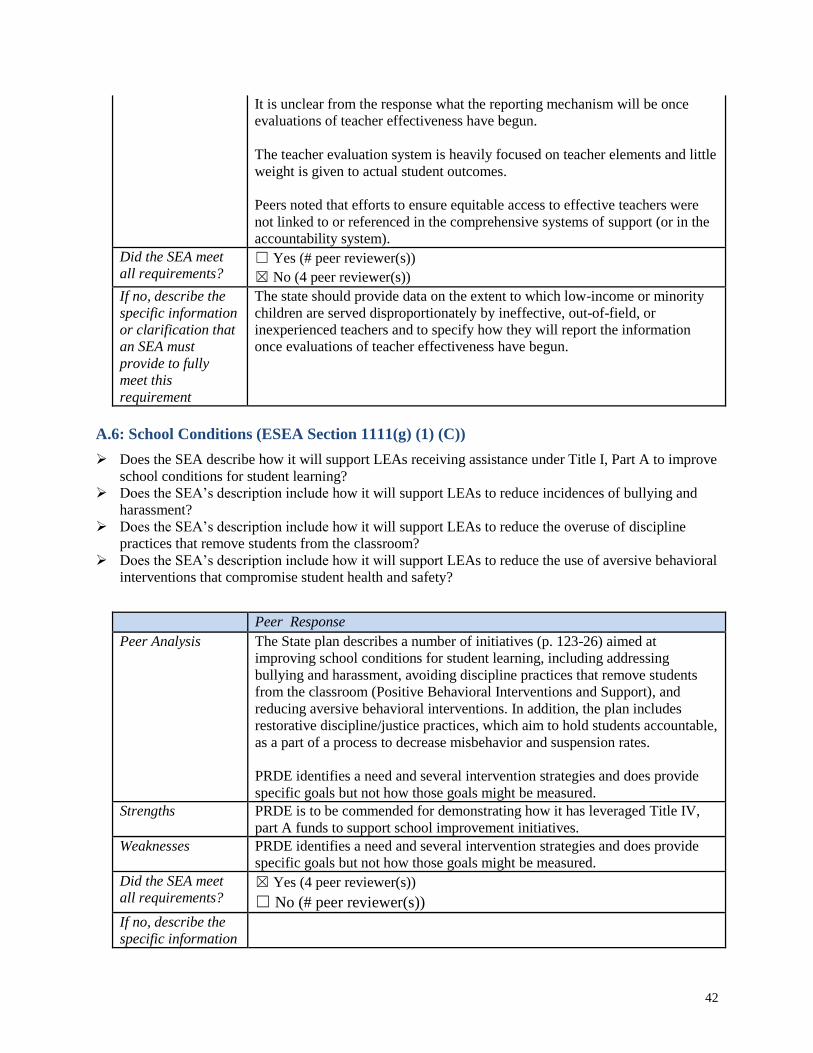
42
It is unclear from the response what the reporting mechanism will be once
evaluations of teacher effectiveness have begun.
The teacher evaluation system is heavily focused on teacher elements and little
weight is given to actual student outcomes.
Peers noted that efforts to ensure equitable access to effective teachers were
not linked to or referenced in the comprehensive systems of support (or in the
accountability system).
Did the SEA meet
all requirements? ☐ Yes (# peer reviewer(s))
☒ No (4 peer reviewer(s))
If no, describe the
specific information
or clarification that
an SEA must
provide to fully
meet this
requirement
The state should provide data on the extent to which low-income or minority
children are served disproportionately by ineffective, out-of-field, or
inexperienced teachers and to specify how they will report the information
once evaluations of teacher effectiveness have begun.
A.6: School Conditions (ESEA Section 1111(g) (1) (C))
Does the SEA describe how it will support LEAs receiving assistance under Title I, Part A to improve
school conditions for student learning? Does the SEA’s description include how it will support LEAs to reduce incidences of bullying and
harassment? Does the SEA’s description include how it will support LEAs to reduce the overuse of discipline
practices that remove students from the classroom? Does the SEA’s description include how it will support LEAs to reduce the use of aversive behavioral
interventions that compromise student health and safety?
Peer Response
Peer Analysis The State plan describes a number of initiatives (p. 123-26) aimed at
improving school conditions for student learning, including addressing
bullying and harassment, avoiding discipline practices that remove students
from the classroom (Positive Behavioral Interventions and Support), and
reducing aversive behavioral interventions. In addition, the plan includes
restorative discipline/justice practices, which aim to hold students accountable,
as a part of a process to decrease misbehavior and suspension rates.
PRDE identifies a need and several intervention strategies and does provide
specific goals but not how those goals might be measured.
Strengths PRDE is to be commended for demonstrating how it has leveraged Title IV,
part A funds to support school improvement initiatives.
Weaknesses PRDE identifies a need and several intervention strategies and does provide
specific goals but not how those goals might be measured.
Did the SEA meet
all requirements? ☒ Yes (4 peer reviewer(s))
☐ No (# peer reviewer(s))
If no, describe the
specific information

43
or clarification that
an SEA must
provide to fully meet
this requirement
A.7: School Transitions (ESEA 1111(g) (1) (D))
Does the SEA describe how it will support LEAs receiving assistance under Title I, Part A in meeting
the needs of students at all levels of schooling (particularly students in the middle grades and high
school)? Does the SEA’s description include how it will work with LEAs to provide effective transitions of
students to middle grades and high school to decrease the risk of students dropping out?
Peer Response Peer Analysis The State plan outlines alternative education opportunities for students not
suited for traditional high schools (in existence since 2013) and systems in
place to identify both middle and high school students who have patterns that
place them at risk of dropping out (p. 127-129). Various levels are included in
this effort: high school graduation; transition to college and career strategies;
middle school transition to high school; and family engagement strategies.
Intervention includes visits to homes to identify specific needs. Peers
wondered whether the home visits are sustainable and asked how it is
determined which students receive a home visit.
Strengths The home visits are potentially useful to determine non-academic factors that
influence student success.
Weaknesses Peers wondered whether the home visits are sustainable and asked how it is
determined which students receive a home visit.
Did the SEA meet
all requirements? ☒ Yes (4 peer reviewer(s))
☐ No (# peer reviewer(s))
If no, describe the
specific information
or clarification that
an SEA must
provide to fully meet
this requirement
SECTION E: TITLE III, PART A, SUBPART 1: ENGLISH LANGUAGE
ACQUISITION AND ENHANCEMENT
E.1: Entrance and Exit Procedures (ESEA section 3113(b) (2))
Does the SEA describe how it will establish and implement, with timely and meaningful consultation
with LEAs representing the geographic diversity of the State, standardized statewide entrance and
exit procedures for English learners, including a description of how, if applicable, a State will ensure
that local input included in the exit procedures, such as teacher input or a portfolio, will be applied
statewide?
Does the SEA’s description include an assurance that all students who may be English learners are
assessed for such status within 30 days of enrollment in a school in the State?

44
Peer Response Peer Analysis The State plan indicates that stakeholders from across the island were
consulted in coming up with the plan regarding entrance and exit procedures.
Diagram 17 (p. 158) outlines entrance procedures that ensure the placement of
Spanish learners within 30 days of enrollment. Exit procedures are outlined on
p. 159-161 and include a passing score of 4 or greater on the LAS Links plus
one other measure (course grades, and a letter from the school director or the
parent.)
One peer expressed concern about the exit criteria (specifically those two
students could exit by fulfilling different requirements [either letters or
grades]).
Strengths N/A
Weaknesses One peer expressed concern about the exit criteria (specifically those two
students could exit by fulfilling different requirements [either letters or
grades]).
Did the SEA meet
all requirements? ☒ Yes (3 peer reviewer(s))
☒ No (1 peer reviewer(s))
If no, describe the
specific information
or clarification that
an SEA must
provide to fully meet
this requirement
The state should describe a process that ensures that all students exit based on
the same criteria.
E.2: SEA Support for English Learner Progress (ESEA section 3113(b) (6))
Does the SEA describe how it will assist eligible entities in meeting the State-designed long-term
goal for English language proficiency established under ESEA section 1111(c)(4)(A)(ii), including
measurements of interim progress towards meeting such goal, based on the State’s English language
proficiency assessment under ESEA section 1111(b)(2)(G)?
Does the SEA describe how it will assist eligible entities in helping to ensure that English learners
meet challenging State academic standards?
Peer Response Peer Analysis The PRDE Plan includes a lengthy discussion (pgs.162-166) on the variety of
strategies it uses to assist schools and LEAs in ensuring all students achieve
Spanish language proficiency. Since PRDE has adopted WIDA Spanish
Language Arts standards, it has access to WIDA resources and strategies for
helping language learners, some of which are included in this section. WIDA
also provides excellent professional development initiatives and although
many of these are aimed at teachers of ELs, one peer wondered whether PRDE
could access them and use them as an additional PD resource for their Spanish
learners’ teachers.
PRDE describes a data-driven, instruction-focused process but peers believe
that greater differentiation of instructional strategies would be beneficial, since

45
all Spanish learners do not need the same things. Co-teaching mentioned in the
plan leverages the Spanish language teachers’ knowledge in the general
classroom.
Strengths PRDE is to be commended on its quality professional development and its
intention to have data-driven, sustained, job-embedded learning opportunities
for teachers. Co-teaching mentioned in the plan leverages the Spanish
language teachers’ knowledge in the general classroom.
Weaknesses It is not clear who is conducting all of the additional professional development
and coaching and with what frequency it occurs.
Did the SEA meet
all requirements? ☒ Yes (4 peer reviewer(s))
☐ No (# peer reviewer(s))
If no, describe the
specific information
or clarification that
an SEA must
provide to fully meet
this requirement
E.3: Monitoring and Technical Assistance (ESEA section 3113(b) (8))
Does the SEA describe how it will monitor the progress of each eligible entity receiving a Title III,
Part A sub grant in helping English learners achieve English language proficiency?
Does the SEA describe the steps it will take to further assist eligible entities if the strategies funded
under Title III, Part A are not effective, such as by providing technical assistance and support on how
to modify such strategies?
Peer Response Peer Analysis The PRDE monitors a representative sample of schools each year to ensure
they are receiving support to meet the needs of Spanish language learners. The
monitoring and assist cycle (Diagram 19, pg.167) provides an overview of the
process PRDE uses with schools and LEAs to assist whenever strategies are
not as effective as planned or needed.
This section in particular seems to lack specificity, and peers wondered to
what extent that has to do with the small number of Spanish learners and the
small number of teachers who are probably specifically trained to work with
them. Since PRDE has adopted WIDA standards for Spanish, peers wondered
whether there are resources they could access, especially for professional
development, to boost their effectiveness overall (before problems arise).
In the plan as it is formulated now, it is unclear how the state intends to link to
its accountability system.
If criteria for visits and elements of evidence of school performance are related
to the accountability system and long-term goals, these links are not well
defined. For SLs the link should be with the SLP indicator as well as SL
content performance and growth.
Strengths N/A

46
Weaknesses If criteria for visits and elements of evidence of school performance are related
to the accountability system and long-term goals, these links are not well
defined. For SLs the link should be with the SLP indicator as well as SL
content performance and growth.
Did the SEA meet
all requirements? ☒ Yes (4 peer reviewer(s))
☐ No (# peer reviewer(s))
If no, describe the
specific information
or clarification that
an SEA must
provide to fully meet
this requirement