
STATE OF THE NORDIC REGION 2018 - DiVA...
65
STATE OF THE NORDIC REGION 2018 THEME 3: ECONOMY
Transcript of STATE OF THE NORDIC REGION 2018 - DiVA...

STATE OF THE NORDIC REGION 2018 THEME 3: ECONOMY

State of the Nordic Region 2018
Theme 3: Economy
Julien Grunfelder, Linus Rispling and Gustaf Norlén (eds.)
Nord 2018:004
ISBN 978-92-893-5478-3 (PRINT)
ISBN 978-92-893-5480-6 (PDF)
ISBN 978-92-893-5479-0 (EPUB)
http://dx.doi.org/10.6027/NORD2018-001
© Nordic Council of Ministers 2018
Layout: Louise Jeppesen and Gitte Wejnold
Linguistic editing: Chris Smith
Cover Photo: unsplash.com
Photos: unsplash.com, except photo on page 22 by Johner Bildbyrå
Nordic co-operation Nordic co-operation is one of the world’s most extensive forms of regional collaboration, involving Denmark, Finland, Iceland, Norway, Sweden, the Faroe Islands, Greenland, and Åland.
Nordic co-operation has firm traditions in politics, the economy, and culture. It plays an important role in European and international collaboration, and aims at creating a strong Nordic community in a strong Europe.
Nordic co-operation seeks to safeguard Nordic and regional interests and principles in the global community. Shared Nordic values help the region solidify its position as one of the world’s most innovative and competitive.
Nordic Council of MinistersNordens HusVed Stranden 18DK-1061 Copenhagen Kwww.norden.org
Download Nordic publications at www.norden.org/nordpub

STATE OF THE NORDIC REGION 2018 THEME 3: ECONOMYJulien Grunfelder, Linus Rispling and Gustaf Norlén (eds.)

4 STATE OF THE NORDIC REGION 2018
COUNTRY CODES FOR FIGURES
AX Åland DK DenmarkFI FinlandFO Faroe IslandsGL GreenlandIS IcelandNO NorwaySE Sweden
EU The European UnionEU28 The 28 European Union member states
OTHERS
b billionBSR Baltic Sea RegionEFTA European Free Trade AgreementEII Eco-Innovation IndexEco-IS Eco-Innovation ScoreboardESPON European Observation Network for Territorial Development and CohesionFDI Foreign Direct InvestmentsFTE Full-time equivalentGDHI Gross disposable household incomeGDP Gross Domestic ProductGRP Gross Regional ProductGWh Gigawatt hourICT Information and communication technologyISCED International Standard Classification of EducationISO International Organization for StandardizationITQ Individual Transferable QuotasKtoe Kilotonnes of oil equivalentLAU Local Administrative UnitLFS Labour Force Surveym millionNACE Statistical classification of economic activities in the European CommunityNCD Non-Communicable DiseasesNGA Next Generation AccessNSI National Statistical InsituteNUTS Nomenclature of Territorial Units for StatisticOECD Organisation for Economic Co-operation and DevelopmentPPP Purchasing Power ParityR&D Research & Development RIS Regional Innovation ScoreboardSCB Statistics SwedenSDG Sustainable Development GoalsSPI Social Progress IndexTWh Terawatt hourUN United NationsUSD United States dollarWWF World Wildlife Fund

Contents
Preface A look behind the scenes of the Nordic model
INTRODUCTION
Chapter 1 Introduction
THEME 1 DEMOGRAPHY
Chapter 2 Population growth and ageing: Past, present and future trends
Chapter 3 Urbanisation: Nordic geographies of urbanisation
Chapter 4 Migration: The wary welcome of newcomers to the Nordic Region
THEME 2 LABOUR FORCE
Chapter 5 Employment: Labour force participation
and productivity of Nordic labour markets
Chapter 6 Towards inclusive Nordic labour markets
Chapter 7 Education in an evolving economic landscape
THEME 3 ECONOMY
Chapter 8 Economic development: The Nordic Region still performing
well in relation to the EU
Chapter 9 The Nordics: Europe’s hotbed of innovation
Chapter 10 Foreign direct investment: Trends and patterns of FDI inflows
THEME 4 FOCUS CHAPTERS
Chapter 11 The rapidly developing Nordic bioeconomy
Chapter 12 Digitalisation for a more inclusive Nordic Region
Chapter 13 Health and welfare: We continue to live longer, but inequalities
in health and wellbeing are increasing
Chapter 14 Culture and arts: An essential area for Nordic co-operation
THEME 5 REGIONAL POTENTIAL INDEX
Chapter 15 Nordregio Regional Potential index: Measuring regional potential
09
11
12
23
24
36
48
61
62
74
88
101
102
118
132
145
146
160
170
184
195
196
COUNTRY CODES FOR FIGURES
AX Åland DK DenmarkFI FinlandFO Faroe IslandsGL GreenlandIS IcelandNO NorwaySE Sweden
EU The European UnionEU28 The 28 European Union member states
OTHERS
b billionBSR Baltic Sea RegionEFTA European Free Trade AgreementEII Eco-Innovation IndexEco-IS Eco-Innovation ScoreboardESPON European Observation Network for Territorial Development and CohesionFDI Foreign Direct InvestmentsFTE Full-time equivalentGDHI Gross disposable household incomeGDP Gross Domestic ProductGRP Gross Regional ProductGWh Gigawatt hourICT Information and communication technologyISCED International Standard Classification of EducationISO International Organization for StandardizationITQ Individual Transferable QuotasKtoe Kilotonnes of oil equivalentLAU Local Administrative UnitLFS Labour Force Surveym millionNACE Statistical classification of economic activities in the European CommunityNCD Non-Communicable DiseasesNGA Next Generation AccessNSI National Statistical InsituteNUTS Nomenclature of Territorial Units for StatisticOECD Organisation for Economic Co-operation and DevelopmentPPP Purchasing Power ParityR&D Research & Development RIS Regional Innovation ScoreboardSCB Statistics SwedenSDG Sustainable Development GoalsSPI Social Progress IndexTWh Terawatt hourUN United NationsUSD United States dollarWWF World Wildlife Fund

6 STATE OF THE NORDIC REGION 2018

Acknowledgements
The concept for the State of the Nordic Region report has been developed by a Nordic working group chaired by Kjell Nilsson, Director of Nordregio, the Nordic Council of Ministers’ research institution for regional development and planning. The Secre-tariat of the Nordic Council of Ministers (NCM) was represented by the following: Geir Oddsson (co- author of chapter 11 on Bioeconomy), Lise Østby, Monika Mörtberg Backlund, Morten Friis Møller (co-author of chapter 12 on Digitalisation), Per Lundgren, Torfi Jóhannesson (co-author of chap-ter 11 on Bioeconomy), Ulla Agerskov and Ulf Andreasson.
Nordregio acted as project owner and was financially responsible through Julien Grunfelder, who together with his colleagues Linus Rispling and Gustaf Norlén coordinated with authors from Nordregio and other NCM institutions. Communi-
cation activities have been overseen by Michael Funch from Nordregio and André H. Jamholt from the Nordic Council of Ministers’ Secretariat.
In addition to the authors from Nordregio and the NCM Secretariat, Lina Broberg, Erik Peurell and Karolina Windell from the Nordic Agency for Cul-tural Policy Analysis should be acknowledged for writing the chapter 14 on Culture and Arts and Nina Rehn-Mendoza from the Nordic Welfare Centre for co-authoring chapter 13 on Health and Welfare. Finally, a number of reviewers have contributed to the development of several chapters: Eva Rytter Sunesen and Tine Jeppesen from Copenhagen Eco-nomics (chapter 10 on Foreign Direct Investments), John Bryden (chapter 11 on Bioeconomy) and Moa Tunström from Nordregio and Eva Englund from the Nordic Council of Ministers’ secretariat (chap-ter 14 on Culture and Arts).

8 STATE OF THE NORDIC REGION 2018
PREFACE 9
PrefaceA LOOK BEHIND THE SCENES OF THE NORDIC MODEL
The Nordic Region as such comprises the 12th larg-est economy in the world, with a population that is growing faster than the EU average, a labour mar-ket that receives global praise and a welfare system that has proved resilient both in times of boom and bust.
But the countries of Denmark, Finland, Iceland, Norway and Sweden along with Greenland, the Faroe Islands and Åland also make out a macro- region of very different internal regions, both geo-graphically and administratively.
It is an area spanning from the endless acres of farmland in Denmark and the vast forests in Swe-den, over the thousand lakes of Finland and the mythical fjords of Norway to the Arctic splendour of Iceland and Greenland. Indeed, even the island com-munities of the Faroe Islands and Åland have their own characteristics, both when it comes to nature and culture, economy and population.
The Nordics often are at the top of the list when the UN or other international bodies rank nations on various parameters. And despite some bumps on the road, we are also rated as some of the most suited to fulfill the aim of the 2030 Agenda to reach the UN Sustainable Development Goals.
In fact, a recent publication from the Nordic Council of Ministers point to the almost unlikely success of the Nordic region in a global perspective. But what is the picture behind the national figures and how do the various regions within the Nordic countries interact, both internally and across bor-ders?
That question is addressed by this publication, the State of the Nordic Region 2018 that gives a unique look behind the scenes of the world’s most integrated region.
The Nordic Council of Ministers has contributed with Nordic statistics for more than 50 years through e.g. the Nordic Statistical Yearbook, and Nordregio – our research institution for regional development and planning – has published regional statistics since its establishment in 1997.
Now we are gearing up even more with a newly established Analytical and Statistical Unit at the Nordic Council of Ministers. In the same spirit, two other Nordic actors – the Nordic Welfare Centre and Nordic Agency for Cultural Policy Analysis – have contributed along with Nordregio to the current edition of the State of the Nordic Region, which is now published as a joint venture for the entire Nor-dic Council of Ministers’ network.
By mapping and documenting information about the state of the Nordic region(s), Nordregio provides a very important knowledge base that empowers local, regional and national authorities in the Nordic countries to make informed decisions. Solid documentation of development trends is a necessary starting point for developing good policy.
At the same time, the State of the Nordic Region 2018 is also a treasure trove of information for the Nordic population at large, as well as a must read for international actors who want to learn about the Nordics and maybe even get inspired by the Nordic model, however differently it may be played out in the various regions and areas.
I hope the many interesting facts, figures and stories embodied in this impressive work will find a large audience and reach high and wide, just as the Nordic countries themselves seem to be doing.
Dagfinn HøybråtenThe Secretary General,Nordic Council of Ministers

10 STATE OF THE NORDIC REGION 2018

PREFACE 11
INTRODUCTION

12 STATE OF THE NORDIC REGION 2018
Chapter 1INTRODUCTION
Background
Since 1981, Nordregio and its predecessor organi-sations have produced the report State of the Nor-dic Region. The report is published every two years, describing ongoing developments over time in the Nordic Region at the municipal and regional levels. This report is the 15th volume in the series “Regional Development in the Nordic countries”, which has supplied policymakers and practitioners with com-prehensive data and analyses on Nordic regional development for many years.
The report is based on the latest statistics on demographic change, labour markets, education, economic development, etc. The analyses are based on a broad range of indicators covering the above- mentioned areas. Since 2016, State of the Nordic Region has also included a Regional Development Potential Index which highlights the strengths and weaknesses of the 74 Nordic regions in relation to one another and identifies the regions with the strongest development potentials. The maps con-tained within the report can also be accessed through Nordregio's online map gallery, and NordMap, an interactive map tool dealing with demographic, labour market and accessibility issues in the Nordic countries.
From 2018, publication of State of the Nordic Region has been directly overseen by the Nordic Council of Ministers centrally. The ambition here is to make the report a flagship project for the Nordic Council of Ministers, enhancing its analytical capac-ity and its ability to collaborate across sectors and institutions. State of the Nordic Region strengthens Nordic identity and community. It is deeply illustra-tive thanks to its rich map material and is therefore suitable for the international marketing of the Nor-dic Region. Thanks to the Nordic Region’s strong performance in international comparisons it can
also contribute to the strengthening of Nordic influ-ence and competitiveness within Europe as well as globally.
Given its focus on scale, State of the Nordic Re-gion builds on the collection and use of Nordic sta-tistics at the local and regional levels. The advantage of following an administrative division is that it co-incides with political responsibilities and thus be-comes more relevant to politicians and other deci-sion-makers for whom access to comparable and reliable statistical information is vital. The report itself should not however be viewed as being politi-cally guided or seen as containing political pointers or recommendations. Maintaining integrity and in-dependence is important for the credibility and, ul-timately, for how the State of the Nordic Region is received and used. When the inclusion of an interna-tional benchmarking approach makes sense, the Nordic-focused material is supplemented with sta-tistics and maps addressing the pan-European level.
The concept of State of the Nordic Region can be both scaled up and down. An example of the former is the ESPON BSR-TeMo project (2014) and its fol-low-up TeMoRi (Rispling & Grunfelder, 2016), con-
Author: Kjell NilssonMap and data: Julien Grunfelder
The Nordic Region consists of Denmark, Finland, Iceland, Norway and Sweden as well as Faroe Islands and Greenland (both part of the Kingdom of Denmark) and Åland (part of the Republic of Finland)

INTRODUCTION 13
ducted by Nordregio on behalf of the Swedish Agency for Economic and Regional Growth, with both pro-jects focusing on the development of a territorial monitoring approach for the Baltic Sea Region (ESPON, 2014; Rispling & Grunfelder, 2016). Exam-ples of scaling down include various assignments that Nordregio has implemented for individual re-gions such as Jämtland, Värmland, and Lappi. The potentials for extending the implementation of State of the Nordic Region are therefore immense if aware-ness increases due to its broader launch profile.
The regional approach
What is the Nordic Region?The Nordic Region consists of Denmark, Finland, Ice-land, Norway and Sweden as well as Faroe Islands and Greenland (both part of the Kingdom of Den-mark) and Åland (part of the Republic of Finland). State of the Nordic Region is based on a suite of sta-tistics covering all Nordic municipalities and adminis-trative regions. It is however worth noting here that several Nordic territories, e.g. Svalbard (Norway), Christiansø (Denmark) and Northeast Greenland National Park (Avannaarsuani Tunumilu Nuna Allan-ngutsaaliugaq), are not part of the national admin-istrative systems. Nevertheless, though not strictly included in the administrative systems, these territo-ries are included in the report where data is available.
State of the Nordic Region displays data using national, regional and municipal administrative divi-sions (this edition according to the 2017 boundaries). Large differences exist both in terms of the size and population of the various administrative units at the regional and municipal levels across the Nordic Re-gion. The four largest municipalities are all Greenlan-dic, with Qaasuitsup being the world’s largest munic-ipality with its 660,000 km² (however, split into two municipalities in 2018). Even the smallest Greenlandic municipality, Kujalleq, at 32,000 km² significantly exceeds the largest Nordic municipalities outside Greenland, i.e. Kiruna and Jokkmokk in northern Swe-den with approximately 20,000 km² each. Excluding Greenland and the Faroe Islands, the average size of a Nordic municipality is 1,065 km². The smallest are less than 10 km² and are either insular municipalities (e.g. Kvitsøy in Norway or Seltjarnarnes near Rey-kjavík) or within the greater capital areas (e.g. Sund-byberg near Stockholm, Frederiksberg surrounded by the municipality of Copenhagen, or Kauniainen sur-rounded by the municipality of Espoo near Helsinki).
The average area of a Nordic region is 17,548 km². The smallest is Oslo (455 km²), followed by two Ice-landic regions, Suðurnes (884 km²) and Hövuðbor-garsvæði (1,106 km²). The largest region is Norrbot-ten in Northern Sweden (106,211 km²), followed by Lappi in Northern Finland (just under 100,000 km²). The average population density of a Nordic region is 66 inhabitants per km² with densities ranging from 1 inhab./km² (Austurland, Vestfirðir, Norður-land vestra, and Norðurland eystra – all in Iceland) to 1,469 inhab./km² (Oslo region). Other high-den-sity regions include the Capital region of Denmark Hovedstaden (706 inhab./km²) and Stockholm (335 inhab./km²).
Among the Nordic countries Denmark, Finland (including Åland) and Sweden, are Member States of the European Union (EU), although only Finland is part of the Eurozone. Iceland and Norway are mem-bers of EFTA (European Free Trade Association) consisting of four countries, which either through EFTA, or bilaterally, have agreements with the EU to participate in its Internal Market. The Faroe Islands and Greenland are not members of any of these eco-nomic cooperation organisations. These differences in supra-national affiliation have an impact on which data that is available for this report. For example, Eurostat, the statistical office of the EU, only pro-vides data for EU, EFTA and EU candidate states, thus excluding the Faroe Islands and Greenland. Whenever possible, data for these regions has been supplemented from other sources.
In the regular register data of Eurostat and the National Statistics Institutes (NSIs), which are the two prime data sources for this report, commuters to neighbouring countries are not included in the Nordic countries. This results in incomplete information (i.e. underestimations) regarding employment, incomes and salaries for regions and municipalities located close to national borders, where a substantial share of the population commutes for work to the neigh-bouring country. Estimates have been produced in some cases and included in this report. In 2016, the Finnish presidency of the Nordic Council of Ministers launched a project to develop statistics on cross-bor-der movement in the Nordic countries. There is how-ever still no up-to-date and no harmonised Nordic cross-border statistical data available, other than that provided by some regional authorities.
Regional and administrative reforms Administrative reforms provide a series of seem-ingly never-ending stories across the Nordic politi-

14 STATE OF THE NORDIC REGION 2018
cal systems. Today, the need for reforms and for the reallocation of tasks between the national, regional and municipal levels can be derived from two major challenges facing the Nordic countries (Harbo, 2015). Firstly, increased pressure on the Nordic welfare sys-tem caused by an ageing population which increases demand for public services while simultaneously shrinking the tax base. Secondly, enlargement of the regions due to widening labour markets caused by changing mobility and commuting patterns moves the functional borders of regions beyond their tra-ditional administrative limitations. Finally, there is a common belief among professionals and decision makers that fewer and larger units are more effi-cient when it comes to service provision and public administration. On the other hand, concerns remain over the merging of administrative units especially at the municipal level due to the increased distance this potentially creates between citizens and the local political authority.
Thus far, the Danish experience provides the best Nordic example of a completed reform process as it is now a decade since the process took place and where the number of municipalities was reduced from 270 to 98. The reform as such was decided by the government, but the practical implementation, i.e. which municipalities should merge, was dele-gated to the municipalities themselves. At the same time, 1 January 2007, the 13 counties (amt) were abolished and replaced by five regions. The reform increased the political weight of the municipalities in society while the importance of the regions de-creased. The regions are led by elected politicians, which reinforces their legitimacy, but they lack the power to tax and the freedom to undertake tasks in addition to their statutory responsibilities. In addi-tion to healthcare, which is the region’s main area of work, they are participating in regional public trans-port companies and in the setting up of growth fo-rums (which decide on the allocation of EU Struc-tural Funds). Hence, there are no official regional development plans except for the capital region, the so-called Finger Plan, which is prepared by the state.
After having failed, for the second time since the turn of the millennium, to try to implement a major reform of the Finnish municipalities, the govern-ment decided on 19 August 2015 that the municipal-ities would no longer be required to investigate the possibility of amalgamation (Sandberg, 2015). The government still wants to encourage municipal mergers, but they should be done on an entirely vol-untary basis. Since 2000, the number of municipal-
ities has voluntarily decreased from 452 to 311, but the size of Finnish municipalities is still on average below 7,000 inhabitants. After failing with their municipal reform, the government decided instead to turn its attention to the regional level and to plan for a comprehensive expansion of the regions’ responsibilities. The plan is for the 18 regions (maakuntaliitto – landskapsförbund) to take over the main health care system from the municipali-ties. They will also assume responsibility for regional development, e.g. business and transport policy. The regions will have a directly elected political leader-ship, but the right to tax will remain with the munic-ipalities which will, however, lose more than half of their budget (Sandberg, 2017).
Åland is not included in the above-mentioned administrative reform of the Finnish regions. There, responsibility for health care is already centralised to the Government of Åland. Åland has 16 munici-palities, some of them with less than 500 inhabit-ants and one, Sottunga municipality, with even less than 100. At the same time as several investigations into voluntary municipal mergers are in progress, the current government is also preparing a bill to be introduced to the Åland Parliament, the Lagtinget, on reducing the number of municipalities to four.
More than 50 years since the last municipal re-form, on 8 June 2017, the Norwegian parliament (Stortinget) decided on an administrative reform that reduces the number of regions (fylkeskom-muner) from 18 to 11 and the number of municipali-ties from 428 to 354. The basic goal of the reform, which should be fully implemented by 1 January 2020, is to transfer resources and responsibilities to local and regional authorities that are more robust than they are currently (Kaldager, 2015). In Norway, the health care system is organised by the state, while the regions are, among other things, responsi-
Concerns remain over the merging of administrative units especially at the municipal level due to the increased distance this potentially creates between citizens and the local political authority

INTRODUCTION 15
Figure 1.1 Urban rural typology of the Nordic regions.

16 STATE OF THE NORDIC REGION 2018
ble for planning, transportation and regional devel-opment. The reform is based on the tasks that the regions currently have, but the government has ap-pointed an expert group to review opportunities to strengthen the regions’ role as developer and their capacity to provide better service to the citizens. The regions are led by directly elected politicians, they have a formal – but in practice no – right to tax and they are free to undertake other than statutory tasks.
In Sweden, the last municipal reform took place in 1974 when the number was reduced from slightly more than 1,000 to 278. The latest merger of Swed-ish municipalities took place in 1977. In the period since, the number has slightly increased to 290 due to the dissipation of existing municipalities. Instead of pushing further municipal mergers, the Swedish government has instead focused on the regions in recent years. In March 2016, a committee presented a new map dividing Sweden into six new major re-gions. The map raised such strong opposition how-ever that the government chose not to proceed with the proposal. When the map turned out to be a distortion of reality, instead of adjusting the map at regional level, the government decided to change the reality at local level. Thus, a new parliamentary committee was set up to develop a strategy for strengthening the municipalities’ capacity, focusing more on cooperation and the allocation and execu-tion of tasks than on administrative boundaries.
In common with the Faroe Islands and Greenland, Iceland has only two administrative levels: national and local. In recent times, Iceland has carried through two large reform processes – in 1993 and again in 2005. On both occasions, consultative referendums were held and on both occasions, a majority voted against the suggested mergers. Despite the out-comes of the referendums the reforms resulted in a reduction in the number of municipalities from 196 in 1993 to 89 in 2006. In recent years, the number of municipalities has been further reduced to 74 on a voluntary basis though the government has, for its part, decided not to push for further aggregations. Instead, the idea of interregional municipal cooper-
ation has been put on the aganda (Traustadóttir, 2015). This idea is aimed at strengthening the local level through the decentralisation of tasks from the government, but without the merging of municipal-ities.
The Faroe Islands and Greenland both sought to reduce the number of municipalities through admin-istrative reform processes. The Faroese reform pro-cess started in 2000 with a new piece of municipal legislation. The government wanted to encourage municipal mergers, but they should be done on an entirely voluntary basis. Since 2000, the number of municipalities has voluntarily decreased from 49 to 29. In a 2012 referendum on municipal mergers, the majority in almost every municipality said no to more mergers.
By far the most radical change took place in Greenland in 2009, where the administrative set up changed from 18 to four municipalities. The idea behind the change which was supported by most of the political parties, was to delegate political deci-sions and economic resources from the central ad-ministration to the municipalities (Hansen, 2015). In reality, only a few administrative areas have at least thus far been transferred, but major areas will be transferred to the municipalities in 2018 and 2019. Widespread dissatisfaction with the new municipal structure especially in Qaasuitsup Kommunia, the largest municipality in the world in terms of square kilometres, led to a political decision to divide Qaasuitsup Kommunia into two municipalities by 1 January 2018.
NUTSclassificationTable 1.1 provides an overview of the administra-tive structure in each country in the Nordic Region. These administrative structures are the basis for the NUTS (Nomenclature of territorial units for sta-tistics) classification, a hierarchical system dividing the states on the European continent into statisti-cal units for research purposes. The NUTS and LAU (Local administrative units) classifications gen-erally follow the existing division but this may dif-fer from country to country. For example, munici-palities are classified as LAU 1 in Denmark but as LAU 2 in the other Nordic countries, and regions of primary importance within the national context as NUTS 2 in Denmark but as NUTS 3 in Finland, Nor-way and Sweden (figure 1.1).
The combined economy of the Nordic countries is the 12th largest in the world

INTRODUCTION 17
Table 1.1 Administrative structures in the Nordic Region on 1 January 2017 (diverging number on 1 January 2018in brackets). 1 Grey frames represent the regional levels presented in most regional maps in this report, comparable from a Nordic perspective, while dark gray frames show the local units represented in the majority of our municipal level maps. Data sources: NSIs, Eurostat, ESPON.
The Nordics in the world
With its 3,425,804 km2, the total area of the Nor-dic Region would form the 7th largest nation in the world. However, uninhabitable icecaps and glaciers comprise about half of this area, mostly in Green-land. In January 2017, the Region had a population of around 27 million people. More relevant is the fact that put together, the Nordic economy is the 12th largest economy in the world (Haagensen et al., 2017).
The power of the Nordic economy was acknowl-edged in the light of its general handling of the economic crisis of 2007–08 (Wooldridge, 2013). What particularly impressed e.g. the journalists at the magazineThe Economist, that published a spe-cial editoin on the Nordics, was the the ability of the Nordic countries to combine a generous tax-funded welfare system with efficient public administration and a competitive business sector.
As such, the locational aspects of the Nordic Region are noted in this edition of the State of the Nordic Region, where relevant and when reliable data is available. In addition, European develop-ments generally and specifically those pertaining to the EU level are also addressed.
EU 2020 targetsThe Europe 2020 strategy was designed in 2010 with the aim of guiding the Member States through the global financial crisis towards recovery. Three drivers of economic growth were identified as cru-cial: (i) smart growth based on knowledge and innovation, (ii) sustainable growth for a more effi-cient, greener and competitive economy, and (iii) inclusive growth capable of delivering employment, social and territorial cohesion.
Targets to be achieved include increasing the employment rate of the population aged 20–64 from 69% to 75%, investing at least 3% of the EU’s GDP on research and development, reducing green-house gas emissions by 20% compared to 1990, in-creasing the share of renewable energy sources in final energy consumption to 20%, reducing the proportion of early school leavers from 15% to below 10%, ensuring that at least 40% of 30–34 years old
The total area of the Nordic Region would form the 7th largest nation the world
Nom
encl
atur
e le
vel
NUTS 0 DK FI IS NO SE SNUTS FO GL
RegionalNUTS 1
NUTS 2
NUTS 3
Manner-Suomi/ Fasta Finland; Ahvenanmaa/ Åland 2
Lands-del 3 SNUTS 1
SNUTS 2
SNUTS 3
SNUTS 4
SNUTS 5
Region 5
Suuralue; Storområde 5
Lands-del 7
Riksom-råde 8
Lands-del 11
Maakunta; Landskap 19
Hag-skýrslu-svæði 2
Fylke 19 (18)
Län 21
LocalLAU 1
LAU 2
Kom-mune 98
Landsvædi 8
Økono- misk region 89
Sýsla 6
Sogn 2165
Kunta; Kommun311
Sveitar-félög 74
Kom-mune 426 (422)
Kom-mune290
Kom-mune 30
Kom-mune 4 (5)

18 STATE OF THE NORDIC REGION 2018
should have completed tertiary or equivalent edu-cation and, finally, reducing poverty by lifting at least 20 million people out of the risk of poverty or social exclusion.
The European Commission expected that each Member State would translate these targets into national targets and trajectories. According to Eu-rostat’s headline indicators scoreboard only one target, i.e. the reduction of greenhouse gas emis-sions, has thus far been reached. Two targets, those regarding early school leavers and tertiary educa-tional attainment, are less than one percentage unit from fulfilment. The target on reduced poverty is also close to being attained, in 2015 18.5 million peo-ple have been lifted out of poverty since 2012. The employment rate had risen to 71% in 2016, but is still less than half way to the target while the R&D in-vestments are even further away from their speci-fied target.
UN Sustainable Development GoalsOn 25 September 2015, the United Nations adopted Resolution A/RES/70/1 which contains 17 Sustain-able Development Goals (SDGs) with 169 targets to be achieved over the next 15 years. The 17 goals (figure 1.2) are:
1. End poverty in all its forms everywhere;2. End hunger, achieve food security and
improved nutrition and promote sustainable agriculture;
3. Ensure healthy lives and promote well-being for all at all ages;
4. Ensure inclusive and quality education for all and promote lifelong learning;
5. Achieve gender equality and empower all women and girls;
6. Ensure access to water and sanitation for all;7. Ensure access to affordable, reliable,
sustainable and modern energy for all;8. Promote inclusive and sustainable economic
growth, employment and decent work for all;9. Build resilient infrastructure, promote
sustainable industrialization and foster innovation;
10. Reduce inequality within and among countries;11. Make cities inclusive, safe, resilient and
sustainable;12. Ensure sustainable consumption and
production patterns;13. Take urgent action to combat climate change
and its impacts;14. Conserve and sustainably use the oceans,
seas and marine resources;15. Sustainably manage forests, combat
desertification, halt and reverse land de- gradation, halt biodiversity loss;
16. Promote just, peaceful and inclusive societies;17. Revitalize the global partnership for a
sustainable developmen.
The Nordic countries are performing well. In an overall assessment of OECD countries, Sweden is given the highest score followed by Denmark, Fin-land and Norway (Sachs et al., 2017). Nevertheless, the Nordic countries continue to face significant
Figure 1.2 Sustainable Development Goals.
INTRODUCTION 19
challenges in terms of reaching all the identified targets by 2030. The Nordic Council of Ministers has chosen goal number 12, to ”ensure sustainable consumption and production patterns”, as its pri-oritised action field. But there are additional goals where a certain amount of effort is still required, such as the greening of the region’s agricultural systems (SDG 2), reducing the high levels of CO2 emissions per capita (SDG 7 and 13, and improving ecosystem conservation (SDG 14 and 15) (Larsen & Alslund-Lanthén, 2017).
Further reading
The report consists of two parts; the first, consist-ing of three thematic areas which have remained constant over the years of this publication (demog-raphy, labour market and economy) and are sum-marised in the Regional Development Potential Index (chapter 15).
Demography (chapters 2–4): Describes and anal-yses population development in terms of natural increase or decline, migration, urbanisation and age distribution.
Labour market (chapters 5–7). Describes and anal-yses employment, unemployment and economical-ly-inactive groups, especially among young people and foreign born, as well as education.
Economy (chapters 8–10): Describes and analyses GDP, income levels, innovation capacity, research and development and foreign direct investment (FDI).
The second part consists of four thematic focus areas. The chosen areas for the 2018 edition are:
Bioeconomy (chapter 11): Focuses on land use and land ownership, forestry, biogas, fisheries and aquaculture.
Digitalisation (chapter 12): Focuses on the broad-band coverage and use of Internet to interact with the public sector.
Health and welfare (chapter 13): Focuses on public health issues and the territorial dimensions of life expectancy and accessibility to healthcare.
Culture and arts (chapter 14): Focuses on newly- produced data at municipal and regional levels on cinemas, libraries and museums.
20 STATE OF THE NORDIC REGION 2018
References
ESPON (2014). ESPON BSR-TeMo. Territorial Monitoring for the Baltic Sea Region. Final Report. Luxembourg: ESPON.
Haagensen, K.M., Agerskov, U. & Vestergaard, T.A. (2017). Nordisk statistik 2017. Köpenhamn: Nordiska ministerrådet. https://doi.org/10.6027/ANP2017-747
Hansen, K.G. (2015). Greenland is rethinking the 2009 merging of municipalities (Nordregio News 2015:3). Stockholm: Nordregio.
Harbo, L.G. (2015). A new wave of reforms sweeping over the Nordic countries (Nordregio News 2015:3). Stockholm: Nordregio.
Kaldager, T. (2015). Norway: steps on the path to reforms (Nordregio News 2015:3). Stockholm: Nordregio.
Larsen, M. & Alslund-Lanthén, E. (2017). Bumps on the road to 2030. Copenhagen: Nordic Council of Ministers. https://doi.org/10.6027/ANP2017-738
Rispling, L. & Grunfelder, J. (Eds.) (2016). Trends, challenges and potentials in the Baltic Sea Region. Stockholm: Swedish Agency for Economic and Regional Growth.
Sachs, J., Schmidt-Traub, G., Kroll, C., Durand-Delacre, C. & Tekoscz, K. (2017). SDG Index and Dashboards Report 2017. New York: Bertelsmann Stiftung and Sustainable Development Solutions Network (SDSN).
Sandberg, S. (2015). Why did the Finnish government reform of 2011 fail? (Nordregio News 2015:3). Nordregio: Stockholm.
Sandberg, S. (2017). Regionen, kommunerna (och staten) i den regionala utvecklingspolitiken. En jämförelse av arbetsfördelning och erfarenheter i Danmark, Finland och Norge. In: Tynelius & Danell (eds.), Regionala tillväxtpolitiska utmaningar – behov av strukturreformer och nya samverkanslösningar. Östersund: Tillväxtanalys, pp. 27–37.
Traustadóttir, S. (2015). Iceland leads the way (Nordregio News 2015:3). Stockholm: Nordregio.
Wooldridge, A. (2013). The Nordic Light. The Economist, special report, 2 February 2013.

PREFACE 21

100 STATE OF THE NORDIC REGION 2018

PREFACE 101
THEME 3
ECONOMYThe Nordic countries are generally performing well above the EU average when it comes to economic development, despite the significant and ongoing impact of the economic crisis.From a macro-regional perspective, the Nordics constitute a very coherent region. Nevertheless, large and economically significant variations remain, at both the regional and national levels. Norway has seen a decline in its economic performance in recent years, whereas Iceland has enjoyed significant growth. In terms of GDP per capita, Iceland and Denmark are rapidly catching up with Norway though on disposable household income, Norway is still well ahead, despite the ongoing challenges posed by the global drop in oil prices. Below the national level, many of the regions and sparsely populated or inland municipal-ities which are already suffering because of their unfavourable position in terms of physical and social ”infrastructures”, are falling further behind the main metropolitan areas. Despite this, and looking beyond the standard economic indicators, the northern parts of Denmark, Finland and Sweden all rank very highly on the more broadly focused European Social Progress Index. In terms of innovation, the Nordic countries also rank highly and in all Nordic regions, the
share of employment in knowledge-intensive sectors is well above the EU28 average. A large share of high tech jobs can even be found in the more peripheral regions. The Nordic countries have maintained a strong position in the field of green solutions, but many of their European competitors are now beginning to catch up. Even so, the Nordics still make up the most innovative region in Europe and almost all regions, with the excep-tion of some areas of Finland, exhibit a stable pattern when it comes to R&D expenditure. The Nordic Region also remains an attractive destination for foreign investment, accounting for 7% of Europe’s total Foreign Direct Invest-ment (FDI) inflows, in a Region having 4% of the European population. Sweden makes up almost half of this total and has by far the highest level of investment activity in the Nordic countries. Greenfield investments have completely dom-inated the scene in some peripheral regions, but the regions with the highest deal values are by far the capital city regions, with Stockholm, as the clear leader. Overall, the Nordic economy is doing well and despite the various challenges linked to ongoing global market changes, the Nordic’s recovery rate after the economic crisis has been impressive.
A varied, but strong economy, performing well in relation to the EU

102 STATE OF THE NORDIC REGION 2018
In this chapter we look at the Nordic Region and its sub-regions from an economic perspective, to inves-tigate some “states and trends” in relation to eco-nomic development, household income levels, and social progress. The primary focus here is on iden-tifying new economic development trends with the first sections and maps devoted to domestic and regional product and the regional distribution and trends in relation to these measures. We look at the period after the economic crisis of 2009, specifically at the trends associated with Norwegian oil mar-kets, stagnation in Finland and the growth of Dan-ish regional economies.
For the first time we have included a measure of municipal disposable household income, by adjusting municipal figures with a measure of purchasing standards. This new map offers an interesting and somewhat fragmented picture of household income across the regions. Finally, the European Social Pro-gress index (only available for Sweden, Finland and Denmark) has been presented as a balance to purely economic indicators. The very top regions are found in Finland (including Åland), northern and central Sweden, and in northern Denmark.
Gross domestic product: Changes in balance between countriesIn economic development terms, the Nordic Region continues to perform well in relation to the EU aver-age. In the aftermath of the economic downturn of 2009–2010, a more heterogeneous economic pat-
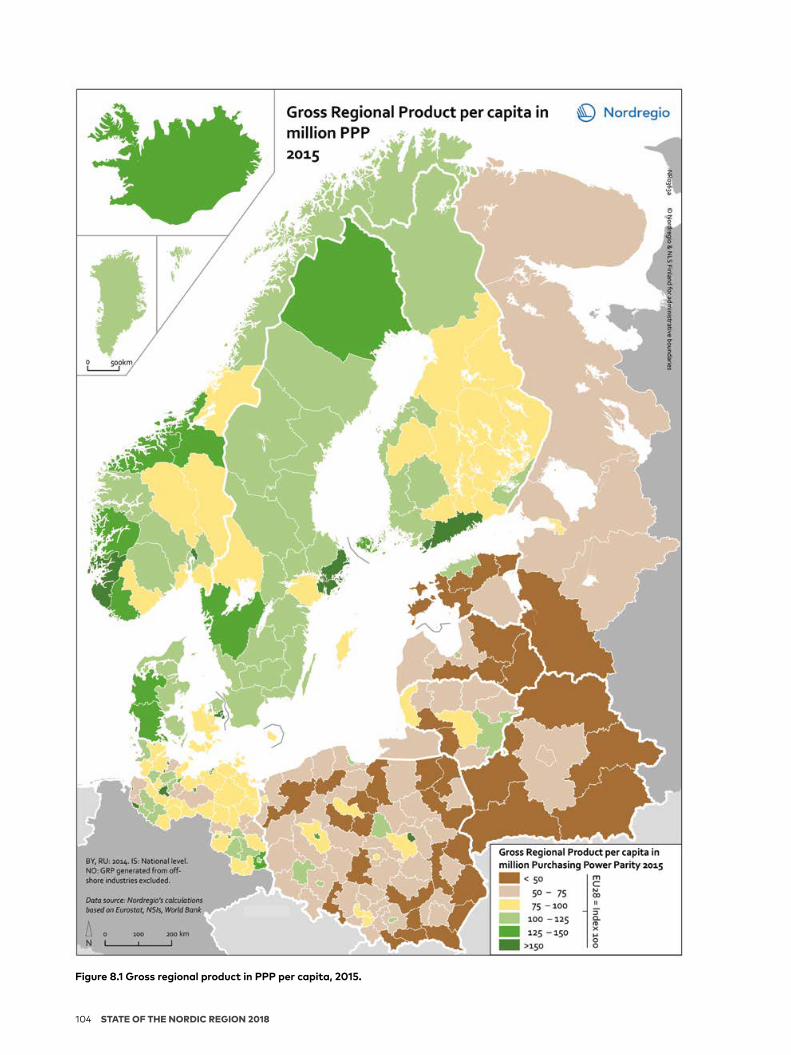
tern reflecting differences in economic trends has however begun to emerge. Denmark and Sweden have continued along a slow but steady growth path, which was further accentuated in Sweden during 2015 and 2016. This is now also starting to have an impact at the regional scale where Kal-mar and Västra Götaland counties have improved their position in the index since 2013, as shown in the previous State of the Nordic Region 2016 report (Grunfelder et al., 2016). Figure 8.1 displays the gross regional product (in PPP) per capita for the year 2015. In Denmark similar trends are discerni-ble where Nordsjælland, Fyn, Sydjylland and Vest-jylland have all advanced. Iceland displays a similar development, though with stronger growth in the last two years, presenting the strongest growth levels in the Nordic countries with rates for some years above 4%. These trends are evident in figure 8.2 which shows the national gross domestic prod-uct per capita during the period 2007–2016. Finland has experienced something of a roller-coaster ride in economic development terms with stagnation in 2011 (after growing for some years) followed by declines in both in 2013 and 2016. The country has not gained momentum since 2011 and although
Chapter 8ECONOMIC DEVELOPMENT The Nordic Region still performing well in relation to the EU
Authors: Gunnar Lindberg and Linus RisplingMaps and data: Linus Rispling, Gustaf Norlén and Gunnar Lindberg
The north of Finland has improved in terms of the GRP (PPP) per capita index since 2013
THEME 3 ECONOMY 103
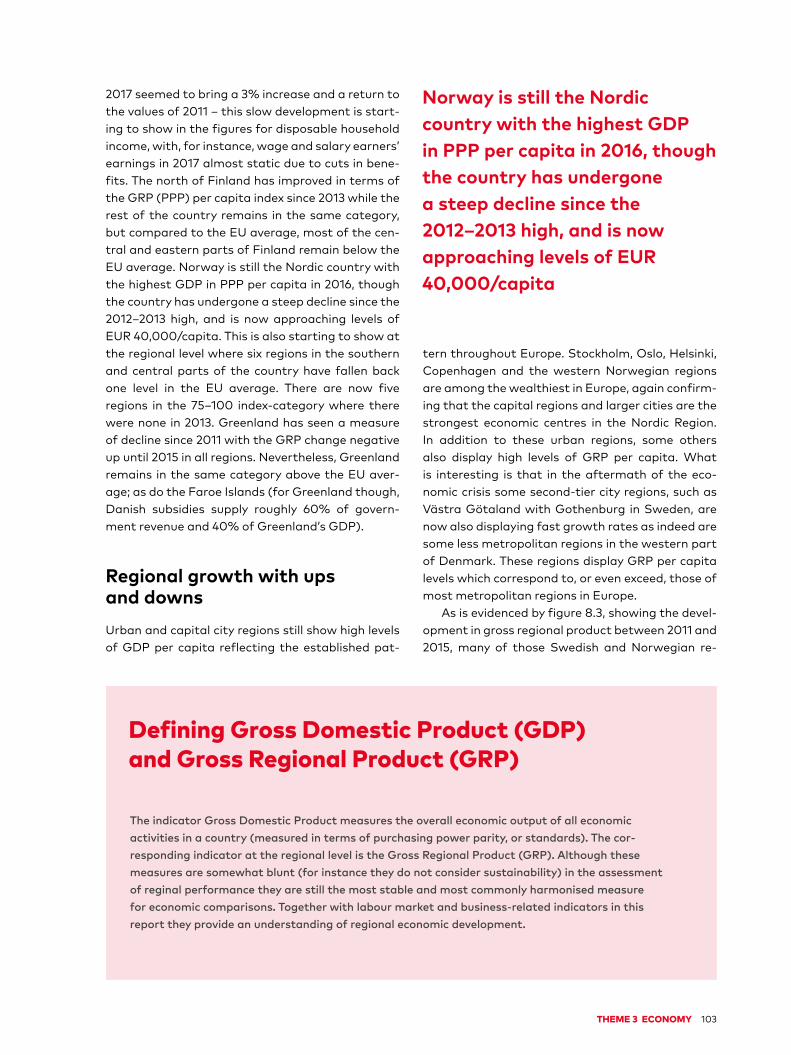
2017 seemed to bring a 3% increase and a return to the values of 2011 – this slow development is start-ing to show in the figures for disposable household income, with, for instance, wage and salary earners’ earnings in 2017 almost static due to cuts in bene-fits. The north of Finland has improved in terms of the GRP (PPP) per capita index since 2013 while the rest of the country remains in the same category, but compared to the EU average, most of the cen-tral and eastern parts of Finland remain below the EU average. Norway is still the Nordic country with the highest GDP in PPP per capita in 2016, though the country has undergone a steep decline since the 2012–2013 high, and is now approaching levels of EUR 40,000/capita. This is also starting to show at the regional level where six regions in the southern and central parts of the country have fallen back one level in the EU average. There are now five regions in the 75–100 index-category where there were none in 2013. Greenland has seen a measure of decline since 2011 with the GRP change negative up until 2015 in all regions. Nevertheless, Greenland remains in the same category above the EU aver-age; as do the Faroe Islands (for Greenland though, Danish subsidies supply roughly 60% of govern-ment revenue and 40% of Greenland’s GDP).
Regional growth with ups and downsUrban and capital city regions still show high levels of GDP per capita reflecting the established pat-
tern throughout Europe. Stockholm, Oslo, Helsinki, Copenhagen and the western Norwegian regions are among the wealthiest in Europe, again confirm-ing that the capital regions and larger cities are the strongest economic centres in the Nordic Region. In addition to these urban regions, some others also display high levels of GRP per capita. What is interesting is that in the aftermath of the eco-nomic crisis some second-tier city regions, such as Västra Götaland with Gothenburg in Sweden, are now also displaying fast growth rates as indeed are some less metropolitan regions in the western part of Denmark. These regions display GRP per capita levels which correspond to, or even exceed, those of most metropolitan regions in Europe.
As is evidenced by figure 8.3, showing the devel-opment in gross regional product between 2011 and 2015, many of those Swedish and Norwegian re-
Norway is still the Nordiccountry with the highest GDP in PPP per capita in 2016, though the country has undergone a steep decline since the 2012–2013 high, and is now approaching levels of EUR 40,000/capita
Defining Gross Domestic Product (GDP) and Gross Regional Product (GRP)
The indicator Gross Domestic Product measures the overall economic output of all economic activities in a country (measured in terms of purchasing power parity, or standards). The cor-responding indicator at the regional level is the Gross Regional Product (GRP). Although these measures are somewhat blunt (for instance they do not consider sustainability) in the assessment of reginal performance they are still the most stable and most commonly harmonised measure for economic comparisons. Together with labour market and business-related indicators in this report they provide an understanding of regional economic development.
104 STATE OF THE NORDIC REGION 2018
Figure 8.1 Gross regional product in PPP per capita, 2015.

THEME 3 ECONOMY 105
gions, which have been so strong in the past, have recently experienced a period of economic down-turn. This is due to various factors such as oil price fluctuations in Norway and the declining price for iron in Sweden – but the result is the same. In Nor-way many northern regions have seen a negative GRP change of around 1–1.5%, while southern and western regions have experienced a negative change of between 1 and 2%. In northern Sweden the result has been even more dramatic with a decline in GRP between 2011 and 2015 of more than 2%, and a de-cline of between 0 and 1% in most of the northern and western regions. Finland has undergone a simi-lar experience, displaying a mosaic pattern of de-cline with only two regions showing a moderate positive trend up to 2015. Only three countries, Ice-land, Sweden and Denmark, show positive aggre-gated levels of GDP change between 2011 and 2015, and only Denmark show growth throughout all re-gions (figure 8.3, country map). During this period, a corridor of positive development running from
western Denmark and greater Copenhagen, via Skåne and Västra Götaland and up to Stockholm seemed to emerge. These are the regions currently displaying the strongest growth and, together with Iceland, they are outperforming even Oslo and Helsinki.
Decline in the northernmost Norwegian and Swedish regions is partly a result of their heavy dependence on a single type of industry. Urban economies are more insulated from the risk posed by reliance on a single sector and are often based on a diverse range of economic activities enabling them to benefit from urban growth. In Norrbotten, mining is the dominant industry while in Northern Norway, oil exploitation and fisheries are the key sectors. For Norway the GRP figures from off-shore activities, including oil and gas extraction, are ex-cluded from our maps at the regional scale. This does not change the situation in respect of sup-porting regional service sectors and their vulnera-bilities to over-specialisation. This is the reason for
Figure 8.2 National Gross domestic product in PPP per capita, 2007–2016.
Data source: Eurostat. Note: NO: GDP generated from offshore industries included.
0
5,000
10,000
15,000
20,000
25,000
30,000
35,000
40,000
45,000
50,000
2007 2008 2009 2010 2011 2012 2013 2014 2015 2016
PPP per capita
EU28 Denmark Finland Sweden NorwayIceland

106 STATE OF THE NORDIC REGION 2018
Figure 8.3 Gross regional product change, 2011–2015.
THEME 3 ECONOMY 107
the dramatic declines in these regions evident in the map for GRP change (figure 8.3). It should be noted however, for the context of development in Norway, that the Norwegian fisheries industry has enjoyed positive growth for a long time. There was a small decline in domestic landings some years ago but the trend is once again positive, with international land-ings increasing as well in recent years. This helps to balance the negative impact of decline in the oil sector. Although the vitality of these sectors induces a high level of economic performance for these re-gions in years of high prices and strong growth, it leaves the regional economies highly vulnerable to sectoral change, something which is usually well beyond the boundaries and the control of Nordic regional actors, both economic and political. In the years after the 2008–09 economic crisis these re-gions were among those that grew the most. In the previous issue of this publication, State of the Nor-dic Region 2016 (ibid.) these regions showed strong economic growth and were among the highest ranked in the regional potential index. In this light one of the most important aspects for regional pol-icy as it relates to these territories is to be able to use and build on this growth potential and years of growth and wealth. Strategies thus need to be put in place to further develop current sectors, as well as to attract new businesses or sectors of activity with high added value. Some of these regions also now face serious challenges in respect of negative demo-graphic trends and labour market developments (see chapters 2–3 and 5–6). As such, it is important that the recent period of downturn is not cemented and further aggravated by migration trends and precipitate changes in economic structures and in-frastructures.
Broadening the scope and comparing the Nordic regions with the rest of the BSR (figure 8.1) it is evi-dent that the so called ”East-West divide” persists as the Nordic Region continues to enjoy much higher levels of GRP per capita than its Eastern (including Northwest Russia) counterparts. The exception to this general pattern is the capital cities which have relatively high GRP levels. The Baltic States as well as Poland also show strong, although fragmented, growth in GRP and are, together with the Nordic countries, consistently out-performing the econo-mies of southern and south-east Europe. Poland grew less in 2016 as compared to the years immedi-ately after the crisis, but the rate has increased again in 2017 and is close to 3%. Estonia is picking up again after 2015 and is growing at 1.5%, Latvia
and Lithuania are both doing a bit better than that at just above 2%. What is interesting however, not least for Eastern Finland, is that the western-Rus-sian regions along the Finnish border have improved their purchasing power and are now one level higher in the index compared to 2013 levels displaying 2015 levels in the interval 50–75 compared to the EU 28 (100) index.
From a European and Baltic Sea perspective, regional disparities across the Nordic regions are clearly less evident compared to what may be found in many larger continental economies (such as France, Germany or Spain). As such, the Nordic Re-gion appears to constitute a more cohesive eco-nomic area (with no regions lagging far behind) than is the case in other parts of Europe – even though this picture becomes a little more nuanced after considering recent developments in Norway and Finland.
Turning to the total levels of GDP and GRP, fig-ure 8.4 shows that the same trends as seen in the per capita graph can be observed at the national level. For Sweden (the largest of the Nordic econo-mies) growth has been strong since 2009 and total GDP (in PPP) is now above 350 billion (Swedish GDP has not seen a negative change since the 2nd quar-ter in 2013 and has grown 0.5–1.5% in general each quarter since). Denmark, Finland and Iceland have been growing since 2009, although at a moderate pace. The first two have shown some signs of slow-ing down in 2016, but if growth continues for Den-mark the country could soon attain a total GDP level (in PPP) close to that of Norway. Norway stagnated in 2012 with per capita figures and total GDP levels declining since 2013. Norway and Sweden were mir-roring each other’s development up until 2012 but since then, the difference has been remarkable.
Urban regions motors for economic growthUrban regions are often highlighted as the primary motors of economic performance, although cave-ats do exist here; the most important being location
The Nordic metropolitan and city-regions remain the key centres of economic production

108 STATE OF THE NORDIC REGION 2018
of headquarters and economic reporting. Despite such caveats, figure 8.5 (Gross Regional Product, in total) clearly shows that the major contributors to national GDP are the city regions of Stockholm, Helsinki, Oslo, Gothenburg, Malmö, and Copenha-gen. Compared to the economic activities gener-ated by BSR city regions of St. Petersburg, War-saw, Hamburg and Berlin the Nordic figures remain small, though the greater Stockholm region clearly stands out. It is however important to note that regional delimitations make a huge difference here
in the ways in which urban regions are represented (Sweden and Finland have large NUTS 3 regions).
Other places that tend to perform well econom-ically are those regions endowed with second-tier cities: Gothenburg in Sweden, Stavanger and Trondheim in Norway and Aalborg in Denmark. This pattern is much less pronounced in Finland for which the Tampere region performs somewhat averagely in both Nordic and European terms. In general, and similarly to the situation pertaining in many other European regions, the Nordic metropolitan and city-regions remain the key centres of economic production.
Urban areas or cities are often centres of eco-nomic growth and development. It is, however, dif-ficult to acquire economic growth data, such as GDP, at the urban level. And although it is widely acknowledged that GDP is an unnatural growth measure at the urban scale, there is still no simple indicator of economic growth that is tailored specif-
Figure 8.4 Gross domestic product (GDP) in million PPP, 2007–2016.
Data source: Eurostat. Note: NO: GDP generated from offshore industries included.
0
50,000
100,000
150,000
200,000
250,000
300,000
350,000
400,000
DK
2007 2008 2009 2010 2011 2012 2013 2015 2016
FI IS NO SE
Million PPP
The Nordic Region’s economic growth is increasingly taking place in the capital regions or in the largest agglomerations

THEME 3 ECONOMY 109
Figure 8.5 Total gross regional product (GRP) in million Purchasing Power Parity (PPP) in 2015.
110 STATE OF THE NORDIC REGION 2018
ically to urban areas. As such, interpretations of GDP per capita should be used with care as they do not adequately account for the commuting flows that occur across regional, urban or suburban boundaries.
Notwithstanding these caveats, the Nordic Re-gion’s economic growth is increasingly taking place in the capital regions or in the largest agglomera-tions. It remains unclear how this will affect the fu-ture structure of regional development, but it may be that many Nordic regions simply cannot keep pace with the larger urban regions in economic de-velopment terms. Moreover, it is often the case that some areas close to the capital regions continue to suffer from disparities in terms of comparative GDP per capita levels. It is clear then that scope remains for developing a regional policy that ensures a more balanced approach to regional development where resources and opportunities are more evenly distrib-uted. The Nordic countries, with their history of co-hesive regional development, have coped rather better than most with the 2008–09 economic crisis, but it will be important to ensure that this develop-ment can continue in the light of the evidence which is unfolding in both Norway and Finland – and to some extent in parts of Sweden also.
Another approach on economic development: Disposable house-hold income Gross disposable household income (GDHI) is the amount of money that all the individuals in the
household sector have available for spending or sav-ing after they have paid direct and indirect taxes and received any direct benefits (OECD, 2017a). GDHI is a concept that is seen to reflect the ‘material wel-fare’ of the household sector.
For the first time in this report we have used mu-nicipal data on disposable household income, to-gether with regional and national data on PPP to create a municipal measure of PPP adjusted dispos-able household income. This gives us the opportunity to compare and discuss the levels of household in-come in a harmonised way across the Nordic munic-ipalities. Time series for the Nordic countries at na-tional level (like those in figure 8.6) have been available for a long time and we know that the figures for Norway have been much higher than those for Sweden, Finland, Denmark and Iceland. Iceland was on the way to catching Norway just before 2009, but has since then, following the global financial and economic crisis and its own banking crisis, dropped back far below the levels reported by Sweden, Den-mark and Finland. Since 2010 Iceland has been im-proving in GDHI and in 2015–2016 this was further accentuated by rapid growth in the tourism sector, as well as the general recovery of the economy.
Disposable household income in PPP: the method and the data
In brief, the method adjusts national (municipal) data on disposable household income for dif-ferences in purchasing power. What we have done is to use information about how PPP is con-structed to find out the appropriate weights for each country. The weight can be found by taking as a point of departure the national (or regional if available) figures for both GDP and GDP in PPP for each country. This information has then been used together with municipal data obtained from each country to provide national accounts about disposable household income.
Denmark stands out as being a very homogenous country in terms of income distribution

THEME 3 ECONOMY 111
The map in figure 8.7 shows disposable household income in PPS in 2014 at the municipal level. The pur-chasing power standard or purchasing power par-ity, abbreviated as PPP, is an artificial currency unit. Theoretically, one PPP can buy the same amount of goods and services in each country. The result of the mapping does not correlate directly with regional product – although there are some simi-lar patterns. For instance, some regions in central Norway display rather low levels of GRP although almost all municipalities display high values for dis-posable household income. Similarly, the northern regions of Finland show higher values of GRP while displaying low levels of household income for all its municipalities. This is true even though Norway has been adjusted more heavily for PPP.
It is striking how lower levels persist in the inland areas of northern and central Sweden (except
Kiruna and Gällivare), in the inner peripheries of Kalmar county and in Värmland. In Norway, munici-palities in Hedmark stand out while the rest of Nor-way shows high values. It is also striking how many of the Norwegian municipalities are found in the highest category populated only by the larger city regions from the other Nordic countries. Denmark stands out as being a very homogenous country in terms of income distribution – with only the island of Bornholm, the area constituting the Storebælt and suburban municipalities having lower levels. Finland has islands of high income municipalities around the larger cities in the south, and some me-dium level municipalities on the west coast – but beyond that the country is in the lower intervals. Åland stands out as it has higher values and a very homogenous distribution. Finally, Iceland displays what was already known from the national data –
0
5,000
10,000
15,000
20,000
25,000
30,000
35,000
40,000
DK
2000 2001 2002 2003 2004 2005 2006 2007 2008 2009 2010 2011 2012 2013 2014 2015 2016
FI IS NO EUSE
US$ (gross adjusted)
Year
Data source: OECD data – national accounts at a glance, & (for IS) NSI. Note: IS, 2015 & 2016: estimates based on NSI data.
Figure 8.6 Disposable household income in US$ (gross adjusted), 2000–2016.
112 STATE OF THE NORDIC REGION 2018
but it nevertheless remains striking that even the values for the urban municipalities are low com-pared to their Nordic counterparts.
EU regional Social Progress Index To provide some balance to the measures presented above – focusing primarily on the economic dimen-sion of development and growth – in this chapter we have also included a measure of social develop-ment. This is the EU Regional Social Progress Index which is developed to show the situation in coun-tries and regions based on indicators which inten-tionally exclude e.g. GDP. This index is a comple-ment to other indexes which are being developed currently to reflect similar dimensions of social situ-ations or development, e.g. the Swedish BRP+ index of quality of life (developed by the Swedish Agency for Economic and Regional Growth) (Reglab & Tillväxtverket, 2016), or the OECD better life index (OECD, 2017b). The index builds on the global Social Progress Index developed by the Social Progress Imperative, a non-profit, non-governmental organ-isation based in Washington, DC (European Com-mission & Social Progress Imperative, 2016). The regional EU-SPI aims to provide consistent, compa-rable and actionable measures in relation to social and environmental issues for the regions in the 28 EU Member States.
The EU Regional Social Progress Index is an ag-gregate index of 50 social and environmental indi-cators capturing three dimensions of social progress and its underlying components. Social progress is defined in this index as the capacity of a society to meet the basic human needs of its citizens, estab-lish the building blocks that allow citizens and com-munities to enhance and sustain the quality of their lives and create the conditions for all individuals to reach their full potential. The definition alludes to three broad elements of social progress, referred to as dimensions: Basic Human Needs, Foundations of Wellbeing, and Opportunity.
The EU Regional Social Progress Index has been designed to complement GDP in such a way that enables its use as a robust, comprehensive and practical measure of inclusive growth. This does not mean that the Index is not related to GDP. Compar-ing SPI to GDP per head, a measure of economic activity, shows a strong and positive link between the two, but many regions lie further from the main/
linear curve showing that at every level of economic performance there are opportunities for more social progress but also the risk of less.
Unfortunately, the index is thus far only available for the Nordic EU countries, i.e. for Denmark, Fin-land and Sweden. Studying the index first from a European perspective (figure 8.8) it is striking, al-though not surprising, that all the Nordic regions perform well. High scores are observed in all catego-ries explained above, and for some dimensions the Nordic regions are the top regions throughout Eu-rope.
At the regional scale the Nordic regions are among the top performers and only really chal-lenged by some Dutch, UK, Austrian and German regions. The very top regions are found in Finland, northern and central Sweden, and in northern Den-mark. Övre Norrland in Sweden is the top region in Europe, closely followed by the Danish capital region Hovedstaden, Helsinki-Uusimaa in Finland, Midtjyl-land in Denmark and Åland.
Concluding remarks
Although Iceland, Finland and Denmark were sig-nificantly impacted by the global financial crisis, the Nordic Region as whole have performed well in relation to the EU over the last decade. In recent years, perhaps the most striking development has taken place in Norway, which has seen an economic decline on the back of stagnation in the oil mar-ket. The only exception to this concerning Norway is disposable household income, for which Norway still outperforms the other Nordic countries. Swe-den has seen continued general growth in GDP in recent years, however during the period 2009–2015 around half of the Swedish regions saw a negative GRP development, signalling an uneven spatial dis-tribution of economic development. Finland, Swe-den and Denmark have average income levels very
At the regional scale the Nordic regions are among the top performers and only really challenged by some Dutch, UK, Austrian and German regions

THEME 3 ECONOMY 113
Figure8.7Disposableaveragehouseholdnetincomeinpurchasingpowerparity(PPP),basedonfinalconsumption,in 2014.

114 STATE OF THE NORDIC REGION 2018
close to each other at the national level, however in the case of Finland and Sweden many munici-palities, typically those located inland, being rather sparsely populated, or with an unfavourable loca-tion in terms of infrastructure, are clearly falling behind the metropolitan areas. Denmark’s munic-ipalities, on the other hand, enjoy a consistently high level of income distribution. Denmark has also recovered particularly strongly after the crisis, dis-playing a rather even income level distribution com-bined with a positive GRP development. As such, it
has taken a distinctly different path compared to that of Finland, where several regions are strug-gling with low GRP. Iceland has recently displayed very strong GDP growth, however the country is still, almost a decade after the onset of the global crisis, struggling with rather low average income levels. Looking beyond the standard economic indi-cators to the European Social Progress index, the northern parts of Denmark, Finland and Sweden all perform at the top-European level.

THEME 3 ECONOMY 115
Figure 8.8 European Social Progress index, 2016.

116 STATE OF THE NORDIC REGION 2018
References
European Commission & Social Progress Imperative. (2016). The EU Regional SPI: A measure of social progress in the EU regions. Methodological paper. (n.p.): European Union. Retrieved from http://ec.europa.eu/regional_policy/en/ information/maps/social_progress
Grunfelder, J., Rispling, L. & Norlén, G. (Eds.) (2016). State of the Nordic Region 2016 (Nordregio Report 2016:1). Stockholm: Nordregio. Retrieved from http://www.nordregio.se/Global/Publications/Publications%202016/State%20of%20the%20Nordic%20Region%202016/sotnr2016-2nd-editon-DIGI.pdf
OECD. (2017a). Household disposable income. Retrieved from https://data.oecd.org/hha/household- disposable-income.htm
OECD. (2017b). OECD Better Life Index. Retrieved from http://www.oecdbetterlifeindex.org/#/11111111111
Reglab & Tillväxtverket. (2016). BRP+. Mätsystem för långsiktig livskvalitet i svenska regioner. (n.p.): Reglab & Tillväxtverket. Retrieved from https://tillvaxtverket.se/download/18.4b31eb1515940493e7ec687b/1484054938717/BRP+%20Koncept%20och%20uppbyggnad%202016.pdf

PREFACE 117

118 STATE OF THE NORDIC REGION 2018
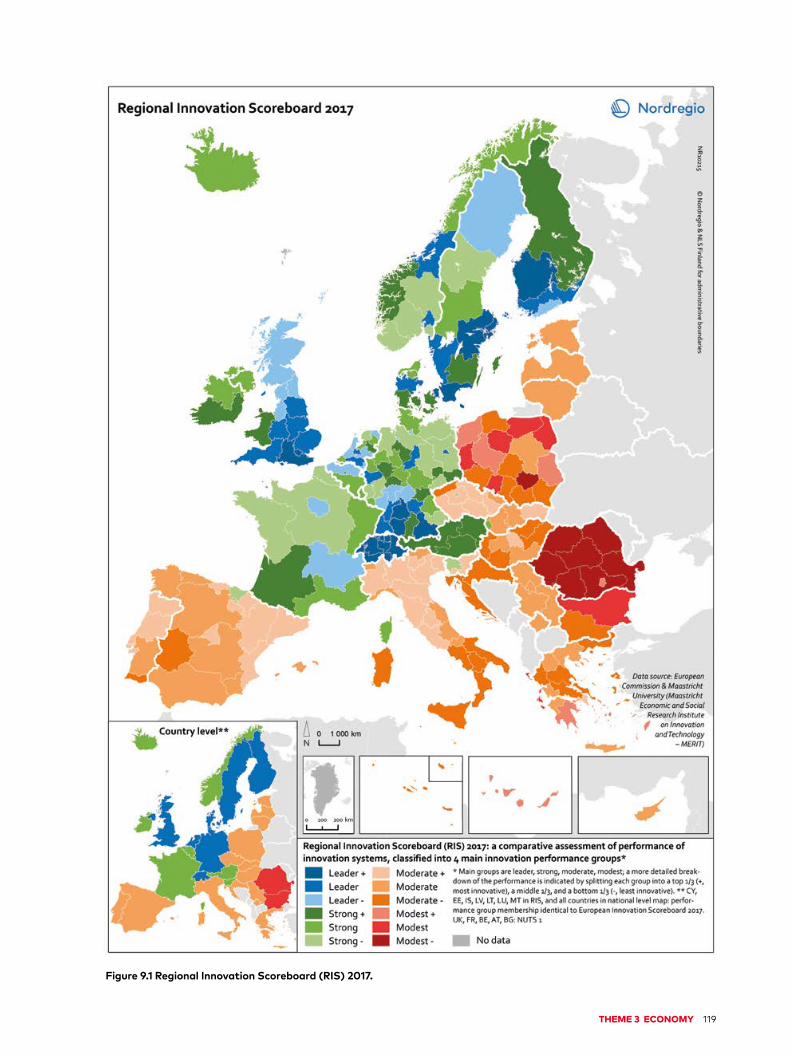
With a long tradition of supporting innovation behind them, the Nordic countries have always been pace-setters when it comes to innovation-based develop-ment, topping the rankings of the most innovative economies in the European Union (EU). According to the Regional Innovation Scoreboard (European Commission, 2017a), Stockholm is the most innova-tive region in the EU, followed by the capital region of Denmark – Hovedstaden. With the relatively early adoption of the green growth agenda, the Nordic countries have become frontrunners in green econ-omy transformation, having obtained a significant competitive advantage in green solutions.
The objective of this chapter is (1) to provide an overview of the innovation performance of the Nor-dic countries in a European context and, (2) to re-view both the status and ongoing changes in Nordic performance on eco-innovation.
Nordic countries are top innovation performersThis section provides a comparative assessment of the innovation performance of the Nordic coun-tries in a European context. Innovation perfor-mance is measured using the Regional Innovation Scoreboard (RIS), which summarises performance across 18 indicators,1 grouped into four main types namely framework conditions, investments, inno-
vation activities and impacts (European Commis-sion, 2017a). Regions are classified into four main innovation performance groups (i.e. leader, strong, moderate and modest performers) with three sub-groups within each performance group (i.e. a top third (+, most innovative); a middle third, and a bottom third (-, least innovative)) to allow for more diversity at the regional level. Figure 9.1 shows the current position of the Nordic regions in relation to their relative performance on the RIS index as com-pared to that of other European regions.
The Nordic countries (Iceland and Norway ex-cepted) together with Switzerland, the Nether-lands, the United Kingdom and Germany top the RIS ranking, demonstrating a high level of innovation performance.
At the NUTS 2 level, all Nordic countries2 are represented by regions of two types i.e. innovation leader and strong innovator. As innovation leaders, Nordic regions perform well on all indicators, dis-
Chapter 9THE NORDICS Europe’s hotbed of innovation
Authors: Iryna Kristensen, Jukka Teräs and Michael KullMaps and data: Linus Rispling and Eeva Turunen
In 2017, Stockholm was the most innovative region in the EU, followed by the capital region of Denmark – Hovedstaden
1 For more detailed information on indicators please see European Commission 2017b, p .6–12.2 Iceland is represented by one region only, as Iceland’s NUTS 2 level equals national level.
THEME 3 ECONOMY 119
Figure 9.1 Regional Innovation Scoreboard (RIS) 2017.

120 STATE OF THE NORDIC REGION 2018
playing a particularly high level of performance in the framework conditions group (e.g. population having completed tertiary education and lifelong learning), innovation activities (e.g. public-private co-publications) and investment (e.g. R&D expendi-tures in the business sector). As of 2017, Stockholm, Östra Mellansverige and Sydsverige (Sweden), Hov-edstaden (Denmark) and Länsi-Suomi (Finland) are rated ”innovation leader +”, the most innovative re-gions in the Nordics. Other Nordic regions are gen-erally strong innovators reporting an innovation performance either well above or close to that of the EU28 average. The exceptions here include some regions in Norway which currently display an innova-tion performance below the EU average but are nevertheless catching up rather quickly with the other Nordic regions. For instance, Sør-Østlandet and Hedmark og Oppland (figure 9.1) scored 98.0 and 93.2, respectively, in 2017, with the EU28 aver-
age being 102.6 (based on an index with the EU28 in 2010 measured as 100). This trend, particularly in respect of Norway, can clearly be seen in the chart (figure 9.2).
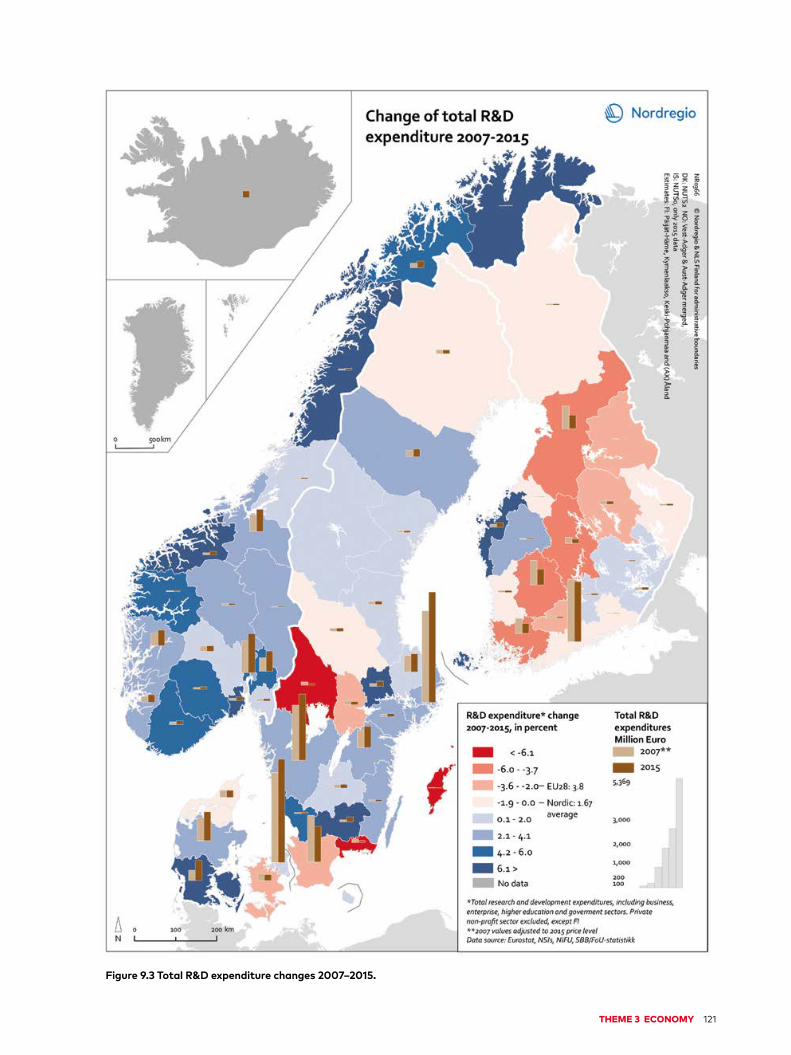
Varying R&D expenditure pat-terns across the Nordic regions High levels of Research and Development (R&D) expenditure are viewed as a vital enabling factor for innovation which is one of the key policy compo-nents of the Europe 2020 Strategy. R&D expendi-tures are also a key element of the UN Sustainable Development Goals, specifically goal 9 “Build resil-ient infrastructure, promote inclusive and sustaina-ble industrialization and foster innovation”. Figure 9.3 illustrates the change in total R&D expendi-ture3 across the Nordic regions during the period
90
100
110
120
130
140
150
DK
2009 2010 2011 2012 2013 2014 2015 2016
FI IS NO EUSE
Index 100=EU28, 2010
Figure 9.2 Nordic relative innovation performance as compared to EU, 2010–2016. Index 100=EU28, 2010.
Data source: European Innovation Scoreboard 2017 Database.
3 Total R&D includes business (i.e. enterprise), higher education and government sectors. The private non-profit sector is excluded from calculations.
THEME 3 ECONOMY 121
Figure 9.3 Total R&D expenditure changes 2007–2015.
122 STATE OF THE NORDIC REGION 2018
2007–2015. The colour of the regions represents a percentage change in total R&D expenditures in the period 2007–2015 while an absolute change is displayed by bar charts (light brown bars for 2007, dark brown for 2015).
At the regional level in Finland, most regions – except for Österbotten, Etelä-Pohjanmaa, Etelä-Savo, Etelä-Karjala and Päijät-Häme – have shown a downward trend in R&D expenditures both in percentage and in real terms. This reflects the chal-lenging fiscal policy and economic conditions expe-rienced in Finland after the global financial crisis in 2008 and the difficulties faced by the ICT sector, where R&D is highly concentrated, as well as the inability of other industries to compensate for the decline of the ICT sector (OECD, 2016). Åland on the other hand has shown a positive trend in R&D ex-penditures, although having very low values in abso-lute numbers for both years. Sweden has experi-enced a dramatic decrease (< -6.1%) in R&D expenditures in Värmland, Blekinge and Gotland which was in large part, if not entirely, caused by the relocation of important R&D facilities/resources (e.g. Ericsson and Stora Enso in Värmland), however in all cases with negative changes from relatively low starting values in 2007. Similarly, some major closures (e.g. AstraZeneca) and redundancy notifi-cations (e.g. Ericsson and Sony) led to substantial cuts in R&D spending in Skåne in 2015, despite the
increasing number of start-ups. For Iceland, availa-ble data for the 2013–2016 period indicates a steady and stable increase in R&D expenditure during these years, which for the business sector can largely be attributed to a gradual increase in the R&D activi-ties of a few major enterprises. All Norwegian re-gions have seen an increase in R&D expenditures during the 2007–2015 period. Furthermore, Nor-way’s total R&D expenditure, in contrast to the other Nordic countries, has also been growing dur-ing the period 2007–2015 in all regions but one (Buskerud) when measured as a percentage of GDP (Turunen, 2017). According to Statistics Finland (2017), R&D expenditure as a part of GDP share has decreased continuously since 2009 from 3.8% to an estimated 2.7% in 2017. Undoubtedly, significant cuts in public sector research funding led to this decline from the top rank in of international com-parisons. In 2015, the Finnish share of public sector spending in respect of the GDP was 0.96% and only topped by Denmark (1.02%) and Iceland (1%). 2016 saw a drop in the R&D share to 0.87% (Statistics Finland, 2016). In the past two years, there has been a noticeable increase in the use of SkatteFUNN tax schemes4 as a source of R&D funding in Norway, contributing significantly to the increase there in total R&D expenditures.
Employment in knowledge- intensive sectors well above the EU28 average
Knowledge-intensive sectors play an essential role in facilitating innovation and economic growth across various sectors as they contribute to the “renewal and growth of other businesses by creat-ing fertile ground for innovations and the diffusion of novel practices” (Kuusisto & Viljamaa, 2004). Figure 9.4 shows employment in the high-technology man-ufacturing and knowledge-intensive service sectors as a share of total employment in Europe in 2016.
All capital cities and other larger cities in the Nordic countries remain strong economic centres
Norway’s total R&D expenditure, in contrast to the other Nordic countries, has also been growing during the period 2007–2015 in all regions but one (Buskerud) when measured as a percentage of GDP
3Total R&D includes business (i.e. enterprise), higher education and government sectors. The private non-profit sector is excluded from calculations. 4 A government programme designed to stimulate research and development (R&D) in Norwegian trade and industry. https://www.skattefunn.no/prognett-skattefunn/About_SkatteFUNN/1247149010684?lang=en

THEME 3 ECONOMY 123
Figure 9.4 Employment in high-technology and knowledge-intensive sectors 2016.

124 STATE OF THE NORDIC REGION 2018
where knowledge-intensive activities are highly con-centrated. Stockholm has the highest share of em-ployment in technology and knowledge-intensive sectors (62.1%) compared to other Nordic regions. This can, in part, be attributed to the high concen-tration of knowledge-intensive services particularly in finance, insurance and real estate. There are, however, some examples of more peripheral regions with high (above the EU28 average of 41.1%) con-centrations of knowledge-intensive jobs such as Övre Norrland (51%) and Mellersta Norrland (52.1%) (Sweden); Nord-Norge (56.4%) and Trøndelag (52.3%) (Norway). The Regional economies of Övre Norrland and Mellersta Norrland are dominated by mining and forestry which make up an important domain of specialisation – however, significant ef-fort has recently been placed on diversifying their economies and promoting knowledge-intensive in-dustries as well as into expanding mining-related actives into knowledge-intensive services i.e. techni-cal and environmental consulting activities (Moritz et al., 2017).
To put the Nordic countries in context, figure 9.4 shows Europe’s regional disparities in the high-tech-nology and knowledge-intensive sectors as a pro-portion of total employment. Apart from the Nordic
countries, high levels of employment in the knowl-edge-intensive sectors are usually observed in Euro-pean capital regions or regions close to capitals or other large cities. Examples here include Zürich (Switzerland) and Berlin (Germany) where the share of employment in technology and knowl-edge-intensive sectors accounts for 54.6% and 54.5% respectively. Other European regions with high shares of employment in the technology and knowledge-intensive sectors include several regions in Southern England and South-Eastern Scotland (the UK); several regions around Liège (Belgium); Groningen, Noord-Holland and Utrecht (the Neth-erlands); Île-de-France and Corse (France); Luxem-bourg; Prague (Czech Republic) and Vienna (Aus-tria).
Stable eco-innovation landscape across the Nordic countriesEco-innovation is currently at the core of EU policies as it is believed to be a key driver in the transition to a green economy, growth generation and new job creation in the years to come (European Commis-sion, 2011). Broadly defined, eco-innovation com-prises ”innovation in pollution control (new, better or cheaper abatement technology), green products, cleaner process technologies, green energy technol-ogy and transport technologies and waste-reduction and handling techniques” (Kemp & Pontoglio, 2011). In this green growth area, the Nordic countries have established themselves as global frontrunners. The global market for green solutions is however rapidly expanding due to the increasing number of Euro-pean countries adopting a green growth agenda. Figure 9.5 provides a comparative overview of the (overall) eco-innovation performance of the Nor-dic countries on the Eco-Innovation Index in 2010 (upper map) and 2016 (bottom map). The Eco-In-novation Scoreboard (Eco-IS) and the Eco-Innova-tion Index (EII) promote a holistic view of economic, environmental and social performance and com-plement other measurement approaches in terms of assessing the innovativeness of the EU coun-tries.5 They summarise performance on 16 indica-tors grouped into five dimensions: eco-innovation
How is eco-innovation performance measured?
A. Eco-Innovation Observatory does not provide an elaborated definition of Eco-Industries; they are broadly defined as a basket of economic activities relevant for this group of industries;
B. Eco-Industries also differ between the various indicators in the EI-Index, because the availability of data currently does not allow us to derive a fully-consistent set of indicators.
5 The Faroe Islands, Greenland, Iceland and Norway are not included in the Eco-Innovation Scoreboard, limiting somewhat our scope of analysis
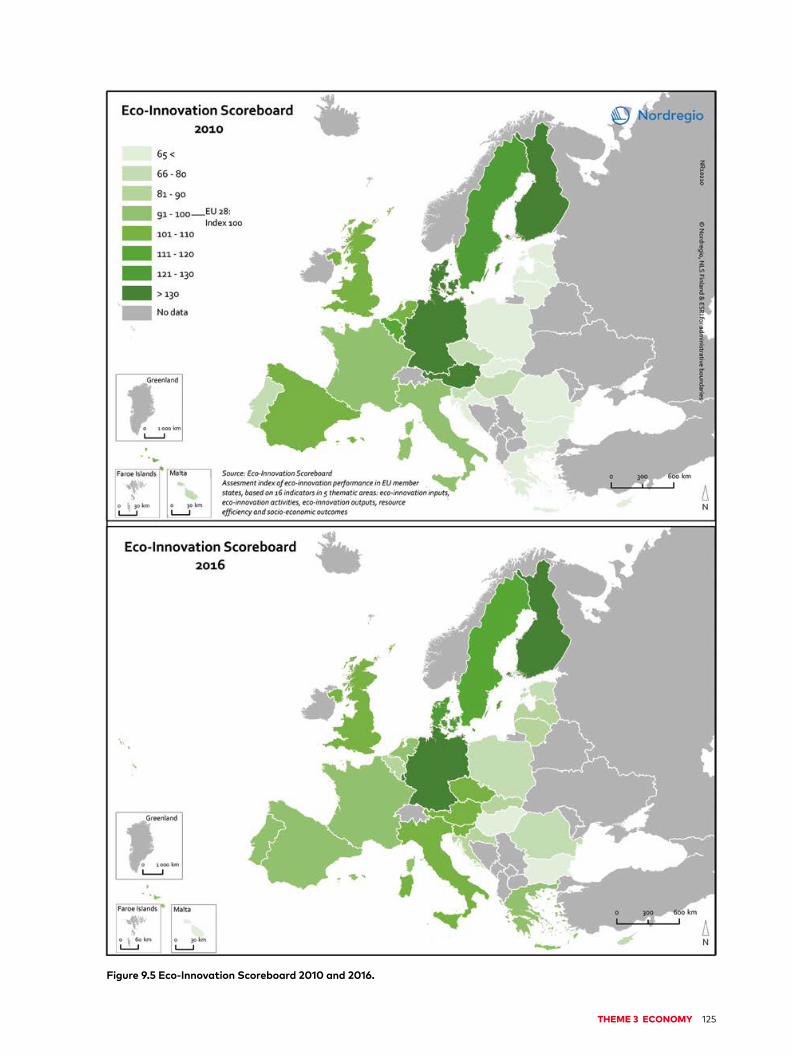
THEME 3 ECONOMY 125
Figure 9.5 Eco-Innovation Scoreboard 2010 and 2016.

126 STATE OF THE NORDIC REGION 2018
inputs, eco-innovation activities, eco-innovation outputs, resource efficiency and socio-economic outcomes (European Commission, 2017c).
As can be seen from the maps in figure 9.5, the eco-innovation landscape has remained stable across the Nordic countries during the period 2010–2016, with no significant change in performance. Finland, Denmark and Sweden remain among the top-performing countries. In 2016, Finland (137) scored highest in terms of the overall eco-innova-tion performance of all the Nordic countries, fol-lowed by Denmark (126) and Sweden (115). In 2010, Denmark (151) was the best Nordic performer on the eco-innovation index (recording a record high score), closely followed by Finland (146) and Sweden (133).
Other EU countries catching up
The high scores of the three Nordic countries, along with Germany and Austria, can partly be explained by the fact that the Eco-Innovation Scoreboard is measured in relation to EU averages. This means that the high-performance scores of these coun-tries are owed, to some degree, to other countries’ rather low performances in 2010, thus bringing down the average score. By 2016, however, other countries had caught up and increased the level of competition with Denmark, Finland, Sweden, Ger-many and Austria.
Placing the Nordic countries in a European con-text, we see that other European countries are catching up but with different intensities. Lithuania (86) and Latvia (85) have significantly improved their positioning on the eco-innovation index in 2016
(compared to 2010 with scores of (51) and (46) re-spectively) as have Slovakia (85), Greece (96) and Portugal (95) compared to their respective scores of 51, 47 and 68, in 2010. In contrast, Austria (104), Belgium (81) and the Netherlands (91) have seen their performance on the index decline as compared to 2010 (recorded as 124, 113 and 117 respectively).
A breakdown into its different components re-veals that the highest levels of Nordic country EII performance occur in relation to eco-innovation in-puts (e.g. R&D personnel and researchers, the value of green early stage investments), eco-innovation outputs (e.g. eco-innovation related patents or sci-entific publications) and eco-innovation activities (e.g. enterprises that introduced an innovation with environmental benefits obtained within the enter-prise). The exception here is Denmark, where perfor-mance on this component was below the EU aver-age. Both Finland and Sweden had low resource efficiency outcomes (e.g. material, water and energy productivity) in 2010 and 2016. This can be explained by the fact that both countries continue to see high levels of material and energy use, caused ”by the comparatively high importance of resource-intensive industries such as wood and paper industries” (Gil-jum et al., 2017). Finally, all three countries score below the EU average on socio-economic outcomes (e.g. exports of products from eco-industries or em-ployment in eco-industries and in the circular econ-omy).
Eco-innovation parks promote green growthThe establishment of eco-industrial parks is one way to promote eco-innovation, resource effi-ciency and the circular economy. They create new and innovative business opportunities and improve ecosystems (UNIDO, 2016). Due to the construction of industrial clusters or networks, often composed of SMEs and with the aim of reducing pressure on the environment, there is both economic and eco-logical value-added for regions and the society. Broadly defined, the term eco-innovation park cov-ers both “eco-industrial parks and eco-innovative areas combining residential and industrial activi-ties” (Frone & Frone, 2017). Leeuwen et al. (2003) describe eco-innovation parks as a “delimited ter-ritory where, by means of cooperation, firms adjust their activities with respect to one another in order to diminish the total environmental impact without
The eco-innovation landscape has remained stable across the Nordic countries during the period 2010–2016, with no significantchangeinper-formance. Finland, Denmark and Sweden remain among the top-performing countries

THEME 3 ECONOMY 127
6 In addition, the Resource Park in Iceland has shown to comply with the criteria set out in the definition of an eco-inno-vation park (figure 9.6). Furthermore, also the Icelandic science park Skagafjörður and Fisk Seafood might comply with the definition of an eco-innovation park, but further investigations regarding the fulfilment of these criteria are needed (Nordic Council of Ministers, 2017; Hörður G. Kristinsson, personal communication, 28 November 2017).
affecting the economic vitality of the individual com-panies”. In other words, innovation parks present an excellent cooperation platform for companies to gain competitive advantage and increase opportu-nities for innovation and access to new markets.
Figure 9.6 presents an overview of European eco-innovation parks, based on data derived from the large-scale international survey on eco-innova-
tion from 2014, analysing the best practices and success factors of 168 eco-innovation parks in 27 countries.6 Unfortunately, no data is available for Norway.
A clear spatial concentration of eco-innovation parks can be observed in the Ruhr area and around Leipzig (Germany), in southern Belgium, south-west-ern and northern Netherlands, western Switzerland,
Kalundborg Symbiosis
Cooperation began in Kalundborg in 1961 when an oil company needed water for its refinery and laid pipes to a nearby lake. A local gypsum production enterprise then connected with the refinery to gain access to its excess gas and soon a power plant and a pharmaceutical com-pany also joined the grid. Over the years, more businesses were linked and in 1989, the term “industrial symbiosis” was first used to describe the collaboration. The main resources being exchanged are water in various forms, energy and waste or by-products. The companies feed each other’s resource needs while lowering costs and resource consumption, thereby strength-ening their CSR profile, sparing nature and protecting the groundwater (Johnsen et al., 2015; Mikkola et al., 2016).
Eco-industrial park of Rantasalmi
Compared to Kalundborg, a park evolving and transforming over time, Rantasalmi eco-in-dustrial park is an example of an intentionally planned park set up in a new area and around already existing operations (Saiku, 2006). Rantasalmi, the first planned eco-industrial park in Finland, is mainly formed around small mechanical wood processing companies including Rantasalmi Oy, one of the biggest log house manufacturers in Finland (ibid). The economic activities of those companies active in the park include wood processing and drying, carpentry, transport, blade maintenance, real estate and food. According to Saikku (2006) the objectives of the companies engaged in the park are to increase material and energy efficiency and to reduce the amount of waste sent to landfills and released through environmental emissions.

128 STATE OF THE NORDIC REGION 2018
Figure 9.6 European Eco-innovation parks 2014.
THEME 3 ECONOMY 129
along the “arch” stretching from Turin via Pisa to Udine in North-East Italy, around Barcelona as well as around some national borders in the industrial-ised parts of north-West Europe namely Germa-ny-Netherlands-Belgium-France and Switzerland.
Eco-innovation parks differ in many respects, for instance regarding energy and material flows (e.g. waste heat, steam, power; wood chips, bark, ash, pulping chemicals), number and size of companies involved and jobs created, public sector involvement and finally, in terms of (the drivers behind) their evolution. The latter means that some parks evolved and expanded around a few economic activities and companies (e.g. saw mills) to include further activi-ties (e.g. pulp mills, power plants etc.), while others were intentionally planned and put into operation. The info box included in this chapter discusses in brief the emergence and focus of two different Nor-dic eco-innovation parks.
Concluding remarks
The Global Innovation Index 2017 lists Sweden, Denmark and Finland in the top ten most innova-tive countries globally (Cornell University, INSEAD, and WIPO 2017). Indeed, on the Global Cleantech Innovation Index 2014, Finland ranks second best globally while Sweden and Denmark are fourth and fifth respectively (WWF and Global Cleantech Group 2014). Furthermore, as already noted in this chapter and confirmed by the RIS 2017, the Nordic Region has maintained its strong position in inter-national rankings with respect to the promotion of a high level of innovation performance. The major-ity of Nordic regions are categorised as innovation leaders and strong innovators with Stockholm,
Östra Mellansverige and Sydsverige (Sweden), the capital region of Denmark, Hovedstaden and Län-si-Suomi (Finland) emerging as the most innova-tive regions in the Nordics, as for 2017.
Over the period 2009–2015, all Nordic countries exhibit a relatively stable pattern as regards R&D expenditure although there are some regional vari-ations. Only the Finnish regions show a significant downturn in this respect, primarily as a result of the slow post-2008 recovery from the financial crisis.
In all Nordic regions, the share of employment in knowledge-intensive sectors is well above the EU28 average. Although, all capital cities (especially Stockholm) and larger cities in the Nordic countries remain strong economic centres where knowl-edge-intensive activities are highly concentrated, a large share of technology and knowledge-intensive jobs can also be found in more peripheral regions e.g. Norrbotten in Sweden.
Finally, the Nordic countries have maintained their strong positions in the field of green solutions though many of their European competitors are now beginning to catch up. According to the Eco-In-novation Scoreboard, the overall eco-innovation landscape has remained rather stable across the Nordic countries over the period 2010–2016; whereas the positioning of many other European countries (e.g. Lithuania, Latvia, Greece, Portugal) on the in-dex has significantly improved in recent years. The presence of eco-innovation parks facilitates eco-in-novation and industrial symbiosis as well as improv-ing ecosystems and enabling new and innovative business opportunities. The spatial dispersion of eco-innovation parks in the Nordic countries indi-cates that a strong research base and a critical mass are the determining factors in locational terms.
130 STATE OF THE NORDIC REGION 2018
References
Cornell University, INSEAD, and WIPO. (2017). The Global Innova-tion Index 2017: Innovation Feeding the World. Ithaca, Fontaineb-leau, and Geneva: Cornell University, INSEAD, and WIPO.
ECO-INNOVERA. (2014). International survey on eco-innovation parks. Learning from experiences on the spatial dimension of eco-innovation. Bern: Federal Office for the Environment FOEN and the ERA-NET ECO-INNOVERA. Retrieved from https://www.bafu.admin.ch/dam/bafu/en/ dokumente/innovation/uw-umwelt-wissen/internationale_studieueberoeko-innovationspaerkekurzfassung.pdf.download.pdf/international_surveyoneco-innovationparks.pdf
European Commission. (2011). Innovation for a sustainable Future – The Eco-Innovation Action Plan (Eco-AP). COM (2011) 899 final. Brussels: European Commission. Retrieved from http://eur-lex.europa.eu/legal-content/EN/TXT/PDF/?uri=CELEX:52011DC0899&from=EN
European Commission. (2017a). Regional Innovation Scoreboard 2017. (n.p.): European Union. https://doi.org/10.2873/593800
European Commission. (2017b). Regional Innovation Scoreboard 2017. Methodology report. (n.p.): European Union. Retrieved from http://ec.europa.eu/docsroom/documents/23986
European Commission. (2017c). The eco-innovation scoreboard and the eco-innovation index. Retrieved from https://ec.europa.eu/environment/ecoap/ scoreboard_en
Frone, F. D., & Frone, S. (2017). Eco-Innovation Park promoting the green economy in Romania. Scientific Papers Series Manage-ment, Economic Engineering in Agriculture and Rural Development, 17(2), 111–120.
Giljum, S., Lieber, M., & Doranova, A. (2017). EU Eco-Innovation Index 2016. EIO Brief. Brussels: European Commission. Retrieved from https://ec.europa.eu/environment/ecoap/sites/ecoap_stayconnected/files/eio_brief_eco-innovation_index_2016_final.pdf
Johnsen, H. G. I., Berlina, A., Lindberg, G., Mikkola, N., Smed Olsen, L., & Teräs, J. (2015). The potential of industrial symbiosis as a key driver of green growth in Nordic regions (Nordregio report, 2015:1). Stockholm: Nordregio. Retrieved from http://www.nordregio.se/Global/Publications/Publications%202015/R2015_1.pdf
Kemp, R., & Pontoglio, S. (2011). The innovation effects of environ-mental policy instruments — A typical case of the blind men and the elephant? Ecological Economics, 72, 28–36.
Kristinsson, Hörður G. (2017, 28 November). Personal communi-cation.
Kuusisto, J., & Viljamaa, A. (2004). Knowledge-Intensive Business Services and Co-production of Knowledge – the Role of Public Sector? Frontiers of E-Business Research 2004, 282–298. Retrieved from http://citeseerx.ist.psu.edu/viewdoc/download?-doi=10.1.1.516.9605&rep=rep1&type=pdf
Leeuwen, van G. M., Vermeulen, J. V. W., & Glasbergen, P. (2003). Planning Eco-Industrial parks: an analysis of Dutch planning methods. Bus. Strat. Env. 12, 147–162. Retrieved from https://dspace.library.uu.nl/bitstream/ handle/1874/23605/glasbergen_03_planningecoindustrialparks.pdf?sequence=1
Mikkola, N., Randall, L., & Hagberg, A. (Eds.). (2016). Green Growth in Nordic regions. 50 ways to make it happen. Stockholm: Nordregio. Retrieved from http://www.nordregio.se/Global/Green%20growth%20in%20Nordic%20regions%2050/ NordicGreenGrowth-pages.pdf
Moritz, T., Ejdemo, T., Söderholm, P., & Wårell, L. (2017). The local employment impacts of mining: an econometric analysis of job multipliers in northern Sweden. Mineral Economics, 30(1), 53–65. https://doi.org/10.1007/s13563-017-0103-1
Nordic Council of Ministers. (2017). Nordic Bioeconomy. 25 cases for sustainable change. Copenhagen: Nordic Council of Ministers. https://doi.org/10.6027/ANP2016-782
OECD. (2016). Economic Surveys: Finland Overview. (n.p.): OECD. Retrieved from https://www.oecd.org/eco/surveys/ Overview-OECD-Finland-2016.pdf
Saikku, L. (2006). Eco-Industrial Parks - A background report for the eco-industrial park project at Rantasalmi. (Publications of regional council of Etelä-Savo, 71:2006). Mikkeli: Regional Council of Etelä-Savo. Retrieved from http://www.mv.helsinki.fi/home/lsaikku/ publications/Julkaisu,%20englanti.pdf
Statistics Finland. (2016). Tutkimus- ja kehittämisrahoitus valtion talousarviossa 2016. Retrieved from http://tilastokeskus.fi/til/tkker/2016/tkker_2016_2016-02-25_kat_001_fi.html
Statistics Finland. (2017). Contraction of research and develop-ment expenditure slowed down. Retrieved from http://www.stat.fi/til/tkke/2016/tkke_2016_ 2017-10-26_tie_001_en.html
Turunen, E. (2017). [R&D intensity: Total R and D expenditure (GERD) as a share of GDP, percentage change between 2007 and 2015 (first and last year), in percent]. Unpublished raw data.
UNIDO. (2016). Eco-Industrial Park: creating sharing prosperity and safeguarding the environment. Retrieved from https://www.unido.org/news/eco-industri-al-parks-creating-shared-prosperity-and-safeguarding- environment
WWF and Global Cleantech Group. (2014). The Global Clean-tech Innovation Index 2014. Nurturing Tomorrow’s Transforma-tive Entrepreneurs. (n.p.): WWF and Global Cleantech Group. Retrieved from https://www.cleantech.com/wp-content/uploads/2014/08/Global_Cleantech_Innov_Index_2014.pdf

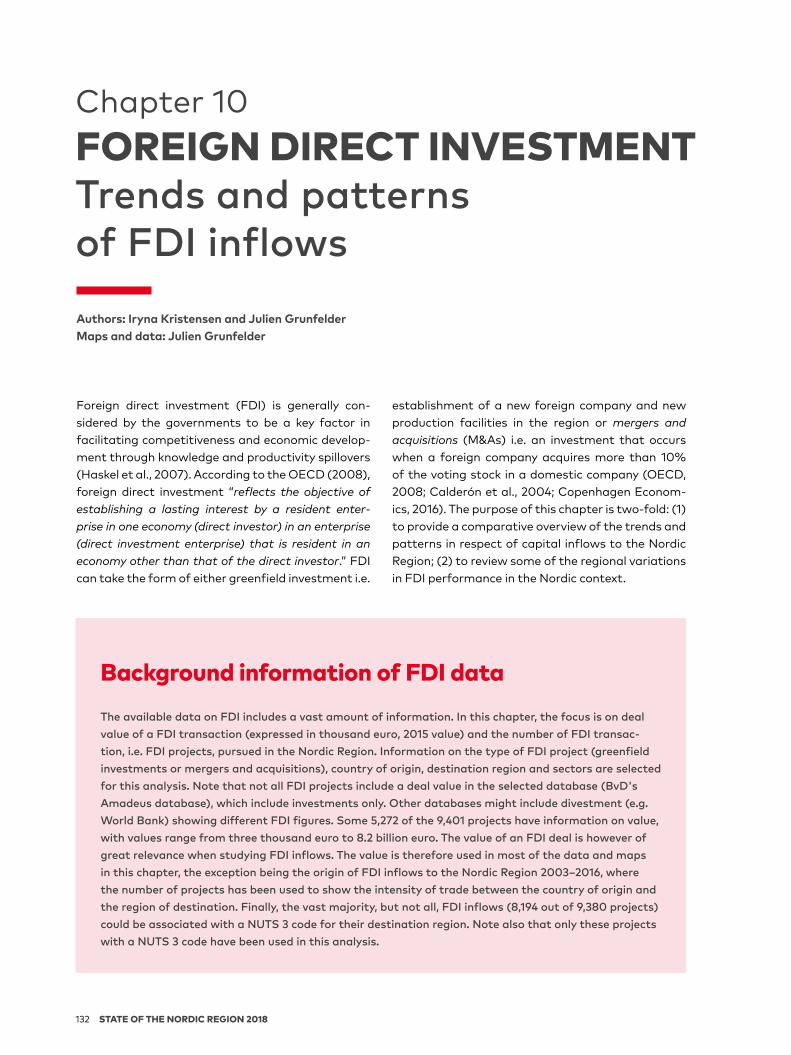
132 STATE OF THE NORDIC REGION 2018
Foreign direct investment (FDI) is generally con-sidered by the governments to be a key factor in facilitating competitiveness and economic develop-ment through knowledge and productivity spillovers (Haskel et al., 2007). According to the OECD (2008), foreign direct investment “reflects the objective of establishing a lasting interest by a resident enter-prise in one economy (direct investor) in an enterprise (direct investment enterprise) that is resident in an economy other than that of the direct investor.” FDI can take the form of either greenfield investment i.e.
establishment of a new foreign company and new production facilities in the region or mergers and acquisitions (M&As) i.e. an investment that occurs when a foreign company acquires more than 10% of the voting stock in a domestic company (OECD, 2008; Calderón et al., 2004; Copenhagen Econom-ics, 2016). The purpose of this chapter is two-fold: (1) to provide a comparative overview of the trends and patterns in respect of capital inflows to the Nordic Region; (2) to review some of the regional variations in FDI performance in the Nordic context.
Chapter 10FOREIGN DIRECT INVESTMENTTrends and patterns of FDI inflowsAuthors: Iryna Kristensen and Julien GrunfelderMaps and data: Julien Grunfelder
Background information of FDI data
The available data on FDI includes a vast amount of information. In this chapter, the focus is on deal value of a FDI transaction (expressed in thousand euro, 2015 value) and the number of FDI transac-tion, i.e. FDI projects, pursued in the Nordic Region. Information on the type of FDI project (greenfield investments or mergers and acquisitions), country of origin, destination region and sectors are selected for this analysis. Note that not all FDI projects include a deal value in the selected database (BvD's Amadeus database), which include investments only. Other databases might include divestment (e.g. World Bank) showing different FDI figures. Some 5,272 of the 9,401 projects have information on value, with values range from three thousand euro to 8.2 billion euro. The value of an FDI deal is however of great relevance when studying FDI inflows. The value is therefore used in most of the data and maps in this chapter, the exception being the origin of FDI inflows to the Nordic Region 2003–2016, where the number of projects has been used to show the intensity of trade between the country of origin and the region of destination. Finally, the vast majority, but not all, FDI inflows (8,194 out of 9,380 projects) could be associated with a NUTS 3 code for their destination region. Note also that only these projects with a NUTS 3 code have been used in this analysis.
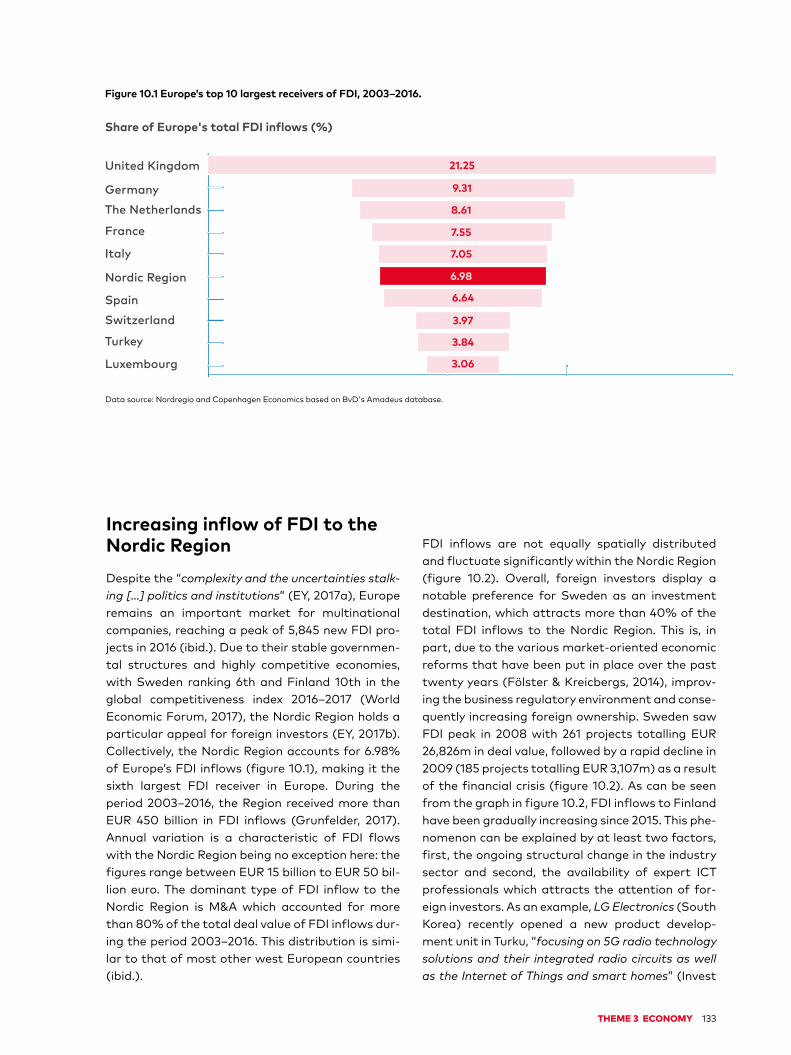
THEME 3 ECONOMY 133
Increasing inflow of FDI to the Nordic RegionDespite the “complexity and the uncertainties stalk-ing […] politics and institutions” (EY, 2017a), Europe remains an important market for multinational companies, reaching a peak of 5,845 new FDI pro-jects in 2016 (ibid.). Due to their stable governmen-tal structures and highly competitive economies, with Sweden ranking 6th and Finland 10th in the global competitiveness index 2016–2017 (World Economic Forum, 2017), the Nordic Region holds a particular appeal for foreign investors (EY, 2017b). Collectively, the Nordic Region accounts for 6.98% of Europe’s FDI inflows (figure 10.1), making it the sixth largest FDI receiver in Europe. During the period 2003–2016, the Region received more than EUR 450 billion in FDI inflows (Grunfelder, 2017). Annual variation is a characteristic of FDI flows with the Nordic Region being no exception here: the figures range between EUR 15 billion to EUR 50 bil-lion euro. The dominant type of FDI inflow to the Nordic Region is M&A which accounted for more than 80% of the total deal value of FDI inflows dur-ing the period 2003–2016. This distribution is simi-lar to that of most other west European countries (ibid.).
FDI inflows are not equally spatially distributed and fluctuate significantly within the Nordic Region (figure 10.2). Overall, foreign investors display a notable preference for Sweden as an investment destination, which attracts more than 40% of the total FDI inflows to the Nordic Region. This is, in part, due to the various market-oriented economic reforms that have been put in place over the past twenty years (Fölster & Kreicbergs, 2014), improv-ing the business regulatory environment and conse-quently increasing foreign ownership. Sweden saw FDI peak in 2008 with 261 projects totalling EUR 26,826m in deal value, followed by a rapid decline in 2009 (185 projects totalling EUR 3,107m) as a result of the financial crisis (figure 10.2). As can be seen from the graph in figure 10.2, FDI inflows to Finland have been gradually increasing since 2015. This phe-nomenon can be explained by at least two factors, first, the ongoing structural change in the industry sector and second, the availability of expert ICT professionals which attracts the attention of for-eign investors. As an example, LG Electronics (South Korea) recently opened a new product develop-ment unit in Turku, “focusing on 5G radio technology solutions and their integrated radio circuits as well as the Internet of Things and smart homes” (Invest
United Kingdom
GermanyThe Netherlands
France
Italy
Nordic Region
SpainSwitzerland
Turkey
Luxembourg
Share of Europe's total FDI in�lows (%)
21.25
9.31
8.61
7.55
7.05
6.98
6.64
3.97
3.84
3.06
Figure 10.1 Europe’s top 10 largest receivers of FDI, 2003–2016.
Data source: Nordregio and Copenhagen Economics based on BvD's Amadeus database.

134 STATE OF THE NORDIC REGION 2018
As for 2016, an upward trend continues for the Nordic Region, Norway excepted
in Finland, 2015). It is however interesting to note that although Iceland does not emerge as a top choice for investors (about 2%), there was a rapid rise of FDI in 2012 (7 projects in total with a deal value as high as EUR 4,009m). The acquisition of Reykjavík's deCODE by a major US pharmaceutical giant Amgen (Hirschler, 2012, 10 December) was the most likely reason for this high figure.
As for 2016, an upward trend continues for the Nordic Region, Norway excepted. The decline in oil prices and growing uncertainty about the industry’s future, has prompted a gradual shift in investment activities with new sectors growing in importance in
Norway. In the period 2013–2016 for example, the amount of FDI inflows to transportation and stor-age, wholesale and retail trade, information and communication (except for 2014), ICT, professional, scientific and technical activities have noticeably increased. In contrast, manufacturing, mining and quarrying as well as finance and insurance suffered a decline in FDI inflows over this period (Grunfelder, 2017).
Gradual increase of extra- European inflowsThe largest volumes of FDI inflows to the Nordic Region originate from a small number of countries (figure 10.3). This figure includes the fifteen coun-tries with the highest deal value of FDI inflows to the Nordic Region in the period 2003 to 2016. A
0
5,000
10,000
15,000
20,000
25,000
30,000
DK
2003 2004 2005 2006 2007 2008 2009 2010 2011 2012 2013 2014 2015 2016
FI GL IS NOFO SE
In million euro
Figure10.2AnnualFDIinflowstotheNordicRegionduringtheperiod2003–2016.
Data source: Nordregio and Copenhagen Economics based on BvD's Amadeus database.
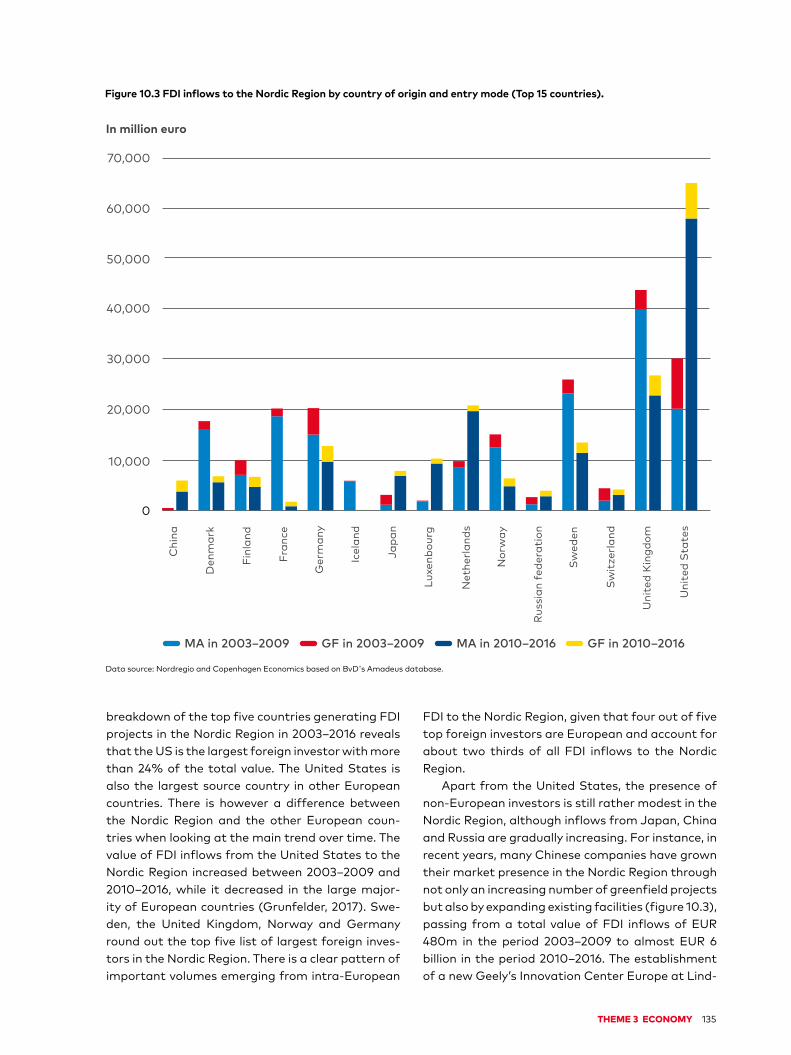
THEME 3 ECONOMY 135
breakdown of the top five countries generating FDI projects in the Nordic Region in 2003–2016 reveals that the US is the largest foreign investor with more than 24% of the total value. The United States is also the largest source country in other European countries. There is however a difference between the Nordic Region and the other European coun-tries when looking at the main trend over time. The value of FDI inflows from the United States to the Nordic Region increased between 2003–2009 and 2010–2016, while it decreased in the large major-ity of European countries (Grunfelder, 2017). Swe-den, the United Kingdom, Norway and Germany round out the top five list of largest foreign inves-tors in the Nordic Region. There is a clear pattern of important volumes emerging from intra-European
FDI to the Nordic Region, given that four out of five top foreign investors are European and account for about two thirds of all FDI inflows to the Nordic Region.
Apart from the United States, the presence of non-European investors is still rather modest in the Nordic Region, although inflows from Japan, China and Russia are gradually increasing. For instance, in recent years, many Chinese companies have grown their market presence in the Nordic Region through not only an increasing number of greenfield projects but also by expanding existing facilities (figure 10.3), passing from a total value of FDI inflows of EUR 480m in the period 2003–2009 to almost EUR 6 billion in the period 2010–2016. The establishment of a new Geely’s Innovation Center Europe at Lind-
Figure10.3FDIinflowstotheNordicRegionbycountryoforiginandentrymode(Top15countries).
Data source: Nordregio and Copenhagen Economics based on BvD's Amadeus database.
In million euro
0
10,000
20,000
30,000
40,000
50,000
60,000
70,000
MA in 2003–2009 GF in 2003–2009 MA in 2010–2016 GF in 2010–2016
Chi
na
Den
mar
k
Fran
ce
Ger
man
y
Icel
and
Japa
n
Luxe
nbou
rg
Net
herla
nds
Nor
way
Russ
ian
fede
rati
on
Sw
eden
Sw
itze
rland
Uni
ted
Kin
gdom
Uni
ted
Stat
es
Finl
and

136 STATE OF THE NORDIC REGION 2018
holmen Science Park in Gothenburg, with plans to employ approximately 200 full-time engineers from Sweden and China, is one such example of expan-sion (since the acquisition of Volvo Cars by Geely Automobile – the Chinese multinational automotive manufacturing company – in 2010). Similarly, Japa-nese investments in the Nordic Region are steadily increasing, with their FDI inflows more than dou-bling between 2003–2009 and 2010–2016, with the largest investments coming to the manufacturing sector in Sweden and Denmark; transportation and storage in Denmark; IT in Finland and mining and quarrying in Norway (Grunfelder, 2017).
High level of FDI activity between the Nordic countriesFDI inflows examined by country of origin (fig-ure 10.4), reveal an interesting pattern in terms of intra-Nordic investment inflows, confirming the assumption that proximity, both in terms of geo-graphical distance, and in terms of rules, regulation and business culture is an important driver of FDI. These elements “reduce the risk and cost of invest-ing in a particular country and […] tend to make a country more attractive” (Copenhagen Economics, 2016).
A breakdown at the regional level reveals that 55 out of the 74 Nordic regions received the largest number of FDI projects from a region located in another Nordic country. The largest share of these intra-Nordic flows originates from Sweden (35 re-gions in total), particularly in the manufacturing sector as well as the ICT sector in Norway. This is not surprising as Norway is one of Sweden’s major trade partners, both in terms of total exports and imports (Business Sweden, 2016). The largest share of FDI projects from Finland are attracted to Sweden’s highly competitive international manufacturing in-dustry. Denmark is the main source country of FDI inflows in both Greenland (mostly in the transpor-tation and storage and business services sectors) and the Faroe Islands (mostly manufacturing and finance and insurance activities sectors).
Eighteen Nordic regions have their largest source country in terms of project located outside the Nor-dic Region, i.e. other European and extra-European countries. FDI inflows from other European coun-tries are the highest in terms of projects in six Nordic regions, most of these regions can be characterised by their relative remoteness and strong industrial
profile. Finally, two extra-European countries, namely the United States and Canada, are the larg-est source country in twelve Nordic regions, that are either capital city regions with a strong and diversi-fied service sector or peripheral industrial regions. It is worth noting here that a map highlighting FDI inflows in terms of deal value rather than number of projects would have shown a stronger position for the US in the Nordic Region, since US-based FDI flows tend to be fewer in number but higher in mon-etary value than Nordic-based ones (Grunfelder, 2017).
High FDI intensity in urban regionsLarge capital city regions tend to be the main ben-eficiaries of FDI inflows and this pattern is also observed in the Nordic Region (figure 10.5). The share of FDI inflows to Nordic capital city regions corresponds to 63% of the total value of FDI inflows to the Nordic Region and 54% of all pro-jects (Grunfelder, 2017). Stockholm region emerges as the clear leader with a total deal value of EUR 110,000m. This can be explained by its already strong competitive position in terms of ICT and the high concentration of regional headquarters within the financial services sector (Stockholm Business region and Øresundsinstituttet, 2015). The Danish capital region attracted about half of Stockholm Region’s deal value – EUR 53,804m followed by Hel-sinki (EUR 45,000m), Skåne (EUR 30,000m), and Oslo (EUR 29,100m). The total deal value for Rey-kjavík is rather modest – at around EUR 2,000m, and is comparable to regions such as Dalarna and Jönköping (Sweden), Sør-Trøndelag (Norway) and Lappi (Finland). All Nordic regions have witnessed an increase in FDI inflows during the period 2003–2016, except for the Suðurland and Norðurland Vestra regions in Iceland.
Large urban regions tend to attract more FDI
55 out of the 74 Nordic regions received the largest number of FDI projects from a region located in another Nordic country
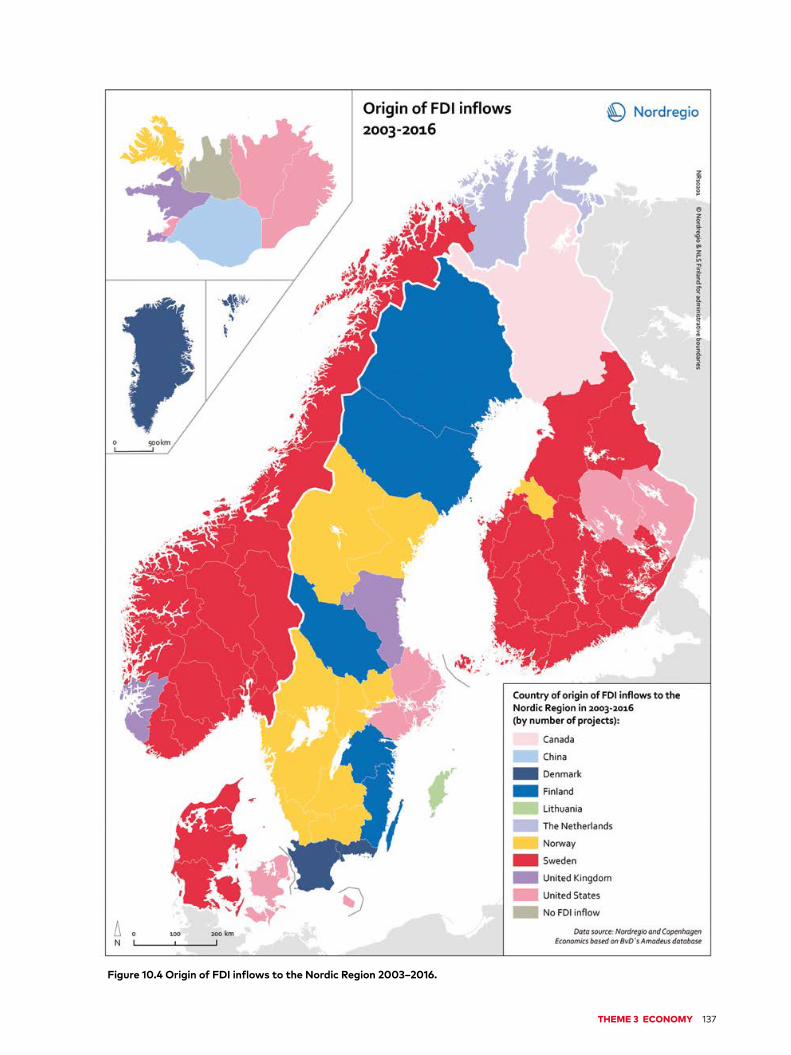
THEME 3 ECONOMY 137
Figure10.4OriginofFDIinflowstotheNordicRegion2003–2016.

138 STATE OF THE NORDIC REGION 2018
than peripheral rural regions. Analysis only of the number of projects and their associated deal value does not however allow us to accurately determine the importance of FDI inflows for the regional econ-omy. FDI intensity, an index of the value of FDI in-flows divided by the gross regional product, does however aid us here in respect of the importance of FDI inflows within a regional economy. The index helps us to compare the performance of the Nordic regions in attracting FDI inflows by taking the size of the regional economy into account. A high inten-sity result also reflects the fact that a regional economy is more resilient, thanks to the diversity of investors. Regions that have succeeded in attract-ing a large volume of FDI relative to their size have a high FDI intensity score. Stockholm Region again scores highest with an index value of 1269 (figure 10.5). Large Nordic urban or capital city regions such as Skåne (896), the Danish capital region Hovedsta-den (841), Oslo (838), Uppsala (793) and Helsinki (777) also possess reasonably high scores on the FDI intensity index (Grunfelder, 2017). Accordingly, the lowest index value can be found in more rural and peripheral contexts such as Keski-Pohjanmaa (Fin-land), Finnmark and Oppland (Norway) and Green-land. Several remote and rural regions with relatively low volumes of FDI inflows do however have quite high FDI intensity index values, i.e. above 250. This is the case in Lappi in Finland, Dalarna and Blekinge in Sweden, Syddanmark and Sjælland in Denmark and Telemark and Aust-Agder in Norway, among others. These regions have in common an important share of FDI inflows in the manufacturing and/or the min-ing and quarrying sectors; sectors that typically attract international investors.
The importance of greenfield investments in remote regionsGreenfield investments and mergers and acqui-sitions are fundamentally different forms of FDI, implying that their effect on host economies dif-fers substantially. Consensus does however exist around the notion that the short-term effect should be greater when a foreign company’s pen-etration occurs through greenfield investment. The value of FDI inflows to the Nordic Region in the form of greenfield investment is shown in figure 10.6. The size of the circles is proportional to the value of the greenfield investment while the colour of the circle indicates the status between the peri-
ods 2003–2009 and 2010–2016: blue indicates an increase in deal value in the second period (>60% of the inflows of 2003–2016 took place in 2010–2016), yellow indicates a stable value in inflows between the two periods (40–60% of the inflows of 2003–2016 took place in 2010–2016), while red indicates a decrease over time between the two periods (<40% of the inflows of 2003–2016 took place in 2010–2016). All administrative regions except for Finnmark, Sogn og Fjordane and Oppland (Nor-way) and Keski-Pohjanmaa (Finland) attracted FDI inflows in the form of greenfield investment during the period 2003–2016.
Examined by regions with the largest share of greenfield investment during the period 2003–2016, the administrative regions of Helsinki (EUR 9,402m), Stockholm (EUR 7,896m) and Copenhagen (EUR 6,601m) emerge as Nordic leaders in attracting this form of foreign investment. Due to their innova-tion-based economies and booming start-up scenes, both Västra Götaland and Skåne (Sweden) have also performed exceptionally well in attracting greenfield investment securing deal value totals of EUR 4,809m and EUR 2,175m respectively. Similarly, some peripheral and rural regions in Denmark, Fin-land and Sweden have also attracted a substantial amount of greenfield investment (above EUR 1,000m in deal value terms) namely Dalarna (EUR 1,815m), Lappi (EUR 1,799m), Midtjylland (EUR 1,532m), Syddanmark (EUR 1,340m), Kymenlaakso (EUR 1,102m) and Norrbotten (EUR 1,010m). The dominance of greenfield capital in these regions is partially explained by their regional industrial struc-tures and easy access to raw materials as well as by the recent transformations in traditional, re-source-based industries which has opened a world of new possibilities for foreign investors.
As shown in figure 10.6, the share of greenfield investment in total FDI inflows has varied between zero and 100% in the Nordic regions over the period
TheshareofFDIinflowsto Nordic capital city regions corresponds to 63% of the totalvalueofFDIinflowsto the Nordic Region and 54% of all projects
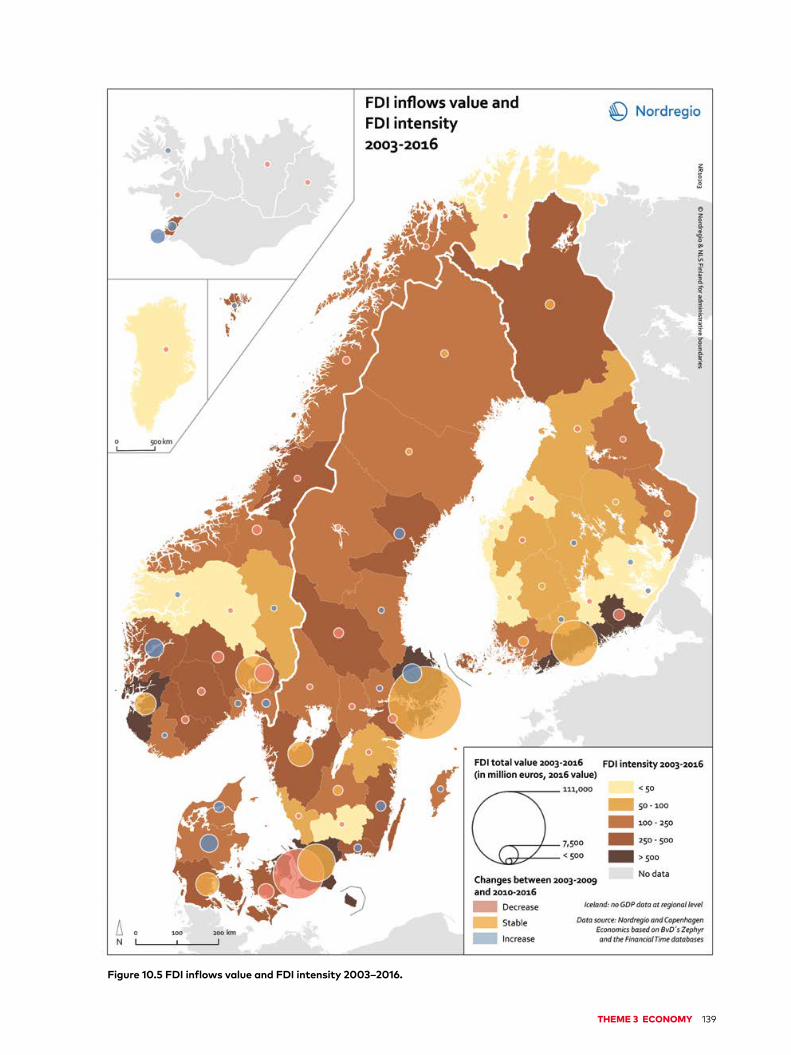
THEME 3 ECONOMY 139
Figure10.5FDIinflowsvalueandFDIintensity2003–2016.
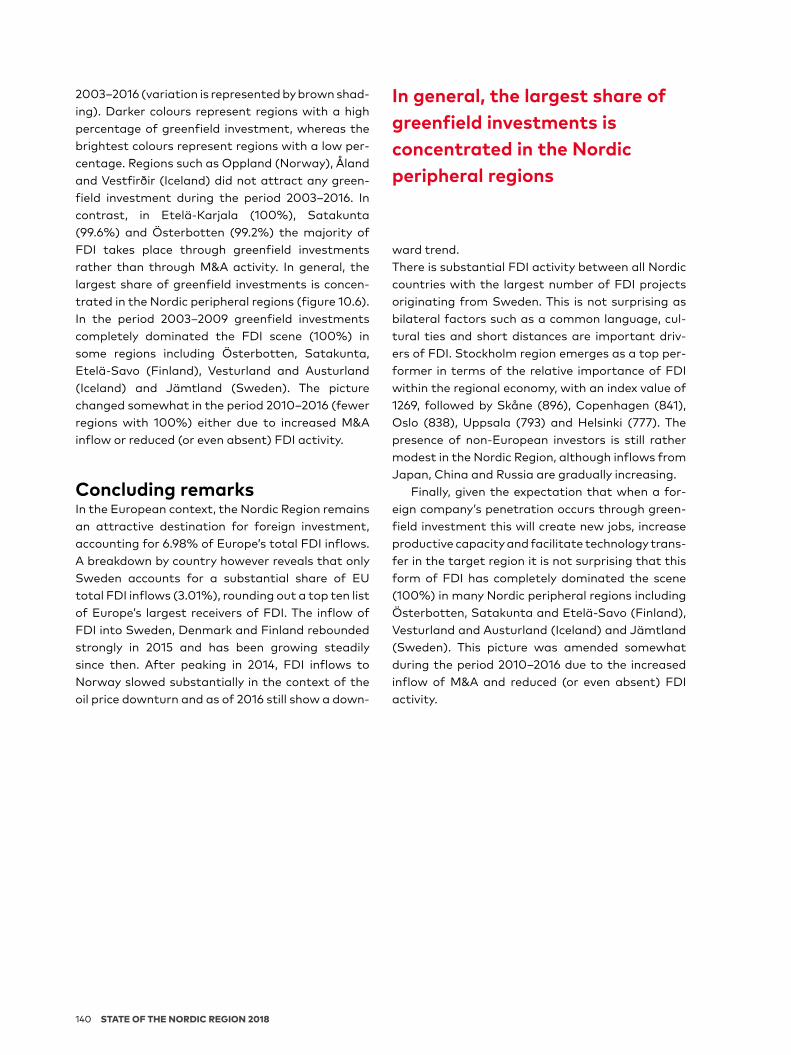
140 STATE OF THE NORDIC REGION 2018
2003–2016 (variation is represented by brown shad-ing). Darker colours represent regions with a high percentage of greenfield investment, whereas the brightest colours represent regions with a low per-centage. Regions such as Oppland (Norway), Åland and Vestfirðir (Iceland) did not attract any green-field investment during the period 2003–2016. In contrast, in Etelä-Karjala (100%), Satakunta (99.6%) and Österbotten (99.2%) the majority of FDI takes place through greenfield investments rather than through M&A activity. In general, the largest share of greenfield investments is concen-trated in the Nordic peripheral regions (figure 10.6). In the period 2003–2009 greenfield investments completely dominated the FDI scene (100%) in some regions including Österbotten, Satakunta, Etelä-Savo (Finland), Vesturland and Austurland (Iceland) and Jämtland (Sweden). The picture changed somewhat in the period 2010–2016 (fewer regions with 100%) either due to increased M&A inflow or reduced (or even absent) FDI activity.
Concluding remarksIn the European context, the Nordic Region remains an attractive destination for foreign investment, accounting for 6.98% of Europe’s total FDI inflows. A breakdown by country however reveals that only Sweden accounts for a substantial share of EU total FDI inflows (3.01%), rounding out a top ten list of Europe’s largest receivers of FDI. The inflow of FDI into Sweden, Denmark and Finland rebounded strongly in 2015 and has been growing steadily since then. After peaking in 2014, FDI inflows to Norway slowed substantially in the context of the oil price downturn and as of 2016 still show a down-
ward trend.There is substantial FDI activity between all Nordic countries with the largest number of FDI projects originating from Sweden. This is not surprising as bilateral factors such as a common language, cul-tural ties and short distances are important driv-ers of FDI. Stockholm region emerges as a top per-former in terms of the relative importance of FDI within the regional economy, with an index value of 1269, followed by Skåne (896), Copenhagen (841), Oslo (838), Uppsala (793) and Helsinki (777). The presence of non-European investors is still rather modest in the Nordic Region, although inflows from Japan, China and Russia are gradually increasing.
Finally, given the expectation that when a for-eign company’s penetration occurs through green-field investment this will create new jobs, increase productive capacity and facilitate technology trans-fer in the target region it is not surprising that this form of FDI has completely dominated the scene (100%) in many Nordic peripheral regions including Österbotten, Satakunta and Etelä-Savo (Finland), Vesturland and Austurland (Iceland) and Jämtland (Sweden). This picture was amended somewhat during the period 2010–2016 due to the increased inflow of M&A and reduced (or even absent) FDI activity.
In general, the largest share of greenfieldinvestmentsisconcentrated in the Nordic peripheral regions

THEME 3 ECONOMY 141
Figure10.6GreenfieldinvestmentasFDIinflowstotheNordicRegion2003–2016.

142 STATE OF THE NORDIC REGION 2018
Fölster, S., & Kreicbergs, J. (2014). Twenty-five years of Swedish reforms. Stockholm: Reforminstitutet.
Grunfelder, J. (2017). [Data analysis of FDI inflows to the Nordic Region, 2003-2016]. Unpublished raw data.Haskel, E.J., Pereira, C.S., & Slaughter, J.M. (2007). Does Inward Foreign Direct Investment Boost the Productivity of Domestic Firms? Review of Economics and Statistics, 89(3), 482–496.
Hirschler, B. (2012, 10 December). Amgen buys Icelandic gene hunter Decode for $415 million. Reuters. Retrieved from https://www.reuters.com/article/us-amgen- decode/amgen-buys-icelandic-gene-hunter-decode-for-415- million-idUSBRE8B90IU20121210
Invest in Finland. (2015). Foreign Direct Investment 2015 Statistics. Retrieved from http://www.investinfinland.fi/-/foreign-direct- investment-2015-statistics.OECD. (2008). Benchmark Definition of Foreign Direct Invest-ment. Oslo: OECD publishing.
Stockholm Business Region & Øresundsinstituttet. (2015). Global companies with offices in the Nordic region: a study of global and regional headquarters. Retrieved from http://www.investstockholm.com/globalassets/documents/report---global-companies-with-offices-in-the- nordic-region.pdf
World Economic Forum. (2017). The Global Competitiveness Report 2016-2017. Insight Report. Geneva: World Economic Forum.
Zhuang, H., & Griffith, D. (2013). The Effect of Mergers & Acquisitions and Greenfield FDI on Income Inequality. International Journal of Applied Economics. March 2013 10(1) 29–38.
References
Business Sweden. (2016). Manufacturing Operations in Sweden: a sector overview. Stockholm: Business Sweden. Retrieved from https://www.business-sweden.se/globalassets/invest-new/reports-and-documents/manufacturing- operations-in-sweden---sector-overview-2016.pdf
Calderón, C., Loayza, N., & Servén, L. (2004). Greenfield foreign direct investment and mergers and acquisitions: feedback and macroeconomic effects (World Bank Policy Research Working Paper 3192). Retrieved from http://documents.worldbank.org/curated/en/628261468781753575/pdf/325780wps3192.pdf
Copenhagen Economics. (2016). Towards a Foreign Direct Investment (FDI) Attractiveness Scoreboard. Brussels: European Commission. Retrieved from https://www.copenhageneconomics.com/ dyn/resources/Publication/publicationPDF/1/351/1472727400/copenhagen-economics-2016-towards-a-foreign-direct- investment-fdi-attractiveness-scoreboard.pdf
EY. (2015). EY´s Attractiveness Survey Europe 2015: Comeback time. (n.p.): EY. Retrieved from http://www.ey.com/Publication/vwLUAssets/EY-european-attractiveness-survey-2015/$FILE/EY- european-attractiveness-survey-2015.pdf
EY. (2017a). EY's Attractiveness Survey Europe 2017: Investors vote “remain” in Europe. (n.p.): EY. Retrieved from http://www.ey.com/Publication/vwLUAssets/ey-attractiveness-europe-2017/$FILE/ey-attractiveness- europe-2017.pdf
EY. (2017b). Attractiveness Program Nordics 2017. Opportunity and potential. (n.p.): EY. Retrieved from http://www.ey.com/Publication/vwLUAssets/Attractiveness_Program_Nordics_2017/$FILE/EY-Nordics-Attractiveness-Report-2017.pdf
Nord 2018:004
ISBN 978-92-893-5478-3 (PRINT)
ISBN 978-92-893-5480-6 (PDF)
ISBN 978-92-893-5479-0 (EPUB)
State of the Nordic Region 2018 gives you a unique look behind the scenes of the world’s most integrated region, comprised of Denmark, Finland, Iceland, Norway and Sweden, along with Greenland, the Faroe Islands and Åland. The report presents a series of facts and figures showing the current state of play within core socioeconomic sectors, including demography, economy, the labour force and education. In addition, you can read about the latest developments within the Nordic bioeconomy, get the status of Nordic digitalisation as well as the latest on health and welfare, plus culture and the arts. State of the Nordic Region 2018 is published by the Nordic Council of Ministers and produced by Nordregio, an international research center for regional development and planning established by the Nordic Council of Ministers, along with the Nordic Welfare Center and Nordic Agency for Cultural Policy Analysis.
Nordic Council of MinistersNordens HusVed Stranden 18DK-1061 Copenhagen Kwww.norden.org


