
State of the Environment Report - Human Settlements · Human Settlements Energy ... the State...
33
124 6 Human Settlements Energy Trends • Energy from fossil fuel constitutes 98% of all energy used in South Australia. • Total energy consumption: UP by 10% between 1993/94 and 1998/99 1 , per capita consumption increased by a similar percentage. • Proportion of the State’s power generation capacity that is powered by renewable resources: INCREASING from 0.1% in 1998 to approximately 4.6%, when windfarms approved in the past year are constructed. Goal The South Australian Government has four objectives relating to sustainable energy 2 . These are: • to reduce greenhouse gas emissions; • to encourage competitive energy markets; • to stimulate sustainable energy industries; • to pursue economic development opportunities for the State. What are the issues? Energy is essential to the operation of modern built environments; it ultimately provides goods, services, transport and comfort. Services that depend on reliable energy sources include domestic, commercial and industrial air conditioning, heating, hot water, lighting, appliances, transport and industrial equipment. Ultimately almost all of our energy comes from the sun. Some of it has been trapped in nature’s storage banks, such as oil, coal and natural gas, for millions of years. These ‘fossil fuels’ were created from animals and plants that lived millions of years ago. Their remains became buried under sediment at the bottom of ancient lakes and oceans before they decayed. Over time, the remains became buried deeper and deeper, and pressure and heat over millions of years changed the remains into gas, oil and coal. Fossil fuels provide nearly all of our energy. These fuels are not replaceable in a reasonable timeframe, as much of what we use now began forming before humans even existed. The burning of fossil fuels can cause air pollution. For example, petrol releases many pollutants as it burns inside the engine of a motor vehicle, such as sulphur dioxide and carbon monoxide. These pollutants can affect human health and the environment. The use of fossil fuel is also the most significant contributor to climate change, as these fuels release carbon dioxide, a major greenhouse gas, when they burn. The extraction of fossil fuels can also cause environmental harm (e.g. mining). While currently expensive and highly subsidised, clean and renewable sources of energy (such as wind and solar) are increasingly becoming economically viable alternatives to the non-renewable fuels that currently predominate. Renewable energy sources are those replaced within a reasonable time frame by natural processes. The legislative and regulatory frameworks developed for the energy market as well as international agreements such as the Kyoto Protocol will determine the extent and pace of change in this sector. We can all play a part in reducing energy use by catching a bus, riding a bike or car-pooling where possible, buying more efficient motor vehicles and 1 Most recently available data. 2 These reflect the State’s obligations under international agreements entered into by the Commonwealth and complement the National Greenhouse Strategy. Torrens Island powerstation Santos, Port Bonython
Transcript of State of the Environment Report - Human Settlements · Human Settlements Energy ... the State...

124
6 HumanSettlements
EnergyTrends
• Energy from fossil fuel constitutes 98% of
all energy used in South Australia.
• Total energy consumption: UP by 10%
between 1993/94 and 1998/991, per capita
consumption increased by a similar
percentage.
• Proportion of the State’s power generation
capacity that is powered by renewable
resources: INCREASING from 0.1% in 1998
to approximately 4.6%, when windfarms
approved in the past year are constructed.
Goal
The South Australian Government has four objectivesrelating to sustainable energy2. These are:• to reduce greenhouse gas emissions;• to encourage competitive energy markets;• to stimulate sustainable energy industries;• to pursue economic development opportunities for
the State.
What are the issues?
Energy is essential to the operation of modern builtenvironments; it ultimately provides goods, services,transport and comfort. Services that depend on reliableenergy sources include domestic, commercial and
industrial air conditioning, heating, hot water, lighting,appliances, transport and industrial equipment.
Ultimately almost all of our energy comes from thesun. Some of it has been trapped in nature’s storagebanks, such as oil, coal and natural gas, for millions ofyears. These ‘fossil fuels’ were created from animalsand plants that lived millions of years ago. Their remainsbecame buried under sediment at the bottom of ancientlakes and oceans before they decayed. Over time, theremains became buried deeper and deeper, andpressure and heat over millions of years changed theremains into gas, oil and coal.
Fossil fuels provide nearly all of our energy. Thesefuels are not replaceable in a reasonable timeframe, asmuch of what we use now began forming beforehumans even existed.
The burning of fossil fuels can cause air pollution.For example, petrol releases many pollutants as itburns inside the engine of a motor vehicle, such assulphur dioxide and carbon monoxide. These pollutantscan affect human health and the environment. The useof fossil fuel is also the most significant contributor toclimate change, as these fuels release carbon dioxide,a major greenhouse gas, when they burn. Theextraction of fossil fuels can also cause environmentalharm (e.g. mining).
While currently expensive and highly subsidised,clean and renewable sources of energy (such as windand solar) are increasingly becoming economicallyviable alternatives to the non-renewable fuels thatcurrently predominate. Renewable energy sources arethose replaced within a reasonable time frame bynatural processes. The legislative and regulatoryframeworks developed for the energy market as wellas international agreements such as the KyotoProtocol will determine the extent and pace of changein this sector.
We can all play a part in reducing energy use bycatching a bus, riding a bike or car-pooling wherepossible, buying more efficient motor vehicles and
1 Most recently available data.2 These reflect the State’s obligations under internationalagreements entered into by the Commonwealth andcomplement the National Greenhouse Strategy.
Torrens Island powerstation
Santos, Port Bonython

STATE OF THE ENVIRONMENT REPORT 2003 125
ENERGY
FindingsMaking progressSouth Australia has made encouraging progress in the establishment of a renewable energy industry. In 1998 lessthat 0.1% of South Australia’s energy was supplied from renewable resources. It is expected that windfarmsapproved in the past year (2002) will increase the State’s power generation capacity from renewable resourcesto 4.6%.
While it is too early to judge its effectiveness, the State Government’s Energy Efficiency Action Plan,launched in May 2002, demonstrates a commitment to reducing energy use across all Governmentoperations. The Government is a significant consumer of energy, contributing over 5% of overall Stateelectricity demand.
The State Government has established a target to purchase a minimum of 5% of its energy from renewablesources. In June 2002 details were announced of a contract to purchase 32,000 megawatt hours per annum fromthe Starfish Hill windfarm, which is approximately equivalent to 6.4% of the Government’s total annualelectricity demand.
Attention requiredNinety-eight per cent of all energy supplied in South Australia is derived from fossil fuels. Oil – primarily in theform of petrol used for transport purposes – remains our largest single source of energy, supplying around47% of the State’s energy needs.
South Australia’s energy consumption is close to the national average and is rising each year. Energyconsumption increased by approximately 10% between 1993/94 and 1998/99 with a trend toward increasinguse of petroleum products, electricity and natural gas.
What more should we be doing?The regulation and administration of energy markets now occurs largely at a national level. The StateGovernment therefore cannot exert direct control over energy production in South Australia; however, it caninfluence other aspects of energy use and supply. In light of this the Environment Protection Authorityrecommends that:6.1 A Sustainable Energy Policy for South Australia be developed and implemented as a matter of priority.
This should include consideration of improved energy supply infrastructure to encourage competitionand facilitate development of the renewable energy industry; setting renewable energy targets; andencouraging reduced energy consumption through practical demand-side measures.
6.2 The Federal Government improve incentives for the production and use of renewable energy.6.3 Progress towards achieving targets set in the Government Energy Efficiency Action Plan is monitored
and reported on.
home appliances and choosing how the energy we usein our homes is produced by purchasing green power.
Industries and businesses can choose moreefficient infrastructure in new developments orupgrades – such as installing more efficient lightingsystems – and reap the potential benefits of reducedenergy bills and a more environmentally friendly publicimage. Purchasing green power is also an option forcommercial interests (there are presently threecommercial green power customers in South Australia).
The State Government has a very significantimpact on energy supply and use through theprovision and promotion of efficient public transportand energy infrastructure, the encouragement ofrenewable energy industries, the development ofpolicies and programs for the management ofelectricity demand and the provision of educationalresource material.
See also chapters on Air quality; Climate
Change; and Transport.
Environmental indicators
PRESSURE INDICATORS
• The amount of energy derived from non-renewable resources (reported on in theState of the Environment Report 1998)
Provides an indicator of the sustainability of ourpresent methods of electricity generation.• The amount of energy used in total and by
sector (reported on in the State of theEnvironment Report 1998)
Indicates changes in total energy use anddetermines the principal energy using activities.
RESPONSE INDICATOR
• The amount of energy derived fromrenewable sources (reported on in the Stateof the Environment Report 1998)
Indicates progress toward more sustainablemethods of energy generation.
Figure 6.1: Sources of primary energy inSouth Australia – 1993/94, 1996/97 & 1998/99
1993
/94
1996
/97
1998
/99
SOURCE: ENERGY SA, 2001
Oil
Natural Gas
Coal
Wood
2%
22%
33%
42%
2%
22%
28%
48%
2%
22%
29%
47%
SOURCE: ENERGY SA, 2001
Figure 6.2: Final energy sources inSouth Australia – 1993/94, 1996/97& 1998/99
Peta
joul
es
0
20
40
60
80
100
120
Pet
role
um
Nat
ural
Gas
Elec
tric
ity
Cok
e O
ven
Pro
duct
s
Coa
l
Woo
d
1993/94
1996/97
1998/99

126
6 Human Settlements
What is the current situation?
Energy in South Australia is mainly produced usingcrude oil, gas, coal and wood. These resources may beused in our homes, industries and businesses in thisform (e.g. natural gas delivered direct to homes forcooking and heating), or may be converted into otherenergy products (e.g. using natural gas in apowerstation to produce electricity, which is thendistributed to users). The energy resources before theyare consumed or converted are referred to as primaryenergy, while that which we ultimately use in ourhomes, industries and businesses is called finalenergy or energy at ‘end-use’.
It is important to realise that some energy is lostin the production and distribution of these products tousers. An average coal power plant, for example, mayhave an efficiency rate of approximately 35%. Thismeans that, of the total energy held inside a lump ofcoal, a power plant may only be able to convert arounda third of it into electricity. Similarly, some energy islost from power lines in the transmission anddistribution process, and some gas escapes betweenthe gas fields and the end users. This lost energy isknown as dissipated energy and if we could reduce it,less resources would be required to produce each unitof energy we eventually use. Some of the new gas-fired powerstations such as those at Osborne andPelican Point have higher primary energy conversionefficiencies of around 40% to 60%.
PRESSURE INDICATOR: The amount ofenergy derived from non-renewableresources
South Australia’s main primary (or raw) energy sourcesare oil, natural gas, coal and wood. There has beenlittle change in the sources of raw energy supplies inSouth Australia since 1993/94. Oil remains the singlelargest source of primary energy (Figure 6.1). Wood,the only renewable energy resource used at significantlevels in South Australia, only supplies around 2% ofprimary energy. The remaining 98% is supplied byfossil fuels.
Energy is then delivered to South Australians asfinal energy, mainly in the form of petroleum (derivedfrom oil), electricity (derived mainly from gas, coal andthe electricity interconnector with Victoria) and naturalgas (delivered direct) (Figure 6.2).
The trend is towards the increasing use ofpetroleum products, electricity and natural gas andfairly static use levels for other fuel types (Figure 6.2).Our heavy dependence on fossil fuels for energy is akey factor in our high per capita greenhouse gasemissions (see chapter on Climate Change).
Virtually all of the oil used in South Australia isrefined into petroleum products for use in thetransport sector. Natural gas has a wide variety of uses
3 Greenhouse gas emissions from electricity generation inSouth Australia are less than the Australian averagebecause around one-third of our electricity is generatedusing natural gas. This is the highest proportion of anyState other than the Northern Territory.
including the generation of electricity, as well as forconsumption by industry, households and commercialenterprises. In recent years natural gas generation hasprovided for much of the growth in the SouthAustralian electricity market3. Coal is used primarily forsteel making at Whyalla and electricity generation atPort Augusta. Turning coal into electricity involvesmajor losses of energy in the generation process.
PRESSURE INDICATOR: The amount ofenergy used in total and by sector
South Australia has high levels of energy consumptionper capita by world standards, as does the whole ofAustralia. South Australia’s energy consumption isclose to the national average and rose approximately21 petajoules, or 10%, between 1993/94 and 1998/99(Figure 6.3). To put this in context, one petajoule wouldlight up a 100 watt light bulb for around 320,000 years.Per capita consumption also increased by a similaramount during this period.
The key energy-consuming sectors in SouthAustralia are transport (e.g. private cars, trucks, buses,trains) and manufacturing, together comprising roughlythree-quarters of all demand (Figure 6.4).
The manufacturing (up 17%) and domesticsectors (up 20%), however, showed the greatestincrease in energy use between 1993/94 and 1998/99.
Domestic energy use comprises 15% of allenergy used in South Australia. The main sources ofenergy used in households are electricity, natural gasand wood (Figure 6.5). Wood is a significant fuelsource for heating. Water heating and the running ofelectrical appliances are the largest domestic energyconsumers at around two-thirds of all energy used inthe home (Figure 6.6).
What impact will using fossil fuels forenergy have?
Some of the environmental, social and economiceffects of energy use are outlined below to illustratethe broader significance for sustainability.Contribution to the greenhouse effect. Mostgreenhouse gases are generated by the energy sector.In South Australia the consumption and generation ofenergy contributes around 64% of our totalgreenhouse gas emissions. The predicted impact ofclimate change on the environment is through loss ofhabitat and the associated economic costs, andparticularly through lost agricultural production. Thecosts of using fossil fuels may also increase if theKyoto Protocol is ratified and international carbontrading commences (for more information see thechapter on Climate Change).Impact on air quality. The use of fossil fuels canrelease harmful pollutants into the atmosphere. Thesecan potentially affect human health and the health ofthe environment. There are also economic costsassociated with treating the health problems causedby poor air quality.Coast and marine environments. Theseenvironments may be negatively affected by thermaldischarges from powerstations, which warm nearbycoastal waters.
THE NATIONAL ELECTRICITY
MARKET
The Victoria-South Australiaelectricity interconnector wascompleted in 1990, which allowedelectricity trading between thetwo States. The interconnectornow facilitates South Australia’sparticipation in the NationalElectricity Market (NEM). Despitethe increased competition,electricity deregulation and thetrading system presently in placefor the NEM have caused someaspects of power generation tobecome less efficient.
The thermal efficiency of powergeneration dropped approximately5% nationally and 3% in SouthAustralia between 1991 and 2000.This means that in 2000 in SouthAustralia, 3% more fuel was beingused to create each megawatt ofelectricity than in 1991, with clearimplications for air quality andgreenhouse gas emissions. Thedecline in efficiency can be partlyexplained by the frequent startingand stopping of generators inresponse to market forces andpoints to the inability of themarket to deliver positiveenvironmental outcomes.The trend towards increasedgeneration from low thermal-efficiency brown coal plants inVictoria is also a key factor.
Goods train
1993/94 1998/99
SOURCE: ENERGY SA, 2001
Figure 6.3: Energy consumption inSouth Australia – 1993/94, 1996/97& 1998/99
Peta
joul
es
190
195
200
205
210
215
1996/97YEAR

STATE OF THE ENVIRONMENT REPORT 2003 127
ENERGY
KEY FACTS
• 98% of South Australia’s
primary energy is derived
from fossil fuels.
• Around one-third of all
energy consumed in South
Australian households is
used to heat water.
• Windfarms approved since
the State of the Environment
Report 1998 will provide 4.6%
of South Australia’s total
power generation capacity.
• The Starfish Hill windfarm
will provide enough
electricity to power 18,000
typical South Australian
homes for a year.
What are we doing about it?
RESPONSE INDICATOR: The amountof energy derived from renewablesources
Renewable energy includes sources of power that arereplaceable or non-depletable within a reasonable timeframe. These include power sources derived fromwind, solar energy, plant and animal material (biomass)and heat stored underground (geothermal).
WindSouth Australia has made some encouraging progressin the establishment of a renewable energy industrysince the State of the Environment Report 1998, whenless than 0.1% of South Australia’s energy wassupplied from renewable sources compared to theAustralia-wide figure of 6%. It is expected that 4.6%of South Australia’s energy will be generated fromrenewable sources when windfarms approved up tothe end of 2002 are constructed. The first of these tobe approved is the 34.5 megawatt Starfish Hill
windfarm on the coast north of Cape Jervis.A number of additional windfarm developments
in South Australia are likely as there is a wide range oflocations with suitable conditions. However, a majorissue for wind generation growth is the cost ofconnection and the need to upgrade the transmissionnetwork. The State Government has developedPlanning for Wind Farms, a set of guidelines whichprovide the planning approvals process with specifictools for the assessment of proposed windfarms,where previously none existed.
In early 2002 the South Australian Governmentcommitted to the purchase of 6% of its energyrequirements from renewable wind sources. This is asignificant commitment and provides encouragementfor the development of sustainable energy technologiesin South Australia. Committing to a larger percentageshould be a future goal for the State Government.
SolarSolar energy is obtained directly from the sun. It canbe captured and stored as heat energy (solar thermal),or be used to produce electricity from photovoltaiccells (solar electric systems). Solar thermaltechnologies use the sun’s heat in a variety ofapplications. Solar hot water systems have thus farproved to be the most popular application for solarthermal energy in South Australia. The StateGovernment began assisting this market with theintroduction of a solar hot water rebate in July 2001.A total of 957 solar hot water rebates were approvedin the first twelve months of the program. Due toincreased demand for the program, the StateGovernment increased the budget by $1.3 million in2002/03 and 2003/04 bringing the total budget to$2 million per annum for both years. From July 2002 tothe end of May 2003, 2118 applications were approvedfor rebates.
Photovoltaic cells (also known as solar cells)convert light from the sun into useable electricity.While the cost of photovoltaic (PV) technologycontinues to decrease, the initial capital outlay
required to install a photovoltaic system remains high.The Photovoltaic Rebate Program, introduced by theFederal Government and administered by Energy SA,provides assistance to members of the public andcommunity groups interested in installing photovoltaiccells. From January 2000 to June 2003, 785Photovoltaic Rebate Program applications wereapproved in South Australia. This equates to1145 kilowatts of installed photovoltaic capacity andelectricity generation of approximately 2090 megawatthours per annum, with a saving of around 2300 tonnesof CO2. Costs for this technology remain high but aresteadily decreasing with industry estimating that costswill be comparable with grid power within ten years.
Plant and animal material (biomass)Biomass refers to plant and animal matter, either livingor dead. There are many forms of biomass that can beused to produce energy, including wood, sewagesludge, livestock waste, specially grown energy crops,woody weeds, food industry waste and landfill waste.Biomass may be converted into solid, liquid orgaseous fuels by burning, or via a number of othercomplex scientific techniques.
Wood is the main biomass energy source used atthe moment and provides approximately 2% ofprimary energy in South Australia. There are five landfillgas power plants located at the Wingfield (2 plants),Tea Tree Gully, Highbury and Pedler Creek landfill siteswhich recover energy from waste dumps; however,these have a combined energy generating capacity ofonly 12.7 megawatts.
GeothermalGeothermal energy is heat energy stored deepunderground. South Australia has extensive reservesof hot dry rocks in the Cooper Basin and there hasbeen considerable investigation into the viability oflarge-scale geothermal electricity generation in thisregion. This technology involves drilling deep bores intowhich water is pumped. The water is heated by therocks below and converted to steam which is pipedback to the surface to drive turbines, producingelectricity. The next step for this technology is theconstruction of a pilot plant to determine if it is apractical energy resource.
Policy and programsThe renewable energy market has been stimulated bythe introduction of the Commonwealth Renewable
Energy (Electricity) Act 2000, which sets a Mandatory
Renewable Energy Target (MRET) to generate anadditional 2% of Australia’s electricity from renewablesources by 2010. Even though there has been somesuggestion that this target may easily have beenachieved by the market without legislative enforcement,and that a much higher goal could have been set, theinitiative has been instrumental in the growth of thewind and solar water heating industries in Australia andif removed could well see their decline.
Following agreement between Federal and StateGovernments, new energy efficient standards for thedesign and construction of houses have beenincluded in the Building Code of Australia as ofJanuary 2003. New standards for commercialbuildings will follow.
Tarong windfarm at Starfish HillPhoto: Tarong Energy
2%
40%
34%
5%
Figure 6.4: Energy demand by sectorin South Australia – 1998/99
SOURCE: ENERGY SA, 2001
3%15%
1%
Agriculture
Domestic
Mining
Commercial
Manufacturing
Transport
Other

128
6 Human Settlements
The introduction of the Green Power program bythe Commonwealth Government in 1997 has alsoencouraged the development of renewable energysources. The program allows electricity retailers tooffer customers an accredited renewable energyproduct. There were around 85,479 Green Powercustomers nation-wide as at June 2003 and totalcustomer participation increased by around 10% overthe previous year. However, just 395 of them were inSouth Australia.
A wide range of initiatives aimed at increasingenergy efficiency and reducing energy use are beinginvestigated by the State Government in response torecommendations in the Electricity Demand-Side
Measures Task Force Final Report that was deliveredto Government in 2002. Based on international andinterstate experience energy use in South Australiacan be reduced by at least 20% using cost-effectiveenergy efficiency measures. These include betterbuilding design or the implementation of measures toreduce our reliance on the national electricity grid,such as the introduction of solar hot water rebates.
The State Government is a significant user ofenergy, spending more than $100 million annually onits operations. In 2000/01 Government energy useproduced around 675,000 tonnes of carbon dioxide.This amounts to around 2.1% of the State’s totalgreenhouse gas emissions (South AustralianGovernment Energy Use Annual Report 2001/02). Thereduction of energy use in the public sector has beenmade one of the State Government’s key goals. Inearly 2002 the Government committed to thepurchase of just over 6% of its electricityrequirements from renewable wind sources. AGovernment Energy Efficiency Action Plan wasapproved in November 2001. This aims to reduceenergy use in the public sector by 15% by the year2010. Progress towards achieving this target is nowreported by each agency in their annual reports, andwhole-of-Government progress is reported annually inthe Government Energy Use Annual Report.
Programs for alternative fuels and reducing
emissions from the transport sector are discussedin the chapter on Transport.
For more information on programs and initiativessee the State of the Environment 2003Supplementary Report.
References
ABARE (2001). Australian Energy: Projections to2019 – 20. Canberra, Australia.
Apelbaum J. (2001). The South Australian TransportTask, Primary Energy Consumed and Emissions:Part E – Road. Apelbaum Consulting Group, Reportprepared for Transport SA, 27 pp.
Energy SA (2001). South Australian Energy Flows –1998/99.
Further information
Energy SAwww.energy.sa.gov.au
Mandatory Renewable Energy Target Reviewwww.mretreview.gov.au
National Electricity Market Management Company(NEMMCO)www.nemmco.com.au
Renewable Energy Commercialisation Programwww.greenhouse.gov.au/renewable/recp
Renewable Energy Equity Fundwww.greenhouse.gov.au/renewable/renew4.html
Domestic solar hot water unitPhoto: Energy SA
52%
3%
33%
Figure 6.5: Energy sources in theSouth Australian household
SOURCE: ENERGY SA, 2001
Electricity
Wood
LPG
Natural Gas
12%
34%
35%
2%
Figure 6.6: Energy used by appliance
SOURCE: ENERGY SA, 2001
Electrical Appliances and Equipment
Space Heating
Space Cooling
Cooking
Water Heating
24%
5%

STATE OF THE ENVIRONMENT REPORT 2003 129
Population andUrban FormTrends
• South Australia’s population growth:
DECLINING from 2.4% per year in the 1960s
to 0.5% per year between 1996 and 2001.
• The availability of undeveloped land for
new housing development: DECLINING.
• The number of new homes being built on
redeveloped sites within metropolitan
Adelaide: INCREASING.
• Average household size: DECLINING – this
will probably continue to increase the
demand for housing faster than the growth
in population, posing challenges to the
natural environment of Adelaide and
surrounding areas.
• Variations in population growth rates at the
regional and local level: INCREASING –
creating marked differentials in
environmental pressures at the local and
regional level in South Australia.
• The median age of the population of South
Australia: INCREASING – from 30.4 years in
1981 to 37.6 years in 2001.
• Population density: INCREASING in the
metropolitan area.
Goal
To plan for and accommodate the changing nature ofour metropolitan and regional populations throughdirecting growth which is underpinned by principles ofecologically sustainable development. This meansusing resources in an efficient manner and includes amore space intensive approach to urban form,recycling resources and being responsive to thechanging needs of populations in regional areas.Planning SA
What are the issues?
The impact that a human society has on theenvironment has to do with its size, levels ofproduction and consumption (which will influence, forexample, the amount of waste produced), theefficiency or otherwise of resource use, technologyused to supply goods and services, and theeffectiveness of Government and other organisationsin preventing or repairing environmental degradation.This chapter will only examine the populationcomponent of this relationship, but it must beemphasised that the impact of people on theenvironment is affected by these other key factors.
Although South Australia’s population growth ratein the two decades after World War II was one of thehighest in the country, it has slowed significantly since1966. Since then the growth rate of the State’s
population has increased slightly but, at an average ofjust 0.5% per year over the period 1996–2001, it wasthe second-slowest of all States and Territories andless than half the nation’s growth rate of 1.2%.
Despite a slowing of the State’s populationgrowth as a whole, there are wide variations inregional population growth rates. These create markeddifferences in environmental pressures in differentparts of the State.
The Adelaide and associated peri-urban areasincluding Mount Barker, the Victor Harbor region andthe Barossa are continuing to account for a greatershare of the State’s population growth (around 81%).This is placing pressure on the availability of land andurban services in these regions and increasing thetension between competing uses of land andenvironmental resources. Regional centres such asMount Gambier and Port Lincoln and the OlympicDam mining centre of Roxby Downs have also shownsignificant growth.
In contrast, some urban centres such as Whyalla,Port Pirie and Port Augusta are continuing toexperience a decrease in population numbers largelyassociated with the loss of jobs in the local area. Thiscan pose significant problems for the futuresustainability of many rural populations.
The number of homes in South Australia isincreasing more rapidly than the number of peoplebecause the population is ageing (older people aremore likely to live alone) and because of changes inlifestyle. This, in combination with the decliningavailability of land for new housing developments, israpidly increasing the number of new homes beingbuilt on redeveloped or previously used sites.Approximately 30% of building approvals in thegreater Adelaide area were built on redeveloped sitesin 1999. This trend towards ‘urban renewal’ andconsolidation will continue under the guidance of themetropolitan volume of the Planning Strategy. Whilethis will bring some environmental benefits (reducedgreenhouse gas emissions for example) there willalso be major environmental implications in terms ofthe provision of infrastructure and services, thecreation and disposal of waste associated withconstruction and demolition activity, and the way weuse open space. This will be a major challenge for thefuture and, at the same time, will provideopportunities for environmental improvement byredesigning neighbourhoods to provide for moresustainable outcomes, for instance by incorporatingwater sensitive urban design and development.
See also chapters on Land Use; Waste; Energy;and Transport.
POPULATION AND URBAN FORM
St Peters Cathedral, Adelaide,South AustraliaPhoto: South AustralianTourism Commission

130
6 Human Settlements
Adelaide CBD
FindingsMaking progressA comprehensively updated Regional Planning Strategy and a selectively updated Planning Strategy formetropolitan Adelaide were released in January 2003. These seek to improve the integration of environmentalimpact management with planning policy and broader sustainability principles. A more comprehensive updateof the Planning Strategy for metropolitan Adelaide has commenced.
In recognition of the importance of outer metropolitan regions a Planning Strategy is being developed forouter metropolitan areas. It is essential that this places a high priority on the protection of the Mount LoftyRanges Watershed and viable agricultural land and the minimisation of conflict between land use and theenvironment.
An urban growth boundary has been established to arrest Adelaide’s urban sprawl and encourage higherdensity residential development and redevelopment closer to the city’s centre and major transport andservice nodes. This is a major policy shift that will require Adelaide to grapple with the notion of denser urbandevelopment and its associated environmental and wider sustainability implications.
The Green City program aims to brand Adelaide as an internationally acclaimed green city – recognisedfor its environmental and sustainability initiatives. Success of the program will depend upon effectivepartnerships, leading edge sustainable development and community involvement and participation.
Attention requiredThe expansion of residential development into the Mount Lofty Ranges raises significant environmentalconcerns. This is already one of the most populated water catchments in Australia and any further intensivedevelopment will place additional pressure on the region’s water resources, infrastructure and biodiversity.Development of the Inner Regional Planning Strategy (encompassing the Fleurieu Peninsula, Barossa, CentralHills and the Northern Adelaide Plains) should place a high priority on addressing these issues.
Current policy and programs tend to focus on sustainable development within metropolitan and outermetropolitan areas. There is a need for a State-wide approach to sustainable development that integrates naturalresource management principles with planning and development at the regional level. There is also a need forthe coordinated and restrained provision of infrastructure, which can, in part, be facilitated through theMetropolitan Development Plan.
Currently in Adelaide the demand for dwellings is increasing faster than the growth in population.This poses potential challenges to the natural environment of Adelaide. In particular, those associated withstormwater and wastewater management, waste management and infrastructure provision.
Despite a slowing of the State’s population growth as a whole, there are wide variations in regionalpopulation growth rates. These create marked differences in environmental pressures in different parts ofthe State.
What more should we be doing?The Environment Protection Authority recommends that:6.4 Development of the Inner Regional Planning Strategy places a high priority on addressing the
environmental issues associated with increasing residential and other development in the Mount LoftyRanges. There should also be a requirement for all major developments that have the potential to causeenvironmental harm to undergo an environmental risk assessment before receiving approval.
6.5 Further information is collected on the environmental, social and economic costs and benefits ofenforcing the current metropolitan urban containment boundary to inform future policy development.
6.6 Sustainable development is addressed on a whole-of-State basis, with particular regard for theintegration of natural resource management principles with planning and development policy andinfrastructure provision at the regional level.
6.7 Priority is given to ensuring policies are in place to deal with the current divergence between populationgrowth rates and the demand for private dwellings and the implications of this for sustainability andAdelaide’s built environment.
6.8 State Government takes a strong leadership role in the Green City Program to ensure its success. Theupdated Planning Strategy for metropolitan Adelaide should provide an overarching framework for theGreen City Program that is solidly based on sustainability principles
6.9 Priority is given to determining the environmental impact of any proposed changes to population policyand the implications for development and the planning process.

STATE OF THE ENVIRONMENT REPORT 2003 131
POPULATION AND URBAN FORM
Environmental indicators
PRESSURE INDICATORS
• Changes in population growth (reported onin the State of the Environment Report 1998)
Changing population trends impact on theState’s environment and natural resourcesthrough resource use and waste generation.• Population density (reported on in the State
of the Environment Report 1998)Changing population density has implicationsfor resource use and for urban and socialinfrastructure.
What is the current situation?
PRESSURE INDICATOR: Changes inpopulation growth
State-wide changes inpopulation growthThe population of South Australia grew by almost 70%between 1947 and 1966 compared with an overallincrease of 53% in Australia. As a result South Australiasteadily increased its share of the national populationfrom 8.5% in 1947 to 9.4% in 1966 (Table 6.1).
This trend reversed in the late 1960s and by 2001South Australia’s share of the national population hadfallen to just 7.8%. Underpinning this decline was adecrease in the State’s average annual growth ratefrom 2.4% per year in the early 1960s to just 0.4% inthe 1991-96 intercensal period (period betweennational censuses). Since 1996 the growth rate of theState’s population has increased slightly but, at anaverage of just 0.5% per year over the period 1996–2001, it is still less than half the nation’s growth rate of1.2% per annum (Table 6.2).
KEY FACTS
• South Australia’s population is
growing at around 0.5% per
year – less than half the
national growth rate of 1.2%.
• In recent decades, South
Australia has regularly lost
more people to interstate
destinations than it has gained.
Table 6.1: Population of South Australia and
Australia – 1947 to 2001
Population (persons)
Census South Australia SA asyear Australia percentage
of Australia
1947 646,073 7,579,358 8.52
1954 797,094 8,986,530 8.87
1961 971,487 10,508,186 9.25
1966 1,094,984 11,599,407 9.44
1971 1,200,114 13,067,265 9.18
1976 1,274,070 14,033,083 9.08
1981 1,318,769 14,923,260 8.84
1986 1,382,550 16,018,350 8.63
1991 1,446,299 17,284,036 8.37
1996 1,474,253 18,310,714 8.05
2001 1,511,728 19,413,240 7.79
Note: Population totals 1947–66 are census counts,1971–2001 figures are estimated resident populations.
Source: ABS Cat. 3218.0 Regional Population Growth,selected years and census publications selected years.
Components of population changeThe factors that dictate population change are births,deaths and overseas and interstate migration.Table 6.3 summarises the components of SouthAustralia’s population change from 1977 onwards.
The most dramatic change that is directly relatedto the State’s declining population growth rate is asteady decrease in the number of births, which fell byover 13% between 1983/84 and 2000/01. Since 1974the State’s average number of children born perwoman has been below 2.1, the level that is requiredif the parents’ generation is to be fully replaced bytheir children once mortality is taken into account.
Table 6.2: Population growth South Australia and Australia, 1947–54 to 1996–2001
Intercensal period Population (average annual growth Population (average annual– number persons) growth rate)
South Australia Australia South Australia Australia
1947–54 21,574 201,025 3.0 2.5
1954–61 24,913 217,379 2.9 2.3
1961–66 24,699 218,244 2.4 2.0
1966–71 15,745 231,246 1.4 1.9
1971–76 14,791 193,164 1.2 1.4
1976–81 8940 178,035 0.7 1.2
1981–86 12,756 219,018 0.9 1.4
1986–91 12,750 253,137 0.9 1.5
1991–96 5591 205,336 0.4 1.2
1996–2001 7495 220,505 0.5 1.2
Note: Population totals 1947–54 to 1966–71 based on census counts, 1971–76 to 1996–2001 on estimated residentpopulation.
Source: ABS Cat. 3218.0 Regional Population Growth, selected years and census publications selected years.

132
6 Human Settlements
Table 6.3: Components of population change, South Australia, year ending 30 June 1977 onwards
Financial Estimatedyear residentending Natural Net overseas Net interstate Population population30 June Births(a) Deaths(a) increase migration migration change (b) 30 June (c) (d)
1977 19,086 9715 9371 2874 – 12,245 1,286,119
1978 18,964 9768 9196 2638 -1500 10,334 1,296,205
1979 18,403 9748 8655 541 -4000 5196 1,301,109
1980 18,317 9536 8781 3325 -4500 7606 1,308,397
1981 18,960 9806 9154 6655 -5109 10,700 1,318,769
1982 19,076 9894 9182 8520 -4875 12,827 1,331,108
1983 19,445 10,339 9106 6417 -328 15,195 1,345,775
1984 20,118 9799 10,319 3969 553 14,841 1,360,048
1985 19,901 10,204 9697 4329 -2317 11,709 1,371,197
1986 19,657 10,427 9230 5084 -1417 12,897 1,382,550
1987 19,628 10,577 9051 6200 -3977 11,274 1,392,764
1988 19,288 10,799 8489 5952 -1240 13,201 1,404,909
1989 19,445 10,781 8664 6665 -221 15,108 1,419,029
1990 19,573 11,320 8253 5762 -252 13,763 1,432,056
1991 19,841 11,074 8767 4619 1545 14,931 1,446,299
1992 19,655 11,060 8595 2897 -658 10,834 1,456,512
1993 19,819 11,351 8468 1546 -5210 4804 1,460,674
1994 19,381 11,375 8006 1994 -3978 6022 1,466,138
1995 19,475 11,522 7953 2883 -7069 3767 1,469,429
1996 18,839 11,339 7500 3653 -6192 4961 1,474,253
1997 18,576 11,625 6951 3106 -3318 6739 1,481,357
1998 18,330 11,728 6602 3160 -1996 7766 1,489,552
1999 18,399 11,648 6751 2682 -1631 7802 1,497,819
2000 17,896 11,590 6306 3829 -3531 6604 1,505,038
2001 17,414 11,919 5495 2765 -2418 5842 1,511,728
(a) Births and deaths figures used to compile natural increase for population estimates are based on year of occurrenceand may differ from births and deaths data based on year of registration.
(b) Population change is equal to natural increase plus overseas net migration plus interstate net migration.
(c) At end of period.
(d) Sum of natural increase and migration may not add up to change in ERP due to intercensal discrepancy.
Source: ABS Publications 3105.0.65.001 Australian Historical Population Statistics, 3101.0 Australian Demographic
Statistics, ABS consultancy March 2003
Over the same period of 1983/84 to 2000/01, due tothe increased proportion of older persons in thepopulation, the number of deaths in the State hasincreased by over 21%.
As a result of the diverging trends in the numberof births and deaths, the natural increase of thepopulation (the difference between the number ofbirths and the number of deaths) has almost halvedfrom 10,319 in 1983/84 to 5495 in 2000/01. It is thesedemographic dynamics that underlie South Australia’sslowing population growth rate and the increasedageing of its population.
Population gains from overseas migration havefluctuated widely over the last 25 years. With annualgains of several thousand people in recent years thiscomponent has, in part, compensated for recentdeclines in natural increase. However, current
Australian immigration policy has the effect ofselecting low fertility groups for migration to Australiaso an increased immigrant intake is not likely tocompensate in the long term for the State’s belowreplacement fertility.
In contrast to overseas migration, net interstatemigration has been consistently negative in most yearssince 1976/77, indicating that South Australia hasregularly lost more people to interstate destinationsthan it has gained. This is one of the major factorsresponsible for the State’s slow population growth rate.
Regional and intra-regional changes inpopulation growthDespite a slowing of population growth at the Statelevel, there are wide variations in regional and intra-regional patterns of population growth. This hascreated marked differences in direct environmentalpressures between different parts of the State.

STATE OF THE ENVIRONMENT REPORT 2003 133
Map 6.1: Statistical Divisions of South AustraliaSOURCE: PLANNING SA
1 At the time of writing the final estimated residentpopulation figures for regions within South Australia werenot available. Data for 2001 relies on preliminary figures.
The predominant trend within South Australiaover the past twenty years has been a concentrationof population within the settled parts of the Statewith Adelaide and Outer Adelaide (Map 6.1)continuing to account for the vast majority of theState’s population and population growth. In 200173.3% of all South Australians lived in the AdelaideStatistical Division and 7.5% in the Outer AdelaideStatistical Division.1 Map 6.2 shows the rate ofgrowth of Statistical Local Areas between 1996 and2001. The major conclusions are:• the new areas of housing development in
Adelaide’s north, far north, far south and in MountBarker have shown the greatest relative growthrates of more than 10%, along with Light RegionalCouncil to the north of Adelaide, and Victor Harborand Goolwa on the Fleurieu Peninsula. Theestablishment of the Woomera detention centre forasylum seekers explains the exceptional buttemporary increase of population in the Far North;
• Statistical Local Areas (SLAs) in the remainder ofthe State, especially the established non-coastalwheat growing and grazing areas, have almostuniversally shown a significant decline inpopulation numbers.
Absolute population change in SLAs across the Stateis shown in Map 6.3. The major conclusions are:• a significant number of inner SLAs in the Adelaide
Statistical Division have experienced substantialpopulation increases as a result of urban renewal,with higher density housing replacing lowerdensity housing;
• SLAs further from the city centre that have landavailable for new housing developments, such asMount Barker, have also experienced increasingpopulations;
• the only rural SLAs to experience population gainswere those on the coast or were regions whereexport-producing agricultural industries havewitnessed recent growth, such as the wine producingregion of the Coonawarra in the South East;
• the Northern Statistical Division industrial cities ofWhyalla, Port Augusta and Port Pirie haveexperienced significant population losses as theirheavy industrial and mining base has lost much ofits workforce through economic restructuring.
Map 6.4 illustrates the relationship between the sizeof towns and their rates of population change between1996 and 2001 and how this relationship is influencedby geography. It shows that many of the small townssited on the coast of Eyre Peninsula (Streaky Bay,Elliston, Tumby Bay and Cowell) and centres on YorkePeninsula (Port Broughton, Wallaroo, Port Vincent andEdithburgh) have had significant increases inpopulation due to people retiring, tourism, andinvestment in aquaculture. It also indicates growth inregional centres serving intensive agricultural areassuch as Mount Gambier, Renmark, Berri, Naracoorteand Clare, and in centres such as Port Lincoln and
Wallaroo with the development of fisheries andaquaculture industries.
These divergent patterns of population growthhave profound environmental and planningimplications. For example, a substantial relocation ofpeople to coastal locations will increase the demandson infrastructure for drinking water, electricity or gas,and sewerage services in these small settlements, ademand that may not be able to be met withoutsubstantially increased investment and infrastructureprovision. Growing resident populations and increasedtourism will also increase the use of beachfrontlocations, many of which are ecologically fragile (seealso chapter on Land Use).
The large decline in population numbers inWhyalla has created unoccupied housing in the citythat is now in need of redevelopment. This posesmajor problems for city planners and may furtherdepress already low land prices with seriousconsequences for the city’s revenue base. Whereregional centres do have a decreasing population,decision makers need to be particularly selective ofthe nature of redevelopment and where it occurs.
Long term and persistent population declines inmany small inland towns and among rural farmpopulations as young males and especially femalesmigrate to seek employment in urban destinations,have created labour shortages and a severe genderimbalance in many farming communities. This selective
POPULATION AND URBAN FORM

134
6 Human Settlements
out migration and population decline can pose seriousproblems for the future demographic sustainability ofmany rural populations and subsequently theknowledge and labour required for the continuation ofland management practices that are capable ofmaintaining the desired ecological balance.
PRESSURE INDICATOR: Populationdensity
South Australia has an extremely low populationdensity of 1.5 persons per square kilometre, reflectingits vast inland arid and semi-arid areas that do notsustain large cities or towns. Our urban settlementsare among the lowest density in the world. In contrast,population density in the United Kingdom is 247persons per square kilometre and in Japan it is 337persons per square kilometre (Population ReferenceBureau, www.prb.org; and ABS).
The vast majority of the State’s population (81%)is clustered in the better-watered south-eastern corneralong the coastal plains of the Adelaide StatisticalDivision and in the Adelaide Hills that form the easternhinterland of the city.
Population projections (Planning SA, 2000)suggest that by 2016 this concentration of populationwill have increased to almost 83% with large-scalehousing redevelopment closer to central Adelaide andresidential shift into Gawler and Light RegionalCouncils to the north, into the District Council ofMount Barker to the east and along the southern coastof Onkaparinga City Council and into the DistrictCouncil of Victor Harbor. Potential for increasedleapfrogging of development may also occur intonearby settlements with good road access to Adelaidesuch as Murray Bridge, Goolwa and into the BarossaValley. This is an issue that will be addressed by thenew Inner Regional volume of the Planning Strategy.
Age structure – an ageing populationLike most developed countries the population ofAustralia is experiencing changes in its agecomposition with a significant increase in theproportion of the population in the older age groups(60+) over the last two decades (1981–2001). Thepopulation of South Australia has also exhibited thistrend that is projected to accelerate over the 2001–2011 decade. If these projections are realised, then theproportion of the State’s population comprising elderlypersons (aged 65+ years) will increase from 12.9% in1991 to 16.2% in 2011. However, the most dramaticincreases will be after 2011 when those now aged50 to 64 enter the elderly age brackets.
Without major changes to fertility rates this ageingof the population will continue at a rapid rate for at leastthe next 25 years with major consequences for futurehousing demand, the demand for specialised health,transport and welfare services and the duration of timespent in employment.
Trends in housing demand – morehouses for fewer peopleIn South Australia there has been a major divergencebetween the growth in the number of dwellings andthe growth of the population. The number of newdwellings has grown at more than twice the rate of
population growth between 1981 and 2001 (ABSCensus of Population and Housing 1981–2001).
Several factors have influenced this difference ingrowth rates. The ageing of the population has playeda role in this with an increasing proportion of thepopulation being in the adult age groups most likely tobe living outside the parental home. The elderly arealso enjoying increased longevity that means moreyears of life in a household without children andpossibly more years of living alone after the death of aspouse. Changes in preferred living styles, such asincreased levels of marriage break-up and divorce,have also boosted the demand for private dwellings.First-home-buyer schemes have also encouraged thedemand for new housing in the last few years alongwith low interest rates and low inflation that haveimproved its affordability. However, recent significantprice increases have tempered this affordability.
Although economic conditions may change in thefuture, demographic and social changes leading todecreased average household size will probablycontinue to increase the demand for dwellings fasterthan the growth in population. This poses challengesto the natural environment of Adelaide. In particular,this continued demand for new dwellings will divertresources to the built environment, increase theenergy requirements of the State, increase the landoccupied by housing and potentially createenvironmental problems associated with stormwaterand wastewater management or, alternatively,opportunities if the use of stormwater and treatedwastewater is designed into developments.
What impact will Adelaide’s changingpopulation and urban form have?
Analysis of the growth of residential development in theAdelaide Statistical Division plus Mount Barker (Map6.5) highlights the massive growth in the spatial extentof that development in the four decades since 1960.During this period there has been an 89% increase inpopulation in the Adelaide Statistical Division and a250% increase in the area of residential land.
In 1960 the city was confined to a more or lesscontiguous core radiating only to a maximum distanceof fifteen kilometres from the GPO. Today, residentialdevelopment has claimed much of the available land onthe Adelaide coastal plain and has extended to the edgeof the Hills Face Zone. Development has also increasedin Stirling in the heart of the Adelaide Hills and mostrecently further east to Hahndorf and Mount Barker. Itnow extends as far north as Gawler in the north and asfar south as Port Noarlunga and Seaford Rise.Adverse effects of urban sprawl. The expansion ofresidential development and its associated serviceindustries into the Mount Lofty Ranges raises seriousissues of wastewater disposal and increasedstormwater run-off and pollution in what is Adelaide’smost important potable water supply catchment area.This is already one of the most populated catchmentsin Australia and any further development will involveincreased waste disposal, increased stormwater run-off from expanded residential areas, effluent releasefrom wastewater treatment plants and increased
Rundle Mall, Adelaide, South AustraliaPhoto: South AustralianTourism Commission
KEY FACTS
• The Outer Adelaide Statistical
Division is the fastest growing
region in the State.
• In 2001 almost 81% of South
Australians lived in the
Adelaide and Outer Adelaide
Statistical Divisions, within an
80 kilometre radius of the
Adelaide GPO.

STATE OF THE ENVIRONMENT REPORT 2003 135
Map
6.3
: Abs
olut
e ch
ange
in e
stim
ated
resi
dent
pop
ulat
ion
by S
tatis
tical
Loc
al A
rea
– Ad
elai
deSt
atis
tical
Div
isio
n an
d So
uth
Aust
ralia
199
6–20
01SO
URCE
: PLA
NN
ING
SA
POPULATION AND URBAN FORM
Map
6.2
: Per
cent
age
chan
ge in
est
imat
ed re
side
nt p
opul
atio
n by
Sta
tistic
al L
ocal
Are
a –
Adel
aide
Stat
istic
al D
ivis
ion
and
Sout
h Au
stra
lia 1
996–
2001
.SO
URCE
: PLA
NN
ING
SA

136
6 Human Settlements
clearance of native vegetation to make way forhousing (see also chapter on Land Use). Urban sprawlalso increases the distances that people need totravel. This has implications for greenhouse gasemissions and air quality.Attempts at urban consolidation. An urban growthboundary has recently been established to arrest thisurban sprawl and encourage higher density residentialdevelopment and redevelopment in appropriate locationscloser to the city’s centre. As a result, the importance ofresidential demolition sites and infill development –particularly in the inner and middle suburbs – as a sourceof land for housing is likely to increase.
The broad environmental benefits of urbancontainment include reductions in greenhouse gasesthrough shorter journeys by car and increased publictransport patronage, and reduced pressure onagricultural land and native vegetation on areas at theurban fringe. However, the costs will include higherland prices and an increased reliance on public openspace and sporting and recreational facilities as higherdensity dwellings replace the traditional backyard.As redevelopment in established areas accelerates,the disposal of the rubble from the demolition of about1500 houses each year will need to be addressed.
Construction and demolition waste comprises53% of all waste send to metropolitan landfill (see alsochapter on Waste). There is also the danger that whilethe urban growth boundary will contribute to thecontainment of urban sprawl, its effect may also be toaccelerate development within the boundary. What infact is a greater constraint to growth is infrastructureprovision and the land release by the LandManagement Corporation.Loss of prime agricultural land. Within the areadesignated as metropolitan Adelaide, the only largeareas of relatively flat and accessible land are beyondthe northern and the southern edges of the urbancontainment boundary. These are currently devoted tointensive high value agricultural production.
The viability of these primary production areas isdependent on the Government maintaining the currentpolicies that protect those areas for agricultural pursuits,such as retaining rural land use zoning. The urban growthboundary rules out future urban sprawl. Without thisGovernment policy, expansion of residential developmentinto either the northern regions around Virginia or to thesouth around McLaren Vale and Willunga could threatenthe survival of agricultural industries that make majorcontributions to the State’s economy.
What are we doing about it?
The Planning Strategy, established under theDevelopment Act 1993, provides a tool to improve theintegration of a range of policies that influence, or areinfluenced by, urban development. At the time ofwriting, revision of the planning strategy is beingundertaken within an ecologically sustainabledevelopment (ESD) frame of reference. The Strategyhas separate volumes for metropolitan Adelaide andregional South Australia (the Regional PlanningStrategy). This update will focus on directions relatedto urban renewal and regeneration. It will be a majorchallenge to find new and effective ways to ensure
that population and urban growth is sustainable andprovides well designed environments, housing choicesand equitable access to services and employment.
In recognition of the importance of the outermetropolitan region, a Planning Strategy is to bedeveloped for the ‘Inner Region’ of Adelaide. Thisincorporates the Northern Adelaide Plains, Barossa,Mount Lofty Ranges and the Fleurieu Peninsula. TheInner Regional Planning Strategy will place emphasison protecting the Mount Lofty Ranges Watershed andviable agricultural land, minimising conflicts betweenland uses and the environment and maximisinginfrastructure provision in urban areas. PrimaryIndustries and Resources SA has initiated theDesignated Primary Industry Areas (DPIA) program
that will identify significant primary production areasthat are at risk from urban development. The protectionof these areas will be incorporated into the PlanningStrategy.
Via the Planning Strategy, the State Governmenthas implemented an Adelaide metropolitan urban
containment policy aimed at controlling urban sprawlthat otherwise would see ‘the country joining the city’and an accelerated loss of some of the State’s mostproductive agricultural land. This is a significantdevelopment and enforcement of this boundary willrequire Adelaide to grapple with the notion of denserurban development and its associated environmentalimplications.
With the introduction of an urban containmentboundary for the metropolitan region, priority will beplaced on the orderly staging of development to meetdemand, and the coordination of service provision toensure the efficient and timely delivery of keyinfrastructure such as roads. The Metropolitan
Development Program facilitates this by identifyingdevelopment trends in different sectors of theAdelaide region and providing population forecasts.
Planning SA has initiated the Development Plan
Improvement Program to review the system ofdevelopment. This is the first holistic review ofDevelopment Plans since 1982 and will forge strongerlinks with the Planning Strategy. A simplified approachto Development Plans will allow the focus to remainon priorities, including those relating to environmentalprotection and management.
The draft State Housing Strategy and the draftState Transport Plan have been released in 2003.These are fundamentally linked to sustainable urbandevelopment and represent a significant steptowards integrating urban design principles withtransport and housing.
The South Australian Housing Trust has embarkedon an Urban Renewal Program that aims toregenerate communities and provide improvedstandards of housing and better environments for living.A number of projects have commenced includingMitchell Park, Hawksbury Park, Hillcrest and Westwood.
The Green City Program aims to brand Adelaideas an internationally acclaimed green city – recognisedfor its environmental and sustainability initiatives.Success of the program will depend upon effectivepartnerships, community involvement and leadingedge sustainable development in the fields oftransport, energy, green buildings, water conservation,
Glenelg, Adelaide, South AustraliaPhoto: South AustralianTourism Commission
Housing constructed 3 metres froma watercoursePhoto: P. Hazell, EPA
Housing Development, Golden GrovePhoto: Clare Nicolson

STATE OF THE ENVIRONMENT REPORT 2003 137
POPULATION AND URBAN FORM
Map
6.4
: Pop
ulat
ion
of u
rban
cen
tres
and
rura
l loc
aliti
es 2
001
and
perc
enta
ge c
hang
e 19
96–2
001
SOUR
CE: P
LAN
NIN
G SA
Map
6.5
: Res
iden
tial d
evel
opm
ent o
f Ade
laid
e an
d en
viro
ns 1
830
to p
rese
ntSO
URCE
: PLA
NN
ING
SA

138
6 Human Settlements
waste minimisation and urban biodiversity. The newESD-based metropolitan Planning Strategy willprovide the overarching framework for the Green CityProgram. It is important that Government takes astrong leadership role in the Green City Program toensure its success. The appointment of a ’Thinker inResidence‘ is a good example of innovative initiativesin this area.
Urban green space is critical for the well-being ofpeople who live in urban areas. It provides a visual contrastto the built environment and allows the establishment ofrecreation and conservation areas adjacent to urbansettlements. The Metropolitan Open Space System
(MOSS) was developed in 1991 to establish a secondgeneration of parklands around Adelaide and includes landin both public and private ownership. A number of newinitiatives intend to build on the MOSS network includingthe Parklands 2036 initiative, Green City, One Million
Trees, the Greater Mount Lofty Ranges–Yurrebilla
Project, Naturelinks and the Urban Forest Biodiversity
Program. When completed these programs combinedwill provide a continuous open space across Adelaide andthe Mount Lofty Ranges that will enhance and protectnatural heritage and scenery, provide much needed wildlifecorridors and contribute towards biodiversity values.
For more information on programs and initiativessee the State of the Environment 2003Supplementary Report.
References
Australian Bureau of Statistics (ABS) (2002). Censusof Population and Housing, Selected Social andHousing Characteristics, Australia, 2001. CatalogueNo. 2015.0, Australian Bureau of Statistics, Canberra(Issued 17/6/2002)
Australian Bureau of Statistics (ABS) (2002).Demography, South Australia, 2001. Catalogue No.3311.4, Australian Bureau of Statistics, Canberra(Issued 12/12/2002).
Australian Bureau of Statistics (ABS) (2002). RegionalPopulation Growth, Australia and New Zealand 1991 to2001. Catalogue No. 3218.0, Australian Bureau ofStatistics, Canberra (Issued 25/7/2002).
Australian Bureau of Statistics (ABS) (20032). RegionalPopulation Growth, Australia and New Zealand2001–02. Catalogue No. 3218.0, Australian Bureau ofStatistics, Canberra (Issued 3/4/2003).
Australian Bureau of Statistics (ABS) (2003). Populationby Age and Sex, Australian States and Territories, June1997 to June 2002. Catalogue No. 3201.0, AustralianBureau of Statistics, Canberra (Issued 27/3/2003).
Planning SA, Spatial Planning Analysis and ResearchBranch (2000). Population Projections for SouthAustralia (1996–2026) and Statistical Divisions(1996–2016). Department of Transport and UrbanPlanning, South Australia, Adelaide.
Further information
Metropolitan Open Space Systemwww.planning.sa.gov.au/open_space/index.html
Parklands 21www.planning.sa.gov.au/parklands21/index.html
Planning SAwww.planning.sa.gov.au
Urban Forest Biodiversity Programwww.urbanforest.on.net
Yurrebillawww.yurrebilla.parklands.sa.gov.au
2 This reference should be referred to in order to updatethe preliminary Statistical Division and Statistical LocalArea estimated resident population data available whenthis chapter was drafted
King William Street, Adelaide,South AustraliaPhoto: South Australian TourismCommission
Adelaide CBD golf course

STATE OF THE ENVIRONMENT REPORT 2003 139
TransportTrends
• Trips by car in metropolitan Adelaide: UP by
12% on weekdays, 5.7% on Saturdays and
0.3% on Sundays between 1986 and 1999.
• Passenger kilometres travelled by car: UP by
150 million kilometres between 1997/98
and 2000/01.
• The number of vehicles per 1000 persons:
UP from 661 in 1997 to 699 in 2002.
• Vehicle registrations: up 3% between 1998
and 2002.
• Road freight tonne-kilometres travelled: UP
by 0.762 billion tonne-kilometres between
1997/98 and 2000/01.
• The number of people using public
transport: INCREASED 6% between 2000
and 2002 following a decade of decline.
• Age of South Australia’s vehicle fleet:
SLIGHT DECLINE from 12.1 years in 1998 to
11.9 years in 2002 – still above the national
average of 10.5 years.
Goal
South Australia’s Draft Transport Plan1 outlines thefollowing targets:• no rise in greenhouse gas emissions and other
pollution despite the rise in transport demand;• double walking and cycling trips by 2018;• increase the use of public transport to 10% of
passenger travel by 2018;• ensure safe and reliable access for regional, rural
and remote South Australia;• eliminate the road maintenance backlog by 2018;• ensure more efficient freight movement, with 75%
of interstate freight to go by rail and sea by 2018;• reduce fatalities and serious injuries 50% by 2018;• make better decisions through transparency and
efficiency.
What are the issues?
Transport is an essential component of humansettlements. It influences settlement patterns andliveability, is essential for economic performance andprovides opportunities for people to participate insocial, economic and recreational activities. Transportcan be broadly divided into two categories: passengertransport, which involves the movement of peopleusing vehicles such as cars, bikes, buses, trains, boatsand on foot; and freight transport, which moves goodsthrough several stages from the producer to theconsumer by road, rail, sea or air.
While transport provides a wide range of socialand economic benefits, it is also a significant contributorto environmental pollution. It causes air and noisepollution and is a major source of greenhouse gasemissions, particularly road transport. Rubbish thrownfrom cars is a major source of litter along roadsides.Urban stormwater carries oil and other vehicle andindustrial pollutants from the roads to rivers, streamsand the sea, impacting on water quality. Oil spills fromshipping can have a significant impact on marine life anddegrade beaches, while ballast water (particularly frominternational shipping) can introduce pest species intoAustralian waters. Recreational boating contributes towater pollution through fuel spillage and the dischargeof other wastes.
The level of environmental impact varies dependingupon the type of transport that is used. Road transport, inparticular the private car, is a major contributor topollution, particularly air pollution. From a South Australianperspective this makes our high dependency on theprivate car and our relatively low use of public transport amajor environmental concern. Adelaide’s urban sprawl tothe north and south contributes to greater car use astravel distances increase.
A key issue in minimising the environmentalimpact of transport is to reduce the need to travel and,where travel is necessary, to encourage moresustainable forms of transport. Personal mobility isimportant for all South Australians, thereforedecreasing the use of the private car while maintainingpersonal mobility is a significant challenge. Adequateprovision of, and easy access to, alternative transportservices such as public transport, walking paths andcycling routes, as well as the introduction of technicalinnovations to improve the efficiency and effectivenessof vehicles are key strategies that will lead to moresustainable transport use.
Information in this chapter focuses primarily on theeffects associated with road based transport, which isthe major contributor to environmental pollution.
See also chapters on Air Quality; Climate
Change; Energy; Health of the Marine and
Coastal Environment; Introduced Species; andWater Quality.
TRANSPORT
1 At the time of writing the Draft Transport Plan wasundergoing community consultation.
Public busPhoto: Transport SA
Congested trafficPhoto: Transport SA
KEY FACTS
• The private car accounted for
79% of weekday passenger
trips made in 1999.
• South Australia has the
second-oldest vehicle fleet
in Australia.
• Freight transport by road
produces 74% of total
greenhouse gas emissions
from freight transport, while
comprising 46% of the total
tonne-kilometres travelled.
• The number of people using
public transport has steadily
increased since 2000 following
a decade of decline.
• Adelaide has the world’s
highest percentage of
Compressed Natural Gas
(CNG) buses in a
metropolitan fleet.
Locomotive freight train

140
6 Human Settlements
Environmental indicators
PRESSURE INDICATORS
• Proportion of trips undertaken by privateand public transport (reported on in theState of the Environment Report 1998)
Changes in the proportion of passenger trips byprivate and public transport reflect changingtransport trends. The environmental effects oftransport depend on the mode of transport.Cars are generally the most, and walking andcycling the least, environmentally damaging.• Total annual passenger-kilometres
travelled by private and public transport(reported on in the State of the EnvironmentReport 1998)
The greater the distance travelled the greaterthe resource use and environmental impact.• Motor vehicle ownership and registrations
(reported on in the State of the EnvironmentReport 1998)
Higher levels of car ownership are generallyassociated with lower levels of publictransport use.
• Freight tonne-kilometres travelled (newindicator)
Road freight emissions are a major andincreasing source of air pollution and greenhousegas emissions.
RESPONSE INDICATORS
• Public transport patronage (reported on inthe State of the Environment Report 1998)
Increases in the number of trips made bypublic transport, rather than by car, hasenvironmental benefits.• Access to public transport stops and
service frequency (new indicator)The extent to which public transport is useddepends on the level of service provided aswell as the ease with which the service canbe accessed.• Kilometres of bicycle network (new
indicator)Provision of an adequate and safe bicyclenetwork encourages cycling.
FindingsMaking progressImproved services and enhancements to the public transport system have resulted in public transportpatronage increasing by 6% between 2000 and 2002 following a decade of decline.
A Draft Transport Plan for South Australia has been released for consultation. This identifies a vision for amore sustainable and integrated transport system.
Approximately 28% of the Adelaide metropolitan bus fleet is powered by Compressed Natural Gas (CNG)– the highest rate in the nation. The Passenger Transport Board’s Greenfleet project aims to plant enough treesto offset carbon dioxide emissions (a major greenhouse gas) from public transport.
Attention requiredSouth Australia remains a car-dependent society with 79% of all weekday trips made by the car in 1999.
Car ownership per capita has slightly increased since 1995 and remains above the national average.South Australia also has the second-oldest vehicle fleet in Australia with an average age of 11.9 years,compared to the national average age of 10.5 years.
Road freight transport is projected to increase substantially. This type of freight transport emits thehighest amount of greenhouse gases, and creates urban noise and amenity problems.
What more should we be doing?The Environment Protection Authority recommends that:6.10 Transport management policies, programs and measures are developed and implemented that focus on
an integrated approach to transport planning that takes account of land use and urban form. Newresidential developments should incorporate integrated transport networks that minimise environmentalimpacts while meeting the transport needs of the community.
6.11 Strategies and incentives are developed that focus on managing the demand for transport and shiftingtransport use from the car to public transport, walking and cycling. This will require significantimprovements to the public transport system and cycling facilities.
6.12 Policies are developed and implemented to reduce the age, improve the fuel efficiency and emissionsperformance of South Australia’s motor vehicle stock. There should also be investigation of the feasibilityof the greater uptake of electric and fuel cell vehicles to reduce transport emissions.
6.13 Policies are developed that encourage the greater use of rail and sea for freight transport to reduce ourreliance on road freight transport which is less efficient and more polluting. Policies should also bedeveloped to assist freight transport operators to adopt cleaner fuel types and modern enginetechnology in trucks.
6.14 Policies and programs are developed and implemented to protect the community living near majortransport corridors from unacceptable noise and air emissions.
Note: ‘Other modes’ includes trucks,motorcycles and taxis; public transportincludes trains, trams, metro buses,school buses and other buses.
SOURCE: TSA, 1986; TSA, 1999
Car
(Dri
ver)
Figure 6.7: Mode share (%) weekday,metropolitan Adelaide – 1986 & 1999
Mod
e sh
are
(%)
1986
1999
0
10
20
30
40
50
60
Car
(Pas
seng
er)
Pub
lic
Tran
spor
t
Wal
king
Bic
ycle
Oth
er M
odes
90%
Figure 6.8: Proportion of total domesticpassenger–kilometres travelled by road,rail, air and sea – 1997/98
2%
8%.02%
SOURCE: APELBAUM, 2003
Road
Rail
Sea
Air
89%
SOURCE: APELBAUM, 2003
Figure 6.9: Proportion of total domesticpassenger–kilometres travelled byroad, rail, air and sea – 2000/01
Road
Rail
Sea
Air
2%
9%.02%

STATE OF THE ENVIRONMENT REPORT 2003 141
What is the current situation?
PRESSURE INDICATOR: Proportion ofpassenger trips undertaken by privateand public transport
Passenger transport includes the movement of peopleby either private or public transport, as opposed tofreight transport, which involves the movement ofgoods. Private transport includes cars, motorcycles,bicycles and walking, while public transport includestaxis, trains, trams and buses. Around 89% of allpassenger trips are undertaken by road, whether byprivate or public transport.
The car is the most common form of passengertransport. In metropolitan Adelaide, 79% of allweekday trips made in 1999 were by private car.Walking accounted for 12.6% of trips, public transportfor about 4.6% of trips and the bicycle for 1.2% oftrips. Our use of the private car has remained relativelystable over the last decade with a slight increasebetween 1986 and 1999 for an average weekday.However, the number of trips made by publictransport, walking and cycling has significantlydeclined (Figure 6.7). Analysis of car use on theweekends versus weekdays indicates that our use ofprivate cars in 1986 compared to 1999 has increasedby 12% on weekdays, 5.7% on Saturdays and 0.3%on Sundays (Transport SA, 1986 & 1999). This reflectschanges that have occurred in the community’s workand recreation patterns.
Our reliance on the motor car to meet most ofour transport needs contributes to air, noise and waterpollution. Adelaide’s urban area, which is increasinglysprawling to the north and south, is increasing ourdependence upon cars as travel distances increase.The size of South Australia and its relatively lowdensity of settlements also increases our relianceupon the car as a major mode of travel.
PRESSURE INDICATOR: Total annualpassenger kilometres travelled byprivate and public transport
Road based transport accounted for nearly 89% of thetotal domestic passenger-kilometres travelled bypassenger vehicles in South Australia in 2000/01. Theremainder was by air (9%), rail (2%) and sea (less than1%) (Apelbaum, 2003). These figures are similar tothose from 1997/98 (Figure 6.8 and 6.9).
There is an increasing trend in the total distancetravelled by passenger vehicles. Between 1997/98 and2000/01 the total number of kilometres travelled by alltypes of passenger vehicles in South Australiaincreased by 0.53 billion passenger-kilometres (Figure6.10). Road transport accounted for 0.21 billionpassenger-kilometres, of this increase, 0.14 billionpassenger-kilometres can be attributed to the privatemotor vehicle.
PRESSURE INDICATOR: Motor vehicleownership and registrations
The number of vehicles using South Australia’s roadsis rising at a rate of around 1% per year. The numberof vehicles registered between 1998 and 2002increased by 3%, or 32,000 vehicles (Figure 6.11).Cars are the most common type of vehicle comprisingapproximately 80% of all registered vehicles.
The number of registered vehicles per person isalso increasing. The total number of motor vehiclesregistered per 1000 persons in South Australia hasincreased from 661 in 1997 to 699 in 2002. This isconsistently above the national average (Figure 6.12).
South Australia has the second-oldest vehicle fleetin Australia with an average age of 11.9 years. This hasdeclined slightly since 1998 when the average age was12.1 years, but is still above the national average of10.5 years. An ageing vehicle fleet has implications forvehicle efficiency and emissions from fuel use. Newermodel cars tend to be more fuel efficient and lesspolluting than older vehicles. Given that changes inmotor vehicle age are gradual, any new technologicaldevelopments to reduce the environmental impact ofvehicle usage will also be gradual.
PRESSURE INDICATOR: Freight vehicletonne-kilometres2 travelled
Freight transport is the mechanism by which goodsfrom the producer are delivered to a distributor orconsumer. Freight transport is critical to SouthAustralia’s economic development. Our contribution tonational exports is significant as wine, motor vehicle,grain and aquaculture industries continue to grow.
In Adelaide, as in most other large urban centres,the diverse range of goods, origins and destinations,short distances and the urgency of deliveries, meansthat road transport is the favoured method fordeliveries. Within Adelaide virtually all freightmovement occurs by road. Rail transport is used morefor interstate freight transport and to a lesser extentbetween regional locations, while international freightis transported mainly by sea or, for somecommodities, by air.
Figure 6.13 indicates that while the total freighttonne-kilometres travelled since 1997/98 has fallen,the freight task by road has increased. This hassignificant implications for greenhouse gas emissionsbecause within the freight transport sector, roadtransport is the single largest contributor togreenhouse gas emissions. While domestic freighttransport by road contributed 46% of total freighttonne-kilometres travelled in 1997/98, it contributed74% of total greenhouse gas emissions (Figure 6.14).
It is clear that to reduce greenhouse gasemissions from the road transport sector as a whole it
2 The unit ‘tonne-kilometre’ is formed by multiplyingfreight carried (tonnes) with the distance it is carried(kilometres). For example, 20 tonnes of freight carried200 kilometres equates to 4,000 tonne-kilometres.
TRANSPORT
1995
SOURCE: ABS, MOTOR VEHICLE CENSUS(CAT 9309.0)
Figure 6.12: Total motor vehiclesper 1000 population, Australia andSouth Australia
Num
ber o
f veh
icle
s pe
r 100
0
350
400
450
500
550
600
650
1996
1997
1998
1999
2001
2002
AustraliaSA
700
YEAR
SOURCE: ABS, MOTOR VEHICLE CENSUS(CAT 9309.0)
Figure 6.11: Total number of motorvehicle registrations all vehicletypes – 1971–2002
Num
ber o
f veh
icle
regi
stra
tions
(000
’s)
500
600
700
800
900
1,000
1,100
1971
1976
1979
1982
1985
1988
1991
1993
1995
1996
1997
1998
1999
2001
2002
YEAR
Note: (p) preliminary estimate by the AGCas at December 2002 based uponmodelling (1998/99 base).
2000
/01(
p)
Figure 6.10: Total domestic passenger –kilometres travelled (billions)
Pass
enge
r km
s (b
illio
ns)
0
5
10
15
20
25
30
Domestic AirRailDomestic ShippingArticulated TruckRigid TrucksLight Commercial vehiclesMotorcyclesBusesCar
1997
/98
1994
/95
1990
/91
1987
/88
1984
/85
YEAR

142
6 Human Settlements
is imperative that alternative modes of transport areused for carrying freight over longer distanceswherever feasible – such as rail and sea – coupled witha move to cleaner fuel types and modern enginetechnology in trucks. Effective strategies have toensure a level playing field with regard to cost. Atpresent, roads are funded by the general communityand are freely available to most road freight transport,while rail, shipping and air are priced to deliver profitsto the providers of this infrastructure, therefore makingit more expensive and less likely to be used totransport goods.
What impact does our continuedreliance on road transport have?
Some of the environmental, social and economiceffects associated with our continued reliance on roadtransport are outlined below.Air pollution and climate change. Road transport is asignificant contributor of greenhouse gas emissions.Transport is consistently the largest energy consumingsector in South Australia and remains the largestsingle source of air pollution. In 2001 the transportsector contributed 23% of South Australia’sgreenhouse gas emissions (see the chapter onClimate Change).Pollution of water resources. Stormwater run-offfrom urban roads can pollute the marine andfreshwater environments. Urban stormwater carries arange of pollutants from roads including tyre and metalfragments and harmful organic compounds. These canaffect aquatic plant and animal communities andreduce water quality. Oil from commercial shipping,and fuel spillages and other waste from recreationalboating also causes water pollution.Impact on human health. Although the motor car hasrevolutionised how people get around, it has negativeimpacts on the quality of life through pollution, odour,noise, loss of amenity, and safety. Our heavy relianceon the car means that we are becoming morephysically inactive, which also has an adverse impacton our health.Impact on social equity. A city designed to allow foreasy access to goods, services and employmentmeans shorter travel distances, greater choice ofmodes of transport, a more equitable society (i.e.improved accessibility for those without access toprivate transport), and a greater choice of residentiallocations. Not having to provide the infrastructure tosupport a car-dependent community translates into amore equitable use of land – such as more land forrecreational purposes.Economic costs of road transport. Economic costsassociated with motor vehicles include accidents,congestion, noise, costs associated with effects onhuman health, pollution control and repair, and the futuremitigation and adaptation costs of climate change.Private costs associated with vehicle use include carpurchase and maintenance, the costs of parking, as wellas petrol. Cycling, walking and public transport are morecost-efficient alternatives than using private transport.Noise. Transport also causes noise pollution, whichcan have a wide variety of consequences ranging from
sleep disturbance to educational and learningdifficulties. Transport noise above World HealthOrganisation standards affects around 14% of peoplein Adelaide (DTUP, 2003).
What are we doing about it?
RESPONSE INDICATOR: Publictransport patronage
In the 1970s public transport in South Australia washighly patronised due to a large increase in publictransport subsidies and rising oil prices. Since then ithas suffered a long term decline (Figure 6.16), an issuealso highlighted in the State of the EnvironmentReport 1998. This decline was temporarily interruptedin 1990–91 due to the introduction of free travel forschool children, however, during this period there werealso a number of public transport service reductions,including a significant lowering of night and weekendservices. Between 1995 and 2000, patronagedecreases levelled off (with one exception of asignificant decrease in 1998/99).
Since 2000 there have been a number ofinitiatives to increase the use of public transport,including service improvements, better marketing andimproved infrastructure. Subsequently patronageincreased by 6% between 2000 and 2002. The use ofpublic transport in South Australia in the twenty-firstcentury, particularly in Adelaide, has to compete withfactors such as higher incomes, busier lifestyles,increasing car ownership and continuing urban sprawl,which is increasing travel distances.
The Draft Transport Plan for South Australia aimsto increase the use of public transport to 10% ofweekday passenger travel by 2018 (in 1999 the aimwas around 5%).
RESPONSE INDICATOR: Access topublic transport stops and servicefrequency
In South Australia the Passenger Transport Board (PTB)is responsible for overseeing Adelaide’s metropolitanpublic transport network to ensure it provides servicesthat are safe and efficient, responsive to the transportneeds of the community and are also environmentallyfriendly. The PTB endeavours to ensure that publictransport services are within reach of as many ofAdelaide’s residents as possible, as well as ensuringadequate public transport links to major centres.
While the coverage of public transport services inAdelaide is regarded as relatively good it is onlyregarded as satisfactory in terms of service frequency.It is estimated that about 95% of suburbs are providedfor in terms of service coverage, while about 80% ofsuburbs are satisfactorily served in terms offrequency. Those suburbs adjacent to ‘Go Zones’receive much higher standards of service.
Go Zones were first introduced in April 2000 andhave services at least every 15 minutes from 7.30 amto 6.30 pm on weekdays. There are now eighteenGo Zones operating within the Adelaide metropolitanarea. The increase in patronage along routes that have
Note: (p) preliminary estimate by the AGCas at December 2002 based upon modelling(1998/99 base).
SOURCE: APELBAUM, 2003
Figure 6.13: Tonne–kilometres travelledby domestic freight – road, rail,sea & air
Tonn
e–km
s (b
illio
ns)
0
5
10
15
20
25
30
35
40
1984
/85
1987
/88
1990
/91
1994
/95
1997
/98
2000
/01(
p)
Road
Rail
Sea
Air
YEAR
Figure 6.14: Comparison of domestic freighttonne–kilometres for 1997/98 travelled byroad, rail, sea, and air and greenhousegas emissions (CO2 equivalents)
Tonn
e Ki
lom
etre
sGr
eenh
ouse
Gas
Em
issi
ons
SOURCE: APELBAUM, 2003
Road
Rail
Sea
Air
<1%
46%
23%
31%
9%
13%
4%
74%

STATE OF THE ENVIRONMENT REPORT 2003 143
GREENHOUSE GAS
EMISSIONS FROM ROAD
TRANSPORT IN SOUTH
AUSTRALIA
Greenhouse gas emissions fromthe transport sector as a wholehave declined by around 1%since 1995, however, emissionsfrom road vehicles (cars, trucks,buses, motorcycles) haveincreased by 7.6% over the 1988to 2001 period. Emissions fromroad vehicles account for 87% ofall transport emissions, more thansix times all other sources puttogether. Cars account for 64% ofall emissions from road vehicles(Figure 6.15). Emissions from carspeaked in 1995 and have sincefallen slightly, possibly due toincreased fuel efficiency.Between 1998 and 2001 therewas a sharp increase of 18%(230,000 tonnes) in emissionsfrom trucks – from articulatedtrucks more than from rigidtrucks. For more information seethe chapter on Climate Change.
had an increase in the level of service frequency issignificantly higher than non-improved service routes.
There are opportunities for improving publictransport services in Adelaide for both servicecoverage and frequency – particularly in lower densitysuburbs where improvements are desirable for socialinclusion and equity.
RESPONSE INDICATOR: Kilometres ofbicycle network
In the period 1998 to 2002, the amount of off-road bikepaths in Adelaide increased from 171 kilometres to220 kilometres. Similarly, on-road bike lanes increasedfrom 165 kilometres to 257 kilometres. In 2002 the totalon-road and off-road bike network amounted to around480 kilometres in the metropolitan area. Figure 6.17indicates trends in the growth of bicycle networks inAdelaide over the last decade.
Although Adelaide has a substantial network ofcycling lanes on roads, the network is of inconsistentstandard and has missing links. It is important tocomplete the cycling network and ensure an urbanenvironment that is safe and convenient toencourage cycling. It is also important to ensure thaturban design can accommodate bike riding. Thedesign of some low density residential developmentsin the 1990s was unsuitable for cycling and walkingdue to curvilinear roads and the extensive use ofcul-de-sacs (DTUP, 2003).
The Draft Transport Plan for South Australia aims todouble the number of walking and cycling trips by 2018.
Policy and programsThere has been a wide range of initiatives andprograms since the State of the Environment Report1998 that have focused on reducing the environmentalimpact of transport, particularly road transport. This is avery positive development. However, more needs tobe done to achieve a transport system that adequatelymeets the needs of all users, while at the same timeminimising the impact on the environment andensuring economic performance.
In April 2003 a draft State Government TransportStrategy was released by the Department of Transportand Urban Planning for consultation. This is the firstsince 1968. It identifies a framework and long termvision for South Australia’s transport future. TheTransport Plan for South Australia aims to improvefreight efficiency and personal mobility, reducegreenhouse gas emissions and promote a lifestylewhere everyone has equal access to employment,leisure and education opportunities.
To ensure the integration of land use planning andtransport the Planning Strategy for Metropolitan
Adelaide and the Planning Strategy for Regional
South Australia provide a basis for the integration ofeconomic, environmental and social strategies.Consideration of the needs of pedestrians, cyclists,public transport passengers and commercial freightdelivery in urban design is recognised in the discussionpaper Transport Choice and Urban Design (PlanningSA, 2000), which is concerned with urban rehabilitationand the need to promote transport choice.
Due to our consistently high level of road transportuse it is essential to implement strategies to reduceemissions through alternative fuel technologies. SouthAustralia is committed to action under the National
Strategy for Lowering Emissions from Urban Traffic
(2000). The Strategy focuses on actions to reducegreenhouse gas emissions from passenger transport inurban areas. A strategy to reduce emissions fromfreight vehicles has commenced.
The Commonwealth Government’s alternative
fuels programs are designed to reduce greenhousegases and other vehicle emissions from Australia’sroad transport sector. The programs incorporatedwithin this strategy include the Alternative Fuels
Conversion Program (AFCP), Compressed Natural
Gas Infrastructure Program (CNGIP) and the Diesel
and Alternative Fuels Grants Scheme (DAFGS).The Environmental Strategy for the Motor
Vehicle Industry aims to significantly enhance theenvironmental performance of the automotiveindustry. A mandatory fuel consumption labelling
scheme and the Fuel Consumption Guide have beendeveloped by the Australian Greenhouse Office to helpconsumers make informed choices about new carpurchases that will help reduce greenhouse gasemissions, while returning an economic benefitthrough lower fuel running costs. The FederalGovernment is also currently negotiating with industryto set National Average Fuel Consumption (NAFC)
targets for new passenger vehicles for 2005 and 2010.National programs are in progress to reduce the
environmental impact of freight transport, in particularroad freight. The former National Road TransportCommission has become the National Transport
Commission and will deal with both the road and railtransport sectors. Already there are national programsto encourage the shift of long distance freight fromroad to rail, and these are supported in South Australiaby Government programs for establishing‘intermodals’ where freight can be loaded from largetrucks on to rail and vice versa.
Public transport in South Australia must beimproved considerably. The Draft Transport Plan (DTUP,2003) acknowledges that we have the most run-downpublic transport system in Australia and that it iscurrently unable to meet changing land use, work andshopping patterns.
The Passenger Transport Board is determined toachieve a carbon neutral public transport system.Adelaide has the world’s highest percentage ofCompressed Natural Gas (CNG) buses in a metropolitanfleet. Together with alternative fuel technologies, carbonneutrality will be achieved by planting trees to offsetcarbon emissions from the public transport vehicle fleet.
Several initiatives and strategies have beenimplemented in an attempt to change travel behaviourincluding the implementation of Smart Stops, whichare currently being tested. Smart Stops ‘talk’ towaiting passengers telling them when the next bus,train or tram is due. It is anticipated that publictransport patronage will increase by 5% with thewidespread introduction of Smart Stops.TravelSmart SA aims to reduce greenhouse gasemissions, manage travel demand and promotehealthier lifestyles and communities.
TRANSPORT
Eyre Highway, the Nullarbor,Eyre Peninsula, South AustraliaPhoto: South AustralianTourism Commission
1988
Figure 6.15: Road vehicle greenhousegas emissions (CO2 equivalents)– 1988–2001
Emis
sion
s (m
illio
ns to
nnes
CO 2
equ
ival
ents
)
0
1
2
3
4
5
6
7
1991 1995 1998 2001
SOURCE: APELBAUM, 2002
Total
Cars
Trucks
Light Commercial Vehicles
Buses
Motorcycles
YEAR

144
6 Human Settlements
To increase alternative methods of transport andrealise the health benefits a walking strategy forSouth Australia is currently being developed, and atthe national level the Australian Cycling National
Strategy provides the framework for the delivery ofprograms designed to increase participation in cycling.The cycling strategy aims to double the use of bicyclesfor transport and recreation and to enhance the well-being of all Australians. In South Australia Bikedirect
provides a network of cycling facilities, maps and signsto assist cyclists to plan their trips across the Adelaidemetropolitan area.
For more information on policy and programssee the State of the Environment 2003Supplementary Report.
References
ABS (various years). Motor Vehicle Census. Cat 9309.0.
Apelbaum, J. (2002). The South Australian TransportTask, Primary Energy Consumed and Emissions:Part F – Summary Tables. Apelbaum Consulting Group,Report prepared for Transport SA, 20 pp.
Apelbaum, J. (2003). South Australian TransportFacts 2001.
Department of Transport and Urban Planning (DTUP)(2003). South Australia’s Draft Transport Plan: Towardsa Sustainable Transport Future. Government ofSouth Australia.
Transport SA (1986). Adelaide Household Travel Surveydatabase. Government of South Australia.
Transport SA (1999). Metropolitan Adelaide HouseholdTravel Survey database. Government of South Australia.
Planning SA (2000). Transport Choice and UrbanDesign: Design Issues for AccessibleNeighbourhoods. Government of South Australia.
Planning SA (2003). Planning Strategy for MetropolitanAdelaide January 2003. SA Government, Adelaide.
Further information
Alternative Fuels Conversion Program (AFCP)www.greenhouse.gov.au/transport/afcp/
index.html
Australian Greenhouse Officewww.greenhouse.gov.au
Department of Transport and Regional Serviceswww.dotars.gov.au
Planning SAwww.planning.sa.gov.au
South Australia’s Transport Planwww.dtup.sa.gov.au/transport_plan/index.html
Transport SA – Bikedirectwww.transport.sa.gov.au/personal_transport/
bike_direct/index.asp
Transport SAwww.transport.sa.gov.au
TravelSmart Australiawww.travelsmart.gov.au
Bike riding on the outskirts of AdelaidePhoto: Transport SA
1988
/89
SOURCE: PASSENGER TRANSPORT BOARD
Figure 6.16: Patronage by mode –1988–89 to 2001–02
Num
ber o
f jou
rney
s (m
illio
ns)
Bus/Tram
Train
Total
1989
/90
1990
/91
1991
/92
1992
/93
1993
/94
1994
/95
1995
/96
1996
/97
1997
/98
1998
/99
1999
/00
2000
/01
2001
/02
0
5
10
15
20
25
30
35
40
45
50
55
60
YEAR
Figure 6.17: Length of bike lanes & pathsin the metropolitan area
Kilo
met
res
SOURCE: BIKESOUTH, TRANSPORT SA
Paths
Marked Bicycle Lanes
0
50
100
150
200
250
300
350
400
450
500
Pre
–94
May
–98
May
–99
Jun–
00
Sep
–01
Oct
–02

STATE OF THE ENVIRONMENT REPORT 2003 145
WasteTrends
• Amount of solid waste sent to landfill:
approximately 1 tonne of solid waste for
every person in 2001/02.
• Liquid waste (subject to levies under the
Environment Protection Act): UP 6% since
1997/98.
• Household participation in recycling of
domestic waste: UP from 1996 to 2000
particularly for clothing and rags (up 19%),
plastics (up 14%) and garden waste (up 9%).
• Litter: UP 3% since 1998 after a downward
trend from 1998 to 2000.
• Amount of hazardous waste collected and
treated: UP 60% since 2000.
• Industry adopting eco-efficiency practices
has INCREASED since 1998.
• Beverage container return rates: STEADY
since 1998.
Goal
To minimise waste and resource use in accordancewith the waste hierarchy, with a long term vision forzero waste.Environment Protection Authority
What are the issues?
A growing economy and increasing population create arising demand for goods and services provided bybusinesses, industries and Governments. The maindrivers of waste generation in South Australia areeconomic growth, urban consolidation, householdformation trends with fewer people in more dwellings,under-provision of garden waste and other recyclingservices, and community attitudes. Our consumptionpatterns tend to be linear: we consume naturalresources to make products or provide services andwaste is generated as an end result. Waste is materialdiscarded, used up or left over in the course ofindustrial, commercial, domestic or other activities.
The majority of our solid waste (waste that is notin liquid form or hazardous) is sent to landfill depots fordisposal – an expensive and traditional approach.The rate at which we are sending waste to landfill isincreasing. Hazardous wastes – including radioactivematerial – pose a risk to human health and theenvironment and require special handling and disposal.The rate at which we are producing this waste is alsoincreasing. If managed improperly, waste can pollutethe land, air and water.
We need to minimise the waste we generate andrecycle as much as possible. Community participation inrecycling is increasing as a result of the recyclingservices provided by Local Government as part of‘kerbside’ weekly waste collection. Some level ofrecycling also occurs in the industrial and commercial
sectors, but these efforts must be increased. In aneffort to end our dependency on landfill, South Australiais now moving towards developing improved strategiesfor waste minimisation and waste avoidance and thecleaner operation of businesses and industries.
See also chapter on Land Use.
Environmental indicators
PRESSURE INDICATORS
• Annual amount and composition of solidwaste consigned to landfill (reported on inthe State of the Environment Report 1998)
The large amount of solid waste disposed tolandfill generates pollution and is potentiallywasteful of resources.• Amount and composition of litter
(reported on in the State of the EnvironmentReport 1998)
Amount and composition of litter providesuseful insights into consumer habits.• Quantity, composition and disposal of
hazardous wastes (reported on in the Stateof the Environment Report 1998)
Recording the volume, nature and source ofhazardous wastes is important in helping toprotect the environment from contamination.• Amount of liquid wastes collected and
treated (new indicator)Recording the volume, nature and source ofliquid wastes is important in helping to protectthe environment from contamination.
RESPONSE INDICATOR
• Amount of waste materials recycled(reported on in the State of the EnvironmentReport 1998)
Recycling plays an important role in solid wastemanagement, and should be encouraged toreduce the need for disposal, and protectfurther virgin materials being extracted,processed and used.
What is the current situation?
PRESSURE INDICATOR: Annualamount and composition of solidwaste consigned to landfill
The amount of solid waste we are sending to landfill inthe metropolitan area has increased over the last fiveyears (Figure 6.18). In 2001–02 about 1,115,000 tonnesof solid waste was sent to landfill in Adelaide –approximately one tonne of solid waste per person inthe metropolitan area. This is a 14% increase since theState of the Environment Report 1998 whenapproximately 980,000 tonnes of solid waste (or0.8 tonnes per person) was sent to landfill (1997–98figures). It is noted, however, that prior to 2000–01 theamount of waste disposed to landfill was largelyreported using an estimate based on vehicle size. Thissystem underestimated the actual quantity of wastedisposed to landfill. From 2000–01 waste disposed tolandfill is more accurately reported on the basis of
WASTE
Waste transfer station
KEY FACTS
• 53% of the waste we send to
landfill is from construction
and demolition activity.
• The amount of solid waste
sent to landfill in the
metropolitan area continues to
increase.
• 71% of material we put in our
garbage bins and send to
landfill is recyclable.
• The amount of litter is not
declining, despite public
education campaigns.
0.0
0.2
0.4
0.6
0.8
1.0
1.2
1991
/92
Note: Figures exclude cleanfill.
SOURCE: EPA
Figure 6.18: Metropolitan solid wastedisposed to landfill – 1991/92 – 2001/02
Solid
was
te (x
mill
ion
tonn
es)
1992
/93
1993
/94
1994
/95
1995
/96
1996
/97
1997
/98
1998
/99
1999
/00
2000
/01
2001
/02
YEAR
Balefill landfill

146
6 Human Settlements
CASE STUDY:The contents of adomestic garbage binA survey by Recycle 2000 (1998)found that, in 1998, the averagecontents of a domestic garbagebin (measured by weight)consisted of food (28.7%) andgarden waste (37.2%), followedby paper and cardboard (11.3%).A key finding of the survey wasthat around 72% of the wastefound in our domestic garbagebins could have been divertedfrom landfill.
In 2002 nearly 50% by weight ofmaterials in our domestic garbagebins was organic – 26% food and22% garden waste – and afurther 21% was potentiallyrecyclable via kerbside recycling(EPA, 2002). This means that in2002 approximately 71% ofmaterial in our garbage bins couldhave been diverted from landfill –there has been virtually noimprovement since 1998.
FindingsMaking progressA new waste management body – Zero Waste SA – has been announced to continually reduce the amount ofwaste going to landfill by working closely with State and Local Governments and relevant stakeholders toencourage everyone to recycle.
Although service standards differ, all of the metropolitan Adelaide Councils and 17 non-metropolitanCouncils now provide bottle, can, paper and cardboard recycling services meaning that around 86% of SouthAustralians have access to recycling services.
Container Deposit Legislation (CDL) continues to be very effective in reducing beverage litter. Newregulations have broadened the range of CDL beverage containers in an effort to further reduce this kind of litter.
A Radioactive Material Audit has been undertaken to determine the quantity, location and security ofstorage of radioactive material, including waste, in South Australia.
Attention requiredDespite an increase in the number of people recycling, the amount of waste going to landfill is increasing.Around one tonne of solid waste per person went to landfill in the Adelaide metropolitan area in 2002. This isdespite the fact that approximately 70% of the total waste discarded to landfill could be recycled andconverted into valuable products, re-used or composted. Information on treatment and re-use of liquidwastes is scant, although some recycling is undertaken.
Uptake of recycling practices remains low, predominantly due to solid waste landfill being a cheaperoption than recycling (although the cost to dispose to landfill has increased) and low revenue being generatedfrom recycling some waste materials.
Approximately 50% of waste materials going to landfill arise from construction and demolition activity.This material includes soil, clay, concrete and clean fill. Without waste minimisation strategies in place theamount of this waste will increase as a result of urban regeneration.
The amount of hazardous waste collected and treated in South Australia varies considerably from year toyear, but has risen by 60% since 2000, with major increases in the amount of contaminated soil andasbestos. Management practices for the storage and treatment of industrial hazardous waste at high prioritysites have been audited, but there is a need to ensure long-term best practice management for these andother priority sites.
KESAB Litter Surveys have shown an increase in the amount of litter items counted for 2002, after adownward trend in 2000 and 2001. Cigarette butts remain the main item recorded (44% of total itemscounted) despite an increase in butt bins and community education.
What more should we be doing?The Environment Protection Authority recommends that:6.15 Priority is given to the development of a Waste Management Strategy for South Australia, covering both
liquid and solid wastes, which ensures the establishment of waste recovery infrastructure, appropriatepricing regimes, and development and promotion of viable markets.
6.16 Kerbside service standards are implemented that achieve a minimum recycling yield of 2.5 kilogramsper household per week, that limit the maximum weekly waste bin capacity to 140 litres and thatprovide for bin-based green waste collection in metropolitan areas, in accordance with therecommendations from the Kerbside Waste and Recycling Audit (EPA, 2002).
6.17 State Government formulate a policy on the avoidance, reduction, re-use and recycling of waste arisingfrom its own business activities within the broader framework of sustainability and Greening ofGovernment (i.e. waste, energy, water).
6.18 Programs are developed to further enhance the awareness and uptake of eco-efficient practices byindustry, with the aim of improving environmental sustainability.
6.19 Government considers increasing the level of the deposit and the range of items eligible for CDL,beyond beverage containers, thereby avoiding greater waste disposal to landfill.
6.20 The construction and demolition sector be required to place greater emphasis on waste minimisationand the recycling of materials. This will require improvements in infrastructure to support the recyclingand re-use of these materials.
6.21 Household hazardous waste collection services are improved significantly to minimise the illegal andinappropriate disposal of household chemicals. Industrial hazardous wastes are managed and regulatedin accordance with international best practice.
6.22 South Australia’s radioactive waste management is improved based on the findings of the EnvironmentProtection Authority Radioactive Materials Audit.
6.23 Technological developments and strategies are supported to advance the on-site remediation ofcontaminated soils thereby reducing the amount requiring off-site treatment and disposal to landfill.
Figure 6.19: Contents of a domesticgarbage bin – 2002
Cardboard
Magazines
Contaminated Paper
Other Recyclables
Garden Waste
Dust/Dirt/Rock Ash
Other
Newsprint
Paper (Other)
CDL Material
Non-Recyclable Metals/Glass/Plastic
Food
Disposable Nappies
4% 3% 2%3%
6%
22%
5%
11%5%2%
3%
8%
26%
Note: ‘Other’ includes dry-cell batteries, household chemicals,pharmaceuticals, medical/hygiene, oil (motor and food),timber, ceramics, textiles, other glass and broken glass.‘Other recyclables’ includes all non-CDL metal, glassand plastic.
SOURCE: EPA, 2002

STATE OF THE ENVIRONMENT REPORT 2003 147
Litter clogging a street drain onWest Terrace, AdelaidePhoto Tony Jones, courtesy KESABEnvironmental Solutions
sludges and waste solvents. Levies are payable forliquid wastes that require treatment under theEnvironment Protection Act 1993. Waste oils andwaste solvents are normally recycled and so do notattract a levy payment. Figure 6.21 shows the amountof liquid wastes collected and treated by facilities inSouth Australia which are subject to levies payableunder the Act. This information shows that the amountof liquid waste collected and treated has increased by6% between 1997/98 and 2001/02.
The EPA also collects general information onliquid wastes2, which includes waste oil and wastesolvents collected as well as those subject to a levy. In2001/02 the total amount of liquid waste tracked wasapproximately 55,000 kilolitres, the predominantsources being waste oil/water mixtures (approximately40% of the total), grease trap waste (approximately25%) and waste oil (approximately 20%).
Liquid waste is treated via a number of techniquesincluding filtration and neutralisation. This waste may berecycled, composted, disposed to landfill or incinerated.
Limited information currently exists on the amountof waste recovered and re-used. Some initiatives havebeen undertaken such as composting treated greasetrap waste and treating and re-using waste oils assecondary grade fuels, such as that used to fuelindustrial boilers. Recycling of waste oils is currentlypromoted by a national financial incentive schememanaged through Environment Australia. Moreinformation, however, is required to identify the quantityand types of other liquid wastes (such as septic wastes)and further analyse the re-use and recyclingopportunities and markets for treated liquid wastes.
PRESSURE INDICATOR: Quantity,composition and disposal ofhazardous wastes
Hazardous wastes are substances that pose a risk tohuman and environmental health and require specialdisposal techniques to make them harmless or lessdangerous. They include inorganic chemicals, paints,resins, inks and dyes, organic solvents, pesticides,asbestos and clinical and pharmaceutical wastes.Hazardous wastes are generated mainly by thecommercial, industrial and trade sectors, includinghospitals, food outlets, food-processing plants, andchemical, paint and plastics manufacturers.
The amount of hazardous waste collected anddisposed of in South Australia for 2002 increased by60% over 2000 levels (Figure 6.22). This is due to alarger than usual amount of waste collected andtreated in 2002. This included low-level contaminatedsoil and asbestos from former industrial land, whichwas produced as a result of remediation anddevelopment of the land into residential uses. Clinicaland pharmaceutical waste was the next biggestcontributor comprising 10% of all hazardous waste in2002. Hazardous waste is recycled, incinerated ortreated prior to being consigned to landfill.
2 Information sourced from the EPA’s Waste Tracking(Manifest) System for the 2001/2002 financial year.Information is regarded as approximate only.
WASTE
1997/98
SOURCE: EPA
Figure 6.21: Liquid waste collectedand treated in South Australia, whichis subject to levies payable under theEnvironment Protection Act 1993– 1997/98 – 2001/02
Kilo
litre
s
0
5,000
10,000
15,000
20,000
25,000
30,000
35,000
40,000
45,000
1998/99 1999/00 2000/01 2001/02
YEAR
Res
iden
tial
SOURCE: KESAB ENVIRONMENTAL SOLUTIONS
Figure 6.20: Distribution of litter bylocation
% It
ems
Foun
d
0
5
10
15
20
25
30
35
40
45
Hig
hway
Rec
reat
iona
l Par
k
Ret
ail
Bea
ch
Indu
stri
al
Car
Par
k
Sho
ppin
g C
entr
e
1998
1999
2000
2001
2002
weighbridge data. Also, the increase in economicactivity and the resultant increase in building anddemolition works over the last few years hasincreased the amount of waste being generated.
A landfill audit conducted in 1998 (EPA, 2000)revealed that 53.1% by weight of the waste we send tolandfill is generated from construction and demolitionactivity including clean fill. Waste materials in thiscategory include concrete, bricks, tiles, steel, glass,metal, wood, asphalt and plastic. Domestic wastecomprised 27.5% by weight of waste sent to landfill andcommercial and industrial waste comprised 15.7% byweight. Around three-quarters of commercial andindustrial waste is comprised of mixed waste ingarbags, food/kitchen waste, cardboard, paper, wood,and plastic bags/film – all potentially recyclable.
In non-metropolitan areas it is estimated that atotal of 217,000 tonnes of solid waste was sent tolandfill in 2001/02, a 6% increase over the previousyear of 204,000 tonnes. Since 1997/98 the amount ofsolid waste sent to landfill in non-metropolitan areashas remained relatively constant at an average of212,000 tonnes per year. (See Case Study)
PRESSURE INDICATOR: Amount andcomposition of litter
Litter is a highly visible and offensive component ofthe waste stream. The continuing presence of litter inthe South Australian environment is a concern for bothGovernment and the community.
The KESAB Litter Index provides information onthe type of waste that ends up as litter on a seasonalbasis in South Australia. Litter items are countedquarterly at a number of sites that represent areascommonly subject to littering (e.g. residential areas,beaches, industrial sites, car parks, shopping centres,retail areas, recreational parks and highways). Datacollected since 1998 (Table 6.4) indicates that theamount of litter is not declining, despite publiceducation campaigns.
Table 6.4: Total number of litter items counted in
May KESAB litter counts 1998–2002
1998 1999 2000 2001 2002
Total numberof itemscounted 20,754 21,327 17,109 19,374 21,327
Source: KESAB Environmental Solutions
Cigarette butts remain the most numerous litter itemfound, representing an average 41% of litter recordedsince 1998. The contribution of cigarette butts to totallitter counts shows an increasing trend from 37.7% ofall litter items counted in 1998 to 43.9% in 2002. Litteris most often found along highways, followed by carparks and retail areas (Figure 6.20).
PRESSURE INDICATOR: Amount ofliquid wastes collected and treated
Liquid wastes received by treatment facilities includewaste oil, oil/water mixtures, grease trap waste(generally sourced from restaurant waste), paint

148
6 Human Settlements
A certain amount of hazardous waste is still beingdisposed of in domestic garbage bins. This includesdry cell batteries, household chemicals,pharmaceuticals and motor oil. The uncontrolledstorage and disposal of hazardous wastes can pose asignificant threat to public health and safety and to theenvironment. While some Councils and the EPAprovide household chemical collection and disposaldays, which are an extremely effective way ofmanaging domestic hazardous waste, it is clear thatservices for the recovery of domestic hazardouswaste must be improved.
Facilities involved in the storage and treatment ofindustrial waste require close attention andmanagement. The consequences of accidents at thesesites can be substantial and long lasting. A recentexample is the chemical fire at an industrial wastetreatment facility in Bellevue, Western Australia, inFebruary 2001. Continued efforts are necessary toensure the storage and treatment of industrialhazardous waste is managed in accordance with bestpractice standards.
While it is difficult to identify trends for particularhazardous waste types due to changes in the way thatthese substances have been reported, it is apparentthat more work needs to be done to reduce thevolume of hazardous waste being generated.
Radioactive wasteRadioactive waste is generated from the use ofradioactive materials in medical, research andindustrial processes. Australia’s radioactive waste iscategorised as low-level waste, short-livedintermediate-level waste and long-lived intermediate-level waste (DEST, 2002a). At present, this waste is intemporary storage at numerous locations aroundSouth Australia and Australia, including at hospitals anduniversities. Australia does not generate any high-levelradioactive waste.
In 2002/03 the EPA conducted an audit ofradioactive materials, including radioactive waste,stored in South Australia. The findings andrecommendations will be presented to the StateGovernment for its consideration.
On 9 May 2003 the Commonwealth announced apreferred site for the disposal of Australia’s low-leveland short-lived intermediate level radioactive waste.This site is located on a pastoral lease to the east ofWoomera. The South Australian Government opposesthe location of a national radioactive waste repositoryor store in South Australia, and Parliament has passedlegislation to prohibit its establishment.
What impact does disposing ourwaste to landfill have?
Some of the environmental, social and economiceffects associated with the disposal of waste to landfillare outlined below.Pollution of land, air and water resources. Poorwaste management practices can lead to the pollutionof surface and groundwater resources, air pollution,the generation of greenhouse gases (methane is amajor greenhouse gas that is released by landfill sites),site contamination and the generation of odours.
Hazardous waste. The improper disposal ofhazardous waste to landfill, stormwater drains, surfaceand underground water resources or seweragesystems can harm the environment, cause injury orharm to humans and other organisms.Increased consumption of virgin materials. Notrecycling waste materials increases the consumptionof virgin materials.Cost of landfill. A common misconception is that it isstill cheaper to dispose of waste materials to landfillrather than recover, re-use and recycle. However, assuggested by the Bureau of Industry Economics (1993),it is widely recognised that the cost of providing landfillin Australia is undervalued when the full costsassociated with disposal, closure, monitoring and othersocial and environmental factors are considered.Economic benefits of recycling. A study undertakenin 2001 examined the financial, environmental andsocial costs and benefits of kerbside recycling inAustralia. It found that by including an expression ofthe benefit to the environment in dollar-terms (basedon conservative estimates) together with recycling andcollection costs, an average net benefit of $42 dollarsper household per year was gained from kerbsiderecycling (NOLAN-ITU, 2001).Impact on communities. The impact of the disposalof solid waste to landfill on the community includesreduced property values adjacent to landfill sites, therisk of fire, unsightliness, litter and nuisanceassociated with birds, dust, odours, pests and vermin.
What are we doing about it?
RESPONSE INDICATOR: Amount ofwaste materials recycled
Disposal of waste to landfillA number of initiatives have been implemented since2000 that have directly or indirectly increased the costof waste being disposed to landfill. This has the effectof enabling greater viability for recycling practices.Such initiatives include:• the introduction in mid-2000 for weight-based
charging as the basis for payment of levies todispose of solid waste to landfill;
• improved landfill design standards for new andupgraded landfills ensuring better environmentalperformance;
• legislation being passed to close the Wingfieldlandfill by the end of 2004;
• legislation being passed in 2003 to effectivelydouble the solid waste levy.
Non-domestic recyclingThe actual amount of construction and demolitionmaterials being recycled is unknown, however, asignificant amount (primarily concrete and asphalt) isrecycled either on-site or by diverting loads to recyclingfacilities (EPA, 2001b). Similarly, the amount ofcommercial and industrial waste that is recycled isunknown, although it is recognised that a significantamount of recycling occurs within industry. Manyindustries in South Australia have already responded tothe challenge of waste minimisation and resource
Prior to the 2000 Olympic Games,3000 bags of litter were collected alongthe Dukes HighwayPhoto: Tony Jones, courtesy KESABEnvironmental Solutions
Hazardous waste
Domestic recycling
1994
Figure 6.22: Generation of hazardouswaste substances in South Australia– 1994–2002
Kilo
litre
s (0
00s)
0
20
40
60
80
100
120
140
1995
1996
1997
1998
1999
2000
2001
2002
SOURCE: EPA
Total Amount of HazardousWaste Generated (Kilolitres)
Wastes Requiring SpecialHandling (inc. ContaminatedSoils, Friable and Non-friableAsbestos)
YEAR

STATE OF THE ENVIRONMENT REPORT 2003 149
recovery through the adoption of cleaner productionmethods and recycling and re-use.
Domestic recyclingParticipation in recycling is dependent upon communityattitudes and education, as well as the provision andtype of collection services by Council. All metropolitanCouncils, and 17 non-metropolitan Councils, providesome form of domestic recycling service for bottles,cans, paper and cardboard. The average participationrate of residents who have a recycling service forbottles, cans, paper and cardboard is approximately64%. However, only 12 of the 19 metropolitan Councils,and one non-metropolitan Council (Mount Gambier)provide for the collection of garden waste. Theparticipation rate for households that are provided witha green waste recycling service is approximately 35%.Garden waste comprises around 22% of total domesticwaste, so there is further scope to reduce the amountof this material going to landfill. Newspapers comprisearound one-third of all waste materials recycled(Figure 6.23).
A comparison of recycling figures from 1992,1996 and 2000 shows that participation in recyclinghas increased for all surveyed materials (Figure 6.24).There is no data available on the quantities ofmaterials recycled.
In addition to kerbside recycling, Container DepositLegislation (CDL) has been effective in reducing litterand diverting most beverage container waste fromlandfill (around 3% of waste found in our domesticgarbage bins comprises CDL materials). Changes toSouth Australia’s Container Deposit Legislation inJanuary 2003 mean that now an even broader range ofdrink containers carry a refundable deposit.
Policy and programsApproximately one tonne of solid waste per personper year is still being disposed to landfill despite anumber of innovative approaches being introduced. Itis clear that there must be an improvement in the waythat waste is managed in South Australia if we want tosee a reduction in the amount of waste sent to landfill.
In an effort to bring about waste managementreform in South Australia, the State Government hasestablished Zero Waste SA. This new wastemanagement body will work with the community,State and Local Governments, and the recycling andwaste disposal industries to develop an integratedwaste reduction strategy that will underpin efforts toachieve zero waste to landfill. This will involvelegislative change and an increase in the wastedisposal levy to fund reforms.
The Environment Protection Authority willcontinue to provide a regulatory basis for wastemanagement reform in South Australia and will workwith Zero Waste SA to achieve the State’s long termvision for waste management. The EnvironmentProtection Authority (EPA) is developing anEnvironment Protection Policy (EPP) for waste thatwill establish specific standards and guidelines forwaste management.
The EPA led an interagency audit in 2002 of highpriority sites responsible for managing industrial
hazardous waste. Agencies responsible foroccupational health and safety and Government
WASTEWASTE
emergency response were part of the interagencyaudit team. The audits were primarily aimed atidentifying the potential for major incidents andresulted in a number of recommendations on issuessuch as labelling, storage and contingency planning, aswell as, the need for effective coordination betweenthe responsible agencies in the event of an incident.The recommendations have been approved and arecurrently being implemented.
There is a growing movement among SouthAustralian businesses towards eco-efficiency, whichmeans producing goods and services with less energyand fewer raw materials, resulting in less waste,pollution and cost. The increasing support foreco-efficiency means a challenge to the belief thateconomic objectives and environmental sustainabilityare incompatible. The number of attendees andbusinesses at eco-efficiency workshops conducted bythe EPA has been steadily increasing since 1998.
The Government also completed a major reviewof licensing arrangements under the Act in 2003,with a number of reforms implemented. The reformswill be made available to all licensees including theintroduction of financial incentives to encourageimproved environmental performance andachievement of best practice environmentalmanagement standards. Under the reforms, licenseeswill be offered licence fee reductions in exchange forentering into environment performance agreementswith the EPA that commits them to sustainedreductions in emissions of pollutants and generationof waste.
Implementing a certified Environmental
Management System is a commitment to preventingpollution and improving environmental performance.Since the commencement of the internationalstandard for Environmental Management Systems(ISO 14001) in January 2003, at least 60 businesses inSouth Australia have achieved the certification of oneor more of their sites. There are also a significantnumber of businesses in South Australia that have anEnvironmental Management System but do not haveformal ISO certification.
The National Packaging Covenant, established in1999, is a national agreement for managing packagingwaste. It aims to minimise the environmental impact ofpackaging waste, close the recycling loop and developeconomically viable and sustainable recycling collectionsystems. A total of 68 South Australian companies havesigned the National Packaging Covenant as at 30 June2002, a significant increase from the previous year ofonly eight signatories. Over half of the signatories comefrom South Australian winery organisations, indicating astrong commitment from that sector to address itspackaging wastes.
For more information on programs and initiativessee the State of the Environment 2003Supplementary Report.
Figure 6.23: Contents found in thedomestic recycling stream – 2002
SOURCE: EPA, 2002
Cardboard
Magazines
Liquid Paperboard
CDL – PET(polyethylene terephthalate)
Non-CDL Glass
Other Recycles – Plastics
Contamination
Newsprint
Other Paper
CDL – Glass
CDL – Aluminium Cans
Other Recyclable – Steel and Aluminium
Non-Recyclable Plastics
32%
5%3%
17%
<1%1%
10%
12%1%4%2%
3%
9%
‘HDPE’ is High Density Polyethylene drain pipe.‘PET’ (polyethylene terephthalate) is the plastic that is
commonly used to make soft drink bottles.
KEY FACTS
• Around 64% of South
Australians participate
in recycling.
• The South Australian
Government has a long term
vision of ‘zero waste’ for
South Australia.

150
6 Human Settlements
References
Australian Bureau of Statistics (ABS) (2000).Environmental issues: People’s views and practices.Cat. No 4602.C.
Bureau of Industry Economics (1993). Occasionalpaper 12 – Waste management and landfill pricing: ascoping study. Australian Government PublishingService, Canberra.
DEST (2002a). (website updated 30 September 2002)Radioactive Waste Management in Australia –Categories of Radioactive Waste.
EPA (2000). South Australia: Landfill Audit.Government of South Australia.
EPA (2001b). Re-use and Recycling of Clean Fill andBuilding and Demolition Waste. Consultancy reportprepared for the EPA by NOLAN-ITU Pty Ltd.
EPA (2002). Survey and Audit of Kerbside Waste andRecycling Practices and recommended KerbsideService Standards. Consultancy report prepared forthe EPA by NOLAN-ITU Pty Ltd.
NOLAN-ITU Pty Ltd (2001). Independent Assessmentof Kerbside Recycling in Australia. Reportcommissioned by the National PackagingCovenant Council.
Recycle 2000 (1998). 1998 Metropolitan Waste Analysis.Report prepared by APrince Consulting Pty Ltd.
Recycling depot
Pap
er
Figure 6.24: Participation in recyclingfor South Australia – 1992, 1996 & 2000
% P
artic
ipat
ion
0
10
20
30
40
50
60
70
80
90
Gla
ss
Can
s
Pla
stic
Bot
tles
Pla
stic
Bag
s
Kit
chen
or
Food
Was
te
Gar
den
Was
te
Old
Clo
thin
g or
Rag
s
No
Rec
ycli
ng
All
Item
s R
ecyc
led
SOURCE: ABS, 2000
1992
1996
2000
Pla
stic
Further information
Australian Waste Databasewww.civeng.unsw.edu.au/water/awdb/
awdb2.htm
Clean Up Australiawww.cleanup.com.au
Environment Protection Authority – Waste toResourceswww.environment.sa.gov.au/epa/waste.html
KESAB Environmental Solutionswww.kesab.asn.au
Waste Management Association of Australia (WMAA)www.wmaa.asn.au/index.html
WasteNetwww.wastenet.com.au

STATE OF THE ENVIRONMENT REPORT 2003 151
WaterConsumption inUrban SettlementsTrends
• Per capita water consumption in the
Adelaide metropolitan area: remains
STEADY at 460 litres per day in 1997/98 and
445 litres per day in 2001/02.
• Consumption of treated water for
agricultural use: UP by 50% between
1997/98 and 2001/02.
• Consumption of treated water for
industrial use: UP by 42% between 1997/98
and 2001/02.
• The quality of mains water supplied to the
Adelaide metropolitan area: CONTINUES TO
COMPLY with the national drinking water
quality guidelines.
• Re-use of treated wastewater: UP from 7.6%
in 1995 to 15% in 2002.
Goal
Drinking water should be safe to use and aestheticallypleasing. Ideally it should be clear, colourless and wellaerated, with no unpalatable taste or odour, and itshould contain no suspended matter, harmful chemicalsubstances, or pathogenic micro-organisms.Australian Drinking Water Guidelines 2001
To increase wastewater re-use at metropolitanwastewater treatment plants to 30% of availableeffluent by 2005;
To increase wastewater re-use at country wastewatertreatment plants to 24% of available effluent by 2005.SA Water Environmental Policy 2002
What are the issues?
This chapter focuses on the consumption, sources andquality of drinking-standard water in South Australianurban settlements. Potable water, as distinct fromwater extracted from bores, wells and streams, istypically treated water that is delivered via mains pipesto households, industry and commercial enterprises.The term ‘mains water’ and ‘drinking water’ will beused interchangeably in this chapter. The consumptionand quality of water extracted from bores, wells andstreams is discussed in the chapters on Water
Quality and Water Use.Fresh water is one of the world’s most valuable
resources, it is essential to human life and the naturalenvironment. South Australia is the driest State in thedriest inhabited continent in the world. We thereforeface unique challenges in terms of our waterconsumption, water storage, water sources and howwe ensure good water quality for consumers.
Water supplied to the urban settlements of SouthAustralia is extracted from the River Murray, surfacewater reservoirs (mostly in the Mount Lofty Ranges),groundwater in the South East, northern and westernareas of the State and, more recently, extracted fromthe sea. Our reliance on the River Murray for urbanwater supplies, either as a direct or a supplementarysource of water, is placing additional pressure on theRiver and adding to its degradation. In an average year,around two-thirds of Adelaide’s water comes from theRiver Murray.
South Australians continue to use approximatelyhalf of their mains treated water supply to maintaingardens. Improved watering practices could reduce thisdemand, while alternative sources such as urban run-offor treated wastewater could provide a substitute formains water for uses other than drinking.
Large domestic water supply reservoirs in theMount Lofty Ranges are depriving downstream riversand streams of water flows, which is affecting thehealth of aquatic ecosystems. The use of some riversand streams as aqueducts to transport water from theRiver Murray to reservoirs is degrading water qualityand changing natural flow regimes.
In an effort to reduce the impact on inland riversand streams and the marine environment, some of thetreated wastewater produced by wastewatertreatment plants is re-used for irrigation. Treatedwastewater is sewage that has been treated toremove most solids, rendering the final product 99.9%water. Some stormwater collected in the urbanstormwater system is used for environmental flows,re-used to irrigate parks and gardens, and for industrialuse, although the majority of stormwater and treatedwastewater is still discharged to the sea.
Providing mains water of good quality fromrelatively poor quality water sources is a major challengefor South Australia. The raw water supplying reservoirsmust be protected from pollution, be appropriatelytreated and not be contaminated during distribution toconsumers. A major concern is that most reservoircatchment areas do not have sufficient restrictions onsurrounding land uses that may affect water qualitythrough pollutant and sediment run-off. Intensivefarming, forestry, horticulture, transport and urban activityoccurs in most catchments. This ongoing and increasingactivity continues to risk the quality of water resources.The continued deterioration of water entering reservoirscould mean that additional forms of water treatment arerequired, subsequently increasing the cost of supplyinggood quality drinking water to consumers.
See also chapters on Health of the Marine
and Coastal Environment; Land Use; Water
Quality; Water Use.
WATER CONSUMPTION
Domestic hose
KEY FACTS
• The availability of a
sustainable, reliable and
economical source of water
underpins South Australia’s
future environmental health,
economic development and
quality of life.
• Providing good quality water
from relatively poor quality
water sources is a key
challenge for South Australia.
10%
13%
7%
5%65%
Note: ‘Other’ includes consumptionby public institutions, vacant land,public utilities, irrigation andrecreation.
SOURCE: SA WATER
Figure 6.25: Percentage of mainswater used by sector – 2001/02
Residential
Commercial
Industrial
Agricultural
Other
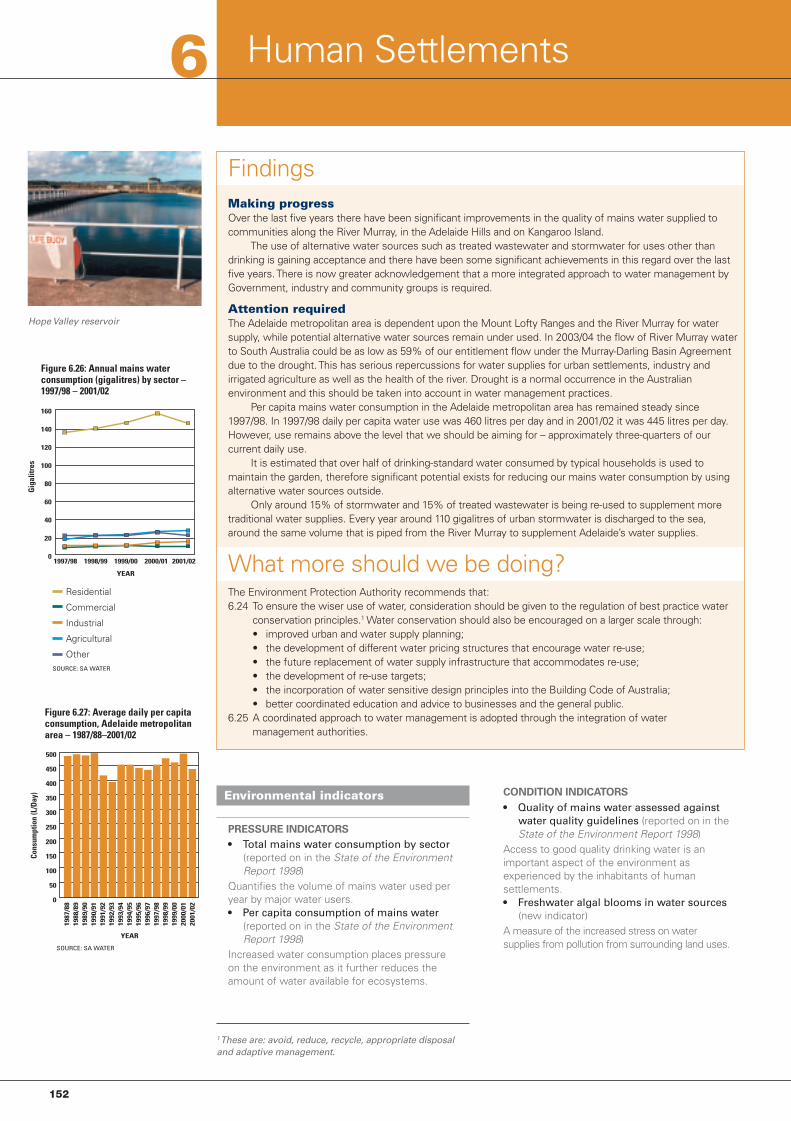
152
6 Human Settlements
FindingsMaking progressOver the last five years there have been significant improvements in the quality of mains water supplied tocommunities along the River Murray, in the Adelaide Hills and on Kangaroo Island.
The use of alternative water sources such as treated wastewater and stormwater for uses other thandrinking is gaining acceptance and there have been some significant achievements in this regard over the lastfive years. There is now greater acknowledgement that a more integrated approach to water management byGovernment, industry and community groups is required.
Attention requiredThe Adelaide metropolitan area is dependent upon the Mount Lofty Ranges and the River Murray for watersupply, while potential alternative water sources remain under used. In 2003/04 the flow of River Murray waterto South Australia could be as low as 59% of our entitlement flow under the Murray-Darling Basin Agreementdue to the drought. This has serious repercussions for water supplies for urban settlements, industry andirrigated agriculture as well as the health of the river. Drought is a normal occurrence in the Australianenvironment and this should be taken into account in water management practices.
Per capita mains water consumption in the Adelaide metropolitan area has remained steady since1997/98. In 1997/98 daily per capita water use was 460 litres per day and in 2001/02 it was 445 litres per day.However, use remains above the level that we should be aiming for – approximately three-quarters of ourcurrent daily use.
It is estimated that over half of drinking-standard water consumed by typical households is used tomaintain the garden, therefore significant potential exists for reducing our mains water consumption by usingalternative water sources outside.
Only around 15% of stormwater and 15% of treated wastewater is being re-used to supplement moretraditional water supplies. Every year around 110 gigalitres of urban stormwater is discharged to the sea,around the same volume that is piped from the River Murray to supplement Adelaide’s water supplies.
What more should we be doing?The Environment Protection Authority recommends that:6.24 To ensure the wiser use of water, consideration should be given to the regulation of best practice water
conservation principles.1 Water conservation should also be encouraged on a larger scale through:• improved urban and water supply planning;• the development of different water pricing structures that encourage water re-use;• the future replacement of water supply infrastructure that accommodates re-use;• the development of re-use targets;• the incorporation of water sensitive design principles into the Building Code of Australia;• better coordinated education and advice to businesses and the general public.
6.25 A coordinated approach to water management is adopted through the integration of watermanagement authorities.
Environmental indicators
PRESSURE INDICATORS
• Total mains water consumption by sector(reported on in the State of the EnvironmentReport 1998)
Quantifies the volume of mains water used peryear by major water users.• Per capita consumption of mains water
(reported on in the State of the EnvironmentReport 1998)
Increased water consumption places pressureon the environment as it further reduces theamount of water available for ecosystems.
CONDITION INDICATORS
• Quality of mains water assessed againstwater quality guidelines (reported on in theState of the Environment Report 1998)
Access to good quality drinking water is animportant aspect of the environment asexperienced by the inhabitants of humansettlements.• Freshwater algal blooms in water sources
(new indicator)A measure of the increased stress on watersupplies from pollution from surrounding land uses.
Hope Valley reservoir
1 These are: avoid, reduce, recycle, appropriate disposaland adaptive management.
1997/98
Figure 6.26: Annual mains waterconsumption (gigalitres) by sector –1997/98 – 2001/02
Giga
litre
s
0
20
40
60
80
100
120
140
160
1998/99 1999/00 2000/01 2001/02
Residential
Commercial
Industrial
Agricultural
OtherSOURCE: SA WATER
YEAR
1987
/88
SOURCE: SA WATER
Figure 6.27: Average daily per capitaconsumption, Adelaide metropolitanarea – 1987/88–2001/02
Cons
umpt
ion
(L/D
ay)
0
50
100
150
200
250
300
350
400
450
500
1988
/89
1989
/90
1990
/91
1991
/92
1992
/93
1993
/94
1994
/95
1995
/96
1996
/97
1997
/98
1998
/99
1999
/00
2000
/01
2001
/02
YEAR

STATE OF THE ENVIRONMENT REPORT 2003 153
RESPONSE INDICATORS
• Re-use of treated wastewater versusamount generated (reported on in the Stateof the Environment Report 1998)
Wastewater re-use can reduce the dependency onfreshwater reserves and reduce the impact fromdischarges to the sea.• Urban stormwater re-use versus amount
generated (reported on in the State of theEnvironment Report 1998)
Urban stormwater re-use can reduce ourdependency on freshwater reserves and reducethe impact from discharges to the sea.
What is the current situation?
Urban water sourcesNinety-five per cent of South Australians rely on mainswater (tap water) as their primary water source for alluses, with other sources being rainwater tanks (52%)and bottled water (24%) (ABS, 2001). Regarding waterfor drinking, around 33% of South Australians sourcetheir water from rainwater tanks (three times thenational average), and 16% use bottled water (morethan double the national average). One in ten SouthAustralians claim they do not drink tap water at all dueto the taste (ABS, 2001).
The Adelaide metropolitan and outer metropolitanregions (north and south) are dependent on both theRiver Murray and surface water stored in reservoirs inthe Mount Lofty Ranges Watershed2 predominantly forurban uses. Based on a five-yearly average, around61% of metropolitan Adelaide’s urban water suppliescome from the River Murray and around 39% from theMount Lofty Ranges. In a dry year up to 90% ofAdelaide’s water is taken from the River Murray.
In 2003/04 the flow of River Murray water toSouth Australia could be as low as 59% of ourentitlement flow under the Murray-Darling BasinAgreement due to the drought. This has significantramifications not only for domestic water supplies butalso for industry, manufacturing, irrigated agricultureand the environment. In order to cope with the lowflows, the State Government imposed waterrestrictions from 1 July 2003, aimed at achieving a20% reduction in water taken from the River Murray.
The South East and Eyre Peninsula regions arealmost exclusively dependent upon groundwater sources.As from December 2002 water restrictions have appliedon the Eyre Peninsula due to insufficient rainfall to refillgroundwater supplies. The Upper South East, northernSpencer Gulf, Mid North and Yorke Peninsula regions relyheavily on River Murray water transported through majorpipelines. The remainder of water sourced in these areas isfrom groundwater. The Riverland region is completelysupplied from the River Murray.
PRESSURE INDICATOR: Total mainswater consumption by sector
Mains water is supplied to households, commercialenterprises, industry, agriculture, public institutions,vacant land and public utilities. Figure 6.25 shows thepercentage of total mains water used by major sectorsin 2001/02 for South Australia. This indicates thataround 65% of all mains water supplied to urbansettlements is used in households.
Between 1997/98 and 2001/02 annual mainswater consumption for the residential, commercial,agricultural and industry sectors increased, althoughby varying amounts (Figure 6.26). The greatestincrease occurred in the agricultural sector (50%).Mains water, as indicated in Figure 6.25, representsonly a small portion of the total water used foragriculture, most of which is extracted fromunderground bores and surface water (see the chapteron Water Use).
PRESSURE INDICATOR: Per capitaconsumption of mains water
Adelaide’s water consumption per capita isamong the lowest when compared with otherAustralian capital cities, but is relatively high comparedto world standards.
Figure 6.27 illustrates the changes in daily percapita consumption over the last 15 years for all sectorscombined in the Adelaide metropolitan area. The figuresfor average per capita consumption have remainedrelatively steady. In 1997/98 the average daily per capitaconsumption was 460 litres per day, for 2001/02 thisslightly decreased to 445 litres per day.
CONDITION INDICATOR: Quality ofmains water assessed against waterquality guidelines
Metropolitan mains water qualityMetropolitan Adelaide is supplied with water from sixmajor water treatment plants: Anstey Hill, Barossa,Happy Valley, Hope Valley, Little Para and Myponga.These plants treat water stored in ten reservoirs,which is sourced from both the Mount Lofty Rangesand the River Murray. Water quality is measured by anumber of microbiological, physical and chemicalindicators and assessed against the Australian DrinkingWater Guidelines (ADWG) (NHMRC, 2001). SouthAustralia’s water supplies undergo extensive customertap sampling, and monitoring shows that mostindicators are within the limits imposed by the nationalguidelines (SA Water, 2002).
The most common and widespread health riskassociated with urban water in South Australia is thepresence of micro-organisms (e.g. E. coli,Cryptosporidium and Giardia) that can cause disease.These organisms are usually the result ofcontamination, either directly or indirectly, by humanand animal faeces and farm chemicals. Over the period1997/98 to 2001/02 the levels of E.coli measured inthe supply system did not exceed the ADWG.
KEY FACTS
• One in ten South Australians
claim that they do not drink
tap water due to the taste.
• A typical South Australian
household uses approximately
50% of its mains water to
irrigate the garden and in
summer this may rise to as
much as 80%.
2 The Mount Lofty Ranges Watershed is a managementarea that is regulated to protect water supplies tometropolitan Adelaide.
Reservoir
WATER CONSUMPTION

154
6 Human Settlements
With regard to physical quality, minor exceptionsin hardness in the Hope Valley system and manganesein the Myponga system were recorded. Hardness canmake the water difficult to lather and manganese mayaffect the taste of the water and cause staining.
Chemical water quality indicators generallycomplied with national guidelines with the exception ofTrihalomethane (THM) concentrations, which exceedednational guidelines on isolated occasions in the AnsteyHill system, although not in 2001/02. Trihalomethanesare formed as a by-product of chlorine disinfection. Theexceedences at Anstey Hill are a result of the supply ofchlorinated River Murray water extracted at Mannum.The additional chlorination causes the occasionalexceedence in THM concentration.
Country mains water qualityMains water quality in some country areas is of poorerquality than that of the Adelaide metropolitan area.However, since 1997/98 major treatment initiativeshave resulted in substantial improvements in thequality of mains water supplied to communities alongthe River Murray and in the Adelaide Hills as well as toPenneshaw on Kangaroo Island.
The percentage of samples free of E.coli compliedwith the ADWG during the period 1997/98 to 2001/02.
THM concentrations have exceeded guidelineson occasions in the Eyre Peninsula, OuterMetropolitan South, rural Murray Mallee and KangarooIsland (part of the Outer Metropolitan South) regions.
With regard to physical indicators, turbidity(cloudiness) is an issue for some small countrytownships, especially those in the Riverland andMurray Mallee regions, which rely on an unfiltered anddisinfected supply from the River Murray. Hardnessand salt concentrations are common issues in theSouth East region, due to the nature of groundwater inthe area. Compliance levels for these measures in theEyre region have also been poor.
Some water supplies in remote areas of the Statehave been declared ‘non potable’ by the SA WaterCorporation and the Department of Human Servicesdue to very poor source water quality. It is considereduneconomical to treat these supplies so that theycomply with the ADWG.
CONDITION INDICATOR: Freshwateralgal blooms in water sources
Cyanobacteria or blue-green algae are naturallyoccurring organisms that, under certain conditions, canincrease in numbers to produce a freshwater algalbloom. Most reservoir catchments do not havesufficient restrictions on surrounding land uses thatcan have an affect on the quality of source water. Forexample, the Mount Lofty Ranges catchments areintensively developed with farming, forestry,horticulture and residential activity. These activitiesgive rise to elevated levels of nutrients that increasethe risk of algal blooms.
During the period 1997 to 2002, the mostcommon blue-green algal species of concern,Anabaena circinalis, was detected 621 times in thereservoirs that service the metropolitan area with 92%of detections being low cell counts, and 270 times in
the River Murray with 96% of detections being lowcell counts. The growth of Anabaena was restricted tolevels below that of concern to human health.
What impact does not conservingwater have?
The consequences of not conserving water stem notonly from how much is consumed but also how it isused and how it is disposed of. The uncertaintiesassociated with climate change and the potential fordecreased water supply from catchments means thatwater conservation must become a priority in thefuture. Some of the environmental, social andeconomic consequences of not implementing waterconservation practices are listed below.Pollution of freshwater and marine environments.
Most of the water used by households ends up instormwater drains or the sewerage system. Moststormwater is directly discharged to watercourses andultimately enters the marine environment, whilesewerage system water is treated and then dischargedto the sea. This has a significant impact on the health offreshwater and near-shore marine environments. Thisimpact is particularly significant in metropolitan gulfwaters, which contain significant fish breeding andnursery areas. Greater re-use of urban stormwater andtreated wastewater would reduce this impact.Water restrictions. Continued over-use of water mayresult in water restrictions being enforced morefrequently and more severely, which will have aneconomic and social impact on consumers.Expansion of the water supply system. Withincreasing demand for water, expansion and upgradingof dams, reservoirs, pipelines and water treatmentinfrastructure will eventually be required, with increasedcosts to consumers and reduced environmental flows.Impact on the River Murray. Increasing demand onwater from the River Murray will place additionalpressure on the health of aquatic plant and animalcommunities, wetlands, rivers and streams. It will alsoimpact on water quality. This will, in turn, increasewater treatment costs for consumers and require thegreater use of chemicals in reservoirs.Implications for climate change. Increasing waterconsumption will mean increasing requirements forpumping and water treatment. The energy required toachieve this using traditional power methods will resultin increased greenhouse gas emissions.Increased costs for consumers. Water costs moneyand requires energy for heating. Reduced use willtherefore reduce costs to consumers in terms ofsavings made on water and energy bills.
What are we doing about it?
RESPONSE INDICATOR: Re-use oftreated wastewater versus theamount generated
Re-use of urban stormwater and treated wastewater,primarily for irrigating parks, gardens, vineyards andhorticultural crops and industry, provides
1999
/00
SOURCE: SA WATER
Figure 6.28: Wastewater re-use frommetropolitan WWTP’s – 1995/96–2001/02
Meg
alitr
es
0
10000
20000
30000
40000
50000
60000
70000
80000
90000
100000
2000
/01
2001
/02
1998
/99
1996
/97
1997
/98
1995
/96
Reused
Discharged
YEAR
1999
/00
SOURCE: SA WATER
Figure 6.29: Wastewater re-use fromcountry WWTPs – 1995/96–2001/02
Meg
alitr
es
2000
/01
2001
/02
1998
/99
1996
/97
1997
/98
1995
/96
Reused
Discharged
0
2000
4000
6000
8000
10000
12000
YEAR

STATE OF THE ENVIRONMENT REPORT 2003 155
WATER CONSUMPTION
opportunities to reduce the demand on moretraditional sources of water.
Metropolitan areaIn 2001/02 Adelaide’s four major metropolitanwastewater treatment plants (WWTPs) treated 91,000megalitres of effluent – enough to fill 45,000 Olympic-sized swimming pools. Around 15% of this treatedwastewater was re-used, the rest (around 77,000megalitres) was discharged into the sea.
The re-use of treated wastewater fromAdelaide’s metropolitan WWTPs is graduallyincreasing, up from around 8% in 1995 to the currentlevel of 15% (Figure 6.28). Considering that SouthAustralia is an international leader in developing thetechnology to re-use treated wastewater andstormwater more opportunities must be taken in thisregard to see our level of re-use increase.
SA Water, in cooperation with State Governmentand the private sector, has installed a new wastewaterre-use scheme at Bolivar WWTP, the largest of its kind inAustralia. Twenty-one per cent of all treated wastewaterproduced from the Bolivar WWTP is now piped to theVirginia region to supplement, and possibly ultimately tosubstitute, currently over-used groundwater resources.This is a significant development.
The Glenelg WWTP incorporates around 9%re-use and the Christies Beach WWTP around 18%re-use. The treated wastewater from the ChristiesBeach WWTP is piped by a privately-funded irrigationpipeline to the Willunga Basin to supplement thearea’s depleted groundwater supplies. The PortAdelaide WWTP, with zero re-use, is due to be shutdown in 2005. After 2005 the lower salinity sewagefrom the area will be separated and a new pumpingstation (commissioned at Queensbury) will transferthis sewage to the Bolivar WWTP for treatment andpotential re-use. The more saline sewage from thePort Adelaide area will be transported and treated inseparate facilities at Bolivar in order to avoid increasingthe salinity of the re-use effluent.
Country areasSouth Australia’s 19 country-based WWTPs treated atotal of 10,317 megalitres of effluent in 2001/02. Intotal, around 15% was re-used, 57% discharged tosea and 28% discharged to inland rivers and streams.Re-use of treated wastewater from country WWTPshas stayed relatively consistent since 1995/96 with14–15% re-use (Figure 6.29).
One hundred per cent of the treated wastewaterproduced from the Gumeracha, Mannum, MurrayBridge and Myponga WWTPs is re-used for variouspurposes including irrigation and wetlanddevelopment. Summer re-use at Millicent becameoperational in 2001/02. A summer re-use scheme atthe Bird-in-Hand WWTP was commissioned in late2001 and a re-use trial is currently being undertaken atthe Angaston WWTP. Wastewater from other countryWWTPs is discharged into either the sea or inlandrivers and streams.
RESPONSE INDICATOR: Stormwaterre-use versus amount generated
On average, South Australia generates 130 gigalitresof stormwater per year, 85% of which is generated inmetropolitan Adelaide. Much of this is discharged tosea, with only 20 gigalitres, or 15%, currently beingre-used, largely because of technical and economicbarriers to its storage for later use.
South Australia is an international leader in theuse of Aquifer Storage and Recovery (ASR) technologyin confined aquifers and it has been used increasinglysince the early 1990s to manage excess quantities ofstormwater, often when existing infrastructure isinadequate. ASR involves capturing large quantities ofstormwater (and less frequently, treated wastewater)and storing it in underground aquifers.
In some parts of Adelaide the urban stormwaterstored in ASR facilities is used to provide an alternativesource of water for the irrigation of parks and gardensand for other uses. Most new urban sub-divisions,such as Regent Gardens, Northgate and New Haven,now incorporate ASR facilities. At the Mawson Lakesdevelopment both wastewater and stormwater will betreated using advanced treatment technologies for re-use in homes and gardens. The City of Salisbury andG.H. Michell & Sons have worked together on aninnovative project to re-use stormwater for industrialpurposes (See Case Study).
The South Australian Government, CSIRO,Universities, Catchment Water Management Boards,Local Government and industry are driving these re-use initiatives. ASR technology has the potential torelieve the pressure on more traditional waterresources, including the River Murray. While we havemade significant progress over the last five years,more opportunities must be taken to use ASR toprovide a cost-effective alternative to supplying waterfor irrigation and industry.
Policy and programsThe State Water Plan 2000, Water Resources Act
1997, Catchment Water Management Plans andWater Allocation Plans provide a coordinated approachfor managing both water extraction and environmentalflows. The River Murray Act 2003 will provide a furtherframework for sustainable management of the River.
The River Murray Urban Users Committee
(RMUUC) is a community group working in partnershipwith Government agencies, other community groups,non-Government organisations, individuals andbusinesses to reduce the dependency of metropolitanAdelaide on water from the River Murray. The RMUUC isinvolved in a number of projects in partnership withGovernment agencies and community organisations. Thisincludes the Water Conservation Partnership Project
(WCPP). This project encourages water use efficiencyand the sustainable use of alternative water supplieswith Local Government and the community. It is a jointinitiative between Local and State Governments,catchment water management boards, industry and thecommunity. The project partners have recently releaseddraft best-practice water conservation principles forLocal Government, which have already been adopted by
Bolivar sewerage treatment tanks
KEY FACTS
• The South Australian
Government and industry are
world and national leaders in
developing water re-use
technologies, yet we only
re-use around 15% of treated
wastewater and stormwater.
• In 2001/02, Adelaide’s four
major metropolitan
wastewater treatment plants
treated 91,000 megalitres of
effluent – enough to fill 45,000
Olympic-sized swimming
pools. 77,000 megalitres of this
was discharged into the sea.
• In the driest State in the
driest inhabited continent,
110 gigalitres of urban
stormwater is discharged to sea
every year – around the same
amount that is piped from the
River Murray to supplement
Adelaide’s water supply.

156
6 Human Settlements
some Councils in South Australia to help reduce theirdependency on River Murray water.
The Waterwise program is another partnershipproject that is currently focusing its activities onreducing water use by industry.
On a wider basis, Catchment Water
Management Boards and Local Action Planning
Groups work cooperatively to educate the communityabout water conservation principles and practices.
In the Adelaide metropolitan area, theWaterProofing Adelaide Strategy seeks to provide along term, integrated strategy for ensuring that wateruse in Adelaide and adjacent areas is sustainable. It willtake into account changes to traditional water sourcesand consider the broader issues associated with there-use of urban stormwater and treated wastewater,environmental flows and water efficient urban design.
To ensure the provision of high quality drinkingwater and the protection of public health, SA Water’s
Drinking Water Quality Policy is a commitment toeffective water supply management.
Setting an appropriate price for water cancontribute to solving many water related environmentalproblems. Water pricing is a powerful mechanism thatcan be used to encourage water efficient practices andthe use of alternative sources. The State Governmenthas put in place a water pricing review to determine apricing structure that will lead to economic, social andenvironmental benefits.
The Metropolitan Local Government Chief
Executive Officer’s Association and Local
Government Association (LGA) have beenconsidering structures and funding arrangements formanaging stormwater in the Adelaide metropolitanarea. Following work by the two bodies the LGA hasmade recommendations about both short and longerterm actions. The emphasis in the short term is onalleviating flooding while also addressing environmentalissues and re-use opportunities. For the longer term thefocus is on a more structured sustainable approach withthe integration of stormwater into other aspects ofwater management.
The State Government has initiated a rebate
scheme for South Australians who elect to purchasewater-saving devices like tap-timers, water efficientshower heads and flow restrictors. The StateGovernment will pay a standard rebate of $10 per itemup to a maximum of $50, or $20 per item to amaximum of $100 for SA Water and/or Family andYouth Services concession cardholders. The rebate willgive people an incentive to install water efficientshower heads and flow restrictors on household tapswhile a rebate for tap-timers will assist with waterconservation in the garden. The rebate scheme will becapped at $1 million, an amount which will bereviewed in one year.
For more information on programs and initiativessee the State of the Environment 2003Supplementary Report.
References
Australian Bureau of Statistics (ABS) (2001).Environmental Issues: People’s Views and Practices.Cat No. 4602.0 March 2001
Department for Water Resources (2000). State WaterPlan 2000 – South Australia. Department for WaterResources, Adelaide.
National Health and Medical Research Council(NHMRC) (2001). Australian Drinking Water Guidelines.National Health and Medical Research Council.
SA Water (2002). Drinking Water Quality Report 2002.
Further information
Australian Bureau of Statisticswww.abs.gov.au
Australian Drinking Water Guidelineswww.nhmrc.gov.au/publications/synopses/
eh19syn.htm
CSIRO Urban Waterwww.cmit.csiro.au/research/urbanwater
Department for Environment and Heritage,Sustainability – Water Conservationwww.environment.sa.gov.au/sustainability/
conservation.html
Department of Human Services – Public Health SAwww.dhs.sa.gov.au/pehs/Default.htm
Department of Water, Land and BiodiversityConservation – Waterwww.dwr.sa.gov.au/water
MDBC – The Salinity Auditwww.mdbc.gov.au/naturalresources/
policies_strategies/projectscreens/Salt_audit/
salinity.htm
River Murray Urban Users Committeewww.murrayusers.sa.gov.au
SA Waterwww.sawater.com.au
United Waterwww.uwi.com.au/index.php
CASE STUDY: ParafieldPartnerships UrbanStormwater Initiative(PPUSI) – SalisburyThis project is a partnershipbetween the City of Salisburyand G.H. Michell & Sons –Australia’s largest woolprocessing company – withsignificant funding contributionsprovided by State andCommonwealth Government.The company uses largevolumes of water to wash wool(about 1 billion litres per year)and also produces largequantities of effluent and sludgewastewater.
The City of Salisbury hasdeveloped a series of reed bedponds on Parafield airport land(appropriately bird-proofed)where once ocean-boundstormwater is diverted forfiltration and cleaning beforesupply to Michell & Sons.Surplus water is stored in anaquifer for use during summer.This should save 1100 megalitresof water per year, whichotherwise would have beenpumped from the River Murrayto meet Michells’ demands.Sludge generated from Michell& Sons is being combined withgreen waste collected fromresidential properties to producea high quality fertiliser for thehorticultural and wine industries.
The Paddocks wetlands at SalisburyPhoto: City of Salisbury


