
STATE OF TECHNOLOGY 2017 FLOW MEASUREMENT
33
SPECIAL REPORT STATE OF TECHNOLOGY 2017 FLOW MEASUREMENT
Transcript of STATE OF TECHNOLOGY 2017 FLOW MEASUREMENT

SPECIAL REPORT
STATE OF TECHNOLOGY 2017
FLOW MEASUREMENT

www.controlglobal.com
State of Technology 2017: Flow Measurement 3
When and how to use pulse width modulation of controller outputs 5
Getting the most out of valve positioners 9
Maximum rangeability of linear valves 14
Orifice flowmeter rangeability 20
Flow of sandy condensate 25
Piercing thick flow problems 28
ADVERTISER INDEX
FCI 2
Siemens 4
Endress+Hauser 8
Badger Meter 13
Krohne 19
Acromag 24
TABLE OF CONTENTS

Flow Measurement
Exceptional performance and outstanding cost savings. With the SITRANS FS230 flow meter, you never need to compromise.Siemens Process Instrumentation - measuring everything that matters.
It’s new, it’s easy and it enhances your productivity. The SITRANS FS230 clamp-on ultrasonic flowmeter brings you market-leading accuracy of 0.5 to 1%, a best-in-class 100 Hz data update rate and unmatched noise immunity. And it’s so simple to use – from the customizable graphic display, setup wizards and patented pipe configuration menu to the removable SensorFlash® microSD card for streamlined servicing and settings transfer. The SITRANS FS230 can be integrated seamlessly into your automation system, too ‒ an advantage offered by the entire Siemens Process Instrumentation family, be it flow, pressure, level, weighing, temperature or valve positioning. Because we believe every business success begins with great measuring.
See howultrasonic measurement works.
www.usa.siemens.com/clamp

www.controlglobal.com
State of Technology 2017: Flow Measurement 5
When and how to use pulse width modulation of controller outputsGreg McMillan
In some applications, throttling of the manipulated flows is difficult or impossible. In the
biochemical industry, where precise (good resolution and sensitivity) throttling valves
without any crevices (to meet sanitary requirements) are rather limited (there are ex-
ceptions, such as the Fisher Baumann 83000-89000 series). Often, pulse width modulation
(PWM) is used to turn nutrient and reagent pumps on and off. In the chemical industry,
PWM is used to open and close valves whose trim would plug or whose stem would stick
if throttled. The sudden burst of flow from on-off action helps flush out the trim and wipe
the stem clean. PWM is correspondingly used for small reagent flows, corrosive fluids, and
slurries. It is also used to prevent flashing by a valve position that ensures a pressure drop
above the critical pressure drop. PWM is also used in temperature loops to turn heaters on
and off. Here, it is commonly called “time proportioning control” but the action is principally
the same. Temperature loops for extruders, silicon crystal pullers and environmental cham-
bers often use this technique.
All the applications of PWM have one thing in common; a capacity to filter or dilute the pulses
so that they do not appear as measurement noise in the controlled variable. PWM provides a
train of pulses that show up as a sawtooth in the measurement unless attenuated. The mass of
fluid and metal in a reactor, extruder, or crystal puller and mass of air in an environment cham-
ber must be large enough and the maximum pulse width small enough so that the amplitude of
the sawtooth seen is negligible.

www.controlglobal.com
State of Technology 2017: Flow Measurement 6
The rangeability achieved by PWM is basically
equal to the maximum pulse width divided by
the minimum pulse width. Since a valve must
reach a set position and the pump must reach
a set speed during the pulse, the minimum
pulse width is fixed by the pre-stroke dead-
time and stroking time of the valve or the rate
limiting of the speed and acceleration time of
pump. Usually, four seconds is adequate for
small valves and pumps. The maximum pulse
width is the pulse cycle time when the pulse
is almost continuously on. Since the pulse
cycle time also sets the time between succes-
sive pulses, it adds a maximum deadtime to
the loop that is about equal to the cycle time
when the pulse is almost continuously off.
For an average controller output of 50%, the
deadtime added is about ½ the cycle time.
Thus, the cycle time chosen represents a
compromise of the desire to maximize range-
ability and minimize the sawtooth amplitude
seen in measurement and minimize loop
deadtime. An additional consideration is the
wear and tear on the final control element.
Pumps, agitator and motor driven valves
have a maximum duty cycle that must not be
exceeded. Also, heaters in the motor starter
will trip for too short a cycle time because the
temperature rise from lack of cool down is
equated to an overload current. For valves,
periodic opening and closing will eventually
cause packing, seat, seal or trim failure.
The consequences and methods of mitiga-
tion of pulses are discussed in the 12/15/2014
Control Talk Blog, “Controller Attenuation
and Resonance Tips.” A simple equation to
predict the amplitude of pulses after attenua-
tion by the process or a filter that are seen by
the controller is discussed in the 12/02/2104
Control Talk Blog, “Measurement Attenuation
and Deception Tips.”
The generation of a pulse train is done by
special output cards or by the configura-
tion of function blocks on the PID output.
The heart of the configuration is a ramp that
resets itself periodically. An integrator (INT)
function block is employed to generate the
ramp. The configuration depends upon what
version of Distributed Control System (DCS)
or Programmable Logic Controller (PLC)
is used. For an integrator that will ramp up
towards a setpoint, the input to the integra-
tor is set equal to 100% divided by the de-
sired cycle time. The integrator setpoint is set
slightly larger than 100%. The ramp “on” time
or pulse width is determined by comparing
percent ramp value (integrator output) to
the percent controller output via a high signal
monitor (HSM) block. When the ramp value
exceeds the controller output, a discrete is
see equal to one (true), which opens a dis-
crete output or transfers in an analog output
value that corresponds to the closed valve
position or minimum speed. If the control-
ler output drops below the minimum pulse
width, the pulse is turned off by transferring
in a negative value before the ramp value is
used as the operand of the HSM block on the
output of the INT block. The PID low output
limit should be set to be slightly less than this

www.controlglobal.com
State of Technology 2017: Flow Measurement 7
minimum pulse width. The functionality of
blocks depends upon the DCS or PLC used
and any configuration must be extensively
tested before being used online.
For viscous fluids and slurries, a precise con-
trol valve may be continuously throttled until
the valve position gets so small that laminar
flow or plugging can occur. At this point (e.g.,
below 20% PID output), PWM starts. The
throttling valve position then stays open (e.g.,
20%) and an inexpensive on-off valve in se-
ries with the control valve is open and closed
by PWM.
There are many other applications of PWM.
Pulsed flows have been shown to increase
the yield of reactors, the separation in distil-
lation columns and the combustion efficiency
of burners. Pulse reagent flow has been very
successfully used to mimic a titration for
batch pH control. While many well designed
pulsed strategies can work for this applica-
tion, PWM on a proportional-only pH PID
controller retains a conventional operator
interface via the PID operator faceplate and
tuning via the PID gain setting. Also, the con-
troller output can be transferred in for the an-
alog output to reduce batch processing time
by providing pulses that are not only longer
but that are also larger (pulse width plus
pulse amplitude modulation). The gain of the
manipulated variable is now nonlinear and is
proportional to the controller output. Howev-
er, for proportional-only control of batch pH
processes, this gain change may be advanta-
geous and offset the low pH process gain
from the operating point being on the flat
portion of the titration curve at the beginning
of the batch cycle moving to the steep part
of the curve at the end of the batch. This is an
example of how a continuous control tech-
nique is also useful for batch processing.
PWM also dramatically reduces the effects of
deadband and resolution limit in the control
valve or variable speed drive assuming the
pulse amplitude is at least 5 times as large as
the suspected deadband and resolution limit.
This normally is the case if the amplitude is
> 5%. However, for valves designed for tight
shutoff, the backlash and stiction may be as
large as 10% requiring 50% amplitude.
You may want to check your pulse now to see
how excited you are about PWM opportunities.
You can read McMillan’s monthly Control Talk Column
printed in Control magazine.

Find out more about our complete level portfolio onwww.yourlevelexperts.com/113ghz
From the sum of 113GHz, we respond to any of your applications with the appropriate radar frequency. In terms of engineering, we supply the complete portfolio of radar instruments to you and optimize your process automation. On a personal note, we tune into your wavelength to understand what exactly it is that you need for your specific processes.
+113GHZYOUR WAVELENGTH
www.controlglobal.com
State of Technology 2017: Flow Measurement 9
Getting the most out of valve positionersGreg McMillan
Today’s smart digital valve positioners have incredible capability and flexibility as to
tuning, performance and diagnostics. Here we look at how to get the most out of
these positioners by tuning and by making sure the valve assembly does not hinder
performance and gives the position feedback needed.
First of all, the positioner needs to know the actual position of the internal flow element
(e.g., plug, ball, or disk). “High Performance” control valves often have the lowest cost
and least leakage and often a straightforward compliance with the piping specifica-
tion for isolation valves. The appearance of a win-win situation is the root cause of poor
performance that often cannot be fixed by even the best valve positioner. The feedback
measurement is often on the actuator shaft. Since “High Performance” valves tend to be
rotary valves, there is backlash and consequently deadband in the linkages and connec-
tions that translate actuator movement into valve stem movement. Then due to the high
sealing friction particularly near the closed position from the plug, ball or disk rubbing
against the seal, there is considerable friction and a poor resolution. In many cases, the
valve stem may be moving but the actual plug, ball or disk is not. This stem windup
(twisting) may eventually cause the internal flow element to jump to a new position
overshooting the desired position. The smart valve positioner that is measuring actua-
tor shaft position doesn’t see what is really happening in terms of stem and internal flow
element position.

www.controlglobal.com
State of Technology 2017: Flow Measurement 10
So what you need is a true throttling valve
and not an isolation or on-off valve posing
as a control valve. A true throttling valve
has a diaphragm actuator, splined shaft to
stem connections, a stem that is integrally
cast with the internal flow element (no
stem to element connections), and no rub-
bing of the element against the seal once it
opens. To achieve isolation you then install
a cheap low leakage on-off valve in series
downstream of the throttling valve. For pH
control, the on-off valve should be close to
the injection point to reduce reagent deliv-
ery delay upon opening.
Diaphragm actuators are now available
with much higher actuation pressures en-
abling their use on larger valves and higher
pressure drops. If you still need to go to
a piston actuator, the one with the least
sliding friction giving the best resolution
(best sensitivity) is the best choice (given
the reliability is good). Again, the posi-
tion shaft connections need to be splined
(keylock and pinned connections have a
surprising amount of play causing backlash
and shaft windup). The positioner feedback
mechanism must be properly adjusted to
give as accurate an indication of position
as possible.
Not all smart positioners have a good sensi-
tivity and sufficient air flow capacity. Spool
type positioners and low air consump-
tion positioners will cause long response
times for small and large changes in sig-
nal, respectively. Most tests done for step
changes in signal of 2% to 10% don’t reveal
a problem. High performance valves will be
lying to even the best positioners, making
diagnostics and supposed step response
capabilities invalid. For faster response on
fast loops, volume boosters should not re-
place positioners but be used on the output
of the positioner with its bypass cracked
open for stability.
Given that you have a good actuator,
A true throttling valve has a diaphragm actuator,
splined shaft to stem connections, a stem that
is integrally cast with the internal flow element
(no stem to element connections), and no rubbing
of the element against the seal once it opens.

www.controlglobal.com
State of Technology 2017: Flow Measurement 11
throttling valve and positioner you are
still not home free until you tune the posi-
tioner. We know from PID control, that a
loop’s performance is only as good as the
PID tuning. In fact the Integrated Absolute
Error and Peak Error are functions of the
tuning settings. A loop with great valve,
process and sensor dynamics will perform
as bad as a loop with poor dynamics if the
controller is poorly tuned.
Positioners have traditionally been high
gain proportional only controllers. If a
high gain sensitive pneumatic relay is
used in the positioner, position control
can be quite tight since the offset from
setpoint for a proportional only controller
is inversely proportional to the control-
ler gain. The offset is also of little conse-
quence, since the effect is rather minor
and short term with the process controller
correcting the offset. What the process
controller needs is an immediate fast total
response. There are much larger nonlineari-
ties and offsets that the process controller
has to deal with. The original idea of cas-
cade control is to make the inner loop (in
this case the positioner) as fast as possible
by maximizing inner controller gain, which
means going to proportional or propor-
tional plus derivative control. Integral ac-
tion in the inner loop is hurtful unless we
are talking about a secondary flow loop
for ratio control or feedforward control.
The advent of smarter positioners has led
to much more complex control algorithms
that include integral action. The use of
integral action may make the valve step
response tests look better by the final posi-
tion more closely matching the signal. Not
realized is that the positioner gain has to
be reduced and that integral action in the
positioner increases the instances of limit
cycles. In fact, with the process controller
in manual (positioner signal constant) a
limit cycle will develop from stiction in the
valve unless an integral deadband is set.
Also, the increase in the number of integra-
tors in the control system means that the
process controller with integral action will
develop a limit cycle from backlash since
there are now two integrators. So here
we have the common situation where an
attempt to make appearances look better
we have created a problem due to lack of
a fundamental understanding. Many posi-
tioners now come with the integral action
turned on as a default.
A loop with great valve, process and sensor
dynamics will perform as bad as a loop with poor
dynamics if the controller is poorly tuned.

www.controlglobal.com
State of Technology 2017: Flow Measurement 12
The solution is to omit integral action and
use the most aggressive gain setting. For
the Digital Valve Controller, this means
going to travel control instead of pressure
control. Overshoot of the setpoint is not a
problem as long as the oscillation quickly
settles out. Some overshoot helps in terms
of working through deadband and resolu-
tion limits faster and increasing the size of
the step seen by the positioner algorithm
with its sensitivity limits. In fact, a lead/
lag with lead time greater than lag time
on the input signal is sometimes used to
accomplish the same result. You should
not get hung up on the exact change in
position for a change in signal. For small
signal changes, the linearity due to resolu-
tion limits is going to look bad because
the resolution as a fraction of a small step
is large. The really important thing is that
the position changes quickly and the 86%
response time is fast. Positioners with
poor sensitivity and tuning may have a
response time that is an order of magni-
tude larger than possible. What the pro-
cess loop really wants is the manipulated
variable to respond quickly to its demands
and corrections. Also, for backlash, limit
cycles can be eliminated or at least the
amplitude reduced by a higher gain.
For much more on how to get good valve
rangeability and a sensitive and fast re-
sponse see the 5/01/2016 Control Talk Blog,
“Sizing up Valve Sizing Opportunities” and
the Control May 2016 feature article, “How
to specify valves and positioners that don’t
compromise control.”
Make sure this is not just talk. Put yourself
into a position to get the most out of valve
positioners.
What the process loop really wants is the
manipulated variable to respond quickly to its
demands and corrections.

Measure What Matters
Badger Meter understands you cannot manage what you do not measure. A worldwide leader in flow metering technologies, we offer one of the broadest product portfolios of flow measurement and
control instrumentation. From electromagnetic, Coriolis, ultrasonic, vortex, differential pressure, and positive displacement meters to advanced control valves, our solutions will help you improve the
efficiency and reliability of your operations.
Measure What MattersMeasure What Matters
www.badgermeter.com
INC-AD-00000-EN-01 (May 2017)

www.controlglobal.com
State of Technology 2017: Flow Measurement 14
Maximum rangeability of linear valves
QI happened to read your article, “Rangeability of equal-percentage control
valves” (Sept. 2013, p. 102). It was informative and crystal clear as to what range-
ability for =% control valves means. This is the first time my mind was getting
clear on this subject as I was reading sentence by sentence. Thanks so much, but I also need
some of the same information for linear control valves.
I’m using a pressure-independent balancing and control valve (PIBCV), flow range 180 l/h to
1,300 l/h, with a proportional actuator. It’s a linear control valve. Valve authority is 100% and
DP across these valves is constant. Please let me have more information about the range-
ability of these PIBCVs and also comment on the maximum rangeability I can expect. Is
1:300 possible by any chance, or is even 1:50 possible or not? I appreciate your response.
Milind Pawar
ABefore talking about your PIBCV, I will discuss control valve rangeability and char-
acteristics in general. (This topic is covered in more detail in Volume 2, Chapter
4.13 of my handbook).
If in a particular control loop our goal is to obtain quarter-amplitude damping, stable control
will be obtained if the loop gain (Gloop = controller output/measurement input) is about

www.controlglobal.com
State of Technology 2017: Flow Measurement 15
0.5. The loop gain equals the product of
the gains of the loop components. (Gloop =
Gprocess x Gsensor x Gcontroller x Gvalve).
Naturally, to obtain this loop gain on a fast
(high gain) process, the controller must be
tuned for low gain (wide proportional band)
and inversely, for a slow processes, the con-
troller gain has to be high.
One should use a linear control valve when
all the other loop components, including
that of the process, are more or less linear.
Note that a device or a process is linear if
their gains (% input/% output) are constant
throughout their ranges. For example, a
control valve is linear if its gain is constant
within its stroke range set by its rangeabil-
ity (Gvalve = maximum flow/100% stroke
= constant). Determining the best valve
characteristics for a particular application
can require complex dynamic analysis, but
for most common applications, my rules of
thumb are listed in Table I.
Valve rangeability is the ratio of maximum
to minimum controllable flow. The term
“controllable” is a matter of definition. I like
to limit the valve operation to a flow range
inside which the valve gain remains within
±25% of its theoretical gain. Figure 1 illus-
trates the rangeabilities of both a linear and
an =% valve. The dotted line #3 assumes the
theoretical gain of a particular linear valve
as 1.0, while the solid line #4 shows the ac-
tual gain of that linear valve. According to
my definition, the rangeability of that valve
is the ratio of maximum to minimum flows
within the flow range, where the actual
valve gain is within ±25% of the theoretical.
In this case, it is about 60%/3% = 20:1.
TABLE I: VALVE CHARACTERISTICS SELECTION GUIDE
ServiceValve characteristicpmax/ pmin < 2:1
Valve characteristic2:1 < pmax/ pmin < 5:1
Orifice-type flow Quick-opening Linear
Flow Linear Equal %
Level Linear Equal %
Gas pressure Linear Equal %
Liquid pressure Equal % Equal %
A TALE OF TWO VALVESFigure 1: Theoretical vs. actual characteristics of two valves tested by Les Driskell.
1
2
3
4
1 Theoretical gain characteristics of equal % valve2 Actual, inherent gain characteristics of equal % valve3 Theoretical gain characteristics of linear valve4 Actual, inherent gain characteristics of linear valve
2.5
2.25
2.00
1.75
1.50
1.25
1.00
0.75
0.50
0.25
0.125
Gain
1
2
3
4
10 20 30 40 50 60 70 80 90 100
% Flow
±25 of linear
±25 of =%
Smallvalve
Largevalve
VPC
Processcontroller
SP = 50%
Integral-onlycontrol mode
Gap action on error

www.controlglobal.com
State of Technology 2017: Flow Measurement 16
Now, as to the rangeability of the PIBCV
valve of AB that you asked about. This
valve is a 3/4-in., flow-limiting valve used
in HVAC applications to balance water
distribution among many radiators. While
the supplier calls this valve linear, its full
stroke lift is only 0.2 in., so while it can
be linear within that distance, the design
is bordering on quick opening. This valve
is good for providing a limit of maximum
flow within an adjustable range of 5:1, but
I would not use it for closed loop control,
only for flow limiting.
For the 50:1 or 300:1 rangeabilities you
mentioned, you need at least two linear
valves in parallel, a larger and a smaller one.
In high-quality linear valves, you can obtain
a rangeability of 20:1 in each.
Béla Lipták
AYou can find the mathematical
derivation of the installed flow
characteristics of a control valve
in Carlos Smith and Armando Corripio’s
Principles and Practices of Automatic
Process Control, 1st edition, John Wiley &
Sons, N.Y., 1985, pages 147-152.
I have my own derivations of the same, fol-
lowing the method used by Smith and Cor-
rpio. I obtained the same graphs as the ones
published in Smith and Corripio, albeit I used
Matlab software. If you would like me to send
you this material, you can contact me.
I’ve read that “rangeability goes up to infin-
ity” as published by a major control valve
manufacturer. These needle-type valves
were put in water spray service in a desu-
perheater, attemperation application. They
all failed. The stems had to be replaced at
every shutdown during 2000-09, when I
was a control valve specification holder. I
hope these help. Thanks for your interest.
Gerald Liu, P. Eng.
AMy ISA book (Wade, H.L., Basic
and Advanced Regulatory Con-
trol, System Design and Appli-
cation, 2nd edition—3rd edition available
soon) describes two possible ways to
increase valve rangeability:
• Install a small valve and a large valve to
operate in parallel; or
• Install a small valve and a large valve to
operate in sequence.
No valve is perfect. Every valve has some friction
involved in moving the stem, and thus some
uncertainty of position and flow.

www.controlglobal.com
State of Technology 2017: Flow Measurement 17
Small and large valves
operating in parallel
(Figure 2) depicts a
valve configuration
in which a small valve
and a large valve are
used in parallel. The
small valve is used for
moment-to-moment
control of the pro-
cess. The large valve
is operated by a valve
position control-
ler (VPC). Its measurement is the process
controller’s output. Or better yet, if a stem
position transmitter is available on the small
valve, then its output can be the measure-
ment of the VPC. The valve position control-
ler attempts to keep the small valve within its
operating range by increasing or decreasing
the large valve’s position whenever the small
valve approaches the upper or lower limits
of its range. The valve position controller is
an integral-only controller with a setpoint of
50%. It’s recommended that the control algo-
rithm should have a gap centered on either
side of 50% and within that gap, the effective
error is to be zero.
Reasonable limits for the gap are 20% and
80%. In this control system, the output signal
of the process controller always moves the
stem position of the small valve back to within
its range limits. This allows the large valve to
remain in its new position until the small valve
position reaches one of the limits of its gap.
The purpose of the
gap is to permit the
small valve to have
a reasonably wide
range of travel with-
out causing a “hunt-
ing” movement of
the large valve.
Small and large
valves operating in
sequence: If the pro-
cess turndown re-
quirements necessitate use of an equal-per-
centage valve characteristic (see Chapter
3 and Appendix A) with wider rangeability
than can be provided by a standard control
valve, then two equal-percentage valves,
one large and the other small, can be in-
stalled in parallel but operated in sequence.
The Cv’s of the valves should overlap, and
pressure switches or other logic devices are
provided to make sure that only one of the
valves will be open. Then the required Cv is
within the overlap range.
Also see Shinskey, F.G., Process Control
Systems, Application, Design and Tuning,
4th edition, pages 61-64 for more detail on
this approach.
Harold Wade
AThis is a great question and one
that I’ve considered for years.
The issue of valve rangeability is
COOPERATING ON THE RANGEFigure 2: Parallel valve operation for increased rangeability.
1
2
3
4
1 Theoretical gain characteristics of equal % valve2 Actual, inherent gain characteristics of equal % valve3 Theoretical gain characteristics of linear valve4 Actual, inherent gain characteristics of linear valve
2.5
2.25
2.00
1.75
1.50
1.25
1.00
0.75
0.50
0.25
0.125
Gain
1
2
3
4
10 20 30 40 50 60 70 80 90 100
% Flow
±25 of linear
±25 of =%
Smallvalve
Largevalve
VPC
Processcontroller
SP = 50%
Integral-onlycontrol mode
Gap action on error

www.controlglobal.com
State of Technology 2017: Flow Measurement 18
often misunderstood and ignored. No valve
is perfect. Every valve has some friction
involved in moving the stem and thus some
uncertainty of position and flow.
You’ll need to consider just how you want
to define rangeability. It’s not as simple
as it might seem. Typically, it’s defined as
maximum flow/minimum controllable flow.
You can expect a control valve to affect
flow even at very small opening, but the
problem is that, since the uncertainty of
valve stem position in mm is more or less
constant over the stroke range, this be-
comes a large portion of the stem position
at low flows. This uncertainty of, say, 1 mm
of stroke is a much larger percent at low
flows than that same difference when the
valve is nearly full open.
If you have access to the ISA standards,
please look at ISA 75.25.01 and 75.25.02.
The first defines all the terms and dem-
onstrates how they work, and the second
provides the background.
The short answer is that all valves I ever saw
suffered the problem that there is some small
change in input signal that doesn’t cause the
valve to move at all. That small change might
not be identical for an increase in signal as for
a decrease in signal. In other words, a valve
is likely to have a “memory effect” in that the
state of the packing is not the same after a
move up as it is moving down. There also are
differences between a slow rate of change in
signal and a faster rate of change in signal.
In real life:
• A more powerful actuator is likely to posi-
tion the valve more accurately.
• Some packing materials have less fric-
tion, and thus allow better accuracy of
positioning. If you don’t really need high-
temperature packing, don’t use it. Graph-
ite packings normally have much greater
friction than most others.
• An eager operator with a wrench can
tighten a control valve packing gland
enough to prevent any motion and any
control. It can be valuable to check valve
action if control problems exist.
• All control loops with reset action will cycle
their control valves. You can’t escape that.
You can’t tune the controller to eliminate
that. You can slow the reset and slow the
reset cycle. You can reduce the proportional
gain and hide the cycling. It will not go away,
but it can be reduced with a better actuator/
positioner and low-friction packing.
I once did an ISA paper describing how to
analyze the required control loop perfor-
mance to estimate the control valve perfor-
mance that has to be specified. One of the
conclusions was the requirement to con-
sider how fast the process can change and
also how accurately the flow needs to be
controlled. Keep in mind that control can’t
be perfect; never accept the demand for it.
Cullen Langford

High flow rates up to 101,400 lbs/hOPTIMASS 2400 – technology driven by KROHNE• Multiple straight tube Coriolis flowmeter in sizes DN100…400/4…16”
• Entrained Gas Management (EGMTM): reliable indication of gas entrainments, maintaining operation at all times
• Highest safety factor with optional pressure rating 180 bar/2,610 psi, PED approved secondary containment up to 150 bar/2,175 psi
• NACE compliant with Duplex or Super Duplex as wetted material
• ATEX, IECEx, CSA, FM, NEPSI, CEPAL, MID, OIML
factt/h
Download article: Considerations for Using Large Diameter Coriolis Mass Flow Meters in Oil & Gas Applications
products solutions services
t/ht/h
°Flb/cf
lb/hBPD

www.controlglobal.com
State of Technology 2017: Flow Measurement 20
Orifice flowmeter rangeabilityToday’s transmitters promise high turndowns, but other factors affect accuracy.
QI am measuring crude oil components (water, oil, gas) in a three-phase test sepa-
rator of capacity 3,000 barrels per day (BBD). I designed the orifice plates for
the oil and water to be of 1,500 BBD range. However, on actual testing, the oil per
well was found to be a maximum of 500 BBD, leading to inaccurate flow measurement. One
solution was to use multiple orifices to be swapped before testing each well, knowing ap-
proximately the capacity of the well in BBD and taking into consideration the orifice range-
ability. Or to use multiple transmitters.
I am thinking of using the existing orifice and transmitter (the existing transmitter range-
ability is 1:120) and changing the maximum range of the transmitter’s differential pressure
to approximately correspond to the well capacity, using the HART communicator. Will this
be a good solution to overcome the accuracy problem? Will the accuracy be as good as if I
used multiple orifices or transmitters?
Mohamed Amin, director, process control
Comex Commercial Co.
AIn the past, it was common practice to stack and switch transmitters or switch
orifice runs to increase rangeability while maintaining accuracy (Figure 1). This is
no longer necessary because the differential pressure (DP) cell rangeabilities have
www.controlglobal.com
State of Technology 2017: Flow Measurement 21
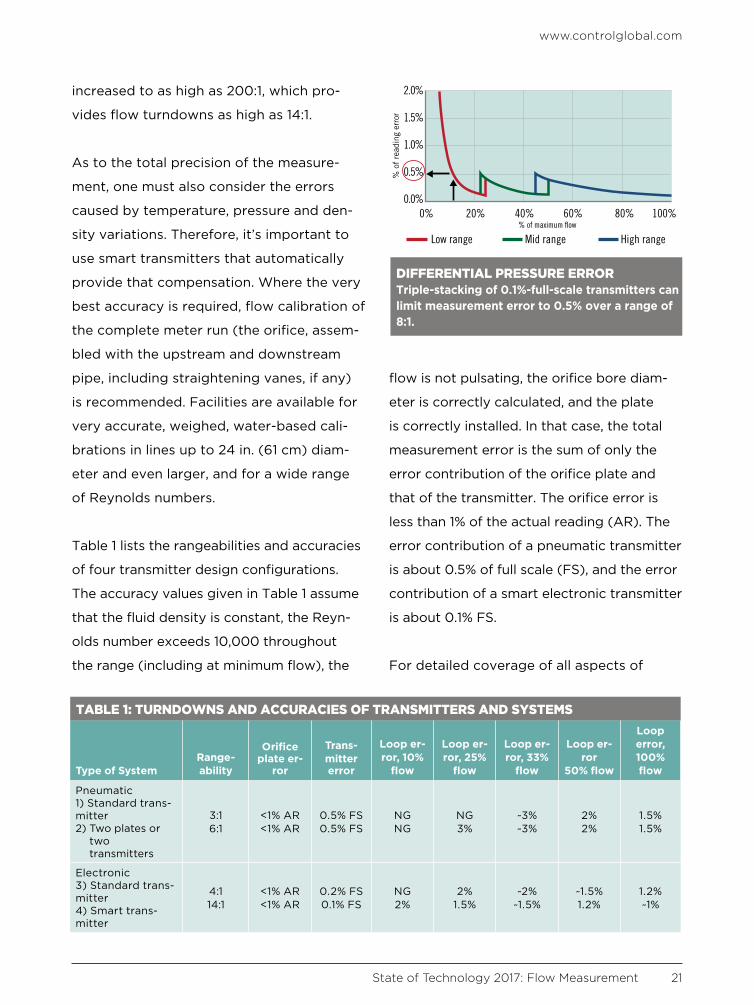
increased to as high as 200:1, which pro-
vides flow turndowns as high as 14:1.
As to the total precision of the measure-
ment, one must also consider the errors
caused by temperature, pressure and den-
sity variations. Therefore, it’s important to
use smart transmitters that automatically
provide that compensation. Where the very
best accuracy is required, flow calibration of
the complete meter run (the orifice, assem-
bled with the upstream and downstream
pipe, including straightening vanes, if any)
is recommended. Facilities are available for
very accurate, weighed, water-based cali-
brations in lines up to 24 in. (61 cm) diam-
eter and even larger, and for a wide range
of Reynolds numbers.
Table 1 lists the rangeabilities and accuracies
of four transmitter design configurations.
The accuracy values given in Table 1 assume
that the fluid density is constant, the Reyn-
olds number exceeds 10,000 throughout
the range (including at minimum flow), the
flow is not pulsating, the orifice bore diam-
eter is correctly calculated, and the plate
is correctly installed. In that case, the total
measurement error is the sum of only the
error contribution of the orifice plate and
that of the transmitter. The orifice error is
less than 1% of the actual reading (AR). The
error contribution of a pneumatic transmitter
is about 0.5% of full scale (FS), and the error
contribution of a smart electronic transmitter
is about 0.1% FS.
For detailed coverage of all aspects of
% of maximum flow
Low range Mid range High range
2.0%
1.5%
1.0%
0.5%
0.0%0% 20% 40% 60% 80% 100%
% o
f re
adin
g er
ror
% of maximum flow
Low range Mid range High range
2.0%
1.5%
1.0%
0.5%
0.0%0% 20% 40% 60% 80% 100%
% o
f re
adin
g er
ror
DIFFERENTIAL PRESSURE ERRORTriple-stacking of 0.1%-full-scale transmitters can limit measurement error to 0.5% over a range of 8:1.
TABLE 1: TURNDOWNS AND ACCURACIES OF TRANSMITTERS AND SYSTEMS
Type of SystemRange-ability
Orifice plate er-
ror
Trans-mitter error
Loop er-ror, 10%
flow
Loop er-ror, 25%
flow
Loop er-ror, 33%
flow
Loop er-ror
50% flow
Loop error, 100% flow
Pneumatic 1) Standard trans-mitter 2) Two plates or
two transmitters
3:1 6:1
<1% AR <1% AR
0.5% FS 0.5% FS
NG NG
NG 3%
~3% ~3%
2% 2%
1.5% 1.5%
Electronic3) Standard trans-mitter 4) Smart trans-mitter
4:114:1
<1% AR <1% AR
0.2% FS 0.1% FS
NG2%
2% 1.5%
~2% ~1.5%
~1.5% 1.2%
1.2% ~1%

www.controlglobal.com
State of Technology 2017: Flow Measurement 22
orifice-type flow measurement, refer to
Chapter 2.21 in Volume 1 of the 5th edition
of the Instrument and Automation Engineers’ Handbook.
Béla Lipták
AMy general comment is that many
of our instrumentation rules of
thumb are more than 40 years old
and completely invalid. It may be worth-
while to collect and revalidate these old
rules. Also, by solving some of the related
equations, one can determine the answers
to these types of questions.
Side issue: An erroneous concept is that
pressure and temperature (P,T) compensa-
tion is only used to calculate mass flow. As
shown by the equations below, P,T compen-
sation is (as the name implies) the means
to correct either mass or volume flow when
the temperature or pressure varies:
Flow (mass) = k*sqrt ( P*density)
Flow (volume) = k*sqrt ( P/density)
In evaluating the accuracy of orifice flow,
first consider transmitter accuracy and
rangeability. Modern transmitters have a
P rangeability of up to 200:1, which equates
to a flow range of almost 15:1. Modern trans-
mitters can detect the P with an accuracy
of <0.1% full scale (FS), and require recali-
bration about every 10 years. The old rule
that a second transmitter is to be used if the
flow range is greater than 3.5:1 was corect
when the old pneumatic P cells were used.
In determining the total flow measurement
error, transmitter accuracy is not the limit-
ing factor. The total error is a function of
many possible error sources.
On orifice installation (apart from the
straight run considerations), many orifice
plates are just sandwiched between two
flanges supplied by the piping group, and
the orifice plates are not properly centered.
Other installation error sources include im-
pulse tap diameters that are too big, orifice
tap location imprecise relative to the orifice
plate, and upstream and/or downstream pip-
ing is not concentric. The old British Stan-
dard BS 1042 (early 1960s) was probably the
best document to give a good understand-
ing of the accuracy constraints (I still refer
to it now in preference to the successor ISO
standards). An orifice installation of this type
used to be known as Class C, while if the
orifice was installed in carriers with honed
piping runs, that was called Class A.
Also, the Reynolds number is a key factor in
the orifice calculation, although if it doesn’t
vary much over the measurement flow
range, you don’t need to worry about it. The
steps in making the calculation are to first
do the orifice flow calculation at the various
flows of interest, then compare measure-
ments based on these various calculations
(using flow = k*sqrt( Px) where x is the
flow calculation point. If the generated

www.controlglobal.com
State of Technology 2017: Flow Measurement 23
P is in an acceptable range (e.g. 50 to 400
in.WG), which depends on pressure drop
constraints of the installation, and if the
proper compensation is used (next para-
graph), then the orifice plate does not to be
changed.
The latest multivariable transmitters (at
least the Emerson one) does calculate
the Reynolds number (i.e. does the orifice
calcuation, or at least has a multivariable
compensation look up table) based on the
fluid properties and flowing conditions (e.g.
viscosity table based on temperature mea-
surement).
Simon Lucchini, CFSE, MIEAust CPEng (Australia)
Chief controls specialist, Fluor Fellow, safety systems
ATotal flow measurement accuracy
is affected by P, beta ratio, pipe
diameter, use of a flow computer,
and straight run distance. A 10:1 in DP range
is a real stretch for even a modern P trans-
mitter. Selecting different transmitters with
different calibrations addresses only the
transmitter uncertainty.
Installation effects increase with Beta ratio.
The orifice plates should be inspected and
measured. Also, one of the flow standards
should be followed. You can use the partial
differential uncertainty equations to find the
economical approach for improved accu-
racy. All of this is in the API or IEC literature,
both are good.
I’ve used a temperature-controlled en-
closure to reduce the temperature effect.
Some users insulate the meter run to stabi-
lize orifice and pipe temperature.
For a decision, the acceptable uncertainty
must be defined, as perfect accuracy is
never possible. If you can field-calibrate
the meter run at operating conditions, the
uncertainty would be greatly reduced.
Your decision will probably be clear after
determining the cost for the various options
you’ve listed versus the predicted uncer-
tainty with each.
Cullen Langford
AMy recommendation would be
to recalculate the pressure drop
for different flows using the ori-
fice size as the only non-changing variable.
This is the only way to minimize the error of
the measurement. If you calculate the flow
using, as fixed variables, the pressure drop
and the orifice size, the flow values will be
very irregular. It’s better to use the flows and
orifice size as fixed values, to arrive at the
predetermined pressure drops, which can be
used more easily during recalibration.
The biggest issue is that the crude oil den-
sity (specific gravity) must be constant,
otherwise the measurement will be in error.
Alex (Alejandro) Varga

▪ Ethernet/IP, Profinet, Modbus TCP/IP, or Modbus UDP/IP communication
▪ Easy configuration via USB/Windows or built-in web server
▪ Internal dual-port Ethernet switch supports daisy-chain cabling
▪ UL/cUL Class 1 Div 2, ATEX Zone 2 hazardous location approvals
Industrial-Strength Ethernet I/O With High-Density Efficiency Ethernet I/O Modules are ideal for SCADA and remote monitoring or control applications. Engineered and manufactured for rock-solid reliability you can count on.
Better I/O means more uptime and productivity.Higher density means a lower cost per channel.
The BusWorks® series combines rugged construction, high-density design, and easy setup to provide a very effective I/O solution. Select from a wide variety of analog and discrete I/O modules to meet your requirements. These units are ideal for interfacing temperature, voltage, current, flow, level, on/off, hi/lo, and many other signals.
EtherStax® series high-density I/O blocks are designed for high-reliability operation with up to 96 channels of discrete or analog I/O and redundant communication.
Dependable Value
Etherstax® rugged I/O high-channel-count
Acromag.com/EthernetIO
www.acromag.com | [email protected] | 877-295-7066
Signal Conditioning & Network I/O Solutions
microBlox®
I/O ModulesTransmitters,
Isolators, SplittersEthernet, Modbus and Profibus I/O
Limit Alarms, Computation
Interfacing solutions for signal conditioning and network I/O
Get Your Application eBookAcromag.com/AppNotes

www.controlglobal.com
State of Technology 2017: Flow Measurement 25
Flow of sandy condensate
QFlow measurement of hydrocarbon with sand? I want to measure hydrocar-
bon condensate flow where the condensate contains about 1% sand on a mass
basis.
How would this affect the measurement if a Coriolis or a vortex flowmeter is used? The sand
comes from the wells, and is collected and removed downstream of the flowmeter in the
liquefied-petroleum separator.
Azri Syahmi
AEither Coriolis or vortex can wear at a rate proportional to the percentage of sand
in the flow, and both meters could have short lives. Sharp-edge orifices are simi-
larly vulnerable. The choice is affected by flow rate and the pipe size.
I would worry about any Coriolis flowmeter with a relatively thin metal wall. Magnetic,
ultrasonic and flow nozzles have been recommended. With a sufficiently high flow rate, an
elbow meter will also work. Any DP meter might need a chemical seal or liquid purge to
avoid plugging.
Cullen Langford, P.E.

www.controlglobal.com
State of Technology 2017: Flow Measurement 26
AI would love to tell you that you
can use a Coriolis flowmeter, since
it would be unaffected by sand
entrained in the flowing hydrocarbon, but
the resulting mass flow would be biased by
the sand. It’s almost impossible to instru-
ment/measure/control a poorly designed
process. Remove the sand first, then mea-
sure flow after the sand removal. Fix the
process first, then choose where you install
instrumentation.
Richard H. Caro, CEO, CMC Associates
AMost flow measurement equip-
ment, such as vortex and Coriolis,
would work quite well. Having
said that, here are the caveats:
1. You need to periodically inspect the flow-
meter internals to make sure abrasion has
not damaged the vortex-shedding block
or the tubes inside the Coriolis.
2. You need to verify periodically the type
of sand particles to make sure that
silicates or other hard rocks are not
increasing because this could affect the
abrasion risk.
3. You need to periodically verify that the
quantity of sand is not affecting the mea-
surement. You have to remember that the
solids displace the oil/water mixture and
can affect the final measurement.
4. Since you have sand, I would use vortex
meters, even if the measurement may not
be as precise, since they are cheaper to
replace.
Alex (Alejandro) Varga
AThis is a common measurement
problem in coker feeds (sand and
clay up to 5% to 10%) from col-
umn bottoms in oil refineries. If you can use
a solids collection pot before entering the
straight-pipe mass flowmeter, you can read
the flow reliably until solids appear in the
flow tube.
You’ll experience noise problems if using
target or vortex meters. The best choice
I would love to tell you that you can use a Coriolis
flowmeter, since it would be unaffected by sand
entrained in the flowing hydrocarbon, but the
resulting mass flow would be biased by the sand.

www.controlglobal.com
State of Technology 2017: Flow Measurement 27
would be to select a mass flowmeter in-
stalled in a vertical pipe with a solids re-
moval arrangement. Periodic draining is
the simplest way to solve your application
problem. Good maintenance will enable reli-
able measurement.
Ram Ramachandran
AA Coriolis meter is not the first
meter that would come to mind
for a fluid with solids. It may
technically be able to measure the flow
with 1% solids, however, I would be very
concerned about erosion, particularly for
the U-tube-style meters. The only possibil-
ity would be the straight-type meters, but
I would recommend that you check this
with the vendors. In recent years, they’ve
improved the coil/tube drive technology
to better cope with energy losses due to
two-phase flow (gas/liquid). But the tubes
in Coriolis meters are thin, and can’t cope
with erosion or corrosion.
Vortex meters may handle a small amount of
solids, but this is not ideal (vortex are usually
for clean service). Check with vendors on how
much erosion of the bluff body is acceptable.
I would consider going back to old-school
venturi or wedge flowmeters, but not ori-
fice. It would be best to install in a flow-up
configuration (avoid trapping of solids). If
that’s not possible, then a wedge flowmeter
would be OK in horizontal flow with the tip
of the wedge facing down (to not trap the
solids). Since the wedge is for low Reynolds
numbers, you would have to check.
There are other things to consider for
avoiding plugging of impulse taps.
Simon Lucchini, controls specialist, fluor
A Coriolis meter is not the first meter that
would come to mind for a fluid with solids.
It may technically be able to measure the flow
with 1% solids, however, I would be very
concerned about erosion.

www.controlglobal.com
State of Technology 2017: Flow Measurement 28
Piercing thick flow problemsFrom mud slurries to butter, tough measurement problems often call for clever solutions.
by Dan Hebert, P.E.
Difficult flow measurement problems require innovative solutions, ranging from us-
ing existing flowmeters in a unique way to developing entirely new technologies
because current instruments can’t handle the application. In this article, we’ll look
at several creative solutions to flow measurement issues.
Build a better Coriolis meter
Keith Simpson is the I&E controls manager for Continental Carbon (www.continentalcarbon.
com), which makes carbon black in Houston. Simpson recently helped develop a new pro-
cess for producing carbon black, but he and his colleagues couldn’t measure mass flow with
any existing products. They had to measure the mass flow rate of a feedstock coming out of
a preheater at 500-600 °F.
“At the time, no manufacturer made a Coriolis meter that would run at temperatures that
high,” says Simpson. “We tested several, burned them up in our pilot plant, and proved they
wouldn’t work.”
Simpson explained the problem to Micro Motion (www.micromotion.com), which developed
the DT Series Coriolis meter to address his issue (Figure 1). “The meter ran very successfully,
gave us the accuracy we required, and operated at the full temperature range that was nec-
essary, and we were able to begin manufacturing this very specialized product,” says Simp-

www.controlglobal.com
State of Technology 2017: Flow Measurement 29
son. “Without Micro Motion, I don’t think
we’d have been as successful. We would
have had to do things differently, and we
wouldn’t have been as efficient.” [For a vid-
eo about this application, visit www.whymi-
cromotion.com/Asset/Video?assetId=217]
EXTREME ENVIRONMENTS“The difficulty of applying flowmeters to
most processes tends to increase when the
application entails relatively extreme oper-
ating conditions,” explains David Spitzer,
partner and co-founder at consultant
Spitzer & Boyes (www.spitzerandboyes.
com). “For example, a metal flowmeter is
usually better than a plastic flowmeter if
the fluid is hot. The flow of abrasive fluids is
usually better measured using an obstruc-
tion-less flowmeter. Flowmeters that can be
easily cleaned are usually preferred when
fluid can plug the sensing element.
“Applications that exhibit one of these
relatively extreme operating conditions
generally tend to eliminate consideration
of several flowmeter technologies. Further,
it can be downright difficult to find a vi-
able flowmeter that can measure accurately
when multiple extreme operating conditions
are present at the same time.”
In one application, Spitzer had almost the
same problem as Simpson—trying to mea-
sure hot fluids, this time in an incinerator.
The incinerator temperature was controlled
to maintain approximately 1,000 °C by mea-
suring and controlling flows of various si-
multaneously fired fuels, fume streams from
various process units and combustion air.
“The operators wanted a meter to measure
the flow of distillation residues to the incin-
erator, so they’d know the pipe was prop-
erly cleaned and not plugged,” says Spitzer.
“So the flowmeter had to measure liquids
and gases that could be hot or warm, plus
be rugged enough for the operator to occa-
sionally use a hammer and chisel to remove
solids from its body.”
In this case, the solution was a wedge
flowmeter. “The differential pressure that
a wedge flowmeter produces can mea-
sure liquids and steam,” says Spitzer. “The
flowmeter was fitted with chemical tee and
remote diaphragm seal connections that
eliminated impulse tubing, and located the
HOT FEEDSTOCK FLOW Figure 1: Continental Carbon uses a Micro Mo-tion high-temperature Coriolis flowmeter en-cased in a heating jacket to measure 500-600 °F feedstock for carbon black. Source: Continental
Carbon and Micro Motion

www.controlglobal.com
State of Technology 2017: Flow Measurement 30
diaphragm flush with the flow. The opera-
tors could unbolt the diaphragm seals and
chisel out residue from the rugged all-metal,
wedge-flow element. A local switch was
installed to signal the type of operation,
residue or steam, so the control system
would know when to include the heat value
of the residue in the incinerator’s heat cal-
culations.”
CLOBBERED BY MUDUnlike the challenges of heat, Jason Nor-
man, a consultant and drilling fluids en-
gineer with Zaxxon Instruments (www.
zaxxoninstruments.com), had a clogging
problem with drilling mud, and he solved it
with plumbing and maintenance.
“We were working with a large independent
operator in the Texas Panhandle, using two
4-in. Coriolis meters on the mud pumps
plains. “We incorporated green cement into
the active mud system, which caused the
drilling fluid to gel up due to excessive wa-
ter incorporated into the system. We refer
to it as ‘clobbered up mud.’ We didn’t have
a meter bypass built into the plumbing,
which resulted in excessive downtime while
we waited for the crew to break apart the
meters to clean the inside of the tubes.
“The lessons we learned were to always
build in a meter bypass, so operations can
continue pumping during meter mainte-
nance intervals, and develop preventive
maintenance routines for operations that
can cause cold mud to gel inside the me-
ters.”
Denver Smart, vice president of oil and gas
marketing at Emerson Process Management
(www.emersonprocess.com), reports that
the growing trend to cut drilling costs de-
spite increased well complexity has prompt-
ed oilfield service companies to implement
more advanced measurement solutions for
drilling fluids (mud) management. “Us-
ing flowmeter technology to continuously
measure drilling fluid returns is a challeng-
ing application,” says Smart. “The various
oil-water-base slurries, changing physical
properties, potential for entrained gas and
The lessons we learned were to always build in a
meter bypass, so operations can continue pumping
during meter maintenance intervals, and develop
preventive maintenance routines for operations
that can cause cold mud to gel inside the meters.

www.controlglobal.com
State of Technology 2017: Flow Measurement 31
the presence of rock cuttings significantly
impact the accuracy and reliability of flow
and density instruments.”
Coriolis flowmeters are widely used in
oilfields. Before Coriolis, methods for mea-
suring flow typically involved mechanical
paddle meters and/or pit-level measure-
ments. Both have issues with accurate and/
or timely flow measurement of the drilling
fluids return stream.
“For Coriolis technology, the measurement
performance at flow turndown ratios up
to 100:1 lets us use large-capacity meters
to prevent erosion and cuttings plugging
the flow line, while reducing backpressure
effects in gravity-feed applications,” Smart
explains. “Best practices have been estab-
lished to ensure full stream flow through the
meters under gravity feed, resulting in real-
time sustained measurement performance
and reliability. This provides a level of drill-
ing operational diagnostics to avoid well-
control events, reduced drilling efficiency
and higher operating costs.”
TWO FREQUENCIES BETTER THAN ONEOlder, 60-Hz magmeters have a difficult
time measuring the white and black liquors
in pulp and paper processes. These are par-
ticularly difficult in slurry applications due
to the presence of wood chips and other
pulp material.
“High-frequency, AC magmeters do a
good job of reducing slurry noise, but
they have poor accuracy and problems
with zero stability. DC magmeters can’t
be effectively used in this type of applica-
tion due to the presence of low-frequency
slurry noise,” explains Tom Figlik, field
instrument consultant at Yokogawa Corp.
of America (www.yokogawa.com/us).
“In this and similar applications, dual-
frequency magmeters combine the best
of high- and low-frequency meters. In
addition, dual-frequency magmeters use
both high 75-Hz frequency and low 6.25-
Hz frequency excitation. Dual-frequency
excitation superimposes high frequencies
on low frequence.”
Before Coriolis, methods for measuring flow
typically involved mechanical paddle meters and/
or pit-level measurements. Both have issues with
accurate and/or timely flow measurement of the
drilling fluids return stream.

www.controlglobal.com
State of Technology 2017: Flow Measurement 32
MORE PRESSURE FOR PAPERLikewise, a German pulp and paper manu-
facturer wanted to increase steam pressure
at the inlet of the dryer section of a paper
machine to increase production. The com-
pany measured steam flow to determine the
proper amount of specific energy to apply
for optimal paper production. The exist-
ing orifice-plate, differential pressure (DP)
flowmeter wasn’t suited to this high-pres-
sure service because it caused a substantial
reduction in pressure.
As a result, the papermaker replaced its old
meter with a Rosemount 3095MFA An-
nubar flowmeter (Figure 2). Its calculations
showed low permanent pressure loss versus
an orifice-plate meter, and minimal modifi-
cations were needed to the existing piping.
The new flowmeter provided a pressure-
and temperature-compensated measure-
ment in one package.
After replacing its old flowmeter with the
Annubar, the paper machine achieved
record high paper production due to
increased pressure in its steam heads.
Consequently, the paper company also
achieved higher production rates and ef-
ficiencies.
However, one replacement project doesn’t
mean orifice-plate flowmeters are no lon-
ger useful, even though they require rela-
tively long straight-pipe runs upstream and
downstream of the meter, which is an issue
in many retrofit applications. “In the nuclear
industry, additional regulations following
the Fukishima disaster are calling for more
flow measurements in existing pipes for
parameters like non-safety-related cooling
water,” says Wally Baker, pressure content
marketing manager at Rosemount (www.
rosemount.com). “When flow measure-
ments are required on existing infrastruc-
tures, it can be challenging to meet best
practices for installation, including require-
ments for straight-run piping for orifice-
plate measurements.
MORE STEAM, MORE PAPERFigure 2: To increase steam pressure at the inlet of the dryer section on a paper ma-chine, a German paper manufacturer replaced orifice-plate differential pressure (DP) flow-meters with a Rosemount 3095MFA Annubar flowmeter, which provided a pressure- and temperature-compensated measurement in one package, and spurred record high paper production. Source: Emerson Process Management

www.controlglobal.com
State of Technology 2017: Flow Measurement 33
“Fortunately, conditioning orifice plate
(COP) technology enables users to perform
these measurements because it doesn’t
require the traditional four pipe diameters
of upstream pipe. A COP only requires two
pipe diameters upstream to make an accu-
rate flow measurement. This enables users
to make these newly required flow mea-
surements with little or no piping modifica-
tions,” concludes Baker.
MEASURING BUTTER FLOWNathan Hedrick, flow product market-
ing manager at Endress+Hauser (www.
us.endress.com), reports having a customer
that needed to measure flow of butter as a
part of a large batching process for making
baked goods. The butter had to stay below
40 °F, but at that temperature it no longer
flowed as a liquid, was highly viscous, and
trapped a lot of air. “The customer was us-
ing a Coriolis mass flowmeter to measure
flow,” notes Hedrick. “Initially, the readings
were unrepeatable, inaccurate and unreli-
able because of the entrained air.”
Hedrick adds that Endress+Hauser worked
with its bakery customer to make this very
difficult application work. “We looked at
the overall process, and made recommen-
dations on how they could improve the
process to reduce the amount of air,” he
explains. “We installed a perforated plate to
put backpressure on the meter, thereby re-
ducing air pockets. In addition, we provided
a Promass 83I full-bore, single-tube, Coriolis
mass flowmeter to minimize pressure loss.
Digital signal processing capabilities in the
electronics of the meter enabled successful
results despite the challenging conditions.”
These and other challenging flow measure-
ment problems can be solved by calling in
an independent consultant or a flowmeter
supplier. Consultants aren’t beholden to any
supplier, and can thus recommend the best
solution from a wide range of choices, but
they may not have detailed knowledge of
each flowmeter type. Meanwhile, suppliers
with a wide range of flowmeter types can
be another good source for solutions. They
have the ability to produce custom prod-
ucts, and can also offer innovative ways to
apply their off-the-shelf offerings.
Challenging flow measurement problems can be
solved by calling in an independent consultant or
a flowmeter supplier. Consultants aren’t beholden
to any supplier, and can thus recommend the best
solution from a wide range of choices