STATE OF - Utahwaterrights.utah.gov/docSys/v920/w920/w9200082.pdf · STATE OF UTA~H ED. H. WATSON,...
102
Transcript of STATE OF - Utahwaterrights.utah.gov/docSys/v920/w920/w9200082.pdf · STATE OF UTA~H ED. H. WATSON,...


STATE OF UTA~H
ED. H. WATSON, State Engineer
FRED W. COTTRELL. Chief Deputy
RICHARD E. REDDE~, Application Engineer
JOHN A. WARD. Ground V'-ater Engineer
TECHNICAL PUBLICATION 1\"0. 3
GROUND WATER IN PAVANT VALLEY
Millard County, Utah
By P. E. DENNIS, G. B. MAXEY, and H. E. THOMAS
Prepared in cooperation with the
UNITED STATES DEPARTMENT OF THE INTERIOR
GeQlogical Survey, 1946
W. E. WRATHER, Director

CONTENTS
Page
Abstract . . 5
Introduction . 8Geography 8Purpose and scope of investigatoin 8Acknowledgments 11
Precipitation ... . 11
Physiography........... . 17Topography 17Drainage 19
Records of stream discharge. . 20
Geologic relations . 24Water in the pre-Quaternary rocks 25Water in the Quaternary rocks 35
Ground water districts 37
Occurrence of ground water .40
Unconfined water .40Fillmore district .40Hatton district .42Flowell and Meadow districts .42
.Pavant district .43
Artesian water 44Seasonal fluctuations of water level .45Long-term fluctuations .46Piezometric surfaces ..49
Movement of ground water 51
Ground water recharge 52Ground water movement and discharge .52
Fillmore district . 53Flowell district . 53Pavant district - 54Meadow district 55Kanosh and Hatton districts 56Clear Lake . 56
Chemical constituents of the ground water 56
Tests of interference and permeability in the Flowell district 65
Ground water inventory 68Fillmore and Flowell districts 69Meadow district 77

CONTENTS (Continued)
Page
Kanosh and Hatton districts .. _ _ _ _ 79Pavant district .__ -._ ----- _. __ ._. __ .. _. __ __ .79Summary _ _ _.._ . _ __ _..80
Wells in Pavant Valley .__ . __ _ _ _ __ 80History of development _.._ 80Status of development in 1945 .__ _ _ _.. 82Possibilities of further development . .__ __ _. __ 82
ILLUSTRATIONS
Page
Plate 1. Geologic and hydrologic map of Pavant Valley _.. __ .In Pocket
Figure 1. Index map of Utah _ _ . .. ._ __ __ .. _ '_' 9
2. Graphs showing precipitation at Fillmore ---.. -- -- --13
3. Sketch map of Pavant Valley and vicinity .... _. 18
4. Hydrographs for Chalk, Corn and MeadowCreeks, 1944-1945 _.._ _ __ ""_ .._ __ ._22
5. Well sections for 31 wells in Pavant Valley __ _34
6. Diagrammatic section through Flowell district _ 38
7. Hydrographs for 5 wells in Pavant Valley, 1929-1945 .47
9. Graphic representation of selected analyses of water 57
10. Map of central part of Pavant Valley showing areasirrigated, and quality of water obtained fromwells . .. .__ _ __ .._ __ .._ __ .__ _ . 64
11. Location of affected wells, and pressure reductionsduring interference tests _ _ _ 66

GROUND WATER IN PAVANT VALLEYMillard County, Utah
By P. E. DENNIS, G. B. MAXEY, and H. E. THOMAS
ABSTRACT
Pavant Valley lies in the eastern part of MillardCounty in central Utah, about 150 miles south of Salt LakeCity. It is an arm of the Sevier Desert Basin, separatedfrom the main basin by a series of low volcanic hills. Itcomprises about 300 square miles of flat bottomlands andalluvial slopes which rise gradually eastward to the baseof the Pavant Range.
The population of the valley is less than 4,000, of whichnearly one-half live in Fillmore, and the rest in the townsof Holden, Meadow and Kanosh and on farms throughoutthe valley. The climate is arid to semi-arid, and practicallyall the flow of the streams which rise in the mountain areais used for irrigation. In the lower western part of thevalley, particularly in the small agricultural district ofFlowell, large flowing wells provide water for irrigation.
Ground water occurs principally in the unconsolidatedsediments of the valley fill, dominantly gravel, sand, siltand clay of Recent and Pleistocene age. It occupies theinterstices between the individual grains of these sedimentswhich are essentially a ground-water reservoir bounded bythe consolidated rocks that form the Pavant and CanyonRanges and underlie the valley fill at depths of a few feetto 500 feet or more. The reservoir may leak considerablyalong its western margin which is formed of basalt conesand lava fields. The valley fill consists of relatively long,thin and narrow lenses of poorly-assorted alluvial fan gravel,sand, silt and clay, interbedded with the more widespreadand continuous deposits of well-assorted lacustrine clay,
5

marl, silt and near-shore sand and gravel. The sand andgravel beds of this fill constitute the ground-water aquifers.They are the conduits through which the water is transmitted underground from intake areas along the upperparts of the alluvial slopes to wells and points of naturaldischarge westward and northwestward. These beds ofcoarser materials are also the chief reservoirs in which thewater is stored until discharged. They are more extensiveand are composed of coarser, more permeable material nearthe mountain front; they become progressively less permeable westward. Lacustrine clay beds form the chief confining beds. Thus the valley fill contains a number of interconnected aquifers extending westward in finger-like projections from their more thoroughly interconnected portions which outcrop at the surface near the mountain front.
As water moves westward in the aquifers beneath theclay beds, it is confined by them, giving rise to the artesianconditions which produce flowing wells at the lowest elevations in the valley. The principal artesian aquifers arepenetrated at depths of 200 to 400 feet in most wells.Ordinarily, at least three or four and sometimes six ormore water-bearing beds are encountered. On the otherhand, the water in aquifers on the higher parts of thealluvial slopes and in the shallowest aquifer over much ofthe lower valley is essentially unconfined and its uppersurface constitutes a water table.
The area underlain by the ground-water reservoir inPavant Valley has been divided into six districts basedupon differences of geologic and hydrologic conditions andeconomic development. They have been designated theFillmore, Flowell, Meadow, Hatton, Kanosh and Pavantdistricts. Of these the Flowell district is by far the mostimportant economically. Of a total of about 17,000 acrefeet yielded annually by wells in Pavant Valley, more than750/0 is discharged by the 100-odd artesian irrigation wellsof the Flowell district.
The total discharge from the Pavant Valley groundwater reservoir amounts to more than 40,000 acre-feet ina normal year, of which less than half is discharged fromwells, and only about a third is put to economic use. About5,000 acre-feet a year may be wasted from uncontrolled orleaking wells, and about 25,000 acre-feet annually is lostby spring discharge, evapo-transpiration, and undergroundmovement toward the Sevier desert.
Fuller utilization of the water resources of the valley
6
may be achieved by artificial recharge to increase the inflowto the ground-water reservoir, making more water availableto wells; by eliminating waste from existing wells, repairingthose that leak around the casing; and by drilling wells topump water from shallow zones above the artesian aquifersand thus reducing the natural discharge from the valley.Increasing the number of artesian wells in developed areas,or pumping existing wells, also would doubtless result insome increase in the total water put to economic use, butwould necessarily reduce the quantity which is obtainedby artesian flow from existing wells.
7
INTRODUCTION
GEOGRAPHY
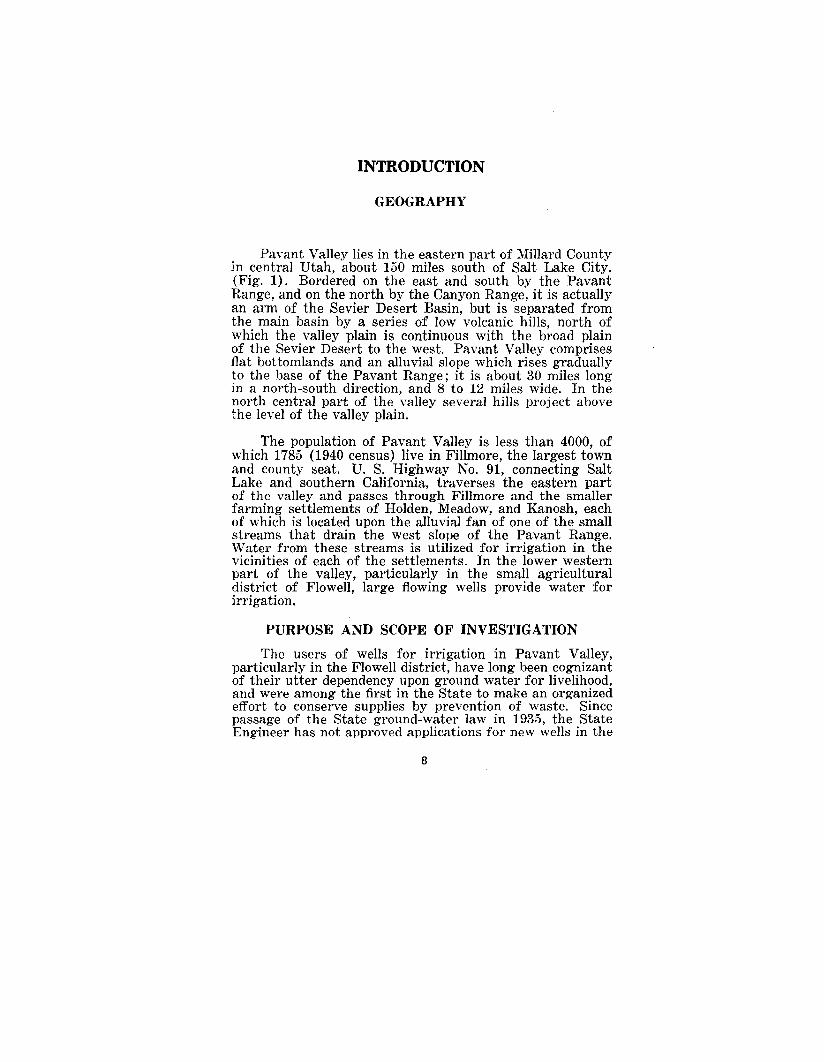
Pavant Valley lies in the eastern part of Millard Countyin central Utah, about 150 miles south of Salt Lake City.(Fig. 1). Bordered on the east and south by the PavantRange, and on the north by the Canyon Range, it is actuallyan arm of the Sevier Desert Basin, but is separated fromthe main basin by a series of low volcanic hills, north ofwhich the valley plain is continuous with the broad plainof the Sevier Desert to the west. Pavant Valley comprisesflat bottomlands and an alluvial slope which rises graduallyto the base of the Pavant Range; it is about 30 miles longin a north-south direction, and 8 to 12 miles wide. In thenorth central part of the valley several hills project abovethe level of the valley plain.
The population of Pavant Valley is less than 4000, ofwhich 1785 (1940 census) live in Fillmore, the largest townand county seat. U. S. Highway No. 91, connecting SaltLake and southern California, traverses the eastern partof the valley and passes through Fillmore and the smallerfarming settlements of Holden, Meadow, and Kanosh, eachof which is located upon the alluvial fan of one of the smallstreams that drain the west slope of the Pavant Range.Water from these streams is utilized for irrigation in thevicinities of each of the settlements. In the lower westernpart of the valley, particularly in the small agriculturaldistrict of Flowell, large flowing wells provide water forirrigation.
PURPOSE AND SCOPE OF INVESTIGATION
The users of wells for irrigation in Pavant Valley,particularly in the Flowell district, have long been cognizantof their utter dependency upon ground water for livelihood,and were among the first in the State to make an organizedeffort to conserve supplies by prevention of waste. Sincepassage of the State ground-water law in 1935, the StateEngineer has not approved applications for new wells in the
8

I----I
I
--1
SAN JUAN
GARFIELD
- -~ --l- Thi, ,epo,I
" ' DIIIInJ Detailed surveys~ \ I e2Z2l Reconnaissance surveys
~; I~ Surveys in pro~ress
)J <J !RICH Ii1tc' -<"r'~' SCALE OF MILESIlllIIb _~) I
-'~C3j "'i b 2"; ~O l~.•0(, L. --,-:- __ ---,
\ SUMMIT ,DAGGETT I.../ __.-./-~-·-T~·""';
II
c'PIUTE I WAYNE
_-L... _
I WASHINGTON
1 -
KANE
Fi<;j.I- Index map af Ulah, shawing location of areas covered byground - wale, investi<;ja lions.
Figure I.-Index map showing location of Pavant Valley and otherareas covered by ground-water investigations.
9
areas of most concentrated development, and has deferredadjudication of existing water rights until adequate dataconcerning the ground-water resources become available.The investigation of ground-water resources in Pavant Valley was suggested by the State Engineer and constitutesone of a series that are being made in the important groundwater basins of Utah by the Federal Geological Survey incooperation with the State Engineer. The investigation wasunder the general supervision of Oscar E. Meinzer, geologistin charge of the ground-water division of the FederalGeological Survey. H. E. Thomas, in charge of groundwater investigations in Utah, returned from military servlce overseas in time to assist in the completion of the manuscript, and edited the report.
Records of water levels and artesian pressures inPavant Valley have been obtained since 1935 as part of aState-wide program, and have been published annually inWater-Supply Papers of the Geological Survey.1 Intensivefield work was begun in November 1942 and continued untilOctober 1945. This field work included a study of the geology in relation to the occurrence of ground water, involvingreconnaissance mapping of the adjacent mountains and detailed mapping of the unconsolidated deposits of the valley;periodic measurements of water level and flows of practically all wells in the valley, and maintenance of six waterlevel and pressure recorders; measurement of leakage fromwells; location of wells, springs, marshes, and other features of importance to hydrologic study; establishment,under the direction of M. T. Wilson, District Engineer atSalt Lake City, of a gaging station on Chalk Creek, andperiodic measurements of flow of other streams in the area.
The Pavant ground-water district has not been studiedin the same detail as the remainder of the valley. Geologicstudy did not encompass the Canyon Range and the northern limits of the Valley, and only a limited amount ofhydrologic data has been obtained there. War activitiesprevented a more comprehensive examination of that area,which is of minor importance compared to the southernpart of the valley. The present report therefore offers onlytentative conclusions concerning the ground water in thearea north of Fillmore and Flowell.
Two reports have been published covering specialphases of the ground-water investigation of Pavant Valley.
] Meinzer, O. E., Wenzel, L. K., and others, Water levels and artesian pressuresin observation wells in the United States: U. S. Geol. Survey Water Supply Papersas follows: 777, Pl'. 241-242; 817. Pl'. 409-413; 840, Pl'. 551-555; 845, Pl'. 622-625;886, Pl'. 845-848; 9 Hi, Pl'. 112-115; 940. Pl'. 74-75; 948, Pl'. 79-82, 990, Pl'. 80-94;]020, in pre88.
10

Underground leakage from artesian wells in the Flowellarea is described in detail in a paper by Livingston andMaxeY,2 and suggestions were made for the repair of leaking wells. The geology of most of Pavant Valley is discussedin a paper by Maxey.3 Detailed data included in thesepublications are not repeated in the present report.
Published and unpublished data from several previousinvestigations have been studied by the writers, and havepermitted a more comprehensive analysis than would otherwise have been possible. Pavant Valley was included in astudy of the ground water in Juab, Millard and Iron Counties, by O. E. Meinzer in 1908," prior to the drilling ofthe first flowing well in the Valley. Water levels in selectedwells were measured by the Utah State Agricultural Collegeduring the years 1923 to 1935. Since 1935 the StateEngineer has obtained a large amount of data concerningwells in the area, including locations and elevations ofbench marks established at the wells, descriptive dataprovided by well owners on underground water claims, andnumerous measurements of artesian pressures and ft.owsduring the years 1937 to 1941.
ACKNOWLEDGl\IENTS
The writers appreciate the cooperation of the residents of the area, particularly the owners of flowing wellswho supplied valuable information and permitted closing orregulation of their wells during special tests. Messrs. H. H.Hatton and O. E. Brower, both residents of Flowell, assistedmaterially by making periodic measurements of water levelsin selected wells. Messrs. Frank Paxton, Ras Rasmussen,Leo Stott and Frank Sweeting permitted installation ofrecording gages upon their wells, and sacrificed the useof those wells while the gages were in operation. Appreciation is also expressed to the personnel of the Soil Conservation Service and the Forest Service in the area whosupplied pertinent information and other assistance duringthe investigation.
PRECIPITATIONThe monthly and annual precipitation at Fillmore is
tabulated below and shown in figure 2. According to this2 Livingston, Penn, and Maxey, G. B. Underground leakage from artesian welld
in the Flowell area near Fillmore, Ntah: Utah State Engl'. Technical PublicationNo.1. 37 Pi>.. 1944.
a Maxey, G. B., Geology of part of the Pavant Range, Utah: Am. Jour. ScLvol. 224, pp. 324-356, 1946.
4 Meinzer. O. E .• Ground water in Juab, Millard, and Iron Counties, Utah: U. S.Geol. Survey Water Supply Papar 277, PI'. 86-94, 191:.
11

record the annual precipitation during 54 years of recordhas averaged 14.29 inches, and has ranged from 21.28 inchesin 1906 to 6.72 inches in 1934. The spring months arenormally wettest, and nearly half the annual precipitationcommonly occurs during the four months from February toMay. The following four months, from June to September,ordinarily receive less than one-quarter of the annual rainfall.
The curve showing cumulative departure from normalprecipitation at Fillmore, also in figure 2, indicates periodsof greater than normal rainfall by a rising trend, andperiods of deficient rainfall by a downward trend. Thusthere is a pronounced downward trend during the years1900 to 1904 and again from 1926 to 1935, reflectingthe two most pronounced drought periods in the half cen-tury of record. Pronounced upward trends result fromthe heavy precipitation in 1905 to 1909 and in 1920 to1924, inclusive. In other years the precipitation has beenmore nearly normal, and the general trend of the graph isapproximately horizontal. The cumulative departure fromnormal precipitation is of significance to studies of groundwater, because the rising trends indicate natural conditions favorable for increased recharge and the decliningtrends represent periods when low recharge and hencedecreased storage may be expected, if natural conditions arethe controlling factor.
The weather station at Fillmore is the only one inPavant Valley, and no record has ever been made of theprecipitation in the adjacent mountains. According toresidents of the area, the western part of Pavant Valley ismore arid than the eastern slopes that border the PavantRange, and it may be inferred from observations in adjacentregions that in the mountains to the east there is a progressive increase in precipitation with increasing altitude.Records of the Great Basin Experiment Station at stationseast of Sanpete Valley (about 50 miles northeast of PavantValley) show that in three years the precipitation at 7400feet altitude was 166%, at 8700 feet altitude 208%, and at9850 feet altitude 232% of the amount falling at Manti,which is located at the edge of Sanpete Valley at 5575 feetaltitude. By analogy, some areas of the Pavant Rangemay receive two to three times the precipitation recorded atFillmore.
12

oenOJ
ooen
o~
en
enIU:J:oZ
ANNUAL PRECIPITATION AT FILLMORE
..IO!-------,---/<r--;::::--;;---FC----''--\-*----,-----,
Ul
~ol-...I-':::L¥--lj---+_-j------1:----_t-++_----lolf----\f--_ioz
-IO.L- ..L---.:__l.-__----'l...-__--l. -'-__--J
CUMULATIVE DEPARTURE FROM AVERAGE PRECIPITATION 1892-1945AT FILLMORE.
UlIU%oZ
NORMAL "NTHLY
FiO·2- Grophs showing precipitot~on at Fillmore, Utah.
13

PRECIPITATION AT FILLMORE, UTAH(by U. S. Weather Bureau)
Year Jan. Feb. Mar. Apr. May June July Aug. Sept. Oct. Nov. Dec. Annual--~-------.-._------- _._.- .._--~--
1892 __________ .85 2.10 2.25 2.11 2.03 .82 .29 .47 .06 1.07 .53 1.20 13.781893 ____ .. __ ...... .81 1.51 2.89 2.09 1.53 .00 .48 1.71 1.21 .46 1.11 1.79 15.591894 ............... .70 .56 1.04 2.43 .64 2.04 .34 1.19 1.94 .41 .31 1.77 13.371895 .___ .. ___ ...__ 1.93 2.15 2.06 1.23 1.51 .80 .56 .97 1.66 .93 1.46 1.10 16.361896 ''''''''''''_' .75 .16 .94 1.47 1.06 .01 2.36 1.69 .85 .37 1.17 .33 11.16
1897 ________ .. __ 2.15 2.17 2.89 1.26 .03 .26 .19 .31 1.50 3.58 1.15 1.55 17.041898 .._...._... __ . .15 1.20 3.07 .59 4.44 .92 .99 .60 T .60 1.27 .76 14.591899 .............. .50 1.40 5.00 1.45 .85 .96 .01 .28 .00 1.94 1.06 1.03 14.481900 .._........... 1.25 .45 .15 3.18 .35 .60 T .14 1.58 .93 .66 .03 9.32
F,.I. 1901 ............. .35 2.00 1.54 2.35 1.92 .57 .41 .90 .00 .72 .15 1.97 12.88
*" 1902 .............. 1.03 1.03 2.59 .36 .90 .09 .49 .16 1.51 .58 2.70 .46 11.901903 ._.._......__. 1.44 1.26 1.19 2.66 2.27 .04 .27 .38 1.00 1.06 .00 .40 11.971904 ........__ ._.. 1.89 1.90 2.16 .26 2.81 .25 .07 1.13 .10 .62 .00 .95 12.141905 ....._......... .90 2.48 2.66 1.53 2.45 T .53 .62 2.81 .51 1.13 .54 16.161906 .. __ .......... .72 1.16 3.88 4.38 2.18 .40 1.27 1.20 2.38 .15 2.93 .63 21.28
1907 .............. 1.67 1.96 1.34 .55 3.20 .88 .97 1.23 1.24 1.99 .25 1.86 17.141908 .............. 1.01 .87 .36 .50 4.15 1.13 1.46 1.38 2.02 3.31 .69 1.55 18.431909 ....... ___ .... 1.12 2.66 1.23 2.91 .35 .02 .79 3.02 1.81 .51 1.61 1.22 17.251910 ........ _._ ... 1.02 .92 .88 .38 .58 .10 1.84 .68 2.46 1.84 .87 1.70 13.271911 ........._.... 1.77 1.14 1.11 .32 .88 1.15 1.76 .11 1.63 1.39 .90 .98 13.14
1912 .............. .15 1.47 3.08 1.71 1.32 .20 .70 .27 1.47 3.54 1.40 .38 15.691913 .............. .35 1.48 1.11 .83 .49 .75 1.04 1.50 1.14 1.62 1.67 1.99 13.971914 .............. 1.87 .92 .36 3.54 .25 1.29 1.24 .16 .42 1.43 .46 .09 12.031915 ............... 1.43 2.70 1.06 2.09 1.73 .84 1.09 .11 1.54 .35 2.06 1.53 16.531916 .._........... 2.33 1.12 2.31 .25 .77 T 1.80 .19 .01 2.09 .32 1.29 12.48

PRECIPITATION AT FILLMORE, UTAH(by U. S. Weather Bureau)
Year Jan. Feb. Mar. Apr. May June July Aug. Sept. Oct. Nov. Dec. Annual---
1917 .............. 1.14 .82 1.20 2.40 2.40 .05 .58 1.11 .32 .00 1.21 .29 11.521918 .............. 1.97 1.64 1.76 1.32 .85 .34 1.06 .09 1.83 .98 1.68 1.10 14.621919 ............. T 2.09 1.53 .67 .45 .00 .11 1.17 1.88 .85 3.30 1.05 13.101920 .............. 1.21 .92 2.89 4.03 2.14 .28 .28 .26 .32 3.94 .63 3.27 20.171921 .............. 1.31 .99 1.15 3.61 1.62 .07 1.26 .93 .27 1.27 .44 1.02 13.94
1922 .............. 1.69 2.34 .85 3.74 1.59 .03 .43 .77 .06 1.93 1.36 2.86 17.651923 ............ .86 1.12 2.01 2.50 1.47 .12 2.28 .34 .62 2.09 .25 1.78 15.441924 ........... 1.57 .58 3.43 1.62 1.44 .00 .17 .20 .79 1.44 1.30 3.05 15.591925 .......... .68 1.11 1.17 .86 .29 2.41 .75 .77 .49 1.65 1.43 .49 12.70
~., 1926........ .82 1.50 .68 .86 1.41 .03 '(i8 .7:J .44 .14 .61 1.60 9.50c."
1927 ............. 1.55 1.41 3.29 1.54 1.03 .76 .97 .64 .56 2.10 1.09 .95 15.891928 """""'" .51 1.88 1.85 .71 .70 .62 .43 .32 .21 .99 2.14 .50 10.861929 ............. .77 2.15 2.63 2.16 .29 .63 lAO .70 1.55 .96 .22 .29 13.751930 "'. 2.12 1.37 1.23 .18 2.74 .42 1.73 3.21 1.16 .75 1.39 .19 16.491931 ......... .10 1.77 1A8 1.09 .54 .77 .05 .17 .30 .30 2.24 1.21 10.02
1932 ,....... ,.... 2.36 1.23 2.11 1.36 .34 .88 1.54 1.70 .02 .97 .31 1.59 14.411933 .............. 1.34 .83 1.61 1.87 4.04 .11 .57 .80 .02 AO .16 1.18 12.931934 ......... 1.00 1.46 .32 .86 T .17 .23 .11 .05 .24 1.58 .70 6.721935 ........ .49 2.45 2.27 2.06 3.74 T .55 .68 .33 .10 .32 1.25 14.241936 "'...... 1.01 2.07 1.95 .67 .29 4.48 4.14 .96 .03 1.73 .86 2.53 20.72
1937 .......... 3.11 .90 1.76 .33 1.45 .21 .78 .20 1.72 .62 .26 2.09 13.431938 ........ .59 1.32 2.33 1.28 2.47 .31 :3'" .>;:J .18 .79 1.71 .90 13.08. I1939 ............. 1.02 1.38 .85 .46 1.48 .89 .10 .44 2.32 1.24 .10 .:H 10.591940 ............ 2.52 2.51 3.48 1.33 '1' .46 .21 .02 1.84 .73 1.86 1.48 16.441941 "" .. "'" 1.48 1.03 2.13 2.10 1.87 .75 .28 .77 1.15 4.34 1.30 2.06 19.26

PRECIPITATION AT FILLMORE, UTAH(by U. S. Weather Bureau)
Year Jan. Feb. Mar. Apr. May June July Aug. Sept. Oct. Nov. Dec. Annual
1942 .............. .28 .79 1.26 1.79 .80 .08 .42 1.08 .20 .28 2.65 .67 10.301943 .. __.......... .52 1.05 1.10 .19 .81 1.87 .86 1.30 .31 1.58 .63 .72 10.941944 ...... ___... _. 2.75 1.62 2.23 3.46 .81 1.33 .04 .15 .10 .59 1.83 .37 15.281945 .............. .74 1.60 3.89 2.12 1.50 2.51 .14 3.62 1.22 .49 1.28 1.12 20.23
54-yearAverage ...... 1.18 1.46 1.86 1.62 1.43 .64 .80 .82 .94 1.21 1.11 1.18 14.29
......0)

PHYSIOGRAPHY
TOPOGRAPHY
Pavant Valley lies along the eastern edge of the GreatBasin section of the Basin and Range physiographic province, and the Pavant Range is included in the Utah HighPlateaus of the Colorado Plateau province.; Pavant Valleyforms the extreme southeast part of the broad basin knowI~
as the Sevier Desert, which is divided at its southern endinto two lobes by the Beaver or Cricket Mountains, thewestern lobe being occupied by Sevier Lake. The easternlobe is approximately 30 miles wide, and slopes gently northward from low volcanic hills which form its southern boundary. This lobe is divided into two broad valleys by basaltflows which form a broad, low ridge extending from KanoshButte to Pavant Butte, about 25 miles north. The easternof these two valleys is known as Pavant Valley (Fig. 3).
Pavant Valley is bounded on the east and south by therugged Pavant Range, which has a north-south trend in itsnorthern part, and veers southwest\vard belo\v the latitudeof Fillmore. The irregular crest of this range is commonlyabove 9,000 feet elevation, and several peaks east ofMeadow and Fillmore are more than 10,000 feet ahove sealevel, or 4,500 feet above the bajada at the west base ofthe range. The north boundary of the Valley is formedby the Canyon Range, which is separated from the north tipof the Pavant Range by the low pass traversed by U. S.Highway No. 91. The Canyon Range extends northward forabout 30 miles to form part of the east border of the SevierDesert. West of this range Pavant Valley merges intothe Sevier Desert plain, and the boundary between thetwo is set arbitrarily along the westward-sloping bajadathat flanks the south portion of the Canyon Range. Thebasalt flows and cinder cones which form the west marginof Pavant Valley rise generally 50 to 400 feet above thevalley plain; the most conspicuous feature, Pavant Butte,is 800 feet high, and on the other hand, many flows barelyprotrude above the general plain.
Pavant Valley includes many striking features whichhave resulted from the incursion of the ancient Lake Bonneville. Beaches, bars, and spits are common in all parts ofthe valley which lie below the highest shoreline of this lake
i'i Fenneman, N. M., Physiography of the L"niteu States: McGraw-Hill Book Co..New York, PD, 294·299, 348·367, Plate T, 1931.
17

u·
Oo«()Lake
<r>.....J
III
• P....,
;\ Butl.
S \...\
..........•>
oz
'"o..
""'I----'-'<------t...".
~
".....""
ICALI
I ! 3 4 '''''''15
Fig.3- Skolch "'01' 0' Povont Volley ond vicinity.
L,..__--..1_--:=.=....:...._~__~~~..::..J'___'_______L ......:...<o.
HI

at 5130 feet elevation. This highest shoreline is particularlywell marked throughout most of the valley, and forms thedividing line between the gently-sloping lake plain below,and the alluvial apron or bajada above. The slope of thisbajada, averaging about 12° near the base of the PavantRange, decreases rapidly westward until the bajada mel'geswith the lake plain. Low hills known as Cedar Mountain.West Mountain, and Bald Mountain project above the Pavant Valley plain north and northwest of Fillmore.
DRAIl\'AGE
Pavant Valley lies in the Southwestern Bolson groundwater provincet; which in Utah is coextensive with the Basinand Range physiographic province. Like the majorityof the intermontane valleys in that province, Pavant Valleyis a closed basin, or bolson, with no surface drainage outlet:but it is exceptional in that the lava fields forming itswestern border are so recent, so porous, and in so arid aregion that practically no drainage pattern has yet beendeveloped. No topographic maps are available to certifythe closure at the north end of the basin, but the greatbajadas extending westward from the Canyon Range, andthe large sand dunes which have accumulated on themathwart the north end of the Pavant Valley would seemto preclude any surface drainage into the Sevier Desert.
Pavant Valley and its tributary drainage area comprise approximately 750 square miles, of which 375 squaremiles is occupied by the valley itself. Of the remainingmountainous and hilly area, the portion of the Pavant Rangewhich is drained by streams tributary to Pavant Valleytotals 270 square miles. These streams of the Pavant Rangeare the only source of water used for irrigation on theupper parts of the alluvial slopes, in the vicinity of theprincipal settlements of the valley, and they also furnishsupplemental water for irrigation farther west. Thesestreams are also of paramount importance to the groundwater reservoir, as they are the principal source of waterfor recharge of the artesian aquifers (p. 52). The mostimportant streams entering the valley from the PavantRange are listed below, in order from north to south. Their
6 Meinzer. O. E., Occurrence of ground water in the United State':3: U. S. Geo!.Survey Water Supply Paper 489, p. 314, plate XXXI, 1~23,
19

aggregate drainage area is about 7010 of the PavantMountain area which is tributary to Pavant Valley.
Stream Drainage basin(sq. mi.)
Wild Goose Creek. 7Maple Hallow 6Pioneer Creek 15Chalk Creek .48Pine Creek 6
Stream Drainage basin(sq. mi.)
Meadow Creek 10Walker Creek 4Sunset Creek 6Cottonwood Creek 4Corn Greek 83
All the water of these streams is diverted and usedfor irrigation throughout the growing season, except possibly during periods of peak flow of the spring freshet, whenthe natural channels carry the excess. Much of the winterdischarge likewise goes down the natural channels, anddisappears by seepage within a few miles of the mouths ofthe canyons. Peak discharges may fill the channels of ChalkCreek and Corn Creek as far as the "sinks" in the westernpart of the valley, where the water is distributed over considerable areas, and disappears rapidly by seepage intoporous strata rather than by evaporation.
A very small amount of surface water enters PavantValley from sources other than the Pavant Range. Eastand West Eightmile Creeks which drain the south endof the Canyon Range, have a combined basin of more than30 square miles, and are used for irrigation of lands nearHolden and at Greenwood farther west.
The Central Utah Irrigation Canal, distributing waterfrom the Sevier Bridge Reservoir, is the chief source ofirrigation water in the McCornick area of North PavantValley. It also brings some supplemental water into thenorthwest corner of the Flowell area. Because water fromthis canal is spread only on the lowland areas, it plays nopart in recharge of the artesian reservoir although someof it may add to the shallow, unconfined water in thoseareas.
Records of Stream Discharge
Prior to 1944 the records of discharge of streams inPavant Valley are limited to a few miscellaneous currentmeter measurements of the larger streams, chiefly inthe years 1938 to 1943. Since March 1944 a gaging stationhas been operated on Chalk Creek by the Geological Survey,7
, Surface water supply of the United States, 1944, Part 10, Great Basin: U. S.Geol. Survey Water Supply Paper 1010. p. 185, 1945.
20
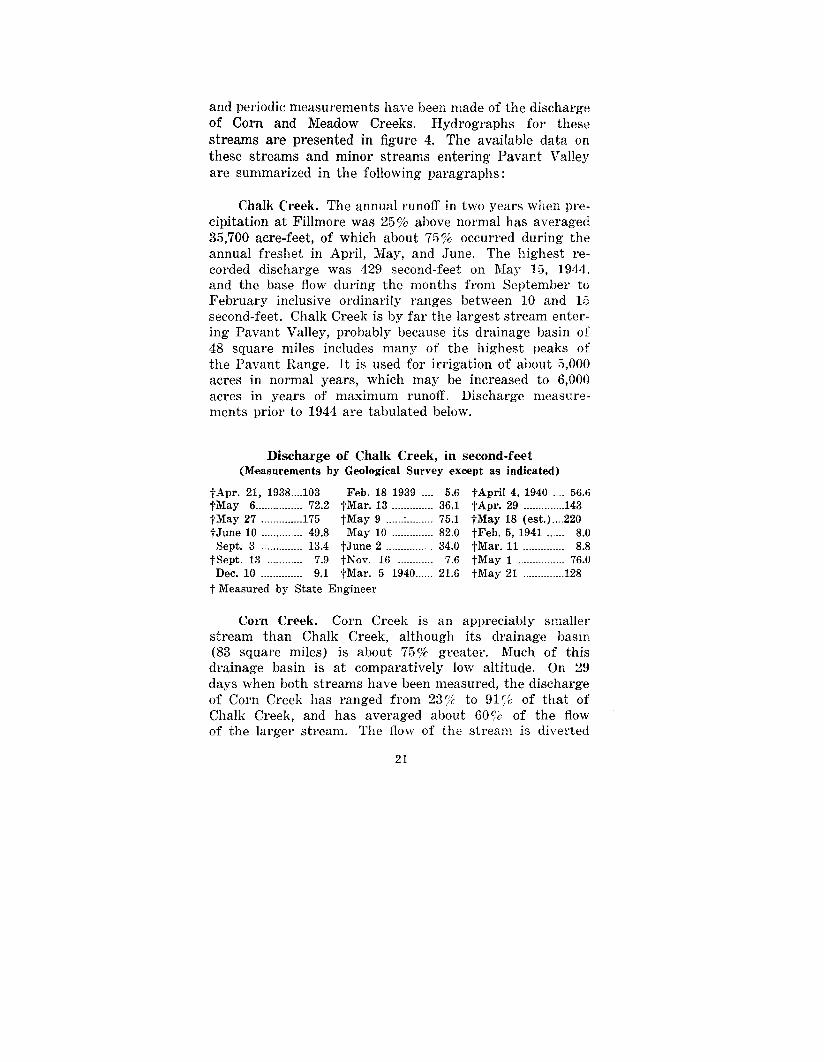
and periodic measurements have been made of the dischargeof Corn and Meadow Creeks. Hydrographs for thesestreams are presented in figure 4. The available data onthese streams and minor streams entering Pavant Valleyare summarized in the following paragraphs:
Chalk CreeI{. The annual runoff in two years when precipitation at Fillmore was 25% above normal has averaged35,700 acre-feet, of which about 75% occurred during theannual freshet in April, May, and June. The highest recorded discharge was 429 second-feet on May 15, 1944.and the base flow during the months from September toFebruary inclusive ordinarily ranges between 10 and 15second-feet. Chalk Creek is by far the largest stream entering Pavant Valley, probably because its drainage basin of48 square miles includes many of the highest peaks ofthe Pavant Range. It is used for irrigation of about 5,000acres in normal years, which may be increased to 6,000acres in years of maximum runoff. Discharge measurements prior to 1944 are tabulated below.
Discharge of Chalk Creek, in second-feet(Measurements by Geological Survey except as indicated)
tApr. 21, 1938 103 Feb. 18 1939 5.6 tApril 4, 1940 ., 56.6tMay 6 72.2 tMar. 13 36.1 tApr. 29 143tMay 27 175 tMay 9 : 75.1 tMay 18 (est.) 220tJune 10 49.8 May 10 82.0 tFeb. 5, 1941 8.0
Sept. 3 13.4 tJune 2 34.0 tMar. 11 8.8tSept. 13 7.9 tNov. 16 7.6 tMay 1 76.0Dec. 10 9.1 tMar. 5 1940 21.6 tMay 21 128
t Measured by State Engineer
Corn Creek. Corn Creek is an appreciably smallerstream than Chalk Creek, although its drainage basin(83 square miles) is about 75% greater. Much of thisdrainage basin is at comparatively low altitude. On 29days when both streams have been measured, the dischargeof Corn Creek has ranged from 23% to 91% of that ofChalk Creek, and has averaged about 60% of the flowof the larger stream. The flow of the stream is diverted
21

I
I I I I I I I I-+---i +,::~
FiQ.4- H)'dr09'ophs for Choltl, Corn
1j
tv
'".5
ti5
'3
1944
-~.-
ond Meado" Cr••h, 1944- 1945
,~--_..
~.
/
1944
70041
700&1
1,2~
3,78016,590
9,1002 ,150
1,130813
813
707
68338,416
4} E,hmated
--_-of-~
1945

Jan. 13, 1938 ..Mar. 10 .Apr. 21 .May 6 .May 26 .June 9 .Sept. 15 .Nev. 10Mar. 30, 1939 .May 9 .June 2 .Aug. 14 ..Nov. 16 ..
for irrigation of 4,000 to 4,500 acres in most years. Discharge measurements of Corn Creek: are tabulated belo·w.
Discharge of Corn Creek, in second-feet(Measured by Utah State Engineer prior to October 19(3; since
that date by Geological Survey)
7.1 Mar. 5 1940 4.9 June 16, 1944.... 51.16.9 Apr. 4 30.5 July 20 ,....... 15.6
91.3 Apr. 29 85.2 Aug. 22 7.146.4 May 18 41.0 Oct. 14 . 7.963.2 Feb. 5, 1941 ..,... 7.2 Nov. 14 6.432.1 Mar. 10 7.8 Dec. 19 7.6
7.2 May 6 51.7 Jan. 31, 1945 7.34.6 May 22 92.1 Mar. 14 8.2
25.1 Oct. 31, 194.3 . 6.4 Apr. 26 85.721.6 Dec. 9 6.7 May 24 65.011.8 Feb. 16, 1944 8.2 June 28 28.75.1 Mar. 30 14.2 Aug. 4 21.76.2 Apr. 27 58.9 Aug. 29 14.5
May 24 129 Oct. 15 _...... 13.1
Meadow Creek. The drainage basin of Meadow Creekcovers only 10 square miles, but includes several highpeaks. Measurements during 1944 and 1945 have shownthe discharge to be about 20,/;' to 25% of that of ChalkCreek. The flow, together with that of Walker Creek,irrigates about 1,800 acres in normal years.
Dischllirge of Meadow Creek, in second-feet(Me,asurements by Geological Survey except as indicated)
t Apr. 21, 1938 40 :j:May 18, 1940 27.2 Oct. 14, 1944........ 2.6tMay 6 18 :j:May 22 45.2 Nov. 14 . .. ._.__ 2.6tMay 26 75 Oct. 31, 1943 .. _. 1.5 Dec. 10 .. __ _. 2.0tJune 9 .. __ 20 Dec. 9 .. _ .. 1.2 Jan. 31, 1945 .___ 1.8tSept. 15 ._ _.. .5 Mar. 30, 1944.... 4.6 Mar. 14 .._............. 5.utNov. 10 _ _... .7 Apr. 27 _._ 11.3 Apr. 26 17.6:j:May 9, 1939 .. __ ., 14.4 May 24 61.0 May 24 35.8:j:June 2 . _..... 6.6 June 16 _. __ .._ 38.5 June 28 20.2:j:Mar. 5, 1940 .... 3.6 July 20 9.9 Aug. 4 ._.. __ ._........ 7.4:j:Apr. 29 "._."_'_"'_ 25.3 Aug. 22 3.9 Aug. 29 _. __ . 4.9
Oct. 15 _ __ 2.9t Estimated by State Engineer:j: Measured by State Engineer
Minor Streams. The smaller streams entering PavantValley are intermittent, that is, they are dry at the mouthsof their canyons during parts of most years, although theremay be flow in portions of their canyons in the mountains.Measurements of Sunset Ci'eek on June 16, 1944, sho\'/ the

rate of seepage as these streams cross the upper portion oftheir alluvial fans: the flow at the mouth of Sunset Canyon",vas 11.1 second feet, and 11;2 miles farther west, it was 8.9second-feet, indicating a loss of more than 10% in a flowdistance of less than 1% miles.
Available data on minor streams are summarized below,based chiefly on information supplied by Mr. George Whornham, the Millard County Agricultural Agent.
Data on Minor Streams in Pavant Valley
Stream
I I Estimated I LI Drainage: Flow 1-----~ -I Basin i (second-feet) ,Irrigated II
I (sq. mi.) 1-· I i Area Location
IFlood I (acres)
\ Base Maximum !
Nest Eightmile Creek 12 i 0 15 200 IGreenwoodast Eightmile Creek.. 16
I0 25 300 North Holden
ild Goose Creek ........ 7 0
2naple Hollow -_ ...... _..... 6 0 650 Holdenioneer Creek .............. 15 i 2ine Creek .................... 6 I 1 25 500 Fillmorealker Creek 4 ! 0 5 I *
Sunset Creek ................ 6
I1 30
I300 Hatton
Cottonwood Creek 4 0 5 100 Hattonry Wash ...................... 7 I 0 15 100 I West Kanosh
-
"\EWMppW
D
* Part of Meadow Creek system
GEOLOGIC RELATIONS
The geology of a large part of Pavant Valley and thePavant Range to the east has been described in considerable detail by Maxey.8
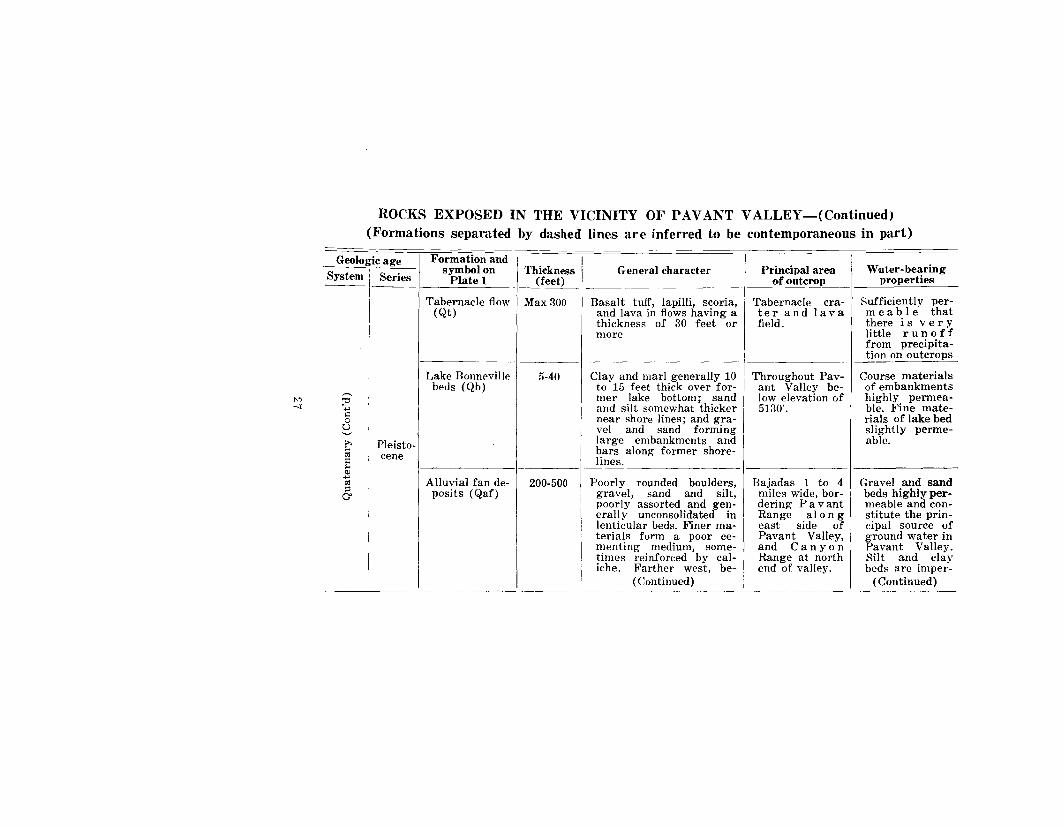
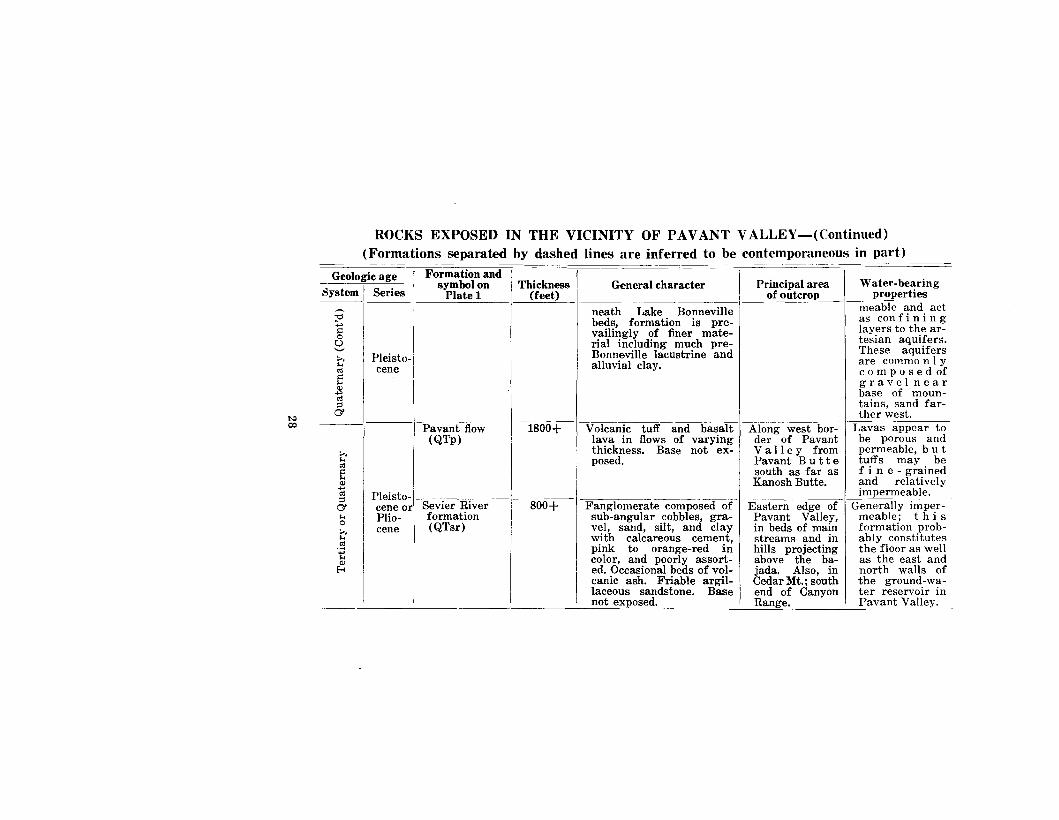
The areal geology is shown on plate 1, and the stratigraphic and hydrologic characteristics of the geologicformations which crop out in the vicinity of Pavant Valleyare summarized in the following tabulation (pp. 26-32.)
The unconsolidated sediments of Recent and Pleistoceneage, dominantly gravel, sand, silt, and clay, constitute thevalley fill and underlie the floor of Pavant Valley to depthsof 500 feet or more. Ground water o'ccupies the voids orinterstices between the individual grains of these sediments,and the Pavant Valley ground-water reservoir is essentially
8 Maxey. G. B .• Geology of a. pal't of the Payant Range, Millard Co., Utah: Am.Jour. Sci .. vol. 244, pp. 324·356, 1946.
24

limited to these unconsolidated sediments. The pre-Pleistocene formations are composed of consolidated rocks suchas sandstone, limestone, shale, and quartzite. These rocksform the Pavant and Canyon Ranges, which constitutethe east and north rims of the ground-water reservoir, andextend under the floor of Pavant Valley to form the lowerlimit of that reservoir.
The basalt cones and lava fields which form the westborder of Pavant Valley do not form a ground-water barrieror retaining wall of the sort provided by the Pavant andCanyon Ranges along the other margins of the valley,These volcanic materials in part overlie the alluvial andlacustrine beds which are encountered in Pavant Valley,and may well permit loss of ground water from the valleyby westward movement. Older lava flows and volcanicmaterials occur beneath the valley plain and are encountered in wells; these may be highly permeable and maylikewise permit discharge of ground water from PavantValley. Thus the ground-water reservoir in this valley maywell leak considerably along its western margin.
In their relationship to the occurrence of groundwater, the geologic formations may be divided into thepre-Quaternary formations, which are generally consolidated and relatively impermeable, and the Quaternary formations, which include many highly permeable zones andconstitute the principal source of ground water in PavantValley.
WATER IN THE PRE-QUATERNARY ROCKSThe pre-Quaternary formations which make up the
Pavant Range yield through springs and seeps the bulk ofthe stream flow entering Pavant Valley, except when thereis runoff from melting' snow. In particular, springs risingin the Paleozoic limestones supply most of the base flo,",\"of the perennial streams. Some of the largest limestonesprings are those which occur in Chalk Creek canyon between Threeforks and Chokecherry Creeks, and at BalsamCamp. There are also large springs in Meadow Creek canyon near the confluence of the two main branches, and inthe East Fork of Corn Creek about two miles above itsconfluence with Second Creek. Springs localized by faultsare rather common, but genel'ally have small yields. Examples are the springs in North Canyon, near Black CedarHill, and along the thrust fault south of Kanosh.
In Pavant Valley, the pre-Quaternary rocks appear tobe of no importance as SOl\l'ces of ground watel'. Outcrops
25

~0;
ROCKS EXPOSED IN THE VICINITY OF P AVANT VALLEY(Formations separated by dashed lines are inferred to be contemporaneous in part)
---
Geologic age Formation and
System I Seriessymbol on Thickness General character Principal area Water-bearing
Platel (feet) of outcrop properties-~
AlIuvium (Qal) Max 25 River silt, sand, gravel, Beds of streams Sand and gravelsome large boulders, poor- and gullies highly permea-Iy to moderately well as- throughout area. ble, finer mate-sorted rials less so.
--~--~~----~--
Sand dunes (Qd) Max 50 Wind-blown sand, well as- Northwestern Highly permea-sorted part of valley, ble.
extending fromslopes of Pav-
>. ant Butte.
'"------------ -- -_.-
~ Gypsite (Qg) Max 20 Greenish-gray gypsiferous Spring and playa ModeratelyE per-Q) clay, with beds of granu- area south of meable...., Recent lar gypsum up to 7 feet White Mt.~::s thick in upper part01 ---~- -----
Ice Springs cra- Max 400 Basalt scoria, lapilli, and Ice Springs cra- Highly permea-tel's flow (Qis) lava in flows having thick- tel'S and lava ble so that pre-
ness of 30 feet or more field. cipitat ion onoutcrop is en-tirely absorbedwithout runoff.
-- .-- _._-_.~-_.- ----
Calcareous tufa Max 30 Spring deposits of calcare- Spring and playa Moderately per-(Qc) ous tufa area south of meable
White Mt.
""-..J
ROCKS EXPOSED IN THE VICINITY OF PAVANT VALLEY-(Continued)(Formations separated by dashed lines are inferred to be contemporaneous in part)
Geologic age Formation and I
System Seriessymbol on Thickness General character Principal area Water-bearing
Plate 1 (feet) . __()f outcrop__ properties
Tabernacle flow Max 300 Basalt tuff, lapilli, scoria, Tabernacle cra- Sufficiently per-(Qt) and lava in flows having a ter and lava mea b I e that
thickness of 30 feet or field. there i s v e r ymore little runoff
from precipita-
----tion on outcrops
Lake Bonneville fi-40 Clay and marl generally 10 Throughout Pav- Course materialsbeds (Qb) to 15 feet thick over for- ant Valley be- of embankments
~ mer lake bottom; sand low elevation of highly permea-'1;l...., and silt somewhat thicker 5130'. ble. Fine mate-l':
Inear shore lines; and gra- rials of lake bed0
u vel and sand forming slightly perme-~
;>, Pleisto- I large embankments and able.... bars along former shore-~ cenel': lines....Q)...,
Alluvial fan de- 200-500 Poorly rounded boulders, Bajadas 1 to 4 Gravel and sando:l;::I posits (Qaf) gravel, sand and silt, miles wide, bor- beds highly per-Ot
Ipoorly assorted and gen- dering P a vant meable and con-erally unconsolidated in Range along stitute the prin-
i lenticular beds. Finer ma- east side of cipal source ofterials form a poor ce- Pavant Valley, ground water inmenting medium, some- and Canyon Pavant Valley.times reinforced by cal- Range at north Silt and clayiche. Farther west, be- end of valley. beds are imper-
I I (Continued) ( Continued)- _._-------
Lavas appear tobe porous andpermeable, buttuffs may befin e - grainedand relatively
Pleisto- --. I --------- impermeable.cene or Sevier River 800+ Fanglomerate composed of Eastern edge of Generally imper-Plio- formation I sub-angular cobbles, gra- Pavant Valley, meable; t hiscene (QTsr) vel, sand, silt, and clay in beds of main formation prob-
with calcareous cement, streams and in ably constitutespink to orange-red in hills projecting the floor as wellcolor, and poorly assort- above the ba- as the east anded. Occasional beds of vol- jada. Also, in north walls ofcanie ash. Friable argil- Cedar Mt.; south the ground-wa-laeeous sandstone. Base end of Canyon ter reservoir innot exposed. Range. Pavant Valley.
Pleistocene
;::.0$eQ)
~::sC1,.,o
~.
'iQ)
Eo<
~
'"C+>I::o
Co)'-'
>.,.,0$
CQ)
~::sC1
Geologic age
System I Series------
---I l-pavantflow--I--1800+I~volcanictuff and basalt AIlJ"ng--weStboi:-(QTp) lava in flows of varying der of Pavant
thickness. Base not ex- Vall e y fromposed. Pavant But t e
south as far asKanosh Butte.
ROCKS EXPOSED IN THE VICINITY OF PAVANT VALLEY-(Continued)(Formations separated by dashed lines are inferred to be contemporaneous in part)
--------- Formation and I I -===symbol on Thickness General character Principal area Water-bearing
Plate 1 (feet) of outcrop propertiesneath Lake Bonneville meable ~nd. actbeds, formation is pre- as con fIn 1 n gvailingly of finer mate- lay~rs to t~e ar-rial including much pre- teSlan aqUIfers.Bonneville lacustrine and These aqUIfersalluvial clay. are commo n I y
com p 0 sed ofgravelnearbase of mountains, sand farther west.l>:l
co

t.:l~
ROCKS EXPOSED IN THE VICINITY OF PAVANT VALLEY-(Continued)(Formations separated by dashed lines are inferred to be contemporaneous in part)
Formation and--
Geologic age i
System Seriessymbol on Thickness General character Principal area Water-bearing
Plate 1 (feet) of outcrop properties---- .---
Miocene Rhyolite (Tr) 50+ Light-gray vesicular rhyo- Small knoll west Relatively imper-('I) lite and black vesicular of K a nos h, permeable, com-
obsidian. Base not ex- known as p'l.red to theposed. "White M 0 u n - basaltic vol can-
tain." ics des c ri bedabove.
Eocene Was a t ch for- 2000-4000 Lower part includes 300- Crest and eastern Formation in -mation (Tw) foot basal conglomerate slope of Pavant cludes so m e
of quartzite pebbles with Range. moderately per-red sandy clay matrix, meable sand-
:» overlain by beds 5 to 400 stone and con-.....S feet thick of light sand- I glomerate beds,+' stone, sandy and algal and sol uti 0 n....OJ limestones, and more con- channels inE-< glomerate in repeated se- limestone,
quence. Upper part, ex- which becauseposed only on east slope of easterly dipof range, is predominant- carry waterIy yellow, bright pink and from higher
I
red non-resistant shale parts of Pavant
Iwith some limestone, Range east-sandstone, and conglom- ward into Sevier
I erate. and Round VaI-
I I leys. Produces
IsOllie springs on
IPavant Valleyside.--

ROCKS EXPOSED IN THE VICINITY OF PAVANT VALLEY-(Continued)(Formations separated by dashed lines are inferred to be contemporaneous in part)
wo
Geologic age
'"'00rnoS
'CEo<"Cl::oS
'"'wfIJ
r:::l....,
'"'00rnoS
~
Formation andsymbol on
Plate 1
Sandstone (Jr)( re ferable toNavajo s andstone andChinle formation.)
Shinarump conglomerate(Trs)
Thickness(feet)
2000+
80
General character
Well assorted, light red,fine to medium sandstone,in cross-bedded, massivebeds; some thin-beddedsandstone, and purplishred shaly sandstone.
Light gray to tan mediumsandstone with thin layers of pebble conglomerate, forming ridges ofthin to massive beds.
Belt 1 to 5 mileswide along lowerwestern slopes ofPavant Ran g csouth of Pioneercanyon.
Thin, discontinuous belt at baseof PavantRange.
Water-bearingproperties
Some beds aresufficiently porous or fracturedto be moderately perm e a b I eand give rise tosmall springs incanyons crossing the outcrop.However, formation is tooremote from thevalley fill to affect supplies inground - waterreservoir.
Dense and relatively imp ervious

<:.>'@
(/Joj.~
Eo-<
>::~
.~Q)
Il..
c:",....
ROCKS EXPOSED IN THE VICINITY OF PAVANT VALLEY-(Continued)(Formations separated by dashed lines are inferred to be contemporaneous in part)
Geologic age Formation and~-~_. -I-~---~ symbol on I Thickness I General character Principal area Water-bearing:O;;ystem Series Plate 1 (feet) of outcrop properties
I Moenkopi for- I 470+ I Light grey, finely crystal- Discontinuous belt Generally imper-mation (Tr m) I line, argillaceous lime- % mile wide in mea b Ie. The
stone overlain by maroon, lower foothills shales act assandy, laminated, soft red of western slope bar r i e r s toshale and inter-bedded Pavant Range. ground-w ate rsandstone. movement, and
give rise to
I
small springs inoverlying limestone and sand-
--- -I-~- I I stone beds.
II Kaibab lime- 300+ Grey, fine to medium, crys- Low hills pro- Impermeable ex-
stone (Pk) I I talline cherty limestone jecting above ba- cept along bed-I I in medium to thin resist- J.'ada along base ding planes andI ant beds. Base not ex- 0 f P a van t joints w h i c hI posed. Range south of have been wid-j Meadow Creek. ened by solu
tion.

ROCKS EXPOSED IN THE VICINITY OF PAVANT VALLEY-(Continued)(Formations separated by dashed lines are inferred to be contemporaneous in part)
Geologic age
System I Series
Formation andsymbol on
Plate 1Thickness
(feet)General character Principal area
of outcropWater-bearing
properties
Wt-.:l
;'C,!:>
StilU
§'1::,!:>
§U
'"Q)
~...:l
Undifferentiated I 2500+limestone (Cl)
Tintic quartzite I 3000+(Ct)
Grey. compact to crystalline limestone in thin tomedium, sometimes massive, beds, with a few thinbeds of tan to green shalein lower part.
Pink to white, fine tocoarse meta-quartzite inmassive to medium beds,with many layers of pebble conglomerates andwith micaceous shales inthe upper part. Base notexposed.
Belt 0.1 mile to 1mile wide alonghigher westernslopes of PavantRange.
Belt 1 to 3 mileswide alonghigher westernslopes of Pavant Range.
Moderately permeable as a result of development of solutionchannels. Manyof the largestsprings in thePavant Rangeissue from theserocks. and supply most of thebase flow of theperennialstreams
Generally impermeable and actsas barrier toground-w ate rmove men t inoverlying limestone, so thatsprings emergenear contact.

Thickness Depth
in the foothills and in the central part of the Valley areimpervious materials which would yield little or no water.Beneath the floor of the valley, these formations havebeen encountered in several deep wells drilled in the northcentral part of the valley near West Mountain and BaldMountain. The log of one of these wells is reproducedbelow.
Log of Westwood Oil Co. Well No. (C-20-5)36cbdlDrilled in 1914
Material
Pleistocene lacustrine and alluvial sediments:
Unconsolidated material, water level 50 feet belowland surface . 64 64
Sevier River (?) formation:Shale, light brown . 34 98Shale, light gray, fossiliferous........ . 3() 128Shale, blue, paraffin shavings in lower part 52 180Shale, light blue, water bearing 145 325Shale, light gray, petroliferous...... . 135 460Shale, gray, hard, some grit, with sulphur water 38 498Sandstone, gray, oil-bearing 18 516Shale, fossiliferous 14 530Shale, light gray, with salt water 60 590Shale, blue, with salt water 25 615Shale, gray, fossiliferous, with salt water........... 59 672Shale, gray, petroliferous 46 718Shale, blue............................... . 22 740Shale, gray.................................... 22 762Shale, blue, probably fossiliferous 32 794Shale, gray . 31, 830Shale, blue, fossiliferous . 36 865Sandstone, dense 28 893Unknown 37 930Shale, blue 140 1,070Shale, brown, gray and blue, petroliferous 130 1,200
Another well drilled unsuccessfully for oil in sec. 15,T. 20 S., R. 5 W., was 1800 feet deep, and is reported to havepenetrated quartzite for much of this distance. The deepest well now extant in the Valley, No. (C-20-5) 27bcb1,"
9 The well number indicates the location of the well with reference to landRubdivision, according" to a system adopted by the State enj.{ineer and described inhis Twentieth Biennial Report, page 87, 1936. Briefly, the State is divided into fourquadrants by the Salt Lake base and meridian. and, according to the well-numbering system, these quadrants are designated by cavital letters, thus: A for the northeast quadrant, relll'eSenting- townships north. l'ang·es east; B for the northwestquadrant; C, south"vest; and D, southeast. In the well numbf>1", the designation ofthe township is inclosed in parentheses, and includes one of these letters, a figureshowing- township, and H fig-ure showing; range. Thu~, in the number of the weIIhere cited, the portion within parentheses indicates that the well is in T.~OS. R.,j\V.The number following- the PHl'entheHis designates the section, and the lower-caseletters following the section number give the location of the ,veIl within the section.the first letter indicating- the quarter section (the letters a. b, c, d. repl'€sentinl?;respectively the northeast, northwest, southwest. and southeast quarters, as beforeiand succeeding letters showing location within the quarter section down to a to-acretract. Thus, well (C-20-5)27bcbl reIH'esents weB 1 in the NW1/~ S'Vl::l, N\~ll/~ sec. 27.T.20S., R,5W.
33

IIlII"""""'"''''''''tllllulI(C 21-~17ddc
Mlon IC- 21'~il8 eeel
a,o•• (C·21·~)1 bebl
~ooll8rOI, (C·ZI-5)1 Md·2
0.".1';"_." f IC-21-!! 11'tld,,_1"
0.1..8,11111'''' I (C·2I-iS)17bdcl-2
1~!lI ~·DJ J C Gn,I""",, (C-21-5) 11cob-1
CI NOdI8,u(C·21.!l)l1.h!-1
3 l l E.F. loll Ie 21-5)20110 -I
~DIk/ll""'II(C21!lldOdI
Jl.Rot,," /I Ie 21 51200011 I
Slot...IU h(C21·5)2"bo·r
,~~. l~ ~. SomUIy(C2ttl2S011cll
!~*~ Flow.IIFomIIC21529dCO.j-f
So UTl.~ Ie V-51 30 " ... ,
C-21-5) 3 doo-'
-21-5):5 clod-I
JohnCorlinQ
Ro S......... C-ZI-513"cb-1
So \Jfl.~ Ie 21·51 31 cdcl-l
Flowell Fer.., ee 21·513200 ·1
Flo...11 FOIl IC_21!i)!2ocb<
fLHn IC-21132dd't-1
H.RobIIlIO'> C-21-!!I!b.It-1
%
f!~': ft---t---t--+--1f--+--+--+--~--'+~-~:"-."_..-1:f-'::_,.,,_~_·,+'..-_+'-i___j
34

is reported by the driller to have penetrated shale, clay,and sandstone below 560 feet depth, which may be partof the Sevier River formation. The logs of this well andof others in Pavant Valley are shown graphically on figure 5.
WATER IN THE QUATERNARY ROCKS
The valley fill consists of relatively long, thin andnarrow lenses of poorly-assorted alluvial fan gravel, sand,silt and clay, interbedded with the more widespread andcontinuous deposits of well-assorted lacustrine clay, marl,silt and near-shore sand and gravel. The sand and gravelbeds of this fill constitute the ground-water aquifers. Theyare the conduits through which the water is transmittedunderground from intake areas along the upper parts ofthe alluvial slopes to wells and points of natural dischargewestward and northwestward. These beds of coarser materials are also the chief reservoirs in which the water isstored until discharged, although a small part of the waterstored in the silts and clays may become available to theaquifers by slow percolation into them during periods oflarge discharge. The aquifers are more extensive and arecomposed of coarser, more permeable material near themountain front; they become progressively less permeablewestward. The lacustrine clay beds which form the chiefconfining beds vary in lateral extent, for they were deposited in periods of restricted or expanded lake areas, butnone of them extends as far mountainward as the shoreline of the Bonneville stage of Lake Bonneville. Thus thevalley fill contains a number of more or less interconnectedaquifers extending westward in finger-like projections fromtheir more thoroughly interconnected portions which cropout at the surface near the mountain front. Practically allof the water obtained from wells in Pavant Valley comesfrom these aquifers. This study is therefore concernedprimarily with where and how much water gets into theseaquifers, where and at what rate it moves through them,and where and in what quantities it is discharged fromthem.
The Quaternary volcanic rocks which border PavantValley on the west are highly permeable, and absorb readilymost of the water that falls on them as precipitation. However, they do not contribute any appreciable ground-watersupplies to Pavant Valley. Instead, the aquifers of thevalley fill may discharge into porous volcanic materialswhere the two come in contact. Thus these lavas and asso-
35

ciated rocks constitute one means by which gTound wateris discharged from the ground-water reservoir.
The character of the materials that form the groundwater reservoir is determined chiefly by examination ofdrillers' logs and other data obtained during constructionof wells. Many of these records are inaccurate, because thewells were completed long before the logs were prepared.Efforts to correlate the water-bearing horizons encounteredin adjacent wells were unsuccessful, partly because of errorsin these records, and no doubt also because the gravel andsand of the aquifers were deposited in discontinuous, irregular, and lenticular beds, as is typical of alluvial deposition.However, several general conclusions may be drawn concerning the character of the valley fill, based on study ofthe logs shown graphically on figure 5, and of sedimentsencountered in shallow test holes.
The Lake Bonneville beds immediately beneath thesurface at a large number of wells form a layer of whitemarl rather uniformly 9 to 17 feet thick, thinning rapidlyeast of the Provo shore line, (the shoreline formed at theProvo stage of Lake Bonneville). This marl includes a thinlayer of basalt and lapilli which may correspond to theeruption of Tabernacle Crater, prior to the Provo stage.The marl is generally underlain by a bed of gravel andsand 1 to 15 feet thick. Ground water occurs in this gravelgenerally under water-table conditions. The shallow gravel,or in its absence, the white marl, rests upon red or yellowclay as much as 45 feet thick, which is probably a playaand flood plain deposit, at least around the outer marginsof the valley, but which may represent the earlier depositsof Lake Bonneville ("yellow clay" of Gilbert) in the lowestpart of the valley.
In some wells in the western part of the valley andwithin 2 miles of the Ice Springs Craters flow, lava isreported at depths of 40 to 80 feet. For many other wellsin this same general area and farther east, "hardpan" orgravel was reported at this horizon, averaging about 60feet beneath the surface. This coarser detritus may correlate with the lava reported in the westernmost wells.Shallow ground water occurs in this gravel horizon undersufficient pressure to rise approximately to the level of thewater table in the gravel beneath the white marl.
The shallowest artesian aquifer occurs at a depth ofabout 140 feet in the easternmost wells, but apparentlylenses out to westward, for it is not encountered in wellsin the western part of the developed area.
36

The principal artesian aquifers are penetrated at depthsof 200 to 400 feet in most wells. Ordinarily at least threeor four and sometimes six or more water-bearing beds areencountered in this zone.
Most of these conditions are indicated in the profile ofthe central part of Pavant Valley presented as Figure 6.This section is based on the logs of the wells indicated,supplemented by interpretation of available geologic andhydrologic data for zones which have not been penetratedby wells. Thus the buried hill of Sevier River formationis postulated as an extension of the south end of West Mountain, and the discontinuity of beds in the eastern part ofthe section is based on the hydrologic characteristics ofwells in that area.
The beds which constitute the aquifers have gentlewestward and northwestward dips and the confining bedsdip even more gently in the same direction. As water moveswestward in the aquifers beneath the clay beds, it is confined by them giving rise to the artesian conditions whichproduce flowing wells at lower elevations in the valley.On the other hand the water in aquifers on the higherparts of the alluvial slopes and in the shallowest aquiferover much of the lower valley is essentially unconfined andits upper surface constitutes a water table.
GROUND-WATER DISTRICTS
Detailed study shows that the Pavant Valley groundwater reservoir is not a single homogeneous unit, but thatit includes several subdivisions in which the hydrologiccharacteristics may vary considerably from those of adjacent subdivisions. These subdivisions or ground-water districts are delimited on the basis of geologic or hydrologicconditions in large part, although economic developmentmay also be an important factor. For convenience in subsequent discussions these ground-water districts are defined in the following paragraphs, and their boundaries areshown on plate 1. The basis for subdivision will appeal'in the discussions of ground-water occurrence and movement which follow.
The Fillmore district includes the upper part of theChalk Creek alluvial fan, plus the smaller North Canyonand Pine Creek fans which are adjacent to the north andsouth, and comprises essentially the recharge area for theFlowell ground-water district farther west. The Fillmore
37

:!100
7dde·1et>
0 !!Ieu·115D
'OIlOill-1033e-«=)"
~
'"~ lSbc,-10
"~0c;
'""'"..."
!lo....10~
~
"'"'<c.a0
'"o'K
<T~ 5 ~
5'
0
0"'";"col> 12 bo4ll-1
!'-
"0;;;:-
rn~IIDI~E31m
'" ~0
~0
I \:) :<
[ ~ ii ~
;; ... ".
" ~ .. '-'0
~oa
3~
z 0 00
3 J> 0 0-.... ;0 0 • w
Z 0 ~g;; ;;
38

district is bordered on the east by the base of the PavantRange; on the south by the divide between Pine andMeadow Creeks; on the west by the Provo shore line; andon the north by Cedar Mountain and West Mountain.
The Flowell district occupies the lake plain west ofthe Chalk Creek alluvial fan and includes the principalarea of artesian well development in Pavant Valley. It isbordered on the east by the Fillmore district at the Provoshore line, which is considered to be the eastern limit ofthe lacustrine clays that confine the Flowell water underartesian pressure; on the south by the Meadow district;on the west by the Ice Springs lava field; and on the northby the Pavant District.
The Meadow district is situated on the Meadow Creekalluvial fan, and includes a small area on the lake plainwhere flowing wells have been obtained. It is bordered onthe east by the base of the Pavant Range; on the south bythe Hatton district; on the west by the Tabernacle lavafield; and on the north by the Flowell district.
The Hatton district occupies the alluvial fan of SunsetCreek, the lower parts of the Corn Creek and CottonwoodCreek fans and the lake plain west of those fans. Itincludes a small area in the vicinity of Hatton villagewhere unconfined water has been pumped for irrigationand other uses. No artesian wells have been obtained, butnumerous springs rise in the western part of the district.The district is bordered on the east by the Pavant Range;on the south by the Kanosh district; on the west by lavafields; and on the north by the Meadow district.
The Kanosh district on the upper part of the CornCreek alluvial fan has not been prospected for groundwater, but is considered to be comparable in water resourcesto the Fillmore district on the Chalk Creek fan. It isbordered on the east and south by the base of the PavantRange, on the west by the Kanosh Butte lava field; andon the north by the Hatton district.
The Pavant district embraces the alluvial fans ofPioneer Creek and smaller streams farther north, and thelake plain west of these fans where many small flowingwells have been obtained. It is bordered on the east by thePavant Range, on the south by Cedar Mountain, WestMountain, and the Flowell district; on the west by thePavant lava fields; and on the north by the Sevier desertand the Canyon Range.
3G

OCCURRENCE OF GROUND WATER
UNCONFINED WATER
Several wells have been dug or drilled in Pavant Valleyto comparatively shallow depths in permeable beds of graveland sand, in which the water does not rise above the levelat which it was first encountered. This water, not confinedunder pressure, lies in a saturated zone whose upper surface is defined as the water table. The number of wellsyielding water from shallow zones is insufficient to definethe water table throughout the valley. Indeed, there areonly three small isolated areas where any wells are available for determination of the water-table conditions. Theconditions in these areas are discussed briefly below.
Fillmore District
Several wells have been dug or drilled in the "OldField" area about 2% miles northwest of Fillmore, in whichwater was encountered 30 to 70 feet beneath the landsurface. In three of these, periodic measurements of waterlevel have been made since 1943 which show the conditionsof occurrence of ground water in this portion of the ChalkCreek alluvial fan. The water level in the Brunson well,No. (C-21-4)7 bbd1, declined steadily from March 1943 toMarch 1944, and then rose more than 30 feet by June ofthat year. From then until March 1945 there was a declineof about 12 feet, and in the spring of 1945 the water levelrose 15 feet, to a level 3 feet higher than had been recordedin the spring of 1944. In the Partridge well No. (C-21-4)7cbal (which is about 1600 feet south of the Brunson well),the fluctuations of water level are parallel to those in theBrunson well, but the elevation of water surface above sealevel is ordinarily about 18 feet higher. In the Hattonwell (C-21-4) 12badl, the water surface is ordinarily 50 feetlower in elevation than in the Brunson well which is % mileto the east; seasonal fluctuations of water level are similarbut of less amplitude, and the periods of rise and declineordinarily occur one to two months later. Hydrographsfor these wells are included on figure 7.
These records suggest that the aquifers supplying thethree wells are imperfectly connected, each well probablybeing developed in a separate "finger" of the alluvial materials. The continued decline in water levels through the
40

Tesl well <C-22-5) 7eoo
WELLS IN ARTESIAN
AQUIFERS
FiQ.7- Hldr"'Jrophs for 10 ...... in Po>ool Volley, 1943-1945.
41

spring and summer of 1943 and the sustained high levelsin the fall and winter of 1944-45 suggest that the shallowwater in this area forms a series of perched water tableswhich rise as water enters through the more permeablechannels during years and seasons of recharge. Graduallythis water percolates into the lower gravels which are moredirectly connected with the artesian aquifers. The shallowwaterbearing zones thus function as temporary storagereservoirs and extend the period of recharge to the mainartesian reservoir.
Hatton District
In the area south of Meadow and west of highwayU. S. 91 to and including the village of Hatton, about 20wells have been dug or drilled to the water table, of whichfour have been pumped for irrigation. Depth to the watertable ranges from about 60 feet in the easternmost andsouthernmost wells to about 8 feet in the wells at thenorthwest margin of the area.
The elevation of the water table varies considerablyfrom well to well and there are too few wells to define thewater table over the area. However, the available datasuggest a northwestward slope of the water table similarto that of the piezometric surface of the artesian aquifersof the Meadow area. It appears that the water table in theHatton area may be continuous with the piezometric surface of the artesian aquifers in the Meadow district.
Flowell and Meadow Districts
In an area which extends westward from Flowell,Meadow and Hatton to the lava fields, the water table isencountered at depths ranging from 1 to 15 feet belowthe land surface. The total area occupied by this shallowwater comprises nearly 20 square miles. Springs occur inseveral parts of this area, notably along the Meadow Sloughwhich runs northwesterly and northerly through the central part, and in the Warm Spring area farther west.Where the water table is less than 7 feet deep, the surfaceof the ground is damp throughout the year. Salt grass andother halophytes grow over much of this damp surface.
According to observations in two auger holes and onedug weII in this shallow water area (see hydrograph forwell (C-22-5)7caal on figure 7), water levels are lowest in
42

September and October, then rise until about the middleof April, when a decline begins which lasts until the following September or October. Water levels remained higherduring the summer and fall of 1945, than in like periodsof the two preceding years. It is significant that the risein the water table in this area begins soon after the artesianwells are closed in the fall and continues until shortly afterthe wells are opened in the spring. Artesian pressures remained high during the summer and fall of 1945 as compared to the same period of the previous year and thewater table likewise remained high. It seems probabletherefore that a considerable and perhaps a major contribution to the water table in this area comes through theconfining beds from the artesian aquifers. The water tablemay be lowered appreciably in some areas because of lossesdue to evaporation and transpiration during the summer.
That the water table in this area was formerly higherand that springs were more numerous and their flows largeris indicated by local reports and by comparison of presentconditions with those reported by Meinzer in 1908.'0 Thegeneral COnsenSUS is that the springs west of Meadowbegan drying up about the time the majority of flowingwells were drilled in the Flowell area - chiefly from 1915to 1930. During 1943 and 1945, when artesian pressureswere higher than they had been since 1929, some of theseold springs again flowed. It is reported that the watertable in the Flowell area declined throughout the periodof well construction, but its position has changed verylittle since 1930.
Pavant District
Very few of the existing wells in the Pavant districtend in the shallOW zone of unconfined water. However, in1908, Meinzer found more than a dozen shallow wells in thetown of Holden, which were sufficient to define the positionand slope of the water table within the village. I I He foundthat the water table was very near the surface at the eastern edge of town, and that it sloped westward at a rate ofabout 150 to 300 feet in a mile; the depth to water beneaththe land surface increased rapidly westward until in thenorthwestern part of town it was approximately 100 feet.
'0 Meinzer. O. E., Ground water in Juab. Millard. and Iron CountieB, Utah: U. S.Ceo!' Survey Water Supply Paper 277. pp, 89-90. 1911.
11 Ibid, Ill'. 91-92.
43

ARTESIAN WATER
The majority of wells in Pavant Valley, particularlyin the Flowell and Meadow ground-water districts, penetrate strata which yield water under sufficient pressure toflow at the surface. This artesian pressure is created bythe weight of water at higher levels in the areas farthereast, and is maintained by relatively impermeable confiningbeds over the aquifers, which prevent or impede upwardmovement of the water. The data concerning these artesianaquifers were obtained chiefly from the Flowell district,where flowing wells are most numerous.
The uppermost stratum which bears confined wateroccurs at elevations about 4600 feet above sea level, or 60to 120 feet below the land surface in the Flowell district.This aquifer was penetrated by most wells in the area, butnone is bottomed in the stratum. In the northwestern partof the Flowell district, it consists of porous, water-bearingvolcanic material, and farther east of "hardpan," sand, andgravel, which are separated from the overlying zone ofunconfined water by clay 15 to 75 feet thick. No flows havebeen obtained from the aquifer, but reported water levelsindicate that the water is under weak artesian pressure.
The highest artesian aquifer which produces a flowin the Flowell district is encountered at an elevation about4540 feet above sea level and at a depth of 140 to 200 feetbelow the land surface. The aquifer was not encounteredin some wells, particularly in the western part of the district, and in others the water was under insufficient pressureto cause it to flow at the surface. The materials of theaquifer vary from pea gravel in the eastern part of theFlowell district to medium sand in the western part of thearea; in the J. C. Christensen well (C-21-5)30caal volcanicrocks were encountered at this horizon.
Sand and gravel beds separated by clay produce flowsat various elevations below 4540 feet. In some wells asmany as seven such flows have been reported. In thedeepest well in the area a flow was encountered at a depthof 470 feet, at an elevation of 4200 feet above sea level.In general, water from the deeper aquifers is under higherpressure than that from shallow aquifers, but many ofthe wells have been perforated at several aquifers and theresulting flow from the high-pressure to low-pressureaquifers has greatly diminished the original difference inpressure head, especially in the area of greatest well density.
44

No wells have b€en drilled deep enough in the Flowellor Meadow districts to indicate the lower limit of theartesian reservoir. However, in the Pavant district, well(C-20-5)27bcbl was drilled to 601 feet, of which the lower75 feet is believed to be in the Sevier River formation.
Seasonal Fluctuations of Water Levels
In Pavant Valley the major seasonal fluctuations ofwater levels and artesian pressures in wells are caused byopening and closing of artesian wells and by additions ofwater to the ground-water reservoir. Small daily fluctuations result from changes in barometric pressure, earthtides, etc. These daily fluctuations b€ar no relationship tothe amount of storage in the aquifer and are not discussedin this report.
The greatest fluctuations of water level in artesianwells are caused by opening and closing of flowing wells.Prior to 1929 a Millard County ordinance required closingof flowing wells for six months of each year, and wells inthe Flowell district were closed regularly from October 1to April 1, while the Meadow district selected a seasonbeginning and ending a month later. However, as pressuresin the Flowell district declined in the early 1930's, some ofthe easternmost wells ceased to flow in the summer andpermission was granted to owners to open those wells fromMarch 1 to November 1. Beginning in 1938, State controland district agreements have resulted in some variationin date of well opening and closing, so that in 1938 and1939 the majority of wells were opened in mid-March, andsince 1940 most wells have been open from April 1 tomid-September. The effects of this regulation are clearlyshown in the hydrograph for the State of Utah wen(C-21-5)21abaI (figure 7), located near the eastern marginof the area of artesian flow. Each year the water levelhas declined 6 feet or more in April, due to opening of flowing wells. The decline becomes progressively more gradualuntil the lowest level for the year is reached, sometimesin Mayor June, sometimes as late as September. Thereafter, there is a gradual rise until late September, then asharp rise as the wells are closed, succeeded by a progressively more gradual rise until the end of February. Unlesssome edge wells are opened, this rise continues throughMarch, when the water level commonly reaches the highestlevel for the year. These fluctuations are characteristicof all wells that penetrate the artesian aquifers. In the
43

area of greatest well discharge, the range of fluctuation ofwater levels is considerably greater than in the State well,as shown in the hydrograph of the Huntsman well (C-21-5)19adal.
The hydrographs of several artesian wells in the eastern part of the Flowell district exhibit in varying degreesthe composite effects of well opening in the spring, rechargein the summer, and well closing in the fall. Thus in theHoyt well (C-22-5)2bcal the effect of recharge is appreciable, causing a rise of water levels in May and June of1943 and again in 1944, and slight rises in April and Juneof 1945, (the opening and closing of the artesian wellscauses pronounced declines in the spring and rises in thefall). The Ray well (C-21-5)35babl shows a fluctuation ofat least 7 feet resulting from the opening and closing ofwells but there is a lag of nearly a month before theseeffects reach this well. The comparatively large amountof recharge during the summer of 1944 and 1945 partlyoffset the normal decline resulting from discharging wells,and the lowest water level in 1945 was as high as thehighest water level in 1944 in that well.
In the Robinson well (C-21-5) 27aaal, the dominantfluctuations are those caused by opening and closing ofwells, but the effect of recharge is suggested by the gradualrise of water levels in the summer of 1944 from a: lowpoint in May. Finally, the Hansen well (C-21-5) 15dbblappears to be more influenced by recharge than by discharging wells, although it is closer than either the Hoyt,Ray, or Robinson wells to the area of greatest well discharge. Opening of wells causes a slight decline of waterlevel in the spring, and closing results in a more pronounced rise in the fall of most years, but this well is lessaffected by artesian withdrawals than other wells moredistant from the center of the district.
Long-t,erm Fluctuations
Records of the water-level fluctuations in the State ofUtah well (C-21-5)21abal have been obtained, with onlytwo extended interruptions, since May 1929, and a recording gage has provided a continuous record of these fluctuations since September 1935. Hydrographs for this welland four other wells are presented in figure 8.
The State well is just east of the area of artesian flowas of 1945, (plate 1) but is close enough that the effects
46

'" • • • • • • •
•
i r
It'
jHf'f:'IL..WiI. ,.•
if '
t.• •••
:Tfjt
[[ 'itl
•
.
.'
••
~ :::. IUIljF if
I" ill-Ii:;... i,'~ W':'~ :::
4'7

of opening or closing wells are clearly shown, whetherthe discharging well is withdrawing water chiefly from theaquifers tapped by the State well or from deeper aquifers(many of these deeper wells are perforated in the aquiferstapped by the State well). The State well is also closeenough to the recharge area that annual influx of wabr tothe basin can be identified, although this recharge effectis masked in large part by the greater fluctuations due towell discharge. Thus, in the summers of 1938, 1939, 1940,and 1943, following years of subnormal rainfall, the waterlevel continued to decline until late summer, but in 1941,1942, and 1945, following years of abundant rainfall, thewater level rose slightly throughout July and August, suggesting that the recharge was sufficient to offset the discharge from wells.
The highest annual water levels in the State well showa general correlation with rainfall at Fillmore, except thatthere may be a lag of as much as a year before the effectsof extraordinarily wet or dry years are apparent. It isto be noted that the effects of well discharge are so greatthat any appreciable increase in the number of wells leftopen during the winter will cause a corresponding declineof water levels in the State well, and conversely a decreaseof winter discharge will cause a rise of water level in theobservation well. The close correlation between water levelsand rainfall (the ultimate source of water in the artesianreservoir) indicates that conditions in the area have beenmore or less constant from year to year: certain wellshave been closed each year at approximately the sametime, and others have remained open or leaking about thesame amount year after year. The State well is thus considered to be an excellent well for indicating the relativeamount of storage in the artesian reservoir, at least so faras the Flowell district is concerned, provided all well ownerscooperate to minimize wastage during the non-irrigationseason. This well will also record the effects of well discharge in violation of district regulations.
The State well is reported to have ceased flowing in1927. In the spring of 1930 the high water level was 5feet below the flow line at the top of casing. Thereafterthe yearly high-water level declined until 1935 (followingthe severe drought of 1934) and in the spring of 1936was 16 feet below the top of the casing. The record since1936 shows a gradual rise, with setbacks in 1940 and1944 following periods of deficient rainfall, until by thespring of 1946 the high point exceeded that recorded in1930, the first year of record.
48

The Sweeting well (C-21-5)34bddl is located near thesoutheast margin of the FIoweli area. The fluctuations ofwater level are similar to those in the State well but themagnitude of the seasonal fluctuation, produced largely bythe discharge of the flowing wells, is somewhat less becausethe well is farther removed from the principal dischargearea.
The Blake well (C-22-5) 17accl is in the Meadow district.In minor details the graph for this well differs from thoseof the State and Sweeting wells. The water level is affectedby discharge of wells in the Meadow district, where wellsare used largely for stock watering, and the period of welldischarge is more irregular and generally later in the yearthan in Flowel!. There is a general correspondence betweenyears of high and low-water levels in the two districts asindicated by the graphs.
The Rowley well (C-20-5) 22bccl is located in the Pavantdistrict. In contrast to wells in the Flowell and Meadowdistricts the seasonal fluctuations in this well amount toonly a few tenths of a foot, and the highest levels ordinarilyoccur in mid-summer. There has been a general thoughslight rise in water level in this well from 1936 to 1945.
The Paxton well (C-22-5) 32dacl, like most other wellsin the Hatton district, appears to tap unconfined water.The water level in this well rises each spring or early summer, partly due to infiltration of irrigation water appliedin the Hatton district and especially in the vicinity of thewell, and no doubt also due to recharge of the alluvial fansfrom streams. The general rise of water level from 1938to 1943 parallels that shown in wells in other districts.
The present limit of the area of artesian flow is shownon plate 1 together with the reported limit of flow duringthe period when the first flowing wells were drilled. Theboundary of the area is shown to have shifted about onefourth mile down slope to the west-the change in waterlevel amounting to about 5 or 6 feet. The shift occurredchiefly during the period of well development, and practically no change has been noted in the position of the areaof artesian flow since about 1931 when the area reachedits present state of development.
Pie:lJOmetric Surfaces
The piezometric or pressure-indicating surface of anaquifer-the surface to which water in that aquifer will
49

rise under its full head-is defined by the static levels inthe wells which tap only that aquifer. The position andform of a piezometric surface will change from day to day,from season to season, and from year to year, and thosechanges are recognized by the fluctuations of water leve~
in the individual wells. Each aquifer has its own piezometricsurface, and in the intermontane valleys of Utah the deeperaquifers commonly have higher piezometric surfaces thanthe shallow aquifers above them.
In Pavant Valley, conditions did not permit delineation of separate piezometric surfaces for each of the aquifers encountered in wells. Individual aquifers cannot bemapped with any degree of certainty, partly because oftheir discontinuity and irregularity, but largely because ofthe inadequacy and probable inaccuracy of data obtainedduring the drilling of the wells. Furthermore, many wellstap several of the principal aquifers, so that pressures tendto become equalized by movement of water in the well, andthe measured shut-in pressure represents the compositeeffect of pressures in the aquifers.
Plate 1 shows isopiestic lines, or contours, on a composite piezometric surface for March 1941 when the waterlevel in most wells was at approximately its highest position for the year. These contours connect all points wherethe piezometric surface is the same elevation above sealevel. The direction of movement and of maximum hydraulicgradient is perpendicular to these contours. Outside theareas of artesian flow, there are insufficient wells to furnishthe information necessary for the determination of thepiezometric surface. Isopiestic lines are therefore drawnonly for the Flowell district and adjacent parts of theMeadow and Pavant districts where wells are fairly numerous.
In the Flowell district the piezometric surface in March1941 sloped westward with a hydraulic gradient rangingfrom 10 to 20 feet per mile in the central and western partof the district. Farther east the slope is more gradual,and in the eastern part of the district near the Provoshore line it is less than 3 feet per mile. Although nodata are available for the Fillmore district, it is postulatedthat the piezometric surface merges with a water table inthe upper portion of the Chalk Creek fan, where gravel andsand predominate and ground water is probably not confinedunder pressure. In materials so coarse, it may be assumedthat the water table has a slope similar to that of thepiezometric surface near the Provo shore line, and there-
50

fore that the water table is probably more than 400 feetbelow the land surface in Fillmore, and at an elevationless than 4800 feet above sea level.
In the Meadow district the piezometric surface slopesnorthward and northwestward with a gradient of about5 feet to the mile in the higher part of the area of artesianflow, increasing to 15 feet per mile in the lower northernpart of the district. Farther south, in the Hatton district,some wells appear to be deep enough to reach the artesianaquifers which yield water in the Meadow district. Fromthe sketchy information provided by these wells, it appearsthat the piezometric surface south of Meadow may havea decreasing gradient analogous to that east of the Flowelldistrict, and that it merges eastward and southward with awater table in the coarse sand and gravel of the upper partsof the alluvial fans of Sunset, Cottonwood, and Corn Creeks.
In the Pavant district-at least in the southern partwhere most of the wells are located-the piezometric surface has a westward slope comparable to that in the districtsfarther south. However, west of West Mountain in thearea adjacent to the Flowell district, the slope of thepiezometric surface is steeply northwestward. Tests described on page 60 indicate that the deep aquifers of thetwo areas are separated, possibly by a buried ridge of theSevier River forn1ation projecting westward from WestMountain.
MOVEMENT OF GROUND WATER
The movement of ground water in Pavant Valley follows more or less the drainage pattern shown by streamsand is generally from the mouths of the canyons thatdrain the Pavant Range westward and northwestwardtoward the lowest parts of the Valley, where a largeproportion is discharged by springs, evaporation, transpiration and wells, and the remainder continues westwardand northwestward through the more permeable strata ofthe valley and the bordering lava fields toward the SevierDesert. The ultimate source of practically all the groundwater is rainfall upon the drainage basin tributary toPavant Valley, but some of the highly mineralized waterwhich rises in springs west of Meadow and Hatton mayoriginate from magmatic sources.
In the following sections, the means by which water isadded to the ground-water reservoir are discussed, followed
51

by a detailed description of the movernent and dischargeof ground water in each district.
GROUND-WATER RECHARGE
Infiltration of water from streams constitutes a majorsource of ground water in Pavant Valley. On the upperparts of the alluvial fans, where the stream channels liein permeable gravel and sand, seepage losses are knownto be high and a large proportion of the flow disappearsunderground to enter the ground-water reservoir. In theseareas water levels in wells reach their highest stage inlate spring and. early summer, shortly after the period ofmaximum stream discharge. Although the larger streamsappear to be the major contributors, a considerable amountof ground water is probably derived also by seepage fromintermittent streams during the spring freshet, and byunderflow in the beds of small gulches and valleys whichare dry most of the year. Direct penetration into permeable ground of rainfall during major storms may also contribute to ground water in the valley,
Recharge to the artesian reservoir may occur in mostof the area above the Provo shore-line. Most of this waterdoubtless originates as drainage from the Pavant Range,both as flow in stream channels and underflow in the loosematerials in the bottoms of the canyons. Water divertedfrom these streams and used for irrigation on the upperparts of the alluvial fans may contribute substantially tothe artesian reservoir. Rainfall on these areas may alsofurnish some water to the artesian reservoir, especiallyduring major storms.
Water entering the ground below the Provo shore-line,whether from stream channels, irrigation ditches, irrigatedtracts, or rainfall, is not likely to enter the artesian reservoir because of the clay beds which occur above the artesianaquifers. The surface soils in this area are prevailinglyfine-grained and not highly absorbent; the smaIl quantitieswhich do get underground join the unconfined water instrata overlying the clay beds.
GROUND-WATER MOVEMENT AND DISCHARGE
The direction of movement of water in the artesianaquifers is derived from the slope of the piezometric surface as indicated on plate 1, movement being in the direc-
52

tion of maximum gradient and at right angles to theisopiestic lines. The direction of movement of the shallowwater above these aquifers must be inferred from thetopography and from water levels in about a dozen testholes drilled during the investigation.
Fillmore District
Movement of ground water in the Fillmore districtis chiefly downward through the coarse alluvial materialsto the zone of saturation and thence westerly to replenishthe artesian reservoir. Movement is slow through the finermaterials, and some water may not reach the artesianreservoir for many years after it enters the ground. Inthe western part of the district there is sufficient interbedded clay to create zones of perched water, but this waterprobably reaches the artesian reservoir eventually by slowdownward percolation. Similar conditions presumably prevail in the upper parts of the other alluvial fans in PavantValley.
Flowell District
Water in the artesian aquifers of the Flowell districtmoves westward in the eastern part of the district. Fartherwest, and especially in the northwest corner of the districtthe direction of movement is northwesterly. A large partof this water is discharged by flowing wells within thedistrict, but natural discharge still occurs through or overa restricted outlet into the Pavant district. Some natural
.discharge may also occur to the west through or beneaththe lava. A third method of natural discharge is throughthe clay confining beds to the shallow zone of unconfinedwater. Before the flowing wells were drilled, dischargethrough the natural outlets was greater than it is nowbecause of the high pressure built up in the artesian aquifers. Losses through natural discharge are greatest duringthe periods when artesian pressures are highest and leastwhen the wells are open and artesian pressures are lowest.
Like the artesian water the shallow water seems to bemoving westward and northwestward in the Flowell district.A considerable part is probably discharged by evaporationand transpiration in the lower western part of the area,but substantial quantities are also discharged westwardand northwestward through the lava flows. Flood watersfrom Chalk Creek which flow northwestward as far as sec-
53

tion 6, T. 21S., R. 5 W. (beyond the northwest corner ofthe Flowell district), disappear rapidly by seepage into ashallow depression known as "The Sink." The Sink is verynear the east margin of the basalt of the Ice Springs Cratersflow and it is likely that the water enters permeable volcanic materials in an area otherwise underlain by relativelyimpervious lake clays and marls. Much water has beenreported by drillers in the volcanic rock and associatedgravel encountered at depths of about 60 feet in the vicinityof the Sink. The water is under little if any artesianpressure, suggesting that although it is overlain by impermeable clays, it has a relatively open lateral outlet. Furthermore, the north end of the Flowell district, unlike theshallow-water area farther south, seems to have good subsurface drainage and the water table occurs at greaterdepths beneath the land surface. All of these facts indicatethat the shallow water, from the north end of the Flowelldistrict at least, finds its way westward and northwestwardthrough or between the lava flows.
Pavant District
Movement of water in the south end of the Pavantdistrict is northwesterly, but farther north it appears tobe westerly. A large part of the district probably receivesits water from the alluvial fans of Pioneer Creek, WildGoose Creek, and Maple Hollow, but some water enters thesouth end of the district from the Flowell district. Somewater is discharged from the artesian aquifers throughwells within the district, and the rest of the water moveswestward or nolthwestward toward the Sevier Desert. Thesmall yield of the wells, and the fact that most of theaquifers are reported to be fine sand. indicates that thetotal amount of ground water passing through the districtis not large.
Meadow District
The artesian water in the Meadow district moves generally northwestward but in the north part of the districtthe direction is northerly. Some artesian water doubtlessmoves from the Meadow district into the Flowell district,but the small yields of wells drilled in the inter-fan areabetween the two districts suggests that only small quantities of water are involved. Numerous springs rise westof the principal area of artesian flow, along the MeadowSlough in sections 8, 17 and 20, T. 22S., R. 5 W. Before the
54
flowing wells were drilled these springs are reported tohave been more numerous and to have discharged morewater. In 1945, with artesian pressures near their maximumduring the period of record, many of the old springs beganto flow again. This relationship of spring flow to artesianpressures in the wells suggests that the spring dischargeis either directly from the artesian aquifers by upwardmovement through the clay confining beds or from waterin the shallow water zone which was rejected as rechargeto the artesian aquifers because they were already filled.Water from these springs flows northward along theMeadow Slough, and is dissipated by evaporation and transpiration and possibly by seepage into the lavas near itsnorth end. The flow of the Meadow Slough at the junctionof the two main channels in section 1, T. 22 S., R. 6 W.,was 4.6 second-feet on June 20, 1944, and 5.1 second-feeton April 12, 1945. The flow in this slough is reported tobe greatest in early spring and least in midsummer.
Kanosh and Hatton Districts
The water in the developed portion of the Hattondistrict appears to be moving in a general northwesterlydirection. No data are available concerning water levelsor piezometric surfaces in the Kanosh district, on the upperpart of the Corn Creek alluvial fan, but it is assumedthat this district is analogous to the Fillmore district, andthat the ground water therefore moves down the fan withgentle gradient toward the Hatton district which comprisesthe lower part of the alluvial fan. The ground water inthe Hatton district is considered to be derived in part fromCorn Creek, and partly from the smaller Cottonwood andSunset Creeks. Some of this water may move beneathclay confining beds and enter the artesian aquifers of theMeadow district. The rest, remaining unconfined in shallowzones, may move northward toward the Meadow Sloughor westward toward the Warm Springs area.
The Warm Springs area west of Hatton is a majorarea of natural discharge of ground water. In addition tothe warm springs there are hundreds of cold water seepsand small springs in this area. A gypsum-floored playawest of the spring area and extending southwestward fromWhite Mountain receives some of the discharge from thesesprings. This playa is sometimes referred to locally as asink but whether the water sinks rapidly into the groundhere as it does north of Flowell was not determined. Prox-
55

imity to the volcanic ridge and the warm temperature ofat least one of the springs may signify some small contribution to the ground water from volcanic sources. Theancient craters of extinct springs in this area give evidenceof larger contributions from this source in the past. Thesprings and seeps are considered to be discharged chieflyfrom the shallow water body at the present time. Waterlevels in four auger holes show that the water table in thisarea has a gentle westward gradient.
Clear Lake About 10 miles northwest of Flowell, atthe west margin of the volcanic ridge, several large springsdischarge into a pond or lake area known as Clear Lake.On June 20, 1944, the discharge of these springs, measuredat the pond outlet, was about 18 second-feet. The flow isreported to be fairly constant throughout the year. Theelevation at Clear Lake as established by several measurements with an aneroid barometer is about 4600 feet. Theelevation of the land surface in the sink area north ofFlowell is about 4635 feet and the elevation of the piezometric surface near the northwest cornel' of the Flowelldistrict is about 4690 feet. Thus, there is sufficient gradientfor movement of both the shallow water and the artesianwater from the Flowell area to Clear Lake. Water levelsin wells at the Clear Lake railroad station and at otherpoint's in the desert west of the Clear Lake springs indicatethat the piezometric surface slopes westward from thelake, and therefore that Clear Lake cannot be fed byground water moving from the west. A part of the rainwhich falls upon the volcanic ridge may find its way tochannels which supply the Clear Lake springs. The waterin these springs is considered to flow chiefly from theartesian aquifers or shallow unconfined zones of the Pavantand/or Flowell districts.
CHEMICAL CONSTITUENTS OF THEGROUND WATER
Chemical analyses are presented in an accompanyingtable for the waters from 3 streams, 3 municipal supplies,89 wells, and 7 springs in the Pavant Valley drainage basin.The major chemical constituents of some of these watersare shown graphically in figure 9.
According to these analyses, the principal streamsentering Pavant Valley carry calcium and magnesium bicarbonate waters of low concentration, with 200 to 250
56
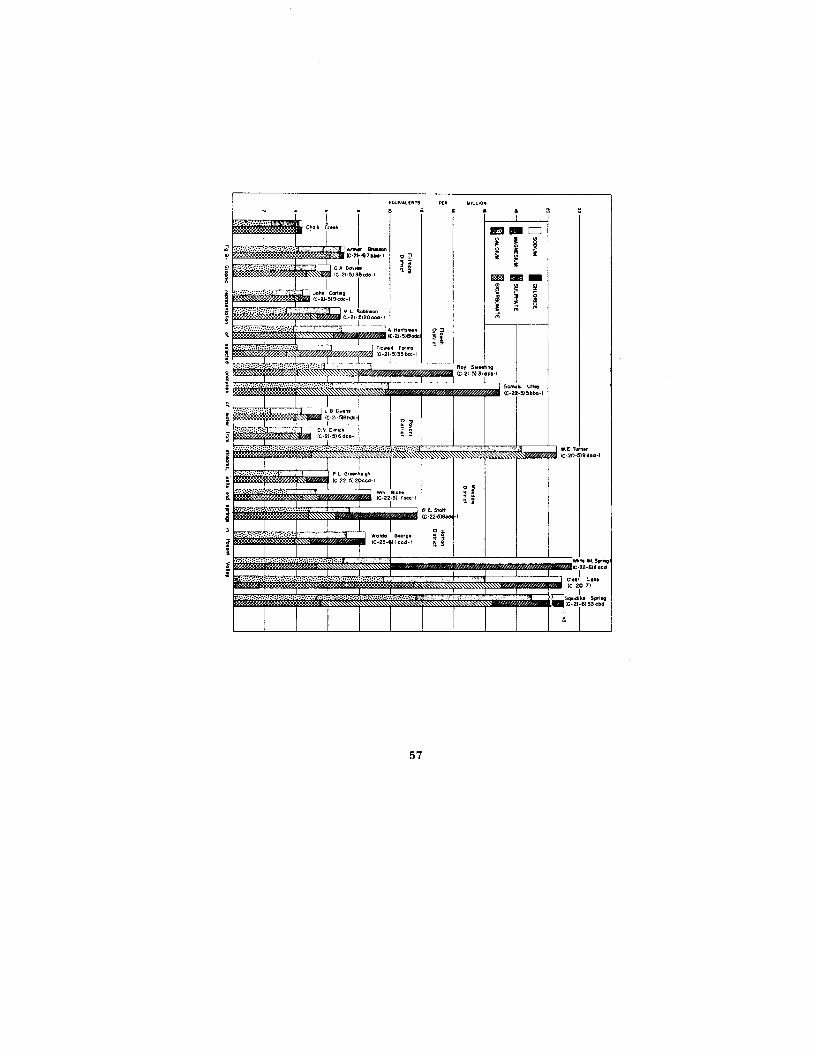
fOUIVA/.EfriTS
1i""'~""'$1.!,.•i c~'" 1'''' I~ t:·:::··:;:·:;:·:;:::;:::~:::·::·;:::~::·;:··:;::~,·;~~~~~~I~:~; c.~.·~r=V.bl i;~I~''i':~'':.:-, I! ~:::.:~:: ML'lottlnaon- {C-21-al20oeo-1
~ ::-... :::....::::... :....:..•.::..: 1.._ 'A Hl,lnll/lllOft
2. (C-21-51190d0
_L F"'~II F~m,(C-2Ii5133bcC-1
~i ,'.;.;......~~ .....::.::..:::...:.~:.::. ,:;::.".:.:..~.-
"lLUOIf.
Ro)' S....tma(C-21-5) 31 oeb-l
SQl'l\o,Il' Uti.,«;·22·5)!lbbo-1
57

Analyses of Water from Streams, Wells, and Springs in Pavant Valley[Parts per million. Well numbers correspond to numbers in table of records of wells]
Analyses by Geological Survey except as indicated
Well numberIT .1 . Ii I Sodium . Ii I" ". 'I I TotalDepth I' empel'j DIS- Cal- Mag- & potas- Blear-' Sul- ChlO-j Nt- Bo- Ihard-
(feet) a~Fe Date of collection solved cium nesium sium bonate! fate ride trate I. rate ness as_---'_ _ ( .j I i solids (Ca) (Mg) I(Na+K) (H_C_O_'l_(S_O_'_) (CI) (NO,) (_B_O_'_) _C-,,-~O,
Streams and municipal supplies
4.44321
2.87.19.0
198
21
4.29.7
25214719
213228308288224264
266256260
345280266
216192223211
80222
.1
o.1.1
.2
.2
.2
.5
.6
.2otr.o
2.03.22.0
1.01.7
122.02.5
3.52.52.0
383759
202741246941
101120
276276234
237242353336260280
243 9 9220 14 8235 21 20205 14 2382 9 12
220 10 28
397 13397 28285 46
tr.111314131544171737
Nov. 22, 1944 213 50 22Nov. 22, 1944 205 52 15Nov. 22, 1944 239 48 25Feb. 8, 1941t 251 53 19June 12, 1941t 125 27 6July 2, 1941t 276 59 18
Wells in Fillmore district
Nov.17,1944 \ 342 \ 84 I 33Nov. 17,1944 , 373 I 61 31Nov. 22, 1944 j 325 I 80 I 16 j
Wells in Flowell district
July 29,1943 276 47 24 IMay 31,1943 243 50 25 INov. 18, 1944 359 74 30Apr. 8, 1943 334 68 29May 31, 1943 330 42 29May 31,1943 301 56 30Nov. 20, 1944t ,May 31, 1943 298 59 29116May 31, 1943 296 55 29 19May 31, 1943 325 58 28 , 26
55
56565757585761
73120120
272300
400?'254236371347420315453
(C-21-5 )8cccL. 1
9cdcl. :15dbbl...············116bcc2 i
17adcl... !
17bdd2 ..17ccdl... 'I
17cdal... .17cddl... !
18adal... '
IChalk Creek. ]Meadow Creek. :Corn Creek ]Fillmore City I
Meadow Town .Kanosh Town 1
I(C-21-4) 7bbdL."""""" i(C-21-5) 12badl... 1
35cdal... '
<:J1co

Analyses of Water from Streams, Wells, and Springs in Pavant Valley-(Continued)[Parts per million. Well numbers correspond to numbers in table of records of wells]
Analyses by Geological Survey except as indicated
Well number ITemper,
Depth - ature(feet) (OF.) Date of collection
Dissolvedsolids
Calcium(Ca)
Mag- I~~~~I Bicar-I Slll-nesillm sium bonatE" fate(Mg) (Na+K rHCO,) (SO.)
Chloride(CI)
Nitrate(NO,)
TotalBr>- I hardrate neBS as
(BO,) CaCO,
Wells in Flowell district (Continued)
C1I<0
,I
(C-21-5)18addL········118dad2.········i18ddaL [18dddL. .19aadL. i19adaL.·······
1
1
19daaL. .19daa2 .19dcdL. j
20aaaL. j
20babL. i20badL. /20cbdL. .20ccaL .20ddaL. .20dda2 .21bbaL. .21cbaL. i
29aacL .29aadL. .29abaL. .29baaL. .29bddL. j
29cadL.·······i29cddL.·······i
508400448376455337403232330334445395355488323145281279315290330224207440368
626062616362636161556059606358~
575455 I'
61
6°~15961 I6263~162 I
Nov. 21, 1944Nov. 20, 1944tNov. 21, 1944tNov. 22, 1944Nov. 21, 1944Nov. 21, 1944May 31, 1943May 31,1943May 31, 1943May 31, 1943Nov. 21, 1944Nov. 20, 1944tNov. 20, 1944tMay 31, 1943May 31, 1943May 31, 1943May 31,1943May 31, 1943Nov. 20, 1944Nov. 20, 1944Nov. 20, 1944tNov. 20, 1944tNov. 18, 1944May 31, 1943May 31, 1943
362
530309534714680605343303
1,009261248287296297286
345805867
61 I
I7450768490767052
126515256625454
63109126
30 I 31
34 6924 3238 6446 10445 9040 8834 1522 32
55 15025 1624 1131 1127 1624 2420 27
23
1
3644 11542 124
2341
252236242212256286308262
234272260256
1'
298226253
265252 i
280 I
6061
147146
47120209182
1i~1354775
316131319 I11443161
12848
228 .235 I
60
8032
112164145110
5223
244181742303622
44182200
4.2
3.17.84.8 I·
2.51.51.51.09.6
2.53.73.12.03.23.96.9
.62.52.0
276
324224346
1.5 3981.0 4101.5 354
.3 314220
1.0 540.2 230.2 228.2 268.2 266
234217
252.8 453.8 487
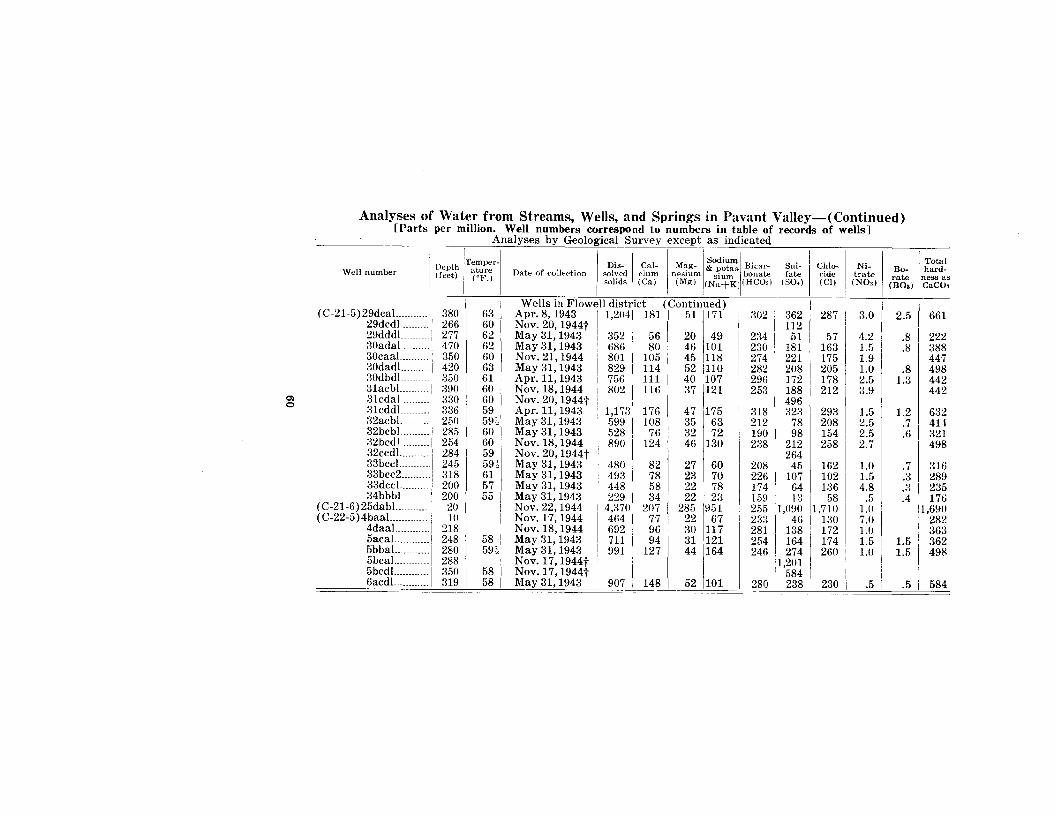
, I ,.. ,~ I cO<oTemper- Dis- Cal-
Sodium .Ni- Total
Well numberDepth ature Date of colleetion solved cium
M~g- & potas. BIC:U'-fate ride trate
Bo- hard-(feet) (OF.) neSlum sium bonate rate ness assolids (Ca) (Mg) (Na+KJj(HCO,) (SO.) (Cl) (NO,) (BOs) CaCO,
Analyses of Water from Streams, Wells, and Springs in Pavant Valley-(Continued)[Parts per million. Well numbers correspond to numbers in table of records of wells]
Analyses by Geological Survey except as indicated
52 1101
27 6023 7022 7822 2:~
285 ,95122 I 6730 117:31 112144 164
302
234230274282296253
318212190238
Clo
(C-21-5)29dcaL.. 38029dcdL 26629dddL....... 27730adal.... 47030caaL .. .. :~50
30dadL _ 42030dbdl... :350:31acbL....... 39031cdaL :33031cddL .. _.... 33632acbL ._ 25032bcbL 285:~2bcdL 25432ccdL..... _. 284:~3bccL....... 24533bcc2 _ :31833dccL.._... 20034bbbl.._ 200
(C-21-6)25dabl........ 20(C-22-5 )4baaL _... 10
4daaL.. _...... 2185acaL....._... 2485bbal.......... 2805bcaL......... 2885bcdL......... 3506acdL......... 319
63 'I
60 I62(;2 I60 I6361 I60
60 I~~,60 -I605959~
615755 I
!
I58 I59~i
58 I58 1
Wells in FlowelJ district (Continued)Apr.8,1943 1,2041 181 1 51 171Nov. 20, 1944t I IMay 31, 1943 352 i 56 20 49May 31, 1943 686 1 80 I 46 101Nov. 21, 1944 801 I 105 'I 45 118May 31, 1943 829 I 114 52 1110Apr. 11,1943 756 I 111 I 40 1107Nov. 18,1944 8021' 11(; I :W 1121Nov. 20, 1944tApr. 11, 1943 I 1,173, 176 47 175May 31, 1943 I 599 'I 108 I 35 1 63May 31, 1943 I 528. 76 32 72Nov. 18,1944 I 890 [' 124 I 46 130Nov. 20, 1944t IMay 31, 1943 480 i 82 IMay 31, 1943 493 1 78May 31, 1943 448 1 58 1May 31, 1943 229 1 34 INov. 22, 1944 4,3701 207 !Nov. 17,1944 4641771Nov. 18, 1944 692: 96May 31, 1943 711 I 94May 31, 1943 991! 127Nov. 17,1944t INov. 17,1944t IMay 31, 1943 907 148
362112
51181221208172188496:~2:~
7898
212264
208 I 45226 I 107174 I 64159, 13255_ 11'0902:3:~ 46281 138254 I 164246 274
1
1,201584
280 1 238
287
57163175205178212
293208154258
162
I
1021:36
. 5811,710I 130, 172
174260
230
3.0 2.5 661
4.2 .8 2221.5 .8 3881.9 4471.0 .8 4982.5 1.3 4423.9 442
1.5 1.2 6322.5 .7 4142.5 .6 I :3212.7 498
1.0 .7 3161.5 .3 2894.8 .3 235
.5 .4 1 1761.0 \1,6907.0 2821.0 3631.5 1.5 3621.0 1.5 498
.5 .5 I 584

Analyses of Water from Streams, Wells, and Springs in Pavant Valley-(Continued)[Parts per million. Well numbers correspond to numbers in table of records of wells]
Analyses by Geological Survey except as indicated
IDepthTemper- Dis- Cal· Mag- Sodium Bicar-I ~ul- Chin-I Ni· Total
Well number (feet)ature Date of collection solved cium nesium & J?0tas, bonate fate ride I trate
Eo- hard-COF.) solids (Ca) (Mg) (N~+~) (HCO,) I (SO,) (Cl) (NO,) rate ne88 as
I(BOal CaCO.
.8 2221.8 .2 2681.5 .3 4621.2 1.4 3711.0 .4 249
.5 3142.6 1.2 2666.8 .2 222
Cl).....
II
(C-20-5 )9daaL----------.122bccL _27bcbL i27cbbL 1
28cddL 1
28daaL ,I'28dddL __31dcdL-----
r32aaaL __33bbaL 1
33bdaL 1
(C-21-5)6dbaL 1
8babL 1
8bdcL !
(C-22-5 )4CCdL .
1
1
7bddL __7cadL _8aadL 18cdaL _8cddL __9dbcL _17accL __20ccdL_
330400601286354330309508490325360400455320
284390176325270460196375282
5865
6365626264656668616362
62
55605960
5856
Wells in Pavant district
Apr. 11, 1943 1,2381 236 78 5:{Nov. 17, 1944 960 115 84 85Apr. 11, 1943 1,361 178 130 79Nov. 16, 1944 343 45 42 22Nov. 16, 1944 396 52 46 26Nov. 16, 1944 355 54 44 14Nov. 16, 1944 352 49 38 28Nov. 16, 1944 660 92 57 60Apr. 8, 1943 443 34 34 85Nov. 16, 1944 400 I 32 29 I 78Nov. 16, 1944 553 I 55 48 77May 31,1943 254 i 45 26 16Nov. 22, 1944 384 I 61 28 43May 31,1943 288 48 25 28
Wells in Meadow districtNov. 17, 1944t
414 INov. 20, 1944 56 20 75Apr. 11, 1943 383 I 66 25 44May 31,1943 . 692 I 126 36 76Apr. 11, 1943 635 I 96 32 99May 31,1943 524 62 23 106Nov. 20, 1944 536 I 83 26 83Apr. 8, 1943 479 I 69 23 82Apr. 11, 1943 324 I 58 19 40
I300 I244248230247244247235138166228228260248
268236256304280262268252
656543687
70107
7072
1895255
139267432
6184941
11874636051 I28 I
I67 I
102162
50435243
145160123121
284932
8188
20818213115411848
.51.22.6
.4
.4
.4
.81.5
.21.01.01.0
.61.0
.4
.5
.3
o
.3
910632978285319316278464225199335220267223

Analyses of Water from Streams, Wells, and Springs in Pavant Valley-(Continued)[Parts per million. Well numbers oorrespond to numbers in table of records of wells]
Analyses by Geological Survey except as indicated
Mag- I Sodium
,
Depthfemper- Dis- Cal- Bical'- Sul- Chlo- Ni- Bo- Total
Well number (feet)ature Date of collection solved cium nesium ,& pota8· bonate fate ride trate rate hard-(OF.) Holid::; (Ca) (Mg) I sium (HCO,) (SO.) (Cl) (NO,) (BO,) ness as
(Na+KI CaCO,
Wells in Hatton district
(C-23-6) lcadL........... 1 14611 I I I1 Nov. 22, 1944 443 81 I 39 28 239 47 123 7.1 I 362
8bdbL.....1 100 I Nov. 22,1944 4,4301 354 I 287 1761 317 11,610 11,260 6 2,060
Ice Springs................. 1 I
58/
Springs 1 INov. 19, 1944 5,1901 274 1 181 11,380 234 I 914 12,320 4 1
1,430Squidike Springs........ 1
INov. 22, 1944 2,550 231 93 I 564 340 526 I 962 3 I 909
White Mt. Springs..... 1 55 I Apr. 8,1943 1,1981 145 46 1 227 308 1 255 I 370 I 2.6 1 3.0 I 5510) White Mt. Springs ..... ', I 55 Apr. 8,1943 1,233\ 129 44 I 263 318 1 237 I 400 2.6 3.0 503/;:l ,
4,810 464 95 11,152 392 11,045 11,830 IWarm Spring.............. 1 ! 95 1 Apr. 8, 1943 2.0 15 1,548Devil's Ridge Spring. 1 56 I Apr. 8, 1943 8,080\ 720 \ 169 '1,946 I 316 11,951 ,3,120 1 1.0 20 12,492Clear Lake Spring. i Apr. 11, 1943 I 1,189 98 78 I 221 214 I 267 I 400 I 7.5 .8 I 565-----_.,Analysis by M. E. Christiansen, Utah State Chemist.
parts per million of dissolved solids, probably derivedchiefly from the limestone and dolomite formations whichcomprise a considerable part of the Pavant Range. Wellson the upper parts of the alluvial fans yield water ofsimilar composition, but the dissolved mineral matter issomewhat greater. For instance, analyses of waters in theFillmore district show 325 to 375 parts per million ofsolids, chiefly calcium and magnesium bicarbonate. Watersobtained from wells lower on the fans generally carry moredissolved solids with increasing distance from the apex ofthe fan, indicating that additional mineral matter is dissolved as the waters pass through the materials of thevarious aquifers. The amount and character of the matterso dissolved varies considerably in different parts of thevalley, and even in different aquifers in the same area. Ingeneral, however, the waters having high mineral contentcontain much larger proportions of sodium, chloride andsulphate than do the streams and wells in the eastern partof the valley. Wells and springs near the western marginof the valley yield sodium chloride and sulphate waterswith dissolved solids ranging from 1000 to 8000 parts permillion.
In the artesian aquifers of the Flowell district, thepurest waters are obtained in the northern and easternparts of the district, where many wells such as the Carlingwell (C-21-5)9cdc1 yield water with less than 300 partsper million of dissolved solids. In the western part of thedistrict the dissolved mineral matter in wells is ordinarilygreater than 500 parts, as in the Huntsman well (C-21-5)5bbal. In the Pavant district just north of the Flowelldistrict, wells yield water of low mineral content, as in theDimick well (C-21-5)6dbdal, but farther north the watersare more mineralized, as typified by the Turner well(C-20-5) 9daal.
Wells in the Meadow district yield water similar incharacter to that in the Flowell district. The dissolvedmineral matter is less than in nearby wells in the southend of the Flowell district, but is similar to that of wellsfarther northeast. Here, as in the Flowell district, wellslower on the alluvial fan yield waters containing moremineral matter than those higher on the fan, as shown bycomparison of the graphic analyses for wells (C-22-5)20ccdland \C-22-5) 8adal. In the Hatton district some wells, suchas the George well (C-23-6)lcad1, yield waters of intermediate concentration similar to those in the Meadow district. Farther west, however, all wells and springs yieldhighly mineralized waters characterized by high content of
f3
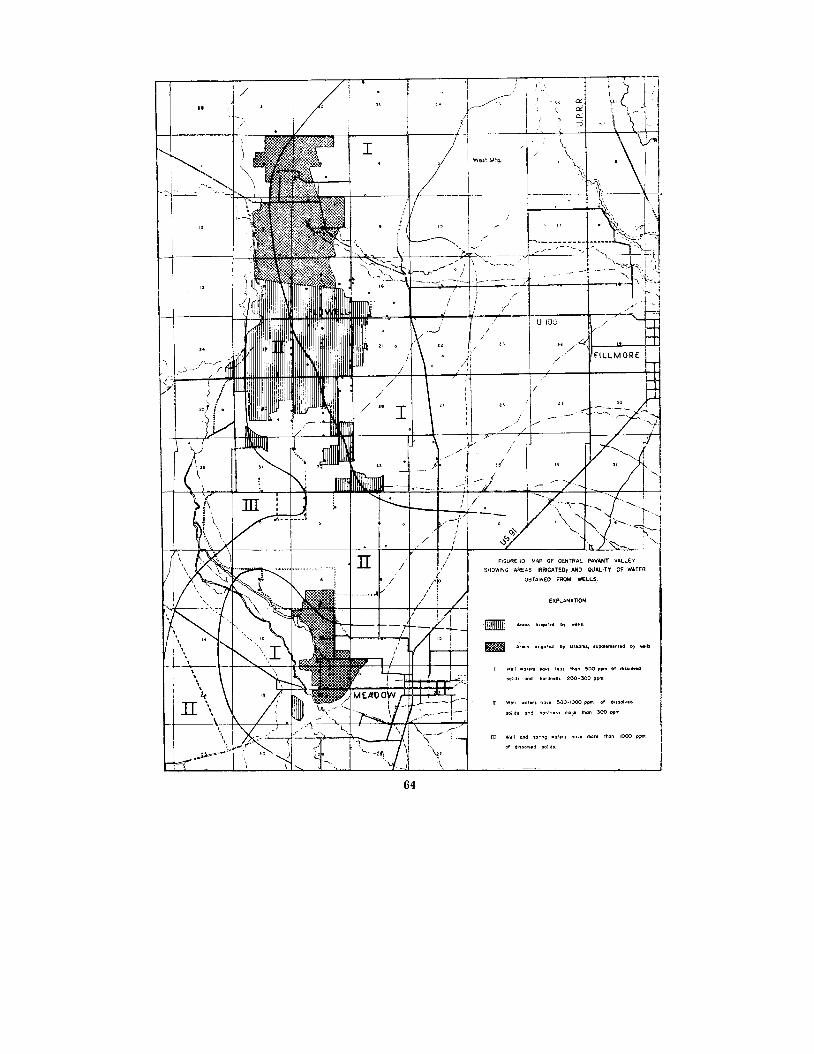
...... :1 _01". ha... liB lhon '00 ppm Of diuol".d
W'15 (1M ~ard..,nJ 200- 300 ppm.
EXPLANATION
WI!I _al,r, ho~. ~OO-IOOO ppm of
:JO,':I, o,.,,;j Mril~tn mo~.. thafl 300 ppm
_ 1'''9'''100:10,.. ..111,
_ "''';lIJ-.4 by.lr.om',luP9llmlnt.dOy ...I•
F'"3U~iE I() MAP OF CENTRAL PAVANT VALLEY
SHOWI~0 AREAS IRRIGATEDf AND QUALITY OF WATER
OBTAINED FROM WELLS.
,,,/
..
I
'1'1 J...~f 1
, -~---/ " '
+---Jo-A-/-'+----+-----+----''---~-_1c+_-+--I--_1~--:.L...-.l-----.IJl...L~::::,-i''-
64

sodium chloride and sulphate.
The accompanying map (figure 10) shows the areasin which, according to available analyses, waters of good,intermediate, and poor quality have been obtained fromwells. It is noteworthy that the areas of occurrence ofwaters of low to moderate mineral concentration extend farto the west on the alluvial fans of Chalk and Meadow Creeks,where coarse permeable materials permit greater movementof ground water than is possible in the intervening areas.
TESTS OF INTERFERENCE AND PERMEABILITYIN THE FLOWELL DISTRICT
In November of 1943 and 1944, after the flowing wellshad been closed, interference tests were made in variousparts of the Flowell and Meadow districts using 5 differentdischarging wells. The well selected for discharge and allwells within the suspected radius of influence were firstcapped securely, and after they had remained this way forabout 24 hours the pressure of each well was measured.The well selected for discharge was then opened for about24 hours, and its flow and the pressure in the surroundingwells were measured at frequent intervals. The measurements of pressure were continued for at least 24 hoursafter the well was closed. The locations of the wells andthe maximum interference caused in each by the discharging well are shown in figure 11.
In test No.1, the Oren Allen well (C-21-5)20ddal, 323feet deep, was opened at 1 :30 p.m. on November 12, 1943,and closed at 1 :20 p.m. on November 13. The averagedischarge during that period was about 540 gallons aminute and the drawdown of water level was 22.8 feet.The pressure in the nearest well (C-21-5)20dda2 was reduced 4.4 feet by the discharging well although it is only145 feet deep. Thus a connection is indicated betweenthe aquifers tapped by the two wells probably resultingfrom perforations or other leakage from the deeper wellat the shallower horizon. Why the effect on the SamuelUtley well (C-21-5) 29aaal, reported to be 269 feet deep,should have been greater than that upon the Millard CountySchool District weU (C-21-5)20dadl, reported to be 293feet deep, is not known, although the discharging wellmay be perforated at the one horizon and not at the other.Because of these differences in depths of the wells andhorizons at which they are perforated the magnitudes ofthe effects observed at the wells are not always proportional
65

..
~
oz
CD ~
!c
t
0000
,wy..::11
oz~
~
~
Figure ll-Ulcation of affected wells, and pl'es'sure reduction (in feet)during interference tests.
66

to their distances from the discharging well. The maximumdistance at which the effect of the discharging well couldbe detected was somewhat more than one mile, where pressures were reduced .2 to .5 foot. The pressure recoverydata obtained when the discharging well was closed wereused to calculate the permeability of the aquifer at thispoint by the Theis graphical method. Using 35 feet as thethickness of the aquifer, based on logs of adjacent wells,this coefficient is about 1,500 gallons per day per squarefoot.
In test No.2 the J. L. Robinson well (C-21-5)20aadlwas opened at 12 noon on November 14, 1943, and closedat 10 :20 a.m. on November 15. The average discharge ofthe well during this period was about 480 gallons a minuteand the drawdown 23.1 feet. The pressure reduction inadjacent wells ranged from 1.8 feet in a well less than aquarter of a mile away to about .2 foot in wells threequarters of a mile away;. The permeability calculated fromthe recovery data, using the logged thickness of 25 feetfor the aquifer, is about 1,600 gallons per day per squarefoot.
In test No.3 the J. C. Christensen well (C-21-5)30dbdlwas opened at 2 :30 p.m. on November 16, 1943, and closedat 10:45 a.m. on November 17. The flow during the periodwas about 440 gallons a minute with a drawdown of 41.7feet. There are only six wells close enough to show ameasurable effect from its opening and the water levelcould not be measured in one of these. The reduction inpressures in the five other wells ranged from 0 to 2.4 feetand the magnitudes of the effects were not directly proportional to the distances from the discharging well. Well(C-21-5)31acbl is presumably in an entirely different aquifernot connected with that penetrated by the discharging well,but well (C-21-5)32bcbl evidently draws from the sameaquifer as the discharging well. The three wells in section30 appear to be in aquifers only partially interconnectedwith that of the discharging well. The permeability determined from the recovery curve is about 900 gallons perday per square foot assuming the aquifer to be 25 feetthick.
In test No.4 the Stott well (C-22-5)8cddl was openedat 9:30 a.m. on November 17,1943, and closed on the sameday at 4 :50 p.m. The flow during the period was about120 gallons a minute. The discharging well is reported tobe 460 feet deep and its flow caused a decline of .2 footin the Blake well (C-22-5) 17accl, which is 375 feet deep
87
and located % mile to the south. Well (C-22-5)8cdal lessthan a quarter of a mile north, reported to be 270 feet deep,was unaffected.
In test No.5 the Brinkerhoff well (C-21-5) 17bdal wasopened at 12:10 p.m. on November 21, 1944, and closed at2:00 p.m. on November 22. The flow during the period wasabout 600 gallons a minute with a drawdown of 39.6 feet.Perhaps the most significant result of this test was theabsence of any measurable effect on any of the wells to thenorthwest although the four wells in that direction are nomore distant than wells which were affected in other directions. These results indicate that aquifers are not continuous between the Brinkerhoff well and the wells to thenorthwest, which are in the Pavant district. The permeability at the Brinkerhoff well as determined by the graphical method is about 1,500 gallons per day per square foot,assuming the aquifer to have a thickness of 43 feet, similarto that in well (C-21-5) 17bdd2.
Three of the wells used in determining permeabilityare located near the center of the Flowell district and inall three tests the permeability was about 1,500 gallonsper day per square foot. Here the Flowell district is about6 miles wide, the total thickness of the aquifers as determined by well logs is probably at least 100 feet and theaverage hydraulic gradient in the non-irrigation seasonis about 15 feet per mile. Using these approximate figures,the yearly inflow of artesian water to the Flowell districtis at least 15,000 acre-feet and may be somewhat greaterdue to steepening of the gradient in the irrigation season,when interference effects prevent accurate determinationof the piezometric surface.
GROUND-WATER INVENTORY
The means by which water is added to or dischargedfrom the Pavant Valley ground-water reservoir have beenoutlined in preceding pages: increments are received byseepage from streams, irrigation ditches, and irrigatedtracts, by underflow through permeable rock materials incanyons and gullies, and by direct penetration of rainfallupon permeable ground; and water leaves the reservoir bydischarge from wells and springs, transpiration and evaporation and by underground movement through permeablebeds that extend westward beyond the limits of the valley.If the total yearly inflow to the reservoir exceeds the totaloutflow, ground-water storage increases, and conversely, if
63

the annual inflow is less than the outflow, there is a decreasein storage, which is shown by a corresponding change ofwater levels in wells.
Quantitative estimates can be made with reasonableaccuracy of some of the factors involved in the groundwater equation, but other factors can be eestimated onlywithin rather wide limits because of the inadequacy ofavailable data. More information has been obtained concerning the ground water in the Chalk Creek alluvial fan,embracing the Fillmore and Flowell districts, than for therest of the valley; the inventory of ground water in thatfan is derived from these data, and rough estimates for theother districts are thereafter made on the basis of meagerdata, and analogy with the Fillmore and Flowell districts.
FILLMORE AND FLOWELL DISTRICTS
Estimat,e of inflow. The principal inflow to this areais provided by Chalk Creek, which discharged 32,900 acrefeet in 1944, with rainfall at Fillmore 1 inch above normal,and may be assumed to discharge about 32,000 acre-feetwhen rainfall is normal. Pine Creek, North Canyon, andother canyons not tributary to Chalk Creek have about 30%of the drainage area of Chalk Creek, most of which, however, is on the lower and intermediate portions of the PavantRange. Flow and underflow in these canyons, plus underflow in Chalk Creek, is estimated to be about 25 % of themeasured discharge of Chalk Creek, giving a total estimated drainage from the Pavant Range of about 40,000acre-feet in a normal year. Direct penetration of rainfallmay occur over most of the Fillmore district, where surfacematerials include a considerable proportion of permeablesaild and gravel. Farther west, in the Flowell district, verylittle if any rainfall is presumed to enter the ground-waterreservoir, because of the prevalent fine-textured materialsat the surface, and this water would in any case not reachthe artesian aquifers but would remain in the shallow zoneof unconfined water. Precipitation upon the Fillmore district would be about 35,000 acre-feet in a normal year. Thusthe total water falling on or flowing, into the area of recharge of the ground-water reservoir in the Fillmore andFlowell districts is of the order of magnitude of 75,000acre-feet per year when the rainfall is average.
Only a minor fraction of this water actually enters theground-water reservoir, because large quantities are transpired by plants and evaporated from soils. A rough estimate
69

can be made of the proportion which enters the groundwater reservoir by comparison with total outflow duringyears of normal precipitation. 1938 was a year in whichprecipitation at Fillmore was slightly below normal, and itfollowed a year when precipitation was approximately normal. In the absence of any stream-flow records, it isassumed that the total amount of water available to thearea was approximately as deduced above for a normalyear-40,000 acre-feet drainage from the Pavant Range,and 35,000 acre-feet precipitation upon the Fillmore district.The water level in the State well (C-21-5)21abal rose toapproximately the same maximum in the spring of 1939as in 1938, indicating that there was no significant changein storage in the artesian reservoir (a similar condition inthe overlying shallow-water reservoir is assumed on thebasis of reports that these shallow-water levels remainfairly constant or fluctuate through small ranges). Therefore the total inflow to the ground-water reservoir duringthe year must have been approximately equal to the totaldischarge from the reservoir. As detailed in followingparagraphs, the discharge from the ground-water reservoirin 1938 is estimated to have been 12,700 acre-feet fromflowing wells, 1,000 acre-feet by evapo-transpiration, andprobably about 12,000 acre-feet from Clear Lake Springs.Thus the total flow into the reservoir was about 26,000acre-feet, or about % of the total quantity of water flowinginto and falling on the recharge area.
Discharge from artesian wells. Between 1928 and 1943the discharge of the majority of wells in the Flowell districthas been measured a dozen times during irrigation seasons.These measurements appear in an accompanying table.Several wells were missed during each period of measurements, but their discharge in most cases can be estimatedwith fair reliability by comparison with records of adjacentwells, or with records of the particular well for otherperiods. These estimated flows are included in the estimatedtotal flow which appears at the bottom of the tabulation.The total estimated discharge based on these series ofmeasurements, has ranged from 16,000 gallons a minutein May 1929 to 10,500 gallons a minute in September 1939;in each irrigation sooson the discharge is greater in theearly months (April and May) and decreases to a minimumin July, August, or September.
Comparison of the total estimated discharge with thewater level in the State well (C-21-5)21abal at the time ofthe discharge measurements reveals a close relationship.Tf the total discharge is plotted graphically against the
70

Measured Discharge, in Gallons a Minute, of Artesian Wells in the Flowell DistrictMay July May June Sept. Sept. June June Aug. Sept. Apr. Sept.
Well No. 1928t 1928t 1929t 1930t 1930t 1931t 1938t 1939t 1939t 1939t 1941t 1943§
(C-21-5) 16adal............................ ._-- .. -.. - ---_.... _- .__ ....--. ._-~..._.- ......_--- .......__ . 10 0 0bcbL......................... .__......................_.... ------_._. _._--_.- ............ 75 60 35 35 260bcel............................ 15 .................................................. _..._--.-...._-----....._----- ....-.---- 70 125bcc2........................... --- ... ---- .. _- ............._-- ._--.... _- .. _-_....- ......-._. 70 75 45 55 330 100cabl........................... 25 0cdcL.......................... 175 75 50 10
17adcL........................ ----._---. _._- ..".-- ....... _-- ._-_......._._------ ..._------ .......... 125 120 120 145 135addl........................... ......._-- _..._-_ ... 490 .............................. 335 330 .............................. 255add2.......................... ........_- -_ .._..... --- ... --." .-_- .. ---- ..... -_... -----_ .... -.---.---- 105 .................... 135 65bdaL........................ _.-------- ......---. 380 370 .......... 320 275 265 270 .......... 340 320bdd!........................... 340 310 320 230 220 190 230 205 190 180 230 220bdd2.......................... 285 230 210 210 170 --.- ...... 80 90 85 100 120
..;r cabL......................... 380 285 270 250 230 230 215 210 175 170 205 185
.... cedi............................ 190 120 120 120 120 120 110 100 100 100 140 __ .......cdal............................ .... _.. __. --- ...._-- ._- .. -............_..................... 80 195 185 190 195 185cddl............................ 360 .......... 310 310 ""'''''' 200 205 180 190 190 205 195dad!. .......................... 280 190 200 200 140 200 170 155 165 165 .......... 190dbd!........................... 280 .................................................. 200 190 185 175 ..... __ ... 200dddl........................... 410 ....._.....__ ..................................... 200 170 150 160 ....................
18adal........................... ........_..................... 200 .................... 20 15 10 15 .......... 15addl........................... 115 120 70 70 70 70 45 45 30 25 .......... 25dad2.......................... 115 120 120 95 80 80 40 55 70 70 .......... 60ddal........................... 370 310 290 270 220 200 120 100 105 105 .......... 165ddd!........................... 30 .......... 50 0 0 0 100 55 55 51 45 10
19aadl........................... 170 140 140 140 140 130 135 110 105 100 .......... 110adal........................... 60 40 55 55 50 40 60 45 50 .......... 50daa!........................... 390 360 .................... 280 270 240 220 ........._ .......... 240 110daa2.................._....... .----_ .._- ._ .....__..---......._............................. 40 35 30 35 .......... 25dcdl.. ......................... 55 35 .......... 15 .......... 45 50 45 35 40 .......... 30dcd2.........................__ 35 .................... 15 .................... ........-. 70 75 75 85 70

Measured Discharge, in Gallons a Minute, of Artesian Wells in the Flowell District-(Continued)May July May June Sept. Sept. June June Aug. Sept. Apr. Sept.
WeJlNo. 1928t 1928t 1929t 1930t 1930t 1931t 1938t 1939t 1939t 1939t 1941+ 1943§
(C-21-5) 20aaaL........................ 290 240 440 380 420 330 ........ _- 220 180 180 290 280aadL........................ 460 385 320 320 280 270 300 310 260 245 345 285abal .......................... ----_.- ..- ---.- ..... 270 .............................. 230 230 210 210 .......... 210add!. ......................... 310 220 220 220 220 170 175 170 145 155 200 185babl.......................... 140 70 140 120 115 105 65 60 65 65 90 65bad1......................... 220 190 200 200 200 200 160 150 130 135 160bdal.......................... ---- .....- -....... _- ...... __ .. ---. __ .... -----_..-..._-...... 160 170 150 150 215 160bddl.......................... 190 170 170 170 140 140 150 135 135 135 155 145ebdl .......................... 140 120 140 115 110 140 110 110 105 105 .......... 120eeaL........................ 190 170 200 200 170 120 175 160 170 160 175 180dad1 ......................... 230 210 210 210 180 160 200 190 160 165 215 210ddal... ..................... 540 480 500 500 450 420 430 370 325 295 435 410
--ldda2......................... 95 50 60 60 50 30 15 20 25 20 30 40
":J 21bbal... ............ 210 150 115 115 145 .......... 80 .............................. 165 105ebaL ............. _...... 240 180 150 150 115 100 55 100 75 65 210 185eba2...... __ .... _..... 215 150 150 150 115 85 95 85 65 65 175 140
29aaaL. -_ ..... 190 140 70 120 140 120 110 115 105 105 140 100aabL_ 220 170 170 190 170 140 150 130 ........... ..... 125 115aacL... _. 230 210 210 210 170 160 140 155 135 140 175 165aadl. 330 300 260 260 230 210 225 240 215 210 255 185aad2 ...._ .... 280 250 270 270 230 230 175 175 155 155 230 240abal .... 250 160 210 210 210 180 180 165 140 145 200 160baaL 130 130 120 120 95 80 -. __ .. _--- 90 100 95 135 105bddL -----_ .... -. 180 150 145 145 150 140 120 120 130 120 140 110eaal 140 120 120 120 120 115 110 110 115 105 130 115cadI... ... _...... ___ ... 300 285 300 270 250 250 soo 230 215 200 245 200eddl ............... 380 285 340 380 340 290 ......._-- ........ _- ----._---- .- ...._--. 150 290deal ..._.............._....... 440 440 -------- -- ...._--- ---- .. ---. ----._ .... 270 255 200 210 290 ..........dedl... ....................... 330 330 375 ......._......._.............. 270 225 210 215 275 240dddl....... ........... 420 420 460 :n5 .... -"---"---- ....... _-- .. _-- .._-. _.... __ ._. -" ....... 250

Measured Discharge, in Gallons a Minute, of Airtesian Wells in the Flowell District-(Continued). --------
May July May June Sept. Sept. June June Aug. Sept. Apr. Sept.Well No. 1928t 1928t 1929t 1930t 1930t 1931 t 1938t 1939t 1939t 1939t 1941t 1943§
----- ---~---~--
(C-21-5)30adal... .. .__ .. . 125 125 120 120 120 120 65 75 80 80 100 85daa1.. .... . . .... .. __ .. __ . .._... . .. . ..._.. . ....... _.. 50 50 80 5lldadl ..._...... __ . 90 70 75 75 75 _ 55 55 55 55 70 60dbeL _ _ ._... .. __ . .. 120 120 110 60 60 55 65 125 70dbd! _ .. _... .. . ._.... ... __ . .__ 90 85 95 95 125 105
31aeb! ._........ 25 35 25 25.... 25edaL . __ .. __ .. .. ._.... 230 220 220 180 .. 160 165 __ .... 210' 195eddL _ 150 .. __ ___ . _ 280 160
32aadL .... .... _ .. _.._.... 280 355 350 .__ ... __ 135 130 105 110 155 125aebl __ . .. .. . _. . . 95 95 100 85bebL........................ 250 180 210 210 160 90 100 100 100 115 105bedL.. .. _.. 110 100 105 100 140 100eedL .._................ ._._...... 415 260 270 270 330 300
~ ddaL . _.. . .__ 130 _.. . 175 175~ 33bebL. .__.._._._..... ._._ 420 415 "'_" ' 215 170 125 135 220 240
beeL........................ .. __ .. __ . _ 10 10 5 5 10 5bee2 .__.. .. . 30 30 _.. ..__ 55 235 190 195 275 190edeL _................... ..._...... 310 240 .. __ ___ _ . .. _. __ ___ . 155deeL_.. . .._... .. __ .. ..__ . __ ._.. __ 490 490 490 _ __ . .. __
(C-22-5) 5aeaL_.. . _.. .._....... .. _.. .. _.. .. 20 20 40bbaL._.. .... .. .. .._ _ 400 380 370 320 325 305beaL. 270 _ 345 285 340 315
bedl. ._ .. .. . __ ..__ .. __.. . . .. .. .. ....__ 206aedL . _ .._....... . .. ..._.. 15 10
Estimated total discharge of all wells in Flowell distrieL _..__ .17,200 16,500 16,000 15,200 13,900 12,800 12,300 11,400 10,800 10,500 14,600 12,200
Water level in State well (C-21-5)21abal at time of measurements (feet below land surface datum)---- .. 16.2 17.7 19.5 19.9 19.5 20.9 21.4 16.5 18.7tMeasured by Utah Agricultural Expenment StatIOn.tMeasured by Utah State Engineer.§Measured by U. S. Geological Survey.
position of the water level in the well, the points fall approximately along a straight line, indicating a direct proportionbetween discharge and water level, so that for every footof decline or rise in water level in the State well there isa respective decrease or increase of about 850 gallons aminute in the total flow from wells. The proportionality ofthis total flow with respect to the hydrostatic head in theState well suggests that that well furnishes a good indexof changes in regional hydraulic gradient of the Flowelldistrict. Available information is insufficient to demonstratewhether this approximately direct relationship betweenpressure head and flow during irrigation seasons holdsthroughout the range of recorded water levels in the Statewell. If it does, the discharge from all wells at the timeof lowest recorded water level in that well-September 1935-would be about 8,000 gallons a minute; and in April1945, when the water level in the State well was 16 feethigher than in September 1935, the total discharge wouldapproach 21,000 gallons a minute, provided all wells in thedistrict were flowing free throughout the month. However,such proportionality applies only if all wells are flowingfreely and in any case cannot be assumed without furtherdata as to the effect of friction in the wells, and moreimportant, the effect of alternate methods of dischargefrom artesian aquifers as the pressure varies. Additionaland more complete measurements of flow at various positions of the water level in the State well and at varioustimes during irrigation seasons are needed to establishwith certainty the value of that well as an indicator ofartesian discharge from the district.
Since 1930 the water levels in the State well during theirrigation seasons have generally been within the range ofdepths (16.2 to 21.4 feet below land surface datum) thathave been correlated with discharge measurements. Thedischarge of the artesian wells during irrigation seasonssince that time, therefore, may be at least roughly esti-,mated on the basis of the indicated direct relationship tothese water levels, as given in the following table:
'/4

Estimated Discharge from Wells in Flowell District1930 to 1945
April to September October to March AnnualAverage discharge 6-month total 6-month total total
Year (gallons a minute) (acre-feet) (acre-feet) (acre.feet)
1930 15,000 12,100 3,500 15,6001931 13,300 10,800 3,200 14,0001933 9,900 8,000 2,300 10,3001934 10,500 8,500 2,500 11,0001936 10,100 8,200 2,400 10,6001937 11,900 9,600 2,800 12,4001938 12,100 9,800 2,900 12,7001939 11,900 9,600 2,800 12,4001940 11,300 9,100 2,700 11,8001941 12,500 10,100 3,000 13,1001942 14,600 11,800 3,500 15,3001943 14,300 11,600 3,400 15,0001944 14,000 11,300 3,300 14,6001945 17,700 14,300 4,200 18,500
The winter discharge is based on Livingston andMaxey's estimate12 that in the winter of 1943-44 the totalflow from wells in the district averaged 4,200 gallons aminute, which amounts to 3,400 acre-feet in the 6-monthperiod. It is assumed that the winter flow each year wouldbe proportional to the flow during the irrigation season,and would increase as artesian pressures increase, or decrease as they decline. The annual estimated dischargehas averaged about 13,400 acre-feet during the 14 yearscovered by these estimates, which is about 20% of thequantity estimated to be available for recharge in normalyears.
Subsurface discharge from artesian aquifers. Livingston and Maxey13 estimated that in April and May 1943,artesian wells in the Flowell district were dischargingabout 600 gallons of water a minute through perforationsor leaks into the shallow zone of unconfined water. Thisleakage doubtless increases during the non-irrigation seasonwhen most wells are capped and artesian pressures aregreater. Nevertheless, the total annual loss is small, andis estimated to be not more than 1,500 acre-feet per year.The loss can be eliminated by repair of the leaking wells.
Some water undoubtedly moves upward from theartesian aquifers through the overlying beds of clay, andeventually reaches the shallow zone of unconfined water,especially in the eastern part of the artesian reservoir
12 Livingston, Penn. and Maxey. G. B. Underground leakage from artesianweIJs in the FlowelJ area near FiHmore. Utah: Utah State Engineer TechnicalPublication No. I, p. 31. 1944.
1:1 Ibid. p. 31.
75

where sediments are prevailingly coarser because of thelesser distance to the mountain front. Although no experiments have been conducted in Pavant Valley, Israelsenand McLaughlin" have demonstrated that water movesupward from artesian aquifers under similar conditions inanother valley in Utah, and that the overlying compactclays are therefore not absolutely impermeable althoughthey are far less permeable than the gravel and sand ofthe artesian aquifers. The quantity so lost from theartesian reservoir is not known, but it is possible that asubstantial contribution is made to the shallow reservoir,greatest when artesian pressures are highest and decreasingas pressures decline. The loss is not preventable whileartesian pressures exist; the water may be partly recovered,however, by pumping from the shallow zone of unconfinedwater.
Some water may also leave the artesian reservoir bymovement westward through the aquifers and entry intothe Sevier Desert basin. The quantity involved is consideredto be small for several reasons. First, the aquifers areknown from well logs to be composed of progressively finermaterials from east to west across the Chalk Creek fan;textures may be presumed to become still finer fartherwest, until silt and clay-sized particles predominate. Second,the existence of high artesian pressures in the Flowelldistrict is indicative that there is no sizable outlet forthese aquifers to the west. Third, several wells have beendrilled in the Sevier Desert basin west of the Flowelldistrict near Clear Lake railroad station deep enough tointercept the equivalent of the Flowell artesian aquifers;these wells yield little water either by pumping or artesianflow, suggesting that very little water can move throughthe strata and that the artesian pressure is largely dissipated in the fine-grained materials.
There remains the possibility that the artesian aquifersmay furnish by westward movement under the lava flowssome of the water that is discharged at the Clear Lakesprings. The source of the water in these springs couldnot be determined from the data collected during thepresent investigation. A detailed study of the Clear Lakearea, to determine direction and rate of movement of waterand fluctuations in spring discharge, must be made beforeestimates can be made of the amounts of water derivedrespectively from shallow or artesian sources.
14 ISl'aelsen, O. W. and ~'!cLaughlin, \Y. \Y. Drainage of land overlying anCll'teRian ground-water reservoir. Utah Agricultural Experiment Station Bull. 25~,
31 PP., November, 193G.
76

The shallow ground-water reservoir. The shallow zoneof unconfined "vater in the Flowell district represents acollecting ground for water from various sources. Part ofthe water moves westward from the Fillmore district instream channels or irrigation ditches, or undergroundthrough permeable materials overlying the clay beds thatroof the artesian aquifers. Part moves upward from thedeeper artesian aquifers and through intervening bedsof fine-textured material, and some may also move downward from the land surface due to deep penetration ofrainfall or excessive irrigation. The quantities of inflowinvolved are not measurable except by exhaustive studyrequiring considerable time and equipment, which is notwarranted at present because no economic use is madeof this shallow water.
Throughout most of the Flowell district the shallowwater is too deep to discharge water by evaporation fromthe water table, but in the western part of the area somewater may be discharged by transpiration. White1
" estimated in the Escalante Valley, Utah, that annual transpiration losses amounted to about 2 acre-inches per acre inareas covered by greasewood, rabbit brush, and shadscalewhere the water table was more than 8 feet beneath theland surface. At this rate, the loss by transpiration in theFlowell district would be somewhat less than 1000 acre-feeta year.
The principal means of discharge of the shallow waterappears to be by westward movement into the volcanicmaterials bordering the valley. An adequate outlet isavailable, for large inflows such as the flood flow of ChalkCreek into the "Sink" are quickly drained away, and noartesian pressure is built up in the portions of the shallowzone that are overlain by impermeable clays. Because ofthe ease of westward discharge, it is postulated that theshallow water constitutes the principal source of ClearLake springs, which probably discharge about 10,000 to15,000 acre-feet a year.
MEADOW DISTRICT
The discharge of Meadow Creek averages about 20%of that of Chalk Creek and is estimated to average about7000 acre-feet yearly. Walker Creek and other canyonstributary to the Meadow district have about 50% of the
15 White, ,V. N. A mt"thod of estimating ground-water supplies based on discharge from plantE and {oy:"poration from soil; U. S. Geo!' Survey Water-SupplyPaper 6G9-A, II. k7, HI;12.
77

drainage area of Meadow Creek. It is estimated thereforethat the total inflow to the Meadow district frQm thePavant Range is about 25% of that which enters theFillmore district, or 10,000 acre-feet in a normal year.Precipitation on the upper part of the Meadow districtwould amount to about 7,000 acre-feet in a normal year,so that the total water flowing into or falling on therecharge area of the ground-water reservoir in the Meadowdistrict would average about 17,000 acre-feet a year.
According to measurements by the State Engineer,the rate of discharge of artesian wells in the Meadowdistrict was about 1,700 gallons a minute in August and1,600 gallons a minute in September, 1939. In September1943 the wells discharged at a rate of about 2200 gallons aminute. This is 15 to 18% of the rate of discharge fromwells in the Flowell district in the same periods. The totalflow during the 1939 irrigation season is estimated to havebeen about 1,500 acre-feet and the yearly total to have beensomething less than 2,000 acre-feet. Assuming that naturalconditions, well construction, and the practices of well owners in the Meadow and Flowell districts are roughly comparable, the annual discharge from wells in the Meadowdistrict may be estimated by analogy to have ranged from1500 to 3000 acre-feet in recent years. Water in artesianaquifers which is not discharged from wells in this districtmoves northward into the Flowell district.
Shallow water is discharged over a large area in thewestern part of the Meadow district, by springs and seeps,and by transpiration and evaporation. The flow from manyof the easternmost springs enters the Meadow Slough,which has a discharge of 4 to 5 second-feet where it leavesthe Meadow district, or an annual runoff of 3000 to 3500acre-feet. Numerous springs and seeps farther west discharge water over the surface of a broad meadowland andplaya area, where it disappears by evaporation and transpiration. No attempt was made to measure these springs,but it is estimated that evapo-transpiration losses in thewestern part of the Meadow district may total about 4,000acre-feet a year, based on White's conclusions that yearlyevapo-transpiration is about 5 acre-inches per acre for lowlands occupied chiefly by greasewood, rabbit brush andshadscale with water less than 8 feet below the surface,and 12 acre-inches per acre for meadowlands occupied bysalt grass and pickleweed with depth to water less than5 feet. 16
16 White, \V. N. oP. cit. pp. 86-S ....
78

KANOSH AND HATTON DISTRICTS
The discharge of Corn Creek is estimated to averageabout 60% of that of Chalk Creek, or about 18,000 acre-feetin a normal year. The flow of Sunset and CottonwoodCreeks, Dry Wash and smaller intermittent streams, plusunderflow in all canyons, is estimated to average an additional 7,000 acre-feet annually. Precipitation upon thehigher parts of the district, where coarse, permeable sediments predominate, may amount to about 12,000 acre-feet.Thus the total water available to the recharge area of theground-water reservoir is about 37,000 acre-feet in a normal year.
Four wells have been pumped for irrigation in theHatton district to supplement irrigation water from streamsand they are used chiefly in dry years. Annual dischargefrom these wells probably does not exceed 500 acre-feet,and in years of greater than normal rainfall and runoffpractically no water is pumped.
No attempt was made to measure the discharge of allthe numerous springs and seeps in the western part of theHatton district. Warm Spring has a fairly constant flowof about 35 gallons a minute, and Devils' Ridge Springvaries from a seep in early spring to 150 gallons a minutein midsummer. The flow of these and other springs isdissipated in an area of shallow ground water where discharge by evapo-transpiration is large. Based on White'sfigures the total loss from this area is considered to beabout 3,000 acre-feet a year.
PAVANT DISTRICT
No major stream enters this district but the portionof the Pavant Range tributary to it exceeds 50 squaremiles, chiefly at intermediate altitudes, although severalpeaks along the range crest exceed 9,000 feet altitude. Theannual inflow to the district from this range is estimated tobe 10,000 to 15,000 acre-feet. Precipitation upon the extensive bajada at the base of the range may total an equalamount in a normal year.
According to measurements by the State Engineerbetween November 1937 and May 1941, wells in the Pavantdistrict yield water at the rate of 900 to 1100 gallons aminute. Of the 67 flowing wells, one-the Turner well(C-20-5) 9daal-discharges 150 to 200 gallons a minute, andnine others each flow 20 to 100 gallons a minute. Theremaining 57 wells discharge a total of only 350 to 400
79

gallons a minute; most of these are allowed to flow throughout the year for stock-watering and waste. The total yieldof wells in the Pavant district is estimated to be about 1000acre-feet a year.
The rest of the water that enters the ground-waterreservoir in the Pavant district is presumably dischargedby evapo-transpiration in the western part of the district,or by westerly movement toward the Sevier Desert basin.No data are available upon which to base an estimate ofthe quantities of water so discharged.
SUMMARY
The outflow on the ground-water reservoir in PavantValley is summarized in the following table, based onestimates as developed in preceding paragraphs.
Estimated Average Annual Outflow of Pavant ValleyG,l'ound-water Reservoir
(Quantities in acre-feet)Fillmore
andFlowell MeadowDistricts District
Kanoshand
Hatton PavantDistricts District Total
Discharge from wells __ 13,400 2,200 500 1,000Discharge from
springs 3,300 t :j:Discharge by
evapo-transpiration___ 1,000 4,000 3,000 :j:Discharge underground ---------.~
to Sevier Desert________ 15,000Total dischargEl.:.:-_::.:.:-_-- _
tlncluded in total discharged by evapotranspiration.tNot estimated.
17,100
3,300+
8,000+
15,00043,400+
The total water flowing into and falling on the rechargeareas of the ground-water reservoir in the valley is estimated to be about 140,000 acre-feet per year. However,as previously pointed out and as indicated by the precedingtable, only about one-third of this water actually reachesthe reservoir. The remainder is evaporated from the soilzone and transpired by plants.
WELLS IN PAVANT VALLEYHISTORY OF DEVELOPMENT
The streams issuing from the canyons of the PavantRange have been of paramount importance in the development of Pavant Valley, for they have furnished water for
80
domestic use, stock-watering, and irrigation of crops. Beginning with the settlement of Fillmore in 1851, the principaltowns were located near the base of the mountain rangealong these streams, water was diverted for irrigation ofadjacent cultivated fields, and the remainder of the valleywas used principally for pasture. Water for domestic usewas obtained originally from streams, but subsequentlythe several towns have constructed pipelines to springslocated near the base of the range or in the canyons of theprincipal streams.
By 190817 there were approximately 50 wells in PavantValley, chiefly in the villages of Holden, Meadow, and Hatton. All of these were dug or drilled to the shallow zoneof unconfined water, and were used primarily for stockwatering or domestic purposes. Irrigation had been attempted from one of these wells, dug 40 feet deep in thePavant district about 4 miles west of Holden, but wasapparently unsuccessful. Between 1911 and 1914 sevenwells were drilled in the eastern part of the Flowell district,which yielded small quantities of water by artesian flow.
The first artesian well to yield water in sufficient quantities for irrigation was drilled in 1915 on the BrighamTompkinson ranch in the Flowell district. This well, No.(C-21-5) 21cbal, drilled 279 feet deep, is reported to havedischarged about 600 gallons a minute through its 71J2-inchcasing. Following this successful development, twelve additional wells were completed by the end of the year, and bythe end of 1922 there were 65 flowing irrigation wells inthe Flowell district, chiefly in the northern and easternparts. In succeeding years the development was extendedto the southwest, and by 1931 practically all the existingwells had been completed.
The artesian pressures and rates of flow declinedsharply as new wells were drilled, and by 1927 some ofthe wells along the eastern edge of the Flowell districtincluding the Bartholomew well (C-21-5)21abal-had ceasedto flow. The flow of the Tompkinson well (C-21-5) 21cbaldecreased from an initial 600 gallons a minute in 1915 to180 gallons in July 1928 and to 100 g'allons a minute inSeptember 1931. The decrease of artesian pressures isshown by the record of the State well (C-21-5)21abal from1929 to 1931 (fig. 8), when the yearly maximum waterlevels declined more than 8 feet, although precipitation inthe valley was only slightly below normal. In order toprevent further decline and ultimate loss of artesian flows,
"Meinzer, O. E .. op. cit. PP. 86-94.
81

the well owners of the district, organized in 1935 as theFlowell Water Users' Association, have worked first withcounty authorities and later with the State Engineer toprevent winter waste from existing wells and to protectexisting rights by restricting further development. As aresult, only 3 wells have been drilled in the Flowell districtin the last 10 years, and the water from those wells is usedonly for stock watering and domestic purposes. Throughagreement among the members of the Water Users' Association, wells in the Flowell district are not pumped, exceptthat well (C-21-5) 21bbal, one of the early wells locatedalong the edge of the area of artesian flow, is pumpedintermittently during the summer. All other irrigationwells flow by artesian pressure. Generally the water fromtwo or three wells is impounded in shallow earth-bankedreservoirs until the quantity is sufficient to provide an"irrigating stream." This water is then released to irrigateindividual fields. The soil in the southwestern part of thedistrict is too poor for most crops, and water from wells inthat area is transferred to fields several miles to the north.
Development in other parts of Pavant Valley has paralleled that of the Flowell district. In the Meadow districthalf a dozen irrigation wells were drilled during 1915, andby 1920 there were more than 20 flowing wells in that area.Flows from these wells were generally smaller than thoseobtained in the Flowell district, and most of the wells wereused chiefly for stock watering, the discharge of MeadowCreek being sufficient for irrigation in most years. In thePavant district also, several flowing wells were completedprior to 1920, although the majority were drilled in thefollowing decade. Only nine wells are located in the Fillmoredistrict; most of these were dug or drilled prior to 1928,and they are used only for domestic purposes or stockwatering. In the Hatton district, five wells have beendrilled for irrigation by pumping, the first being completedby the Drought Relief Administration in 1934. These havebeen used to advantage to supplement supplies fromstreams, but have remained idle much of the time duringyears of abundant rainfall.
STATUS OF DEVELOPMENT IN 1945
All known wells in Pavant Valley are listed in theaccompanying tabulation. Of the 297 listed, 113 are in theFlowell district, 109 in the Pavant district, 34 in theMeadow district, and 30 in the Hatton district. About 110are used primarily for irrigation, and all but 5 of those are
82

wells 6 to 8 inches in diameter which yield water by artesianflow. About 150 wells are used primarily for stock ordomestic purposes, of which about 50 are equipped withwindmills, or hand or electric pumps, and most of theremainder flow by artesian pressure. About 40 wells areunused or abandoned.
The methods of well construction in the Flowell districthave been described by Livingston and Maxey and detailsconcerning the source and underground leakage of waterfrom individual wells have been presented.1k
POSSIBILITIES OF FURTHER DEVELOPMENT
The estimates of the total ground-water discharge fromPavant Valley (pages 68-80) indicate that less than half isdischarged from wells, and only about one-third is put toeconomic use. The importance of utilizing more fully theunderground storage possibilities of the valley is accentuated by the fact that there are no favorable sites for surfacestorage of the flood waters of the streams. Fuller utilization of the ground-water resources of the valley may beachieved by (1) increasing the inflow to the ground-waterl'eservoir; (2) eliminating the waste of water from existingwells; and (3) reducing the amount of water which iscurrently discharged by springs, evapo-transpiration, andmovement out of the valley.
Inflow to the ground-water reservoir, and particularlythe artesian reservoir, may be increased by increasing theproportion of stream-flow spread over the higher slope's ofthe bajada along the eastern margin of the valley. Utilization of flood waters on these slopes to produce crops thatdo not require later irrigation will provide greater rechargeto the artesian reservoir, and thus permit a larger percentage of the lower areas to be irrigated from wells.
The elimination of waste from existing wells can beachieved at very little expense if all well owners will expendthe effort, and will result in a saving of about 3,500 acrefeet a year if existing wells are adequately controlled, andan additional saving of about 1,600 acre-feet a year ifleaking wells are repaired and controlled. This water couldthen be put to economic use. It is conceded that stopping ofthe winter flow from all wells will raise artesian pressuressomewhat and induce some increase in natural discharge,but a large proportion of the water saved will be returnedin higher rates of flow when the wells are opened in the
")8 0p . ('it.. pp. 6-31.
83

following spring and summer. The State Engineer hasoffered to provide equipment to assist well owners in plugging wells that leak badly around the casing and to permitconstruction of replacement wells. In this manner, severalwells of dubious value can be exchanged for productive wellswhich will permit full economic use to be made of their flow.
Natural loss of water from artesian aquifers by westward movement out of the valley or by upward movementthrough the confining clay beds can be reduced only byreducing artesian pressures. This can be accomplished byincreasing the number of wells or by pumping the existingartesian wells, which will eventually result in cessation ofdischarge by natural flow. The residents of the valley canthus obtain a greater yield of water from wells, but mustprobably bear the expense of pumping the bulk of it. Pumping from a small number of large irrigation wells near theflow line where the materials of the aquifer are most permeable, and use of existing flowing wells for domesticpurposes only, would make for more efficient use of thewater by eliminating the need for storage ponds wheretranspiration losses are high, and by providing water insufficient quantities for rapid irrigation methods.
It is believed to be possible to develop successful in'igabon wells by pumping from the shallow ,,yater zone. The permeable lava and associated gravel beds at a depth of about60 feet in the Flowell district offer sufficient promise to beworthy of a test. Pumping the shallow water in thatdistrict would salvage water which has been lost to theartesian reservoir by upward movement. Lowering thewater table would increase the flow upward from theartesian reservoir and thus decrease the artesian pressure,but this decrease would presumably be small and probablynot discernible.
In the Hatton district a part of the shallow watermay recharge the artesian aquifers of the Meadow district,but inasmuch as large quantities of the shallow water fromthe Hatton and Meadow districts move westward to bedischarged in the spring and seep area south of WhiteMountain, it appears that much greater utilization of thatwater for irrigation in the Hatton district is possible.
84

Wells in Pavant Valley
Well Number Owner or Name
Claim orApplication
Number
DateCompleted
Depth of IDiameterWell of Well
(feet) t (inches)
Altitudeof LandSurfaceDatum
--W~terL€v~C--
Above (+) Ibelo~r(_) Date of
Land Measur~&
Surface I mentDatum
Pavant District.__ 30
1923 1781930 200
1925 2501934 3151934 3711922 2171918 300
.------- _._---1922 230.--.--.- .- ....1929 1161929 1921916 2001925 1801927 1851920 2201935 ... __ .1928 2651930 1981918 294
3-23-403-23-40
11- 5-373-23-401-19-40
2-12-40
2-12-402-12-403- 2-43
11- 9-37
11- 9-378-11-382-12-40
- I=17.2 I-22.2-33.2+ 9.3++17.3++ 7.3+ 3.2-17.2++25.5 /11- 9-37+ 8.2 8-11-38
1+ JI + 7.2 I 8-11-38
t \+ :j:+ 6.4+12.4-13.3+ 2.5+ 4.8
4778
448866
26466226
108%846844888
10
187180
19211921
C-11963C-5686C-7686
g=I~g~~ I
C-19445C-4263C-8475C-16402C-16405C-12277C-12278C-12167C-12166
C-13814C-19967C-5687C-5685C-6584C-6580C-6585C-11962
Stephenson and HurstUnion Pacific R. R.Federal Land BankLawrence ClarkLawrence ClarkCleveland MitchellCleveland MitchellManhard and PaxtonFrank BadgerFrank BadgerFrank BadgerState of UtahState of UtahL. C. CallisterJ. A. StevensJ. A. StevensFrank PaxtonFrank PaxtonFrank PaxtonRichard NixonU. S. Grazing ServiceRichard NixonJ. A. StevensKenney Bros.Millard CountyKenney Bros.G. B. Kenney
(C-19-4) 31acdl31bccl31dbbl
(C-19-5) 4abal4ddal
20acal20cdal21bbal21cbbl21ddal21dddi22acbl22ccbl25addl26ccci27cdbl28aaai28aaa228aadl28bdal31cdbl33dcbl35cdal35daal36bbal36cbdl36ccd2
00<:n
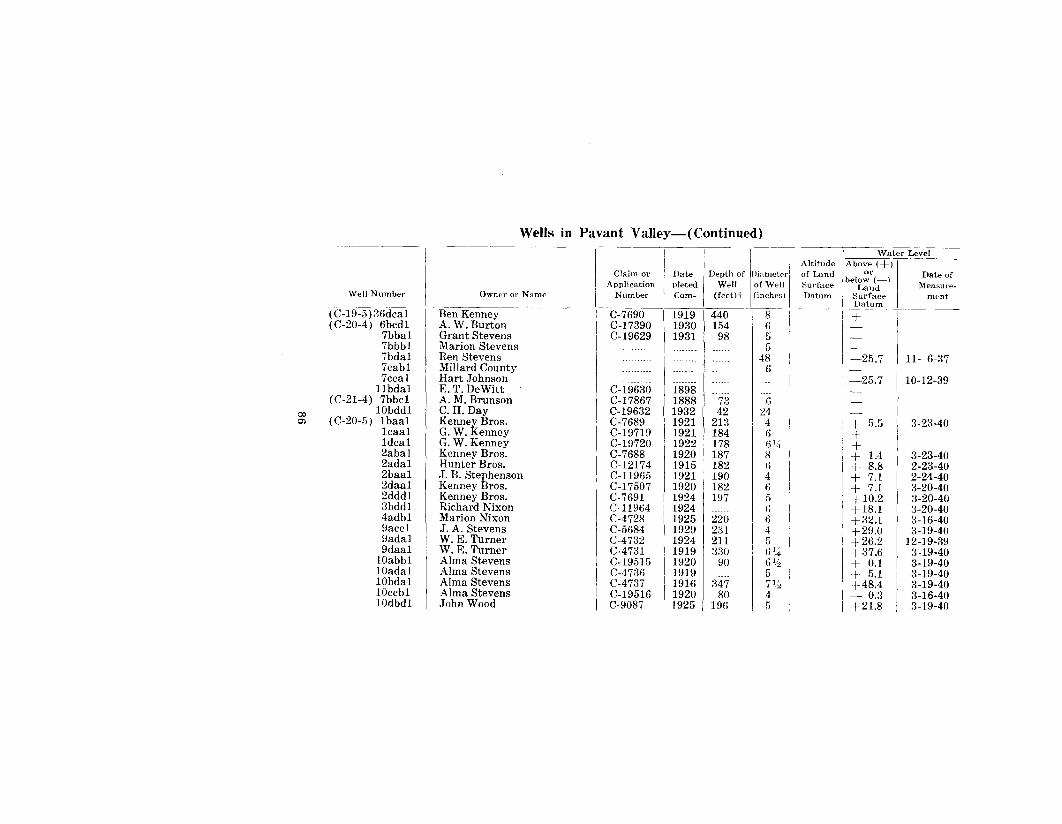
Wells in Pavant Valley-( Continued)
3-23-40
11- 6-37
10-12-39
3-23-402-23-402-24-403-20-403-20-403-20-403-16-403-19-40
12-19-393-19-403-19-403-19-403-19-403-16-403-19-40
+ 5.5+++ 1.4+- 8.8+ 7.1+ 7.1+10.2+18.1+32.1
, +-29.0I +26.2
+37.6+ 0.1+ 5.1
I' +48.~
- 0..3I +21.8
566456'l46'~57~,~
45
220231211330
90
:34780
196
II I I Water LevelI Altitude Above (+) I
Claim or ! Date Depth of Diameter of Land belo~r(_) Date of,Application pleted Well of Well Surface Land Measul"e-
Owner or Name I Number I Com- (feetH (inches) I Datum I Surface mf'ntDatum
Ben Kenney-- - ------,_. C-7690 I 1919 440 ···-8--T i +A. W. Burton I C-17390 I 1930 154 6, 1-~~~~~;t~~~~~s I C-~.~~~~ \ ~~~~ ..~~ ~ i I =Ren Stevens -- .. --'.. I --. 48 I I -25.7Millard County __ .__ . 6 I __
Hart John~on --...... ..--.... 1-25.7E. T. DeWItt C-19630 11898 .A. M. Brunson C-17867 1888 I 73 G I
C. H. Day C-19632 I 1932 I 42 24Kenney Bros. C-7689 ! 1921 213 4G. W. Kenney C-19719 I 1921 184 ()G. W. Kenney C-19720 I 1922 178 61~
Kenney Bros. C-7688 1920 187 8Hunter Bros. C-12174 1915 182 6J.. B. Stephenson C-11965 1921 I.190 4Kenney Bros. C-17507 1920 182 6Kenney Bros. C-7691 1924 197Richard Nixon C-11964 1924Marion Nixon C-4728 1925J. A. Stevens C-5684 1929W. E. Turner C-4732 1924W. E. Turner C-4731 1919Alma Stevens C-19515 1920Alma Stevens C-4736 1919Alma Stevens C-4737 1916Alma Stevens C-19516 1920 IJohn Wood C-9087 1925 I
Well Number
(C-19-5):36dca1(C-20-4) 6bcd1
7bba17bbbl7bda17cab17cca1
llbda1(C-21-4) 7bbc1
10bdd1(C-20-5) 1baa1
1caa1Ideal2aba12ada12baa12daa12dddl3bdd14adb19acc19ada19daa1
10abb110ada110bda110ccb110dbd1
00~

Wells in Pavant Valley-(Continued)
Well Number Owner or Name
Claim orAppliration
Numher
DateCompleted
Depth. of IDiamet.erWell of Well
(feetlt (incheR)
Altitudeof LandSurfaceDatum
IWater Level
Above (+l IheIO\~r() Date of
I Land Mf'3RtJl ('-
I.surface IDf'ntDatum
C-19633 1921C-19634 1930C-7676 1927C-7677 1922C-10618 1933
00-J
(C-20-5) llaaalllaadlllbadlllbad212bbal12ddal13dadl16dadl17baal21abcl21addl21dadl21dbcl21dbdl21dccl22bccl22cbbl22cbb222cbb324badl26bcdl26bdal26ccdl26cdcl27bcbl27cbbl27dbal28acb1
Elmer CummingsElmer CummingsEmily WadeEmily WadeState of Utah
C. H. DayByron StephensonGeorge RowleyL. B. SmithM. S. CummingsD. E. PetersonD. E. PetersonD. E. PetersonJane and Agnes WilsonMary RowleyC. H. EricksonC. H. EricksonC. H. Erickson
Gene AshbyJohn Starley, Jr.W. J. AndersonC. H. AndersonC. H. EricksonJohn RobertsWalter PaxtonV. E. Wilson
C-17694C-7670C-9064C-4720C-13534C-13532C-13533C-12172C-7671C-1407C-1408C-1409
.---C-17531C-4727C-9917C-15412C-8203
C-17436C-12169
198213334296245
17519201919 3501920 3251917 3251918 3391925 3251924 3301929 4201919 4001928 3521928 4511921 435
1917 2001923 621924 901920 801934 6011930 2861926 1901926 I 380
811116%114551161,i85%4665%644
66%28
12
I
· 4 4672.065%4
+11.5+15.6+ :'l.8+ 4.4+ 6.8-12.1-47.0+10.8+18.0+ 5.0+ 7.1+ 9.8+14.2+14.5+17.4+ 6.6+ 4.9- 8.3- 6.8
+ 7.8+ 2.5
+ 8.2
3-19-403-20-403-19-403-19-403-20-40
10-12-392- 3-403-18-402-20-403-18-403-16-403-16-404-14-414-14-412-19-402-12-403-16-40
10-30-373-16-40
3-18-403-16-40
3-18-40

Wells in Pavant Valley-(Continued)Water Level
Date ofMeasure
ment
3-16-433-16-433-16-437-11-45:l-16-459-21-44
1- 6-401- 6-40
3- 1-437-15-43:l- 1-43
4677.51 --21.74681.49 -24.14642.47 -t16.34652.06 ---18.34636.21 +- 18.34655.97 +- 9.84688.29 I 4652.85 \ +- 5.74661.41 + 5.8
- +4668.85 I - 5.64660.76 + 7.04679.61 I -14.0 I
64666883(j
~._._-
45532051:l318272
19
1924191719141911
1
1943
C-16511C-1374C-16623C-16622
Altitude Above (-+)
Claim or \ Date \ Depth of IDiameterl of Land belo.;;:r(_)Application Com- Wel1 of Wel1 Surface Land
Wel1 Number I Owner or Nnme I Number pleted (feetH (inches) Datum ~:t:~e;-i~-=---::-:::--
(C-20-5)28ada1 ! V. E. Wilson I C-12168 1937 350 5lh + 3.6 10-29-3728cdd1 C. W. Manhard C-12173 1931 354 4 4658.95 + 9.9 3-18-4028daa1 J. W. Payne C-7680 1923 330 4%, + 3.2 3-16-4028dddl Arthur Gull C-4011 1932 309 4 4665.6 + 2.0 3-16-403.1dcdl Dora Kiser I C-18736 1919 508 6 4633.93 +23.7 11-16-4432aaal Otis Welch C-6620 1926 490 6% 4640.1 +17.7 3-16-40~~3ada1 C. A. Brunson C-16682 1915 55 6 -33bba1 S. W. Smith C-13657 1930 325 6 4648.5 +11.8 3-18-4033bba2 S. W. Smith I' C-13658 1930 325 5 4647.96 +12.7 I 2-16-4033bda1 Robert Saguine 360 . G 4651.05 + 10.8 3-18-40~4aadl Charles. Lambert j C-1739~ 1898 115 6 - Iu4acb1 H. S. MItchell I C-1866a 6 --22.5 111- 1-3734bbbl C. H. Lambert C-17392 1925 :300 6 - .07 :3-16-4035bab1 Morris Lambert C-17549 1917 85 6 - I
(C-21-5) 1bdbl M. S. Cummings _ _ 83bbbl Dal Huntsman 54ccdl A. R. Beauregard C-16536 1927 350 85ebe1 Andrew and Emery Rogers C-7679 1915 412 75dbcl M. A. Tompkinson A-1613l I 1945 I 4006dbal D. V. Dimick C-11967 I 1928 I 4007ddc1 I Ansel RobinsOll A-15390 I 1944 I ~3248add1 Hazel Day8babl Stah~ of Utah8bdcl L. B. Owens8eaal J. A. Robinson8cabl Melvin Robinson8ccc1 Wells Johnson8dbhl Hazel Day
coco
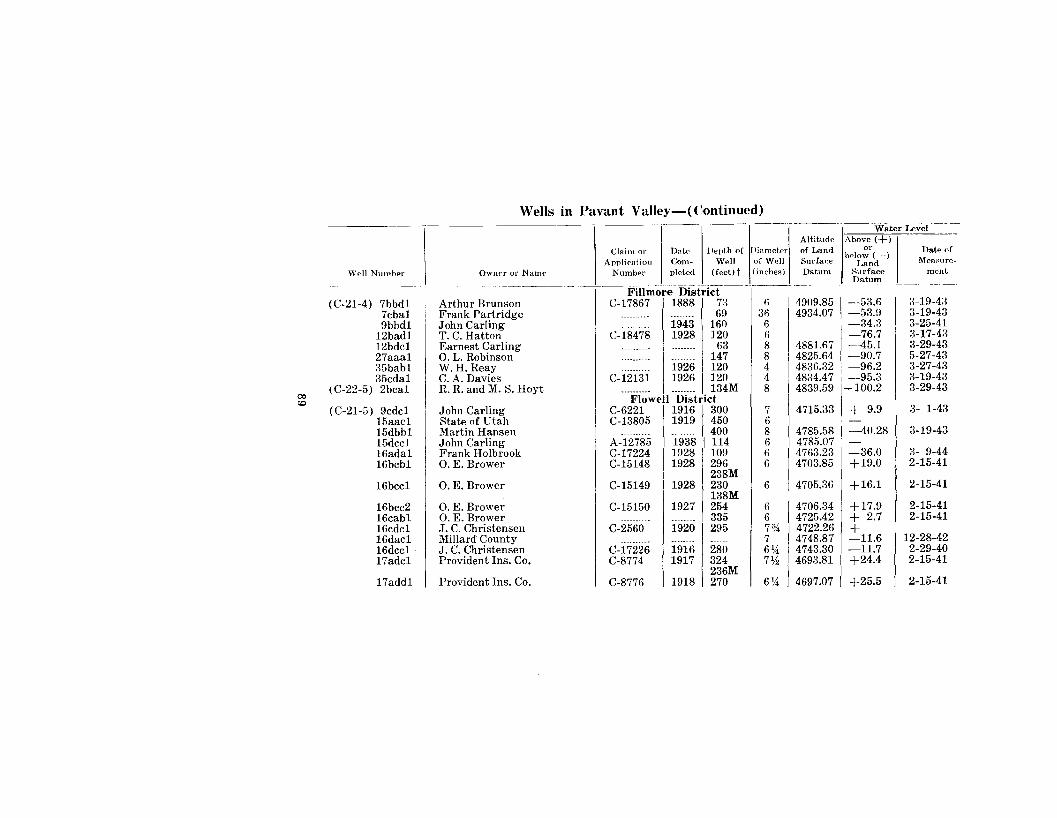
Wells in Pavant Valley-(Continued)
Oat<> ofMeaRure
ment
---.------.--~W;.t.,rLevei
Altitude Above <+)of I.and 1>,,10\';;\-,)Surface LandDatum Surface
Datum
Depth of II liam"te,-Well of Well
(feetit (inches)
nateC..JOmpleted
Claim orApplication
Numb"rOWfiPr or Namf?Well Numb"r
3-19-43
:~-19-4:1
3-19-433-25-413-17-43:l-29-435-27-433-27-433-19-4:13-29-43
3- 1-43
3- 9-442-15-41
2-15-41
2-15-412-15-41
12-28-422-29-402-15-41
2-15-41
1916 2801917 324
236M1918 270
Fillmore DlSirict-------- .--C-17867 I 1888 I 7:\ 6 I 4909.85 -5~.6.......... I ..... 69 3fi 4934.07 -53.9
. ... 1943 160 6 -34.3
C-~~~~~ I ~~~~ l~g ~ 4881.67 -1~:I.......... I........ 147 8 4825.64 -90.7........ 1926 120 4 4836.32 -96.2
C-12131 1926 120 4 4834.47 -95.3.......... I 134M 8 4839.59 100.2
Flowell DistrictC-6221 11916' 300 7 4715.33 + 9.9C-13805 1919 450 6 -
........ I ....... 400 8 4785.58 -40.28A-12785 I 1938 I 114 6 4785.07-C-17224 '1928 109 6 4763.23 -36.0C-15148 1928 296 6 4703.85 + 19.0
238M1928 230 6 4705.36 +16.1
138M1927 254 6 4706.34 +17.9........ 335 6 4725.42 + 2.71920 295 7=%, 4722.26 +
7 4748.87 -11.6674 4743.30 -11.77% 4693.81 I +24.4
6% 4697.07 +25.5
C-15149
C-2560
C-15150
C-17226C-8774
C-8776
Arthur BrunsonFrank PartridgeJohn CarlingT. C. HattonEarnest CarlingO. L. RobinsonW.H. ReayC. A. DaviesR. R. and M. S. Hoyt
John CarlingState of UtahMartin HansenJohn CarlingFrank HolbrookO. E. Brower
O. E. BrowerO. E. BrowerJ. C. ChristensenMillard CountyJ. C. ChristensenProvident Ins. Co.
Provident Ins. Co.
O. E. Brower
17add1
(C-21-4) 7bbd17cba19bbd1
12bad112bdc127aaa1~5bab1
35cda1(C-22-5) 2bca1
(C-21-5) 9cdc115aac115dbb115dcc116ada116bcb1
16bcc1
16bcc216cab116cdc116dac116dcc117adc1
coCO

Wells in Pavant Valley-(Continued)Water Level
Depth of \DiameterWell of Well
(feetH (inches)
<:0o
Well Numh",.
(C-21-fJ) 17add217bda117bdd117bdd217eab117eed117eda117eddl17dad117dbd117ddd118ada118add118dad218dda118ddd119aadl
19adal19daa1
19daa2
19ded1
19ded220aaal20aadl
Owner or Name
Noall Bros. FarmD. A. BrinkerhoffD. A. BrinkerhoffD. A. BrinkerhoffJ. C. ChristensenH. A. Johnson.J. C. ChristensenJ. C. ChristensenS. A. BrowerProvident Ins. Co..1. A. AllenOva PetersonOva PetersonBrinkerhoff EstateE. C. JacksonNolin JacksonAlonzo Huntsman
Alonzo HuntsmanAlonzo H untsrnan
Alonzo Hunb;man
T. C. Hatton
Samuel UtleyMary RobinsonMary Rohinson
Claim orApplication
Number
C-8775C-4718C-1l209C-1l208C-266~~
C-2664C-1375C-1:~76
C-3332C-8773C-4616C-2667C-2217C-76nC-4714C-4715C-13528
C-13525C-13521i
C-1::S527
C-2665
C-6228C-150C-149
DateCompleted
19181928191719281922191919311919191719281925193019191918192119181918
19181917
1915
1917
191819161918
268344393M371430347420:Jl5M30530628145:150842545637(;540455M350520403M520232M425330M334M340272
(P4G(;614Gfi 1,'4IiGI::!(; 1,'2(j
I;IiIi,. 11u /4-
6 1:!f,%"11{'.t
51 28
7~"2
71,~
71,,~
7~,'2
f,1/~
Altitudeof LandSurfaceDatum
4698.674679.444679.374677.974672.424672.124676.6G4G80.824701.604687.2:34701.784664.884663.104664.584668.524667.874668.25
4667.924668.87
4668.00
4664.48
4663.274701.804701.10
Above (+)or
below (-)Land
SurfaceDatum
+ :j:+39.6+40.9+40.0-\-35.8+31.0-t 41.5+31.5+22.2+34.5+23.4+26.6+20.4+14.1+24.11-25.3+35.1
+30.7t :j:
f- 27.8
+26.7
+27.6+27.4+27.;'
Date ofMeasul"t>
rne-nt
4-10-432- 4-43
11-20-432-17-411-23-412-17-412-17-412-15-412-15-413-11-413-11-41
11-20-433- 5-402-18-411-29-411-12-41
3-10-41
3-10-41
1-25-40
2- 1-402-28-412-24-41

Wells in Pavant Valley-(Continued)Water Level
(C-=21-5) 2()aba 1 --J:-A. AIlen------~-I-(~2219~-1 -1926 I20addl J. L. Robinson C-151 191720babl J. D. Bushnell C-6;{33 192520badl J. D. Bushnell C-6621 192120bdal J. D. Bushnell C-6623 191920bddl J. D. Bushnell C-6622 192120cbdl F. M. Christensen C-1378 1191920ccal F. M. Christensen C-1377 1925
Depth of IDiameterWell of Well
(feetH (incheo)
Dat"Completed
192619151915
2- 8-412-28-41;{-10-413-10-413-10-412-26-412-26-412-26-41
ment
Date ofMeaRuHo·
2-28-412-28-412-24·41
3- 1-412-28-412-28-412-28-41
12-29-423-19-43
3- 3-4;{3- 3-43
12-24-422-24-41
2-24-412-24-41
+30.8126.8+25.5+39.3+36.6+36.3+38.8+36.4
Above (+)or
below (-)Land
SurfaceDatum
Altitudeof LandSurfar.eDatum I
4690.55 4703.024671.994677.384681.184683.704675.504673.80
4702.081-29.04705.93 +27.54704.65 + 15.0
4742.90 - 9.34716.30 + 14.94715.55 + 15.44715.71 +16.2
+ 3.84765.98 -37.34774.51 4785.14 -45.04749.69 -11.44746.74 -10.04699.46 +28.74696.97 + :j:
4694.22 +35.14702.77 +26.9
67Y27
66\46%6 1476 ~~
5 Vi511,2
6 ~~
7%7%71;2866%6886%6
66%
1915191519221922
341296445395324343M
[355563488M295M335200145M
1917 2461918 2921915 2791915 2561915 1761926 65M1913 74
230200200269M336302M
1922 I 3361922 I 300
C-6992C-3808C-3809
Claim orApplication
Numher
-.----C-7683C-7684C-7685C-12960C-17508C-7682
C-13529C-13530
. C-6225C-6233
C-6231C-6223
Owner or Name
State of UtahW. D. TompkinsonEleanor TompkinsonEleanor TompkinsonA. E. TrimbleFrancis MelvilleEdward Davies, Jr.Edward Davies, Jr.Adelia RobinsonAdelia RobinsonSamuel UtleySamuel Utley
Samuel UtleySamuel Utley
Millard County SchoolOren AllenOren Allen
29aacl29aadl
20dad120ddal20dda2
21aba121bbal21cba121cba221dbal22bbb122cdb122dbcl27cccl28ddal29aaal29aabl
Well Number
<.0......

Wells in Pavant Valley-(Continued)I I I Water Level! Altitude Above (+)
\ Claim or Date Depth of Diameter of Land or Date ufApplication Com- Wen of Well Surface
below (-)Measur~..Land
ell Number Owner or N:1me I Number pleted (feetlt (inches) Datum Surface men'tDatum
1-5)29aad2 Samuel Utley C-6224 I 1922 I 334M 6 I 4702.90 +29.2 ! 2-24-4129abal Flowell Farms, Inc. C-14346 I 1922 I 330 6 I 4691.81 +34.5
I2-24-41
29baal Von Utley C-6222 1919 1224 6 4679.45 +33.9 2-26-4129bddl Ras and May Rasmussen C-2670 1916 320 7% I 4687.07 +32.5 2-28-41
-_ ...--- 207M6%, I 4686.8929caal Ras and May Rasmussen C-2669 1917 325 +40.6 2-28-41
29cadl Ras and May Rasmussen C-2668 1926 450 6%, I 4689.18 +37.9 2-24-4129cddl J. C. Christensen C-3334 1921 368 9% I 4690.24 + :t29dcal Flowell Farms, Inc. C-14347 19271380 6 I 4699.28 +33.2 I 2-28-4129dcdl Flowell Farms, Inc. C-14348 1927 266 6 I 4699.30 +30.4 I 2-28-4129dddl Flowell Farms, Inc. C-14350 1927 277 6 I 4710.70 +21.9 2-28-41:{Oadal Samuel Utley C-3299 1925 470 8 ! 4669.34 +53.5 3- 8-4130caal J. C. Christensen 1944 350 :{
[4670.85+30.9 11-15-44
:{Odaal L. R. Stephens C-3330 1930 437 6 +48.3 3- 8-41.--_ .... -. 322M
30dadl Zimmerman & Hunter C-3301 1928 I 434 6% (4673.26 +44.4 3- 8-4130dbc1 J. C. Christensen C-3335 1929 I 304M 6 4665.74 +48.3 3- 8-4130dbdl John Carling C-3333 1929 350 G 4(;(;7.15 +46.0 :l- 8-41
----- ... 313M I 4668.3731acbl Roy Sweeting C-7674 1931 390 (j +46.7 3- 8-41:ncdal Samuel Utley C-6235 1922 330M (, I 4674.4G +39.0 :l- 8-41:Hcddl Samuel Utley C-6236 1926 336 (j I 4676.85 + :t
.... ---- 252M32aadl Flowell Farms, Inc. C-14349 1927 296 G I 4711.31 +21.0 3- 7-41;{2acbl Flowell Farms, Inc. C-18884 1935 266 10 4694.42 +24.8 :l- 7-4132accl Flowell Farms, Inc. C-18885 1935 256 10 I 4694.77 + §32bcbl H. F. Robinson C-2666 1927 291 (j 4680.40 +41.3 3- 7-41
I 254M I
w,
(C-2
~~

Wells in Pavant Valley-(Continued)
Date ofMeaRure
mcnt
3-19-432-28-413- 1-413- 1-413- 1-413- 1-41
3- 8-40
3-18-413-17-439-24-43
3- 7-413- 7-413-26-41
3- 7-413- 7-413- 7-41
12- 5-39
3-26-413- 3-43
12-24-423-25-41
-18.3+20.0+34.7+33.5+29.7+31.6
+ 3.0
Wat€r LevelAltitude Above (+)'
Claim or j Date I Depth of jDiameterj of Land bel 01'(_>Application Com- Well of Well Surface I.:'nd
Wen Number I Owner or Name I Number pleted (feeOt (inches) Datum ~:t~~e
32bC~-FToweTI.Farms-,-inc. --C-3300-1--193T 310 8 14685.70 +35.4(C-21-5)32ccdl John Allen C-73 I 1927 284M 6 4691.50 +35.5
32dda1 E. L. Hart C-3297 11923 244 6% 4712.75 +19.433add1 Frank Sweeting C-13535 1915 200 7% I 4747.44 +33bcb1 Flowell Farms, Inc. C-14343 I 1927 264 6 4711.70 +20.13;~bcc1 Flowell Farms, Inc. C-14345 1927 245 6 4711.20 +19.633bcc2 Flowell Farms, Inc. C-14344 1927 318 6 4711.20 +22.033cdc1 John B. Tope C-6335 1926 228 6% 4720.89 + 8.433cdd1 Andrew Dahlquist C-11978 1916134 5 4728.70 +33dcc1 Andrew Dahlquist C-71 1915 200 8 4733.93 - 1.234baa1 Frank Sweeting C-17381 1913 190 8 4772.87 -34.134bbbi W. E. Black C-11977 1915 200 8 4748.80 -12.034bdd1 R. W. Sweeting C-4722 1916 190 8 4777.87 -41.3
__________ 126M;,4bdd2 Frank Sweeting C-17382 1913 190 8 4777.87:34ccc1 W. H. Reay C-4723 1915 250 8 4756.09 -20.7
(C-21-6)25dabl Ras Rasmussen 20M 36 4657.29 -13.736dddi U. S. Geol. Survey 1943 14M 2 - 8.7
(C-22-5) 4aba1 J. B. Tope C-6336 1918 190 9 4736.564baa1 J. B. Tope C-6334 1931 10 60 4756.584daa1 J. B. and LeRoy Davies C-12961 1919 218 8 4755.835acal J. B. Tope C-11975 1920 248M 6%, 4708.405bbal R. A. Utley C-6324 1928 280 6 4693.195bcal R. A. Utley C-6326 1928 288 6 4694.545bcdl R. A. Utley C-15852 11929 I 350 6 4695.206aedl Samuel Utley C-6232 1916 319 8 4688.67
Meadow District(C-22-5) 4eedl Dell Hasler C-2218 I 1926 I 284 6 4730.18
<0W

Wells in Pavant Valley-( Continued)
3- 5-413- 5-413- 4-413- 5-413- 5-41
:3- 4-41:{- 5-41;{- 5-413 5-41
3- 4-41:l- 4-41
2- 2-423- 6-433-26-411- 2-403-19-43
11-19-374-17-413- 4-41
88Ii88Ii7
I ~%I 2
7%686Ii
1158"11U ,4
10887%7%887%7L~
DateCompleted
. __ ...-.! ._-_.-C-11971 I 1915 390
1943 131915 1761924 325M1919 2701927 4601927 3801915 191;
_. __ .. I ...1916 I 4221926 3751918 2701919 3751916 2601919 3501921 3501926 2161918 2801921 2631920 2601917 2551919 2551918 2801915 260191713001915 2821925 282
C-11972C-11230C-10474C-1047aC-I0475C-2232
C-2220C-3296C-12112C-8202C-15317C-12170C-12171C-12959C-11970C-1211:1C-7104C-6626C-6627C-11974C-7681C-18531C-8642C-501l
Claim orApplication
NumberOwner 01' Name
Ed ElwinLeo StottU. S. Geol. SurveyLeo StottWilford WattsR. E. StottR. E. StottR. E. StottRoy SweetingElmer DuncanStott and FergusonWm. BlakeL. N. NickleWm. BlakeWasatch Loan & Livestock CoMcBride & WilsonMcBride & WilsonRaymond StottG. H. BeckstrandL. M. NickleState of UtahVelma StottVelma StottThelma FisherIsaac StewartCharles SwallowR. E. CarlsonP. L. Greenhalgh
Well Number
(C-22-5) 4dcc17bddl7caa17cadl8aad18cda18cdd18cdd29dbcl
10bbb117abd117acc117acd117bdd117cdd117dbd117dcd119dddl20aad120aba120abd120acc120acd120acd120baa120bdd120cccl20ccd1
~_. .~--- I I Water LevelAltitude Above (+Jj-
Depth of IDiameterl of Land belo~r(_) I Date ofWell of Well Surface Land Measure-
(feetH (inches) Datum I Surface mentDatum I
4743.0~-+-------1-- ..-----
4693.66 +47.0 3- 1-41- 7.9 I is-25-43
4698.18 + :j: I+ 7.:1 '
4721.63 + 1_ 3.U I4723.90 --33.04722.40 +27.84751.32 .- 3.84763.4U --28.94732.67 +23.74729.80 +29.84736.96 + :j:4726.90 +31.84737.30 +23.44740.09 +4740.44+·18.54753.00 +12.24759.29 -+- 3.:>4742.45 t- 18.64743.38 .j 14748.40 +4748.(; I4756.44 + 6.74738.80 +22.74745.46 + 16.64752.10 +12.94752.26 -to I 2.7
co>I'-

Wells in Pavant Valley-( Continued)Water Level
+12.1 I 3- 5-41+ 6.8 a- 5-41
§
Above H-)beJo~r(_.) Date of
Land Measure-Surface men tDatum
3- 6-43
3- 6-41
1-19-41
:1-21-434-19-413- 6-43
I
\ =18.0
-38.6-11.5- 9.7
0.924.29
4.69 I -62.5
7.495.26
I
+
8.31
2.475.961.00
6.60I1-
6.22 I -;K9
tudeLandfacetum
AI'Claim or Date Depth of Diarnet~r of
Application Com~ Well of Well SuWell Number Owner or Name Number pleted (feet) t (inches) D,
(C-22-5 )20dbbl P. L. Greenhalgh
IC-5012 119251280 8 47['
20dbcl W. H. Reay C-6aa2 1915 260 7\6 47121bcbl Clifford Stewart C-20156 1917 :l50 821crldl M. H. Beckstrand C-11969 11916 1165 :!%22adc1 Meadow Irrigation Co. 1934 155 8
Hatton District28bccl H. N. Bushnell C-7675 1924 70 8 I 47~28cdb1 Claude Huff C-6629 1921 60 6 ~:1 I28dbdl Charles Swallow C-16860 1928 112 8 48J29cda1 Beckstrand and Bennett C-11976 1926 85 8 47~
29cddl O. E. Beckstrand A-13159 1940 151 121!z 47129dddl E. J. Bushnell A-13270 1940 175 1232abcl Genevieve Paxton C-6586 1926 275 8 47132ada1 N. M. Stewart C-20155 1908 130 232dac1 Frank Paxton C-19631 1912 185 8 48(a2dad1 A. L. Kimball C-17880 1924 116 432dbdl Frank Paxton A-12492 1937 182 1233aba1 Claud Huff C-6628 1920 85 8 48J,{3abb1 Leffel Fisher C-11975 1927 100 5 48]33bcal N. M. Stewart C-20157 1918 80 (ia3cddl A. L. Kimball A-13367 1940 152 121!z 48,
(C-23-5) 4bcb1 C. E. Christensen C-16688 1927 68 65abb1 Orson Whitaker ... -.. - ... -- ...... •• 0 •• "
5bcbl -------- --"------ .. -._--------. ____ A_A_A. ----- 66caal J. C. Whitaker -------.-. 1928 70 R6cabl Harold Whitaker -------_ .. 192R 60 66cab2 Ennis Robinson 1854 .- .. Il
I6cba1 Hyrum Robinson Est. C-6351 1900 I 70 2
(0CJ1

Wells in Pavant Valley-(Continued)Water Level
Date ofMea8ure~
ment
2- 3-433- 6-432- 3-43
1
-50.2-18.2
[ -48.6
Altitudeof LandSurfaceDatum
Depth of IDiameterWell of Well
(feet) t (inches)
DateCompleted
Above~(+)or
below (-)Land
SurfaceI I I J I Datum I
C-16561 11928 \ 67 6 I ~~-.-1928 60 6
C-18918 1929 I 85 6
\
1928 \ 177 8 IC-1l966 1928 65 8C-17622 1927 60 1~
C-~~~~~~ I ~~~~ I 2~~ ~~ II 1941 I 146 6 I
Claim orApplication
Number
~ -,---A-12538
Owner 01' NamflWell Number
(C-23-6)
(C~2:{-f~) 6cba-2- Noah Stowe -----~~--
(jcba3 W. H. Robinson6daa2 Leslie Robinson6daa3 Ellen Bird6dabl F. M. BirdGdbal Earl Whitaker6ddal Hatton Well Co.1abd1 ~~~~~~~~~~~~~~~~~~~~~~~
___--=1c::.:cad1 Waldo George~~----co
0) tAs reported by owner unless followed hy M. indicating measured depth. Both reported. and measUI'ed depths are shown where they differ bythan 25 feet-
tWell leaks around casing,~Casing filled with debris.


It6.It , W P..W
o25
, ,
PLATE ,-
GEOLOGIC AND HYDROLOGICMAP OF PAVANT VALLEY, UTAH
• -EXPLANATION
GEOLOGY
Alluvium(~,rr~_b/~ 9,(IV~/, sand,
.n~ 11m
o
Dune sand(PW""obl, sand)
o 12
IZIIIUIIIIll:
Gypsite(Pw,,,,.ul, sP';/l9 d,,,.s;/Il
>crelZcrw....el:::>o ....
z....uolen
~
~lM.
Ice Springs Craters flow(P.''''#I1b,. In. fI_1
Calcarea us tufa;P"",.d/, S/l"'" drpDsilsl
Tabernacle flow(,..,.,,,bl, 1_ fI(Ms)
Lake Bonneville b.ICIs(/1fI/WtWtNIS clays, ,._bl.
diN' '"I,,,.s)
Alluvial fan deposits(".,__,. ••"d •• "tw.'.
i"","";IIII' clq 0"" .",1
'9
FILLMORE
Qb
15
_.. ---.,._...<~
Qb
2&
II
I.
33
•..
---•
-----
o
Qb
Kaibab lime stone(I"'P.,,,ifllls 1i_."",,1
Pcwant fiowlf".,m.abl. lora flowsJ
Shinarump conglomeratea",,.'IfI.abl. stltlh/OHI
Undif,ferentia ted sandstoneIStIr.,., ,.,-.",. b.".J
Tintic quartzite(1.,.rr'II/IS .-'1;,,1
Sevier River formation11.,.,,,,••/11II 'o/lfl'••".1
Moenkopi formationn,..",kIfIs s".". lim.sl_I
Rhyolite(I.,.,_.b" ".k,/lic fI""s)
Undiff,rentiated limestone(""••'fIIIS ".,_.,. clt.IIMI.
."" 1.11II.1
Wasatch formation(CIlIt,III",.'.'" • ."".,,,,,• • /ld
1/1"• .,_ ..iff!l _
,.,,,,.11I. ztHIul
(.)
oN Zo ~w CD~ ael c~ u
--IoIT-~pJz ;~I
~'_·m>""icr w- ~el g~ :±:tftti.... ~cr
~~ .o101
---."
C~
~
(,,) ~oNorJ')
w~
--.....8........ 80nn...i II. ,Ilor. lin.
-p--- Pro.o .Ilor. lin.
Ji\: ), :
•
o
t4YOROLOGY
Cloooint wei'
·'--·f . \:rTdN
)'/,,,,J
\.
•
o
_ 4125::":"--St,.orn
ISOp.eslic lilies .s d Morell 1141...III ..
Upper lilllit of oreo of ert••I.nIlow in Morell 1941
_ 3
'0
o
Ob
., ........
.... ... 1\'- ..\
\
\
•.,,",
..............
-::".., ...
~_.-.-
Uppe, lilllil of llI.iIlMIIII .re. of0'''_ flow
BoutIclor, of ",ound-..,er di,trict
10-=1-11IoIO:::- .•_-
ZI
13 II".
\.... Qb
\••It.
H
1% z. ,
SCALE
o.s
oI
OfXJOI so
It,. 1t4raW