State of road safety june 2015 (2)
29
ROAD SAFETY STATISTICS – 01 JANUARY TO 06 JUNE 2015
-
Upload
toasauti2015 -
Category
Government & Nonprofit
-
view
182 -
download
3
Transcript of State of road safety june 2015 (2)

ROAD SAFETY STATISTICS – 01 JANUARY TO 06 JUNE 2015
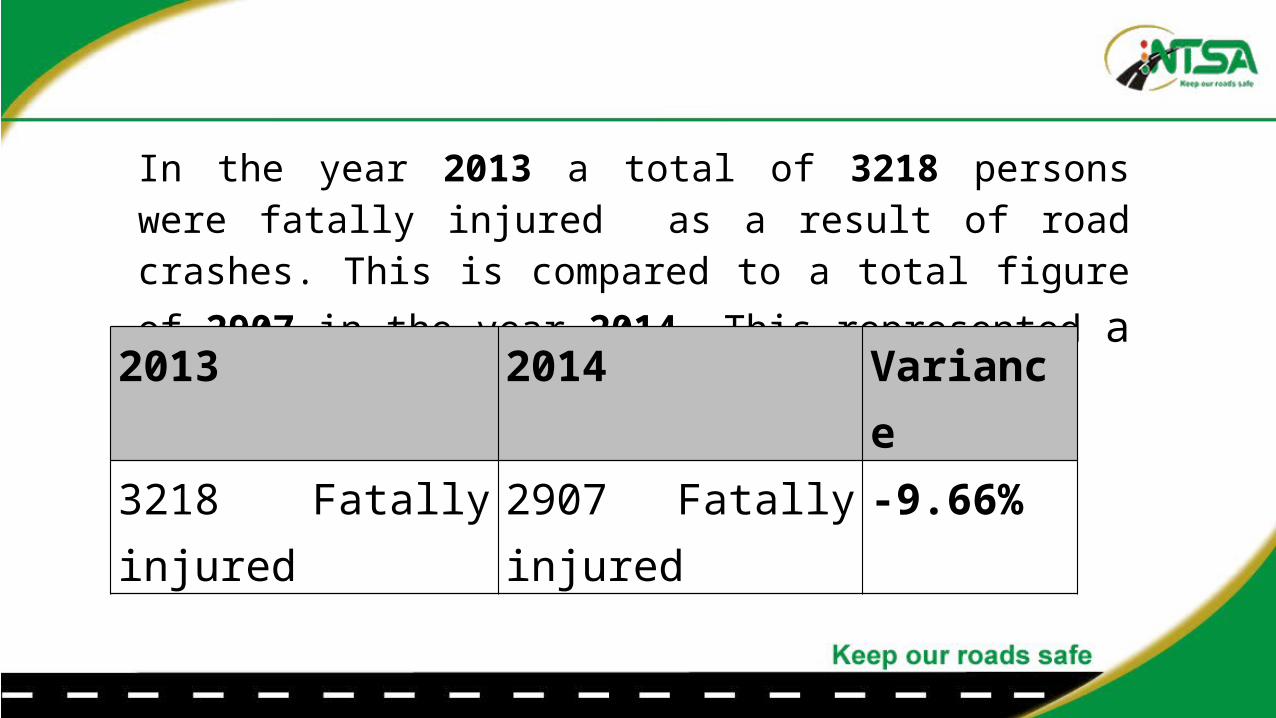
In the year 2013 a total of 3218 persons were fatally injured as a result of road crashes. This is compared to a total figure of 2907
in the year 2014. This represented a total decline of 9.66%.
2013 2014 Variance
3218 Fatally injured 2907 Fatally injured -9.66%

THE NUMBER OF ROAD FATALITIES SINCE 2005( Source- Kenya Police)
2005 2006 2007 2008 2009 2010 2011 2012 2013 2014
PEDESTRIANS 1242 1253 1370 1630 1755 1434 1545 1549 1482 1340
DRIVERS 251 291 273 326 435 307 289 290 284 268
PASSENGERS 590 715 840 592 1036 738 824 745 810 642
P/PASSENGERS 96 112 127 138 221 126 156 124 157 162
P/CYCLIST 310 310 276 352 322 240 173 127 134 104
M/CYCLIST 44 34 35 111 263 200 315 306 324 391
TOTAL 2533 2715 2921 3149 4032 3045 3302 3141 3218 2907

COMPARISON OF FATALITIES (UPTO 08 APRIL 2014/2015) 2015 2014 %VARPEDESTRIANS 44 335 2.69
DRIVERS 85 66 28.8
PASSENGERS 182 172 5.81
PILLION PASSENGERS 60 38 57.9
PEDAL CYCLISTS 19 22 -13.6
MOTORCYCLISTS 114 101 12.9
TOTAL 804 734 9.5

Comparative Bar Chart showing the Fatalities of 2014/2015 upto 08 APRIL
PEDESTRIANS DRIVERS PASSENGERS PILLION PASSENGERS PEDAL CYCLISTS MOTORCYCLISTS
2015 344 85 182 60 19 114
2014 335 66 172 38 22 101
344
85
182
60
19
114
335
66
172
3822
101
8-Apr2015 2014
CLASSSES OF VICTIMS
FATA
LITI
ES
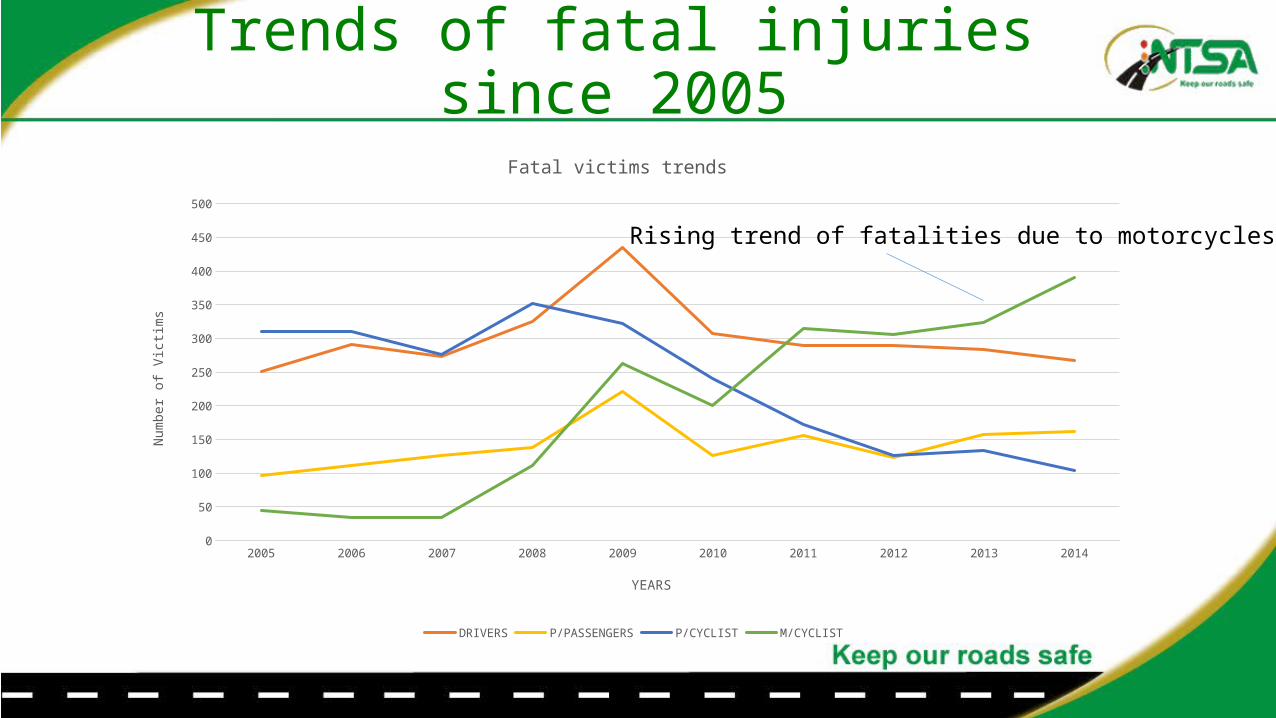
Trends of fatal injuries since 2005
2005 2006 2007 2008 2009 2010 2011 2012 2013 20140
50
100
150
200
250
300
350
400
450
500
Fatal victims trends
DRIVERS P/PASSENGERS P/CYCLIST M/CYCLIST
YEARS
Num
ber o
f Victi
ms
Rising trend of fatalities due to motorcycles.
JAN to 06 JUNE 2015/2014

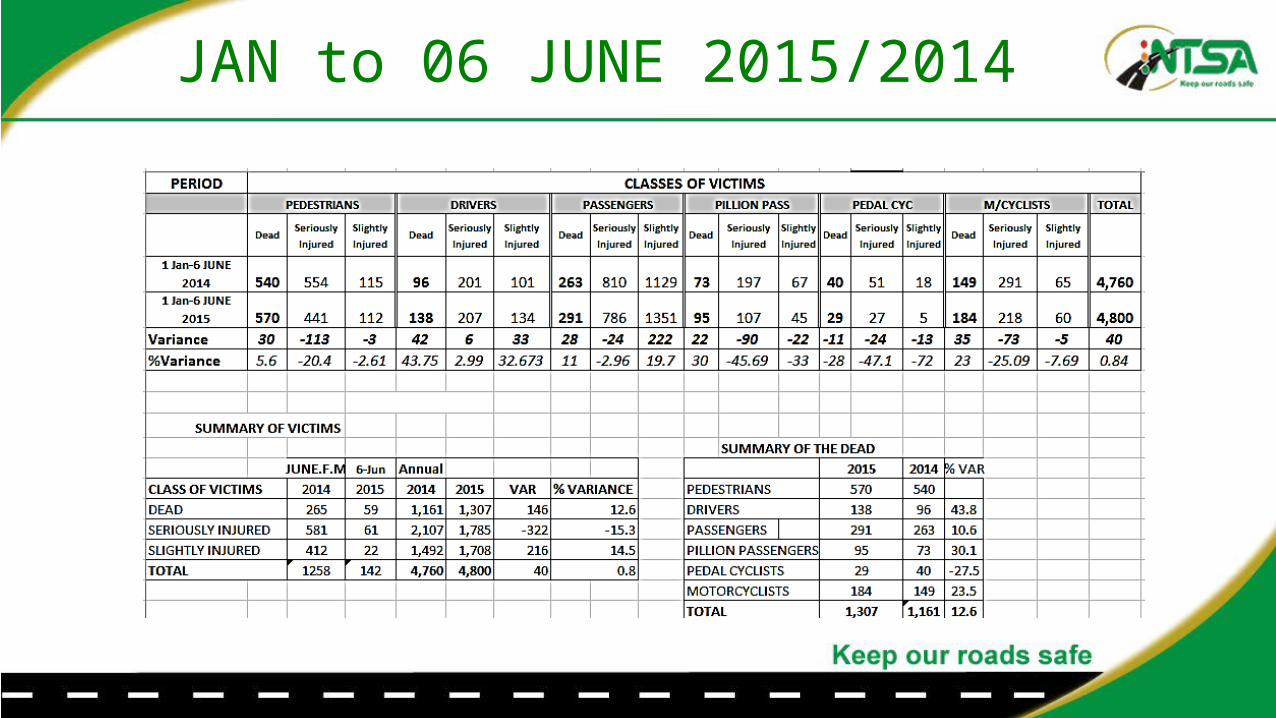
COMPARISON OF FATALITIES (UPTO 06 JUNE 2014/2015)
2015 2014% VAR
PEDESTRIANS 570 540 5.56
DRIVERS 138 96 43.8
PASSENGERS 291 263 10.6
PILLION PASSENGERS 95 73 30.1
PEDAL CYCLISTS 29 40 -27.5
MOTORCYCLISTS 184 149 23.5
TOTAL 1,307 1,161 12.6

Comparative Bar Chart showing the Fatalities of 2014/2015 upto 06 JUNE
PEDESTRIANS DRIVERS PASSENGERS PILLION PASSENGERS PEDAL CYCLISTS MOTORCYCLISTS
2015 570 138 291 95 29 184
2014 540 96 263 73 40 149
570
138
291
95
29
184
540
96
263
7340
149
06 JUNE 2015 2014
FATA
LITI
ES

Pie Chart comparison of fatalities of 2014/2015(Upto 06 June of each year)
Upto 06 JUNE 2015 Upto 06 JUNE 2014
PEDESTRI-ANS44%
DRIVERS11%
PAS-SEN
GERS22%
PIL-LION PAS-SEN
GERS7%
PEDAL CY-
CLISTS2%
MO-TOR-CY-
CLISTS14%
PEDES-TRIANS
47%
DRIVERS8%
PAS-SEN-GERS23%
PILLION PAS-SEN-GERS6%
PEDAL CYCLISTS
3%
MO-TORCY-CLISTS13%
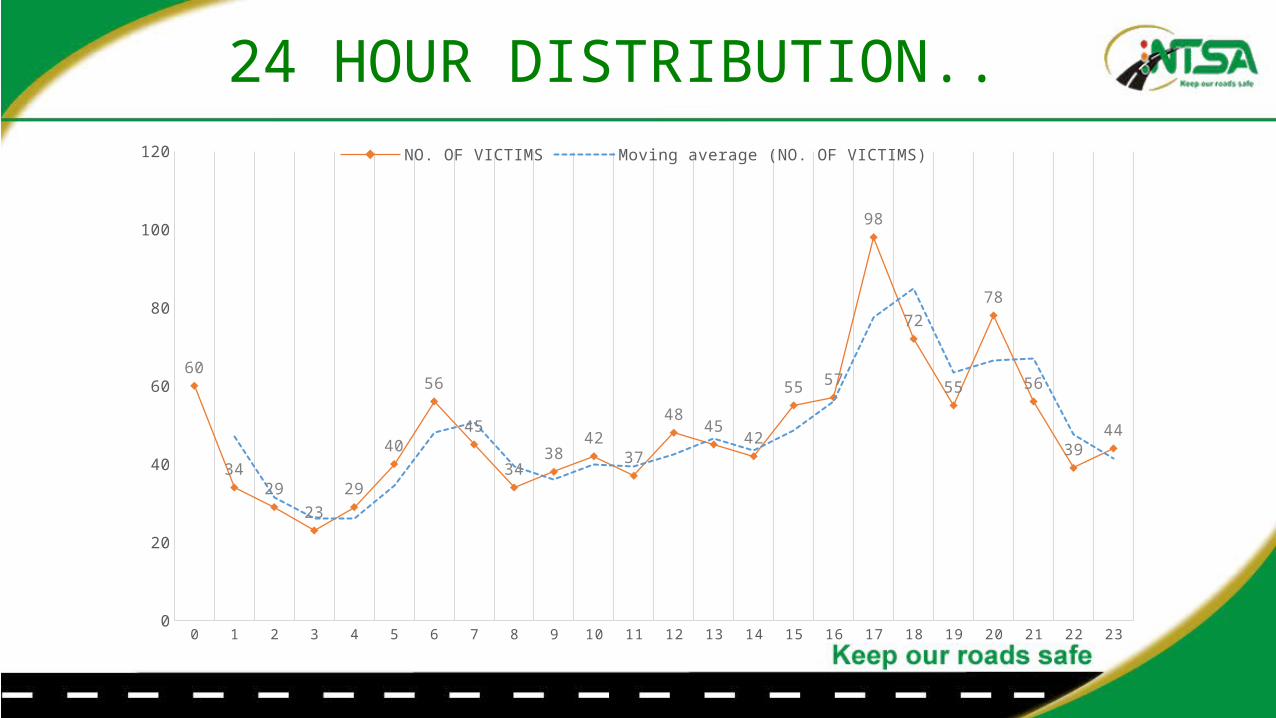
24 HOUR DISTRIBUTION..
0 1 2 3 4 5 6 7 8 9 10 11 12 13 14 15 16 17 18 19 20 21 22 230
20
40
60
80
100
120
60
3429
2329
40
56
45
3438
4237
4845
42
55 57
98
72
55
78
56
3944
NO. OF VICTIMS Moving average (NO. OF VICTIMS)
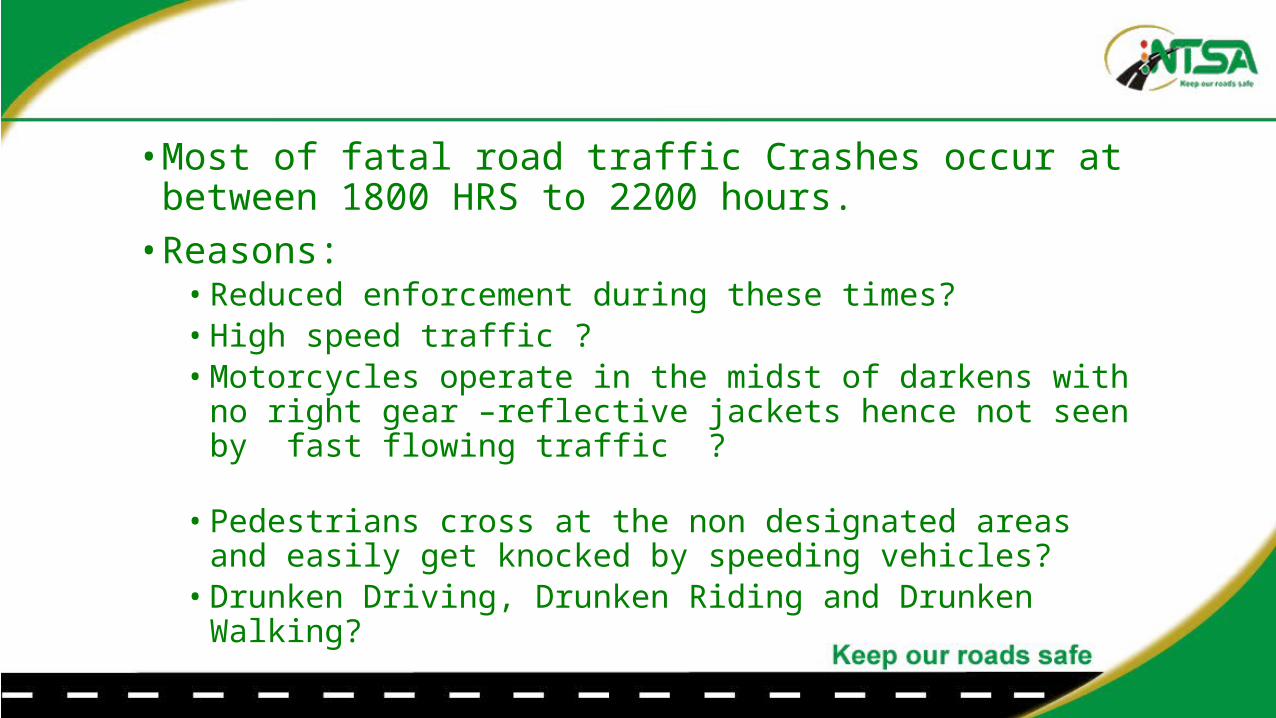
• Most of fatal road traffic Crashes occur at between 1800 HRS to 2200 hours.• Reasons:• Reduced enforcement during these times?• High speed traffic ?• Motorcycles operate in the midst of darkens with no right
gear –reflective jackets hence not seen by fast flowing traffic ? • Pedestrians cross at the non designated areas and
easily get knocked by speeding vehicles?• Drunken Driving, Drunken Riding and Drunken Walking?

Distribution across the year in the last 3 years
JAN FEB MARCH APRIL MAY JUNE JULY AUG SEPT OCT NOV DEC0
50
100
150
200
250
300
350
Distribution of fatal crashes across the calenderyear in the last 3 years.
2012 2013 2014
Month
No.
of F
taliti
es
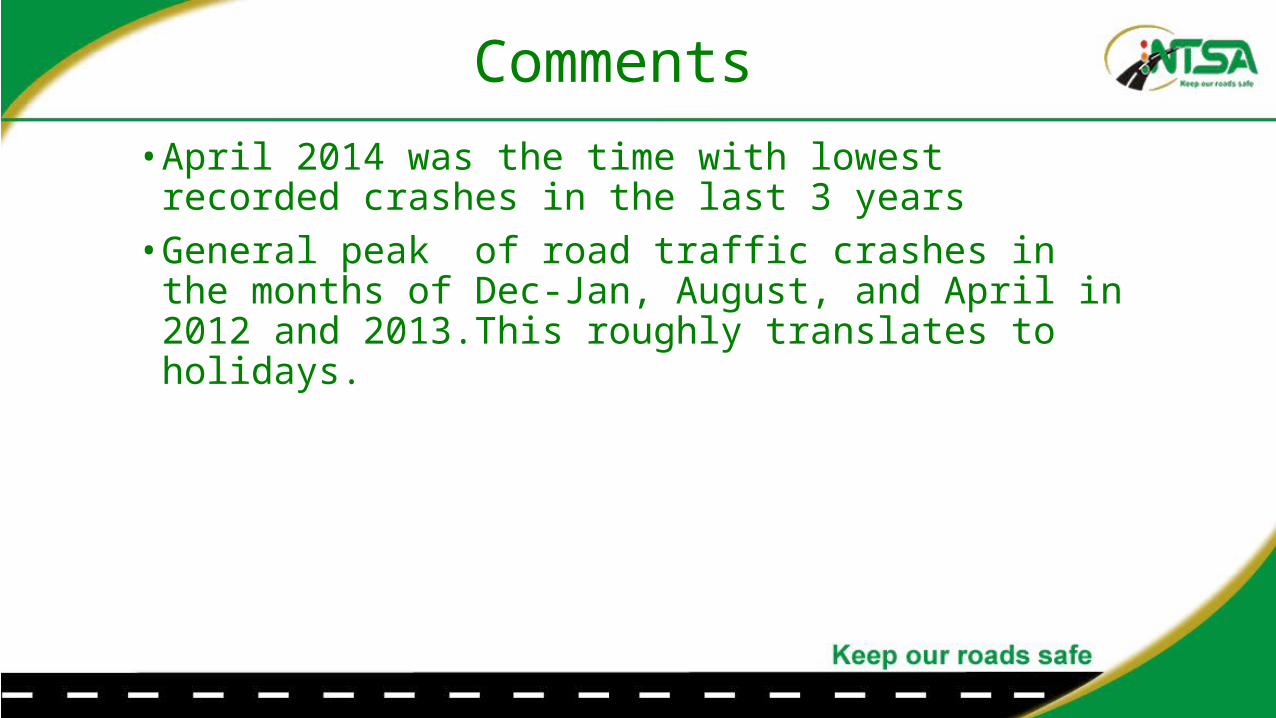
Comments• April 2014 was the time with lowest recorded
crashes in the last 3 years• General peak of road traffic crashes in the months
of Dec-Jan, August, and April in 2012 and 2013.This roughly translates to holidays.

Fatal crash contribution by vehicle type-2014
Motor cycle18%
Commercial vehicle16%
Private vehicle15%
PSV42%
Unknown motor vehicles6%
Others2%
2014 distribution of Fatal Crashes by vehicle type
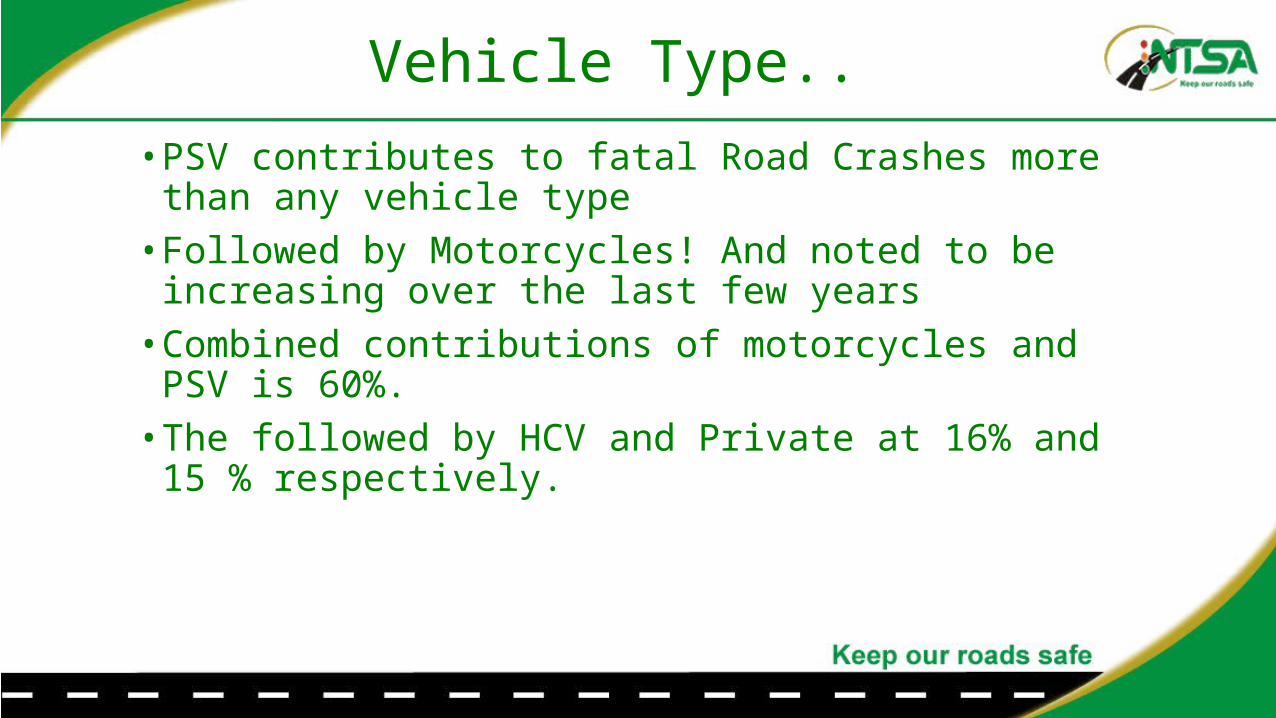
Vehicle Type..• PSV contributes to fatal Road Crashes more than
any vehicle type• Followed by Motorcycles! And noted to be
increasing over the last few years• Combined contributions of motorcycles and PSV is
60%.• The followed by HCV and Private at 16% and 15 %
respectively.

DISTRIBUTION ACROSS THE WEEK-JAN to 06 JUNE 2015
DAYS NO. OF VICTIMSSaturday 226Friday 198Thursday 196Sunday 193Monday 155Wednesday 143Tuesday 130TOTALS 1241
Saturday18%
Friday16%
Thursday16%
Sunday16%
Monday12%
Wednesday12%
Tuesday10%
% DISTRIBUTION ACROSS THE WEEK
Leading causes of accidents
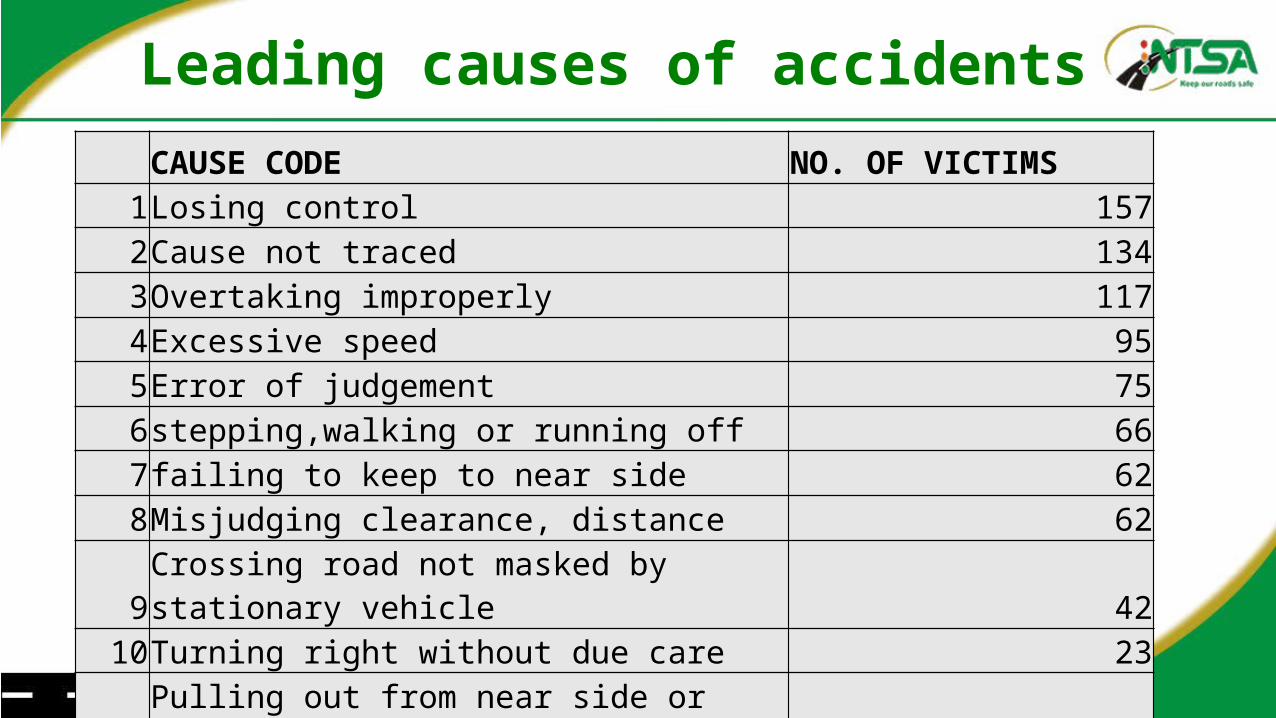
CAUSE CODE NO. OF VICTIMS1Losing control 1572Cause not traced 1343Overtaking improperly 1174Excessive speed 955Error of judgement 756stepping,walking or running off 667failing to keep to near side 628Misjudging clearance, distance 629Crossing road not masked by stationary vehicle 42
10Turning right without due care 2311Pulling out from near side or from, traffic lane 22
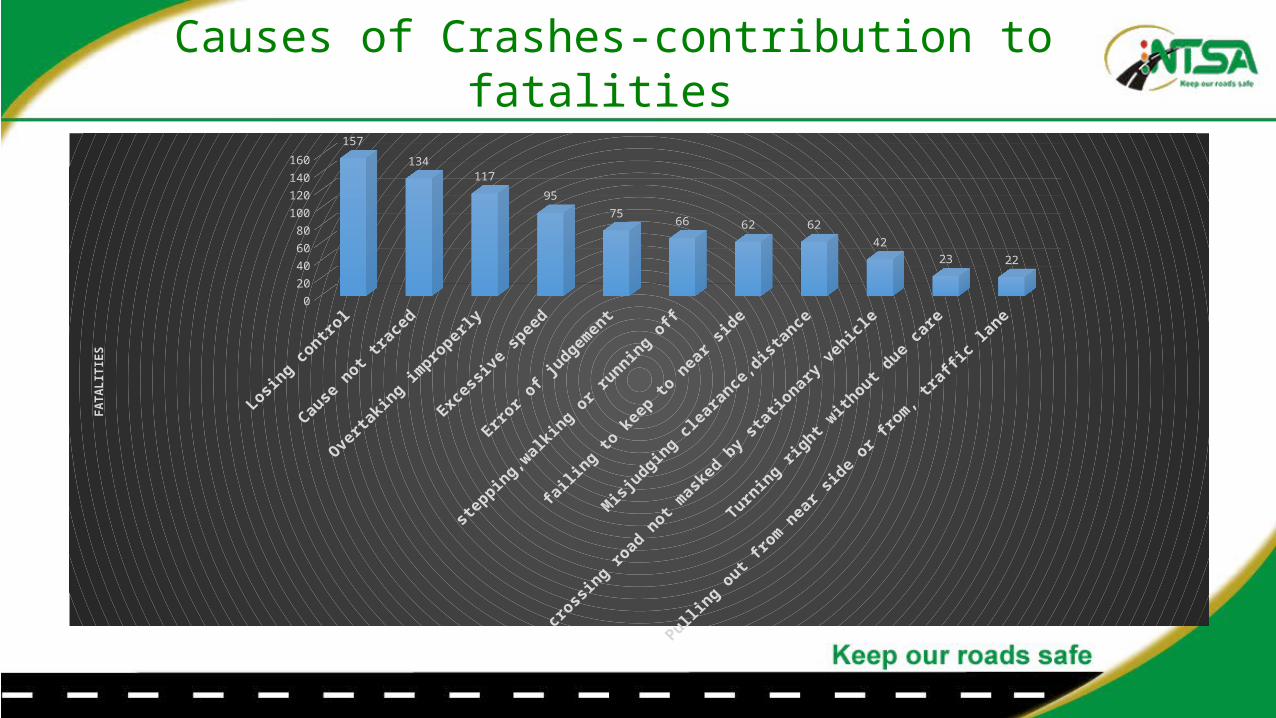
Causes of Crashes-contribution to fatalities
Losin
g contro
l
Cause not t
race
d
Overtaking im
properly
Excessi
ve speed
Error o
f judgement
stepping,w
alking or running off
failing to
keep to near s
ide
Misj
udging cleara
nce,dist
ance
crossi
ng road not m
asked by st
ationary vehicl
e
Turning ri
ght with
out due ca
re
Pulling out f
rom near s
ide or fro
m, tra
ffic lane
0
20
40
60
80
100
120
140
160157
134
117
95
7566 62 62
42
23 22
FATA
LITI
ES
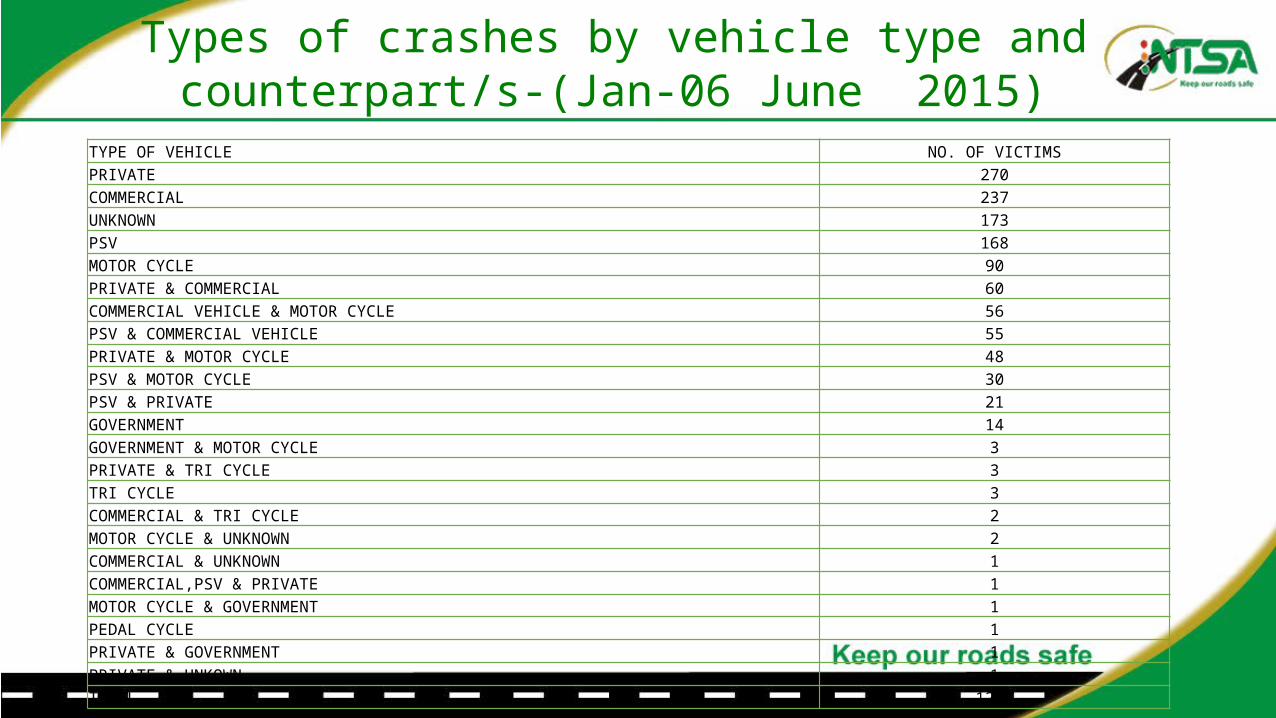
Types of crashes by vehicle type and counterpart/s-(Jan-06 June 2015)
TYPE OF VEHICLE NO. OF VICTIMSPRIVATE 270COMMERCIAL 237UNKNOWN 173PSV 168MOTOR CYCLE 90PRIVATE & COMMERCIAL 60COMMERCIAL VEHICLE & MOTOR CYCLE 56PSV & COMMERCIAL VEHICLE 55PRIVATE & MOTOR CYCLE 48PSV & MOTOR CYCLE 30PSV & PRIVATE 21GOVERNMENT 14GOVERNMENT & MOTOR CYCLE 3PRIVATE & TRI CYCLE 3TRI CYCLE 3COMMERCIAL & TRI CYCLE 2MOTOR CYCLE & UNKNOWN 2COMMERCIAL & UNKNOWN 1COMMERCIAL,PSV & PRIVATE 1MOTOR CYCLE & GOVERNMENT 1PEDAL CYCLE 1PRIVATE & GOVERNMENT 1PRIVATE & UNKOWN 1TOTAL 1241
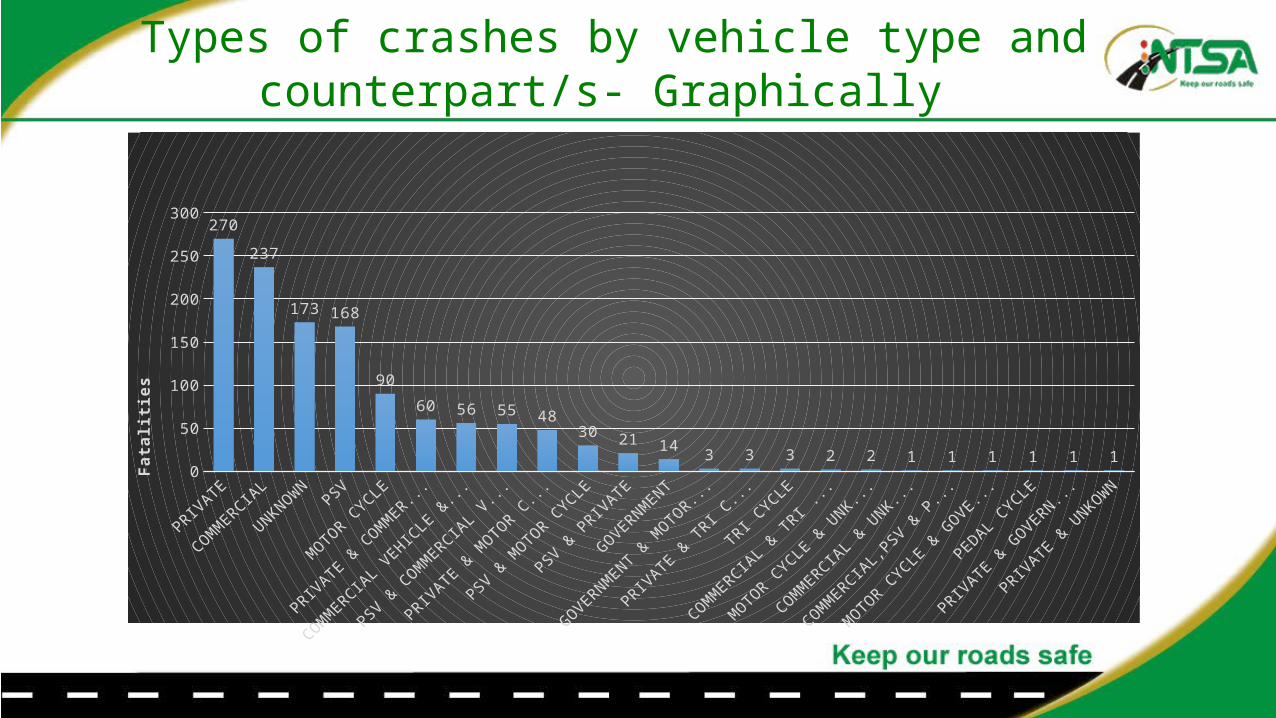
Types of crashes by vehicle type and counterpart/s- Graphically
0
50
100
150
200
250
300270
237
173 168
90
60 56 55 4830 21 14
3 3 3 2 2 1 1 1 1 1 1
Fata
lities
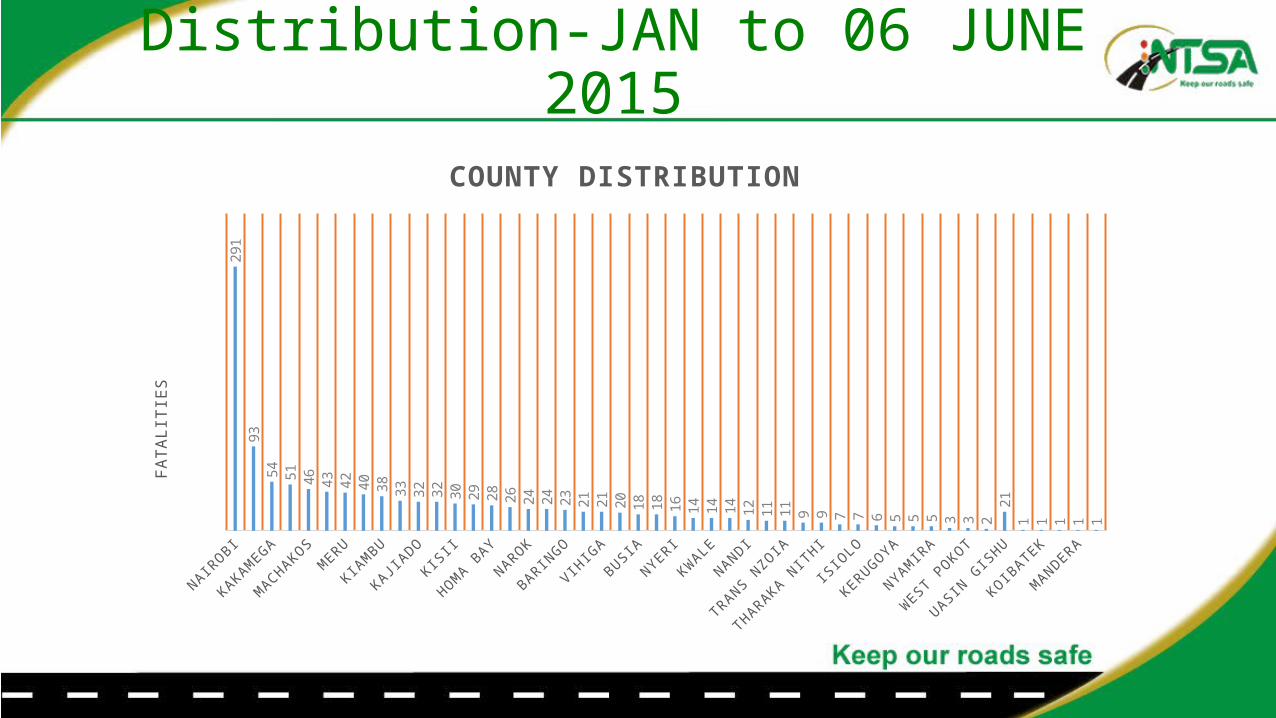
Distribution-JAN to 06 JUNE 2015
NAIROB I
KAKAMEGA
MACHAKOS
MERU
KIAM
BU
KAJIADO
KI SI I
HOMA B
AY
NAROK
BAR INGO
VIHIG
A
BUSIA
NYER I
KWALE
NANDI
TRANS NZOIA
THARAKA NI T
H I
I SIO
LO
KERUGOYA
NYAMIR
A
WEST P
OKOT
UASIN G
I SHU
KOIBATEK
MANDERA
291
9354 51 46 43 42 40 38 33 32 32 30 29 28 26 24 24 23 21 21 20 18 18 16 14 14 14 12 11 11 9 9 7 7 6 5 5 5 3 3 2
211 1 1 1 1
COUNTY DISTRIBUTION FA
TALI
TIES
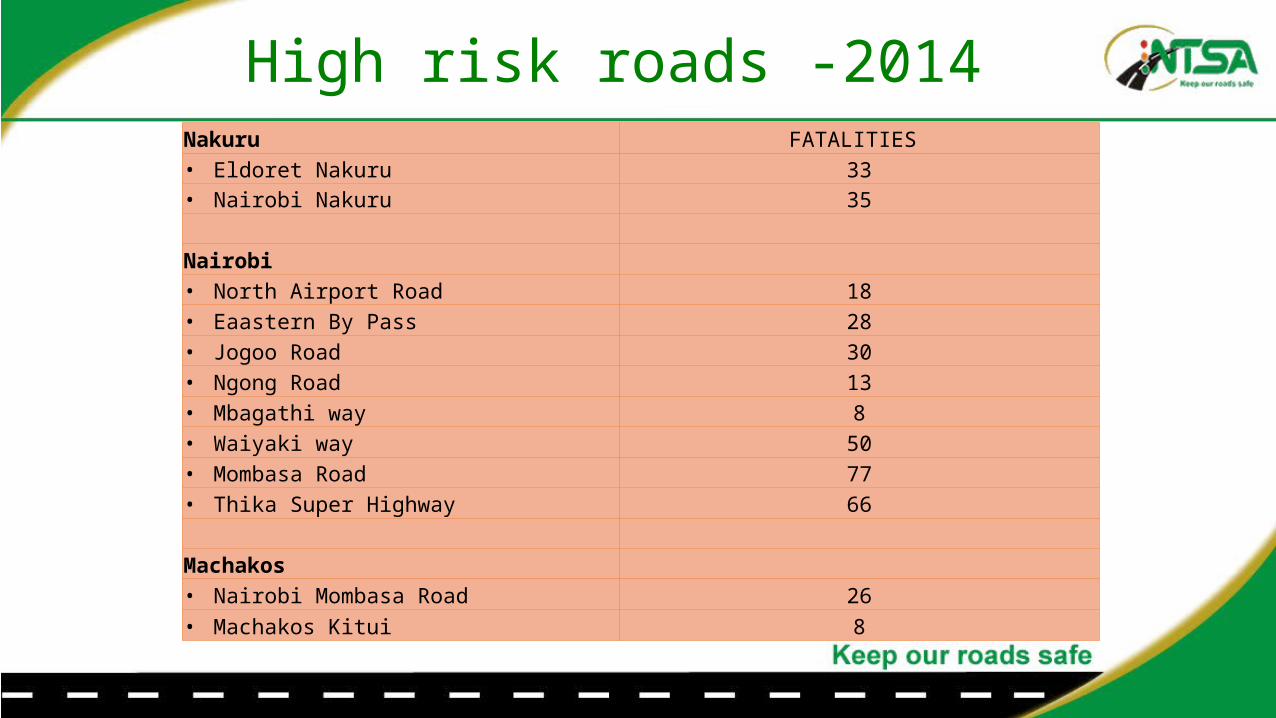
High risk roads -2014Nakuru FATALITIES • Eldoret Nakuru 33• Nairobi Nakuru 35
Nairobi• North Airport Road 18• Eaastern By Pass 28• Jogoo Road 30• Ngong Road 13• Mbagathi way 8• Waiyaki way 50• Mombasa Road 77• Thika Super Highway 66
Machakos• Nairobi Mombasa Road 26• Machakos Kitui 8

561 Fatal Injury in NBI in 2014
ROAD FATALITIES North Airport Road 18Eaastern By Pass 28Jogoo Road 30Ngong Road 13Mbagathi way 8Waiyaki way 50Mombasa Road 77Thika Super Highway 66Rest of NBI roads 271
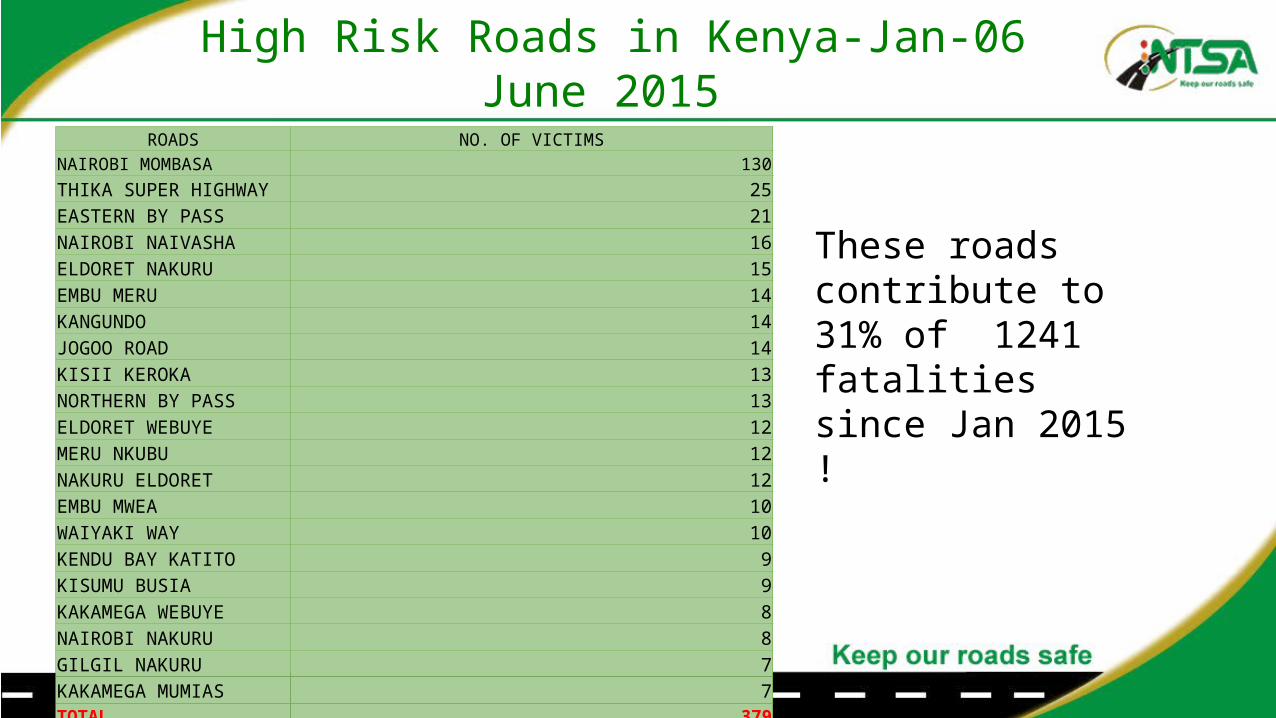
High Risk Roads in Kenya-Jan-06 June 2015 ROADS NO. OF VICTIMS
NAIROBI MOMBASA 130THIKA SUPER HIGHWAY 25EASTERN BY PASS 21NAIROBI NAIVASHA 16ELDORET NAKURU 15EMBU MERU 14KANGUNDO 14JOGOO ROAD 14KISII KEROKA 13NORTHERN BY PASS 13ELDORET WEBUYE 12MERU NKUBU 12NAKURU ELDORET 12EMBU MWEA 10WAIYAKI WAY 10KENDU BAY KATITO 9KISUMU BUSIA 9KAKAMEGA WEBUYE 8NAIROBI NAKURU 8GILGIL NAKURU 7KAKAMEGA MUMIAS 7TOTAL 379
These roads contribute to 31% of 1241 fatalities since Jan 2015 !

TOP 20 ROADS WITH HIGH FATALITIES
NAIROBI MOMBASA
THIKA SUPER HIGHW
AY
EASTERN BY PASS
NAIROBI NAIVASHA
ELDORET N
AKURU
EMBU MERU
KANGUNDO
JOGOO ROAD
KISII KEROKA
NORTHERN BY PASS
ELDORET W
EBUYE
MERU NKUBU
NAKURU ELDORET
EMBU MW
EA
WAIYAKI W
AY
KENDU BAY KATITO
KISUMU BUSIA
KAKAMEGA WEBUYE
NAIROBI NAKURU
GILGIL
NAKURU
KAKAMEGA MUMIAS
130
2521
16 15 14 14 14 13 13 12 12 12 10 10 9 9 8 8 7 7
JAN- JUNE 06 2015
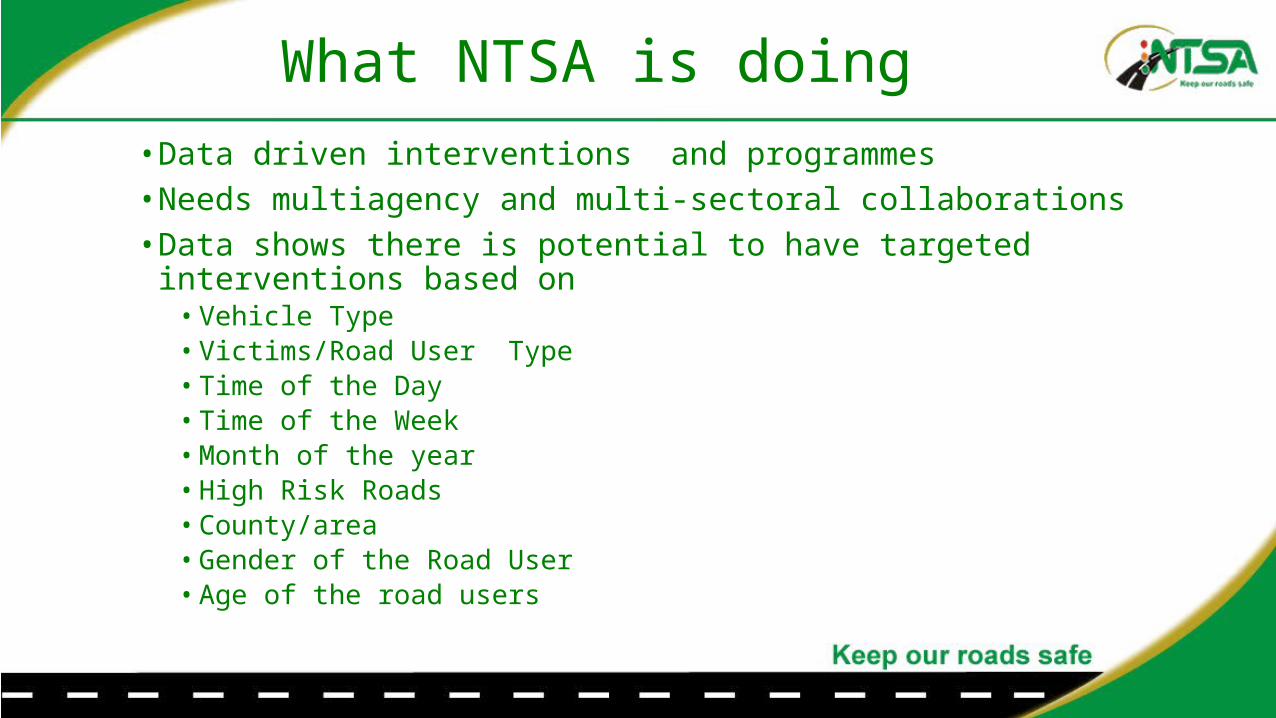
What NTSA is doing • Data driven interventions and programmes• Needs multiagency and multi-sectoral collaborations • Data shows there is potential to have targeted
interventions based on• Vehicle Type• Victims/Road User Type• Time of the Day• Time of the Week• Month of the year• High Risk Roads• County/area• Gender of the Road User• Age of the road users

Specific InterventionsBasically around• Enhanced and high visibility enforcement• Targeted communications• Implementation of the motorcycle regulations• Infrastructural and engineering treatments of the
high risk roads especially in Nairobi-to be done thro interagency collaborations
Thank you