State of NYC Dance
32
State Dance of NYC November 2011 Who How And How Much? Where What
description
This report highlights findings on New York City nonprofit dance that have been developed using information from the New York State Cultural Data Project (CDP). The CDP offers detailed information on the finances, programs and employment in arts and culture, much of which has never been collected in a systematic way before. The report includes all New York City-based organizations self-identifying as dance specific with annual budgets of more than $25,000 that completed a “review complete” CDP profile for FY 2009 or 2010 by the time the study was conducted. While the focus of this research is on dancemakers, the sample also includes presenters, educational institutions and service organizations all concentrating on dance. These categories are somewhat indistinct, with, for example, some presenters offering programs comparable to service organizations and some dancemakers providing substantive educational programs.
Transcript of State of NYC Dance

State
Dance
ofNYC
November 2011
Who
How An
d H
ow M
uch?
Whe
re
Wha
t


ACKNOWLEDGMENTS
This study was made possible by generous contributions from theRockefeller Brothers Fund and The New York Community Trust.
Dance/NYC’s research is supported, in part, by the Mertz GilmoreFoundation and the City of New York, Michael R. Bloomberg, Mayor, and the New York City Council, Christine C. Quinn, Speaker, through
the Department of Cultural Affairs, Kate D. Levin, Commissioner.
The data used for this report was provided by the Cultural Data Project (“CDP”), a collaborative project of the Greater Philadelphia Cultural Alliance, The Greater Pittsburgh Arts Council, Pennsylvania
Council on the Arts, The Pew Charitable Trusts, The William Penn Foundation and The Heinz Endowments. The Cultural Data Project was created to strengthen arts and culture by documenting and
disseminating information on the arts and culture sector. Any interpretation of the data is the view of Dance/NYC and does not
reflect the views of the Cultural Data Project. For more information on the Cultural Data Project, visit www.culturaldata.org.
Dance/NYCLane Harwell, Director @flashlane
Lacey Althouse, Operations Manager
www.dancenyc.org 218 East 18th Street, 4th floor
New York, NY 10003Phone: (212) 966-4452
Fax: (212) 988-4452
Prepared by: Catherine Lanier, Research Consultant
Lori Byargeon, Designer
In partnership with the Municipal Art Society of New York, Vin Cipolla, President, and Anne Coates, Vice President, and with the Alliance for the Arts, Randall Bourscheidt, President Emeritus.
Dance/NYC is a branch of Dance/USA (www.danceusa.org), the national service organization for professional dance, Amy Fitterer, Executive Director.
Dance/NYC’s mission is to sustain and advance the professional dance field in New York City—serving as the voice, guide and infrastructure architect for all local dance artists and managers. Dance/NYC achieves this mission through advocacy,
research and convening. For Dance/NYC research, including the Economic Impact of Dance in New York City and the Census of New York City Dancemakers, visit www.dancenyc.org
Honorary Circle: Gina Gibney, Virginia Johnson, Sharon Luckman, Tina Ramirez, Linda Shelton, Robert Yesselman, Jawole Willa Jo Zollar
Advisory Committee: Ellen Bar, Jonah Bokaer, Dick Caples, Beverly D’Anne, Alberto Dennis, Ana Marie Forsythe, Roland Gebhardt, David Harrison, Mark Kirschner, Harold Norris, Jill Sigman, Martin Wechsler, Sharon Williams
Junior Committee: Justina Gaddy, Benn Rasmussen, Lori Byargeon, Hollis Bartlett, Caroline Walthall, Kathleya Afandor, Marisa Ballaro, Eveline Chang, Eveline Chang, Erica Frankel, Leeanne G-Bowley, Brighid Greene, Maria Hanley, Sydnie Mosley,
Jessica Nowaski, Kaley Pruitt, Kaylen Ratto, Gary Schaufeld, Kate Wilfert, Michele Wilson, Caitlin Yuhas
This program is supported, in part, by public funds from the New York City Department of Cultural Affairs, in partnership with the City Council.
The program is made possible by the New York State Council on the Arts with the support of Governor Andrew Cuomo and the New York State Legislature.
1

Audrey Thelemann by CC Photography
TABLE OF CONTENTS
3 INTRODUCTIONS
5 STUDY SAMPLE & METHODOLOGY
8 REPORT HIGHLIGHTS
10 ACTIVITY
15 INCOME
20 EXPENDITURES
23 WORKFORCE
27 APPENDIX
State of NYC Dance

State of NYC Dance
3
INTRODUCTION
Nuanced research on the impact of arts and culture on our economy and quality of life is essential but difficult to come by. The State of New York City Dance report, utilizing information from the Cultural Data Project, is a significant contribution to our understanding of how dancers and dance organizations are making a deep impact on our City.
Taking a thoughtful approach, the study highlights the complex challenges facing this community, as well as its many accomplishments. By offering a detailed analysis of so many aspects of the dance industry – from the performers to the producers to the audiences – this report delineates many significant contributions to the City’s creative ecology. Congratulations to Dance/NYC for once again helping to shape the dialogue around dance and its role in our larger cultural sector. Kate D. LevinCommissionerNew York City Department of Cultural Affairs

INTRODUCTION
The study you are about to read is the most ambitious contribution to our understanding of dance in New York City since Dance/NYC’s Census of New York City Dancemakers (2007). Using the first-ever New York State Cul-tural Data Project (CDP) data, the analysis establishes key benchmarks for measuring the activity, economics and workforce of nonprofit dancemakers with budgets of more than $25,000. But it is only a step in an ongoing process to gauge the state and opportunity for dance, and to guide policy, funding and industry manage-ment, strengthening the future of dance in New York City.
Study findings underscore the value of nonprofit dance as a contributor to and an ambassador for our City, with thousands of performances locally and on tour, hundreds of new works and millions in attendance. Total aggregate expenditures of groups analyzed are $231 million—healthy contributions to our economy and pow-erful returns on investment.
Findings demonstrate industry resourcefulness in attracting diverse revenue streams—public, private and earned—and its efficiency in putting resources to work in dancemaking, with more than 70% of expenditures going to programs. City, State and Federal funding are critical to dancemakers of all sizes—a message all of us can carry to our representatives. (The City of New York is the most significant source of government funding for every budget category—a reality we expect to hold with the 2012 budget.) The relative power, and heroism, of a handful of private foundations supporting nonprofit dance is especially clear when we look at the portfolios of smaller groups. For any funder considering entering the market—join us!—there is opportunity for industry-wide, high-impact investment.
The CDP yields fresh insights on the industry’s reliance on part-time, contract and volunteer labor, the all too invisible hands that subsidize and keep dance vibrant. I would speculate that these workforce dynamics—to be explored in depth in a forthcoming Dance/NYC Junior Committee report on dance workers ages 21 to 35—are a sign both of the times and of the height of dedication unique to our industry.
Finally, I can enthusiastically report on a strong start-up culture in dance, particularly among dancemakers with budgets less than $100,000. As indicated by their income diversity, use of in-kind resources and barter econo-mies, and disproportionately high level of new creation—premieres and commissioned work—creativity and entrepreneurship are alive.
As I said, this study is a step in an ongoing investigation of the state of dance, continuing Dance/NYC’s legacy of pioneering research. Future studies will extend nonprofit findings to individual artists and alternative groups, which, as the 2007 Census tells us, comprise the lion’s share (more than 50%) of 1,000-1,200 local dancemakers. This kind of research, as the foundation for advocacy, is more important now than ever before as dancemakers respond to an evolving socioeconomic arena and seek new strategies for their operations, revenues and audi-ences.
What you are about to read represents a team effort. On behalf of Dance/NYC and of Dance/USA, the na-tional service organization for professional dance, I am proud to thank the project’s funders: Rockefeller Broth-ers Fund, The New York Community Trust and the New York City Department of Cultural Affairs (DCA). I thank our research consultant Catherine Lanier for her diligence, attention to detail and the love she has found for dance in the course of this study; our research partners, the Alliance for the Arts and the Municipal Art Society, Anne Coates, Vice President; the Department of Cultural Affairs for its stewardship; and Jimmy van Bramer, Chairper-son, Cultural Affairs Committee, New York City Council, for joining 150 dance artists and managers for a discus-sion of preliminary findings at a September 12, 2011, town hall.
With thanks also, dear reader, for all you do for NYC dance. Onward.
Lane HarwellDirector, Dance/NYC
State of NYC Dance
4

STUDY SAMPLE AND METHODOLOGY
This report highlights findings on New York City nonprofit dance that have been developed using information from the New York State Cultural Data Project (CDP). The CDP offers detailed information on the finances, programs and employment in arts and culture, much of which has never been collected in a systematic way before. A list of data fields from the CDP used in this analysis is presented in the appendix.
The report includes all New York City-based organizations self-identifying as dance specific with annual budgets of more than $25,000 that completed a “review complete” CDP profile for FY 2009 or 2010 by the time the study was conducted. All figures are for organizations’ 2009 or 2010 fiscal year, whichever is the earliest available. While the focus of this research is on dancemakers, the sample also includes presenters, educational institu-tions and service organizations all concentrating on dance. These categories are somewhat indistinct, with, for example, some presenters offering programs comparable to service organizations and some dancemakers providing substantive educational programs.
Two-Tier SampleThe study sample is two-tiered, comprised of an analytical base and a full, updated sample. The analytical base is built on information from 103 dance organizations made available to Dance/NYC on May 19, 2011. The sample was updated to include 24 additional organizations whose data became available as of October 7, 2011.*
While the additional data received in October does not change the overall patterns we saw in the analytical base, we nonetheless saw it as important to include them in a second tier to better represent the breadth and impact of New York City nonprofit dance.
The reader should note that the samples used alternate throughout the report. The full, updated sample pro-vides the most complete picture of the absolute expenditures levels, and measures of activity including perfor-mances, attendance and new creation, while the analytical base demonstrates how the patterns of activity and sources and uses of funds vary within the sector. The table below details the numbers of groups of various types in the analytical base and full sample.
Composition of the CDP Sample
Type Analytical Base Full Sample
Dancemaking 81 99
Presenting 6 8
Educational 8 11
Service 8 9
Total 103 127
State of NYC Dance
5
*The CDP’s review process requires participants to respond to data inquiries from the CDP, if any, before their information is “review complete” and available to researchers.
The CDP data provide rich detail on a broad sample of New York City dance organizations. It is not a census, however, and does not represent some important components of the dance industry.
Gregory Dolbashian, photo by Jennifer Jones

Other parts of the dance world fell outside the parameters of this analysis, specifically:• Individual dance artists• Commercial groups• Multi-, interdisciplinary or other groups not self-identifying as dance organizations• Dance presenters including the City-owned Brooklyn Academy of Music, Lincoln Center for the Performing Arts and New York City Center that encompass other disciplines as well as dance• Dancemakers from elsewhere coming to New York City to perform
Dancemakers AnalyzedThe analytical base from the CDP, comprised of 103 nonprofit dance organizations, represents a rich cross-section of groups in the dance universe. The 81 dancemakers at the core of this analysis vary in a multitude of artistic ways, and in terms of their economics they vary to a great degree by the size of the organization. The analysis is based on stratifying the sample into the following annual budget ranges.
Budget ranges Organizations
More than $5M 6
$1M–$5M 9
$500,000–$999,999 8
$100,000–$499,999 30
$25,000–$99,999 28
Total 81
State of NYC Dance
6
Zoë Blake, photo by Jennifer Jones
The CDP is a new initiative that has gained wide acceptance in the field, but the smallest orga-nizations and those without 501(c)3 status are as yet underrepresented. While the 2007 Census of New York City Dancemakers surveyed 197 dance-makers with annual budgets less than $25K, for example, there were too few groups in the CDP sample with budgets less than $25K to analyze, so this budget category was omitted. Similarly, while the 2007 Census showed fewer than half of the dancemakers in New York City were 501(c)3 corporations, all of the groups in the CDP sample had 501(c)3 status, so fiscally sponsored artists and organizations are not part of this analysis. It is anticipated that as the CDP grows, more of these organizations will participate and offer a more robust sample of the entire field of dance.
The CDP data for budget ranges reveal a great deal about the differences in the operations of dancemaking orga-nizations of varying sizes. It is important to note, however, that with this sample size certain categories are not as robust as others, especially in the $1M–$5M and $500K–$999K ranges. The findings in these budget categories should be understood as describing an important segment of dancemakers in these bud-get ranges rather than representing all dancemakers of the given budget size.
Tiffany Griffin by CC Photography

7
Monday September 12, 5:30–7:00 pm, 92nd Street Y Harkness Dance Center
Findings based on the analytical sample were presented at a Dance/NYC town hall on September 12, 2011. Edward Henkel, Assistant Director, 92nd Street Y Harkness Dance Center; Lane Harwell, Director, Dance/NYC; and Jimmy van Bramer, Chairperson, Cultural Affairs Committee, New York City Council, made opening re-marks. Research Consultant Catherine Lanier presented findings, and Anne Coates, Vice President, Municipal Art Society, led a discussion among the attendees.
Of more than 150 attendees, approximately two-thirds were dancemakers or dancemaker representatives. Of that group, approximately half were nonprofit dancemakers. Additional attendees included arts researchers, consultants, funders and representatives from the City of New York.
The town hall was not only an opportunity to give the field a sneak preview of our findings, but also to generate dialogue grounded in this research. Select discussion comments are included throughout the report, pointing to opportunities for improved policy, funding and industry management, as well as to trajectories for further reflection and research.
See the town hall video at: http://vimeo.com/31107022
Dance/NYC convenings are made possible, in part, by public funds from the New York City Department of Cultural Affairs, in partnership with the City Council. They are also made pos-sible by the New York State Council on the Arts with the support of Governor Andrew Cuomo and the New York State Legislature, and by the National Endowment for the Arts.
photo by Samantha Siegel
photo by Samantha Siegel
Catherine Lanier, Research Consultant; Anne Coates, Vice President, Munici-pal Art Society; Jimmy van Bramer, Chairperson, Cultural Affairs Committee, New York City Council; Lane Harwell, Director, Dance/NYC; Ben Rodriguez-Cubenas, Program Director, New York City, Rockefeller Brothers Fund
“I can’t think of another time when folks from such myriad aspects of the community would gather—artists, funders, educators, presenters, researchers, administra-tors, etc.” —Participant, Town Hall
Dance/NYC State of NYC Dance Town Hall

“The data create an opportunity to tell a story in context. Look at your own organization and compare it to a picture of what’s happening in New York. Find your budget category and see how you fit in and then use that to talk to your boards, your staff, and your funders and get bet-ter at telling your story.” —Victoria Smith, Dance/USA Manager of Research, Town Hall
State of NYC DanceREPORT HIGHLIGHTS
*Aggregate activity and expenditure findings are based on the full CDP sample of 127 dance organizations, including 99 dancemakers. All other data is based on the analytical sample of 103 dance organizations, including 81 dancemakers.
DANCE AS ECONOMIC ENGINE*
The total annual expenditures of the 127 dance organizations represented in the full sample are $230.7 million—a healthy contribu-tion to the economy. This number breaks down as follows:
$192.0M Expenditures for 99 Dancemakers
$13.2M 8 Presenters
$21.6M 11 Educational
$3.9M 9 Service organizations
NYC DANCEMAKER ACTIVITY*
New York City’s dancemakers as represented by the 99 organizations in the full sample are vibrant contributors to and ambassadors for the City with activity of:
1,576 Performances in New York City
1,312 Performances on tour
2.1M Paid attendance
234 Premieres
99 New works commissioned
INCOME SOURCES BY BUDGET SIZE
Income sources vary significantly by group size in the analytical sample of 81 dancemakers.• Earned income is the dominant source for or-ganizations with budgets of more than $500K.• Private contributions are the most important source for dancemakers in $25K–$499K range. • Government funding is important to dance-makers of all budget sizes.
EARNED INCOME
Findings reveal the resourcefulness of dance-makers in generating earned income. • New York City ticket sales are the primary source of earned income for dancemakers with budgets of more than $5M.• Dancemakers with smaller budgets have attracted diverse sources of earned income from touring to contracted services and tu-ition/workshops.
PRIVATE INVESTMENT
Findings show how vital a handful of founda-tions are to the City’s dance ecology.• Dancemakers in the $100K–$999K budget ranges receive almost half of their contributed income from foundations. • Dancemakers in the $500K–$999K range are funded by an average of 6 foundations.• Dancemakers in the $100K–$499K range are funded by an average of 4 foundations. On average, these dancemakers are receiv-ing one-quarter of their total income from this source.
8
ROLE OF PUBLIC FUNDING
Findings indicate the importance of City, State and Federal funding to New York City dance-makers. • The City of New York through the Depart-ment of Cultural Affairs is the most important source of government funding in every budget range. • State funding through the New York State Council on the Arts increases as a percent of government funding as budget size decreases, making it of great importance to the smallest groups.

REPORT HIGHLIGHTS
STRONG START UP CULTURE
The data on the smallest groups ($25K–$99K) reveal a strong start-up culture, as demonstrated by:• Diverse income portfolios• Significant in-kind resources—barter economy• Relatively low numbers of full- and part-time staff• High use of independent contractors/volun-teers• High level of new creation—premieres and commissions
FINANCIAL CHALLENGES
Aggregate dancemaker revenue exceeds expenditures, but by a very narrow margin, and many dancemakers operate in the red.
SIMILARITIES TO THE WIDER ARTS INDUSTRY
The data on New York City dance indicate strong similarities to the wider arts and cultural industry as described in Alliance for the Arts’ studies, es-pecially in terms of:• Geography, with a large majority of all non-profit groups based in Manhattan• Aggregate expenditures by budget size (81% of the dance total is tied to 6 dancemakers with budgets of more than $5M)• Meeting the imperative for earned income, which has fueled growth in the nonprofit arts since the early 1980s
State of NYC Dance
DANCE WORKFORCE
The workforce is hugely reliant on part-time, contract and volunteer employees—the all too invisible hands that subsidize and keep the indus-try vibrant. This may be a sign both of the times and a challenged economy, and of the height of dedication unique to the industry.
OPPORTUNITY TO POOL ADMINISTRATIVE RESOURCES
General and administrative expenditures in-crease as a share of expenditures from 9.9% for the largest dancemakers (budgets of more than $5M) to over 22% for dancemakers with budgets less than $500K, which may signal economies of scale and an opportunity for smaller groups to pool administrative resources.
9

Performances and Attendance
New York City’s dancemakers in the full sample, as represented by the 99 organizations, are vibrant contribu-tors to and ambassadors for the City, as evidenced by more than 1,500 performances annually in New York City and almost as many performances elsewhere. New York City dancemakers attract more than two million paying attendees.
Dancemaker Activity
1,576 Performances in New York City
1,312 Performances on tour
2.1M Paid attendance
234 Premieres
99 New works commissioned
WHERE AND WHAT? NYC DANCE ACTIVITY
Location of NYC Dance Organizations
Three-quarters of the 103 New York City dance organizations in the analytical sample are headquartered in Manhattan, with most of the remaining (19%) in Brooklyn. Approximately 4% are located in Queens and 1% in both the Bronx and Staten Island. This sample includes presenters, educational institutions and service organi-zations, as well as the dancemakers who are the focus of this research. As indicated by a comparison to data from the Alliance for the Arts’ State of the Arts (June 2011), the location of dance organizations is similar to that of nonprofit arts organizations of all disciplines. This distribution with its concentration in Manhattan refers to the organizational home only, not to where dance workers or audiences live, or even where dance is performed.
State of NYC Dance
Alliance for the Arts, State of the Arts: Summary Overview for NYC, June 2011.
“The workforce, audiences and their performanc-es are not neces-sarily in Manhat-tan. They’re not!” —Participant, Town Hall
“Where are art-ists working? This goes directly to questions about things like retain-ing work spaces in the boroughs.” —Participant, Town Hall
“There is a lot of activity out there that is by definition under the radar because it’s not organized in nonprofit corporations.” —Participant, Town Hall
“It would also be good to compare our information to, for instance, London or Paris.” —Participant, Town Hall
“YES, we need to be thinking global.” —Lane Harwell, Presenter, Town Hall, in response
NYC Art Organizations by Borough
10

11
The analytical sample of 81 dancemakers demonstrates how performances, whether at home or away, and their paying audiences are dispersed across the sector. The larger organizations stage performances for audiences that are much greater in size, on average, than those of their smaller counterparts.
• Dancemakers with budgets of more than $5M account for 38% of all performances, but 65% of the paid atten-dance. The average performance attendance in this budget range is 1,155.
• Those with budgets of $1M–$5M account for 15% of performances and 18% of attendance. The average at-tendance per performance is 835.
• Those with budgets of $500K–$999K account for 10% of performances and 5% of attendance. Their average at-tendance is 346.*
• Those with budgets of $100K–$499K account for 25% of performances and 6% of attendance. Their average at-tendance is 149.
• Those with budgets of $25K–$99K account for 12% of performances and 6% of attendance. Their average at-tendance is 341.
State of NYC Dance
Performances and Audience by Budget Size
Kost
as
Pap
am
att
he
aki
s a
nd
Dw
ain
Tra
vis
by
CC
Ph
oto
gra
ph
y
*The percentages in this budget category are surprisingly low, representing the groups in the sample and not necessarily all dancemakers of the given size.
“The appetite for audience data has to be collected here. You all need to want it, because if you want it, you will collect it.” —Anne Coates, Presenter, Town Hall

State of NYC DanceExpenditures by Budget Size
Total aggregate expenditures for the 127 dance organizations in the full sample, including educational, pre-senting and service organizations, are $230.7M, with dancemakers contributing $192.0M.
The analytical sample of 81 dancemakers shows that the lion’s share of expenditures was made by the largest dancemakers.
These proportions are virtually identical to those of the entire New York City nonprofit cultural industry found in the Alliance for the Arts’ study, The Arts as an Industry (2007) as shown in the table below.
Comparison of Expenditures: Nonprofit Dancemakers and All Nonprofit Culture
Budget Size Dancemakers All Cultural Organizations*
>$1M 91% 93%
$500K–$999K 3% 3%
$100K–$499K 5% 3%
<$100K 1% 1%
*The Alliance for the Arts, The Arts as an Industry: Their Economic Impact on New York City and New York State, 2007.
• 81% were made by 6 organizations with annual budgets of more than $5M
• 10% were made by 9 organizations with budgets of $1M–$5M
• 3% by 8 organizations with budgets of $500K–$999K
• 5% by 30 organizations with budgets of $100K–$499K
• 1% by 28 organizations with budgets of $25K–$99K
12
Loni Landon, photo by Jennifer Jones
Expenditures by Budget Size

13
Indicators of Innovation
Innovation and creativity run throughout New York City’s dancemaking community. The full sample of 99 dancemakers during the study period produced: • 234 premieres—133 world, 23 national and 78 local• 99 new works commissioned• 2,352 public and 463 professional classes and workshops held by dancemakers (not including those at educational institutions)• 51 workshops for new works
Dancemakers of all sizes participated energetically in this generation of new dance as shown in the table below. While the largest dancemaking organizations account for the majority of performance activity and especially expenditures, the data from our analytical sample indicate that the smaller ones are the sources of a disproportionately large share of new work.
These findings point to a strong start-up culture in New York City dance, where creativity and entrepreneurship are alive and can be harnessed to strengthen the future of the art form.
New Dance Generation by Budget Size
>$5M $1M-$5M $500K-$999K $100K-$499K $25K-$99K
Premieres 15.0% 13.0% 22.5% 30.5% 19.0%
Commissions 31.3% 8.4% 22.9% 14.5% 22.9%
Workshops
Public 10.5% 34.5% 14.2% 34.4% 6.4%
Professional 5.2% 14.5% 42.9% 27.8% 9.6%
New Works 2.1% 14.9% 17.0% 51.1% 14.9%
# dancemakers 6 9 8 30 28
State of NYC Dance
Jordan Isadore, photo by Jennifer Jones

HOW AND HOW MUCH?
The Economics of NYC Dancemakers
Financial Challenges
For all this exuberance, these are difficult times financially for nonprofit dance. A review of available data from 2006 to 2009/2010, including the Dance/NYC Census of New York City Dancemakers and New York State Coun-cil on the Arts applications, shows an uneven patchwork of growth and decline. Dancemakers with budgets of more than $5M have grown very slightly in real terms, but organizations in the smaller budget ranges, and particularly the smallest budget range, have struggled on the whole. There is a high degree of variation in how dance companies in each budget range have done over these years.
In the study period, according to CDP data for our analytical sample of 81 dancemakers, dancemakers as a whole are operating in the black, but on a case by case basis for many the margin is uncomfortably slim or negative.• The largest dancemakers show a margin of aggregate revenue over expenses of 12%, but most of their cush-ion is derived from investment income, rather than their operations and contributions.• Those in the $1M–$5M range had aggregate expenditures that exceeded their income by 6%.• Those in the $500K–$999K range had 1% more aggregate revenues than expenditures.• Those in the $100K–$499K and $25K–$99K ranges had 3% more revenues than expenditures.
State of NYC Dance
“We used to be envious of Europeans but things are changing. . . . Arts organizations are actu-ally coming to New York now and studying how New Yorkers deal with budget cuts.” —Participant, Town Hall
“Given the high degree of variation, we are inter-ested in looking at those groups that have fared very well and seeing why. This is a next step.” —Lane Harwell, Presenter, Town Hall
“Take this information to your board and to your funders and say, ‘Hey, look, a little bit of capital goes a long way.’” —Participant, Town Hall
“I found that in my work consulting around the country that in some cases the dancers actu-ally contribute money to the organization that’s not being captured here.” —Participant, Town Hall
14
15
INCOME
Sources of revenue within the analytical sample vary significantly by budget size.
• Earned income is most significant for the largest organizations, which derive 58% of their revenue from earned income sources, well over twice the share of 24% of revenue that the smallest organizations receive from earned income sources.
• Private contributions are most important for smaller organizations, especially those with budgets less than $100K, which derive 63% of all income from these sources.
• Public funding is an important component, particularly for organizations in the $500K–$999K budget category, but comes in a distant third in importance for the other budget ranges.
State of NYC Dance
*The Alliance for the Arts, The Arts as an Industry: Their Economic Importance to the New York—New Jersey Metropolitan Region, 1993; Who Pays for the Arts? Income for the Nonprofit Cultural Industry in New York City, 2010.
Earned Income
Earned income has fueled growth in the nonprofit arts since the early 1980s, more than tripling in real terms from 1982 to 2009.* In dance, earned income plays a critical role. The many distinct sources of earned income vary significantly in importance among dancemakers of different sizes within the analytical sample.
• New York City ticket sales are by far the most important source of earned income earned for organizations with budgets of more than $5M, accounting for nearly six in ten dollars earned from operations (58.7%). Three-quarters of this amount is derived from single ticket sales, while one-quarter comes from subscriptions. This is the only budget category for which subscriptions is a significant source of revenue. For organizations in budget ranges less than $5M, admissions income, derived virtually one hundred percent from single ticket sales, is a much less important source of income earned from operations. For this group, 7.9%–15.1% of income earned from operations is from New York City ticket sales.
• Touring provides dancemakers in all budget categories a significant portion of their earned income. The importance of touring increases as budget size increases, reaching the highest share in groups in the $1M–$5M budget range, which earn almost half (44.6%) of their income from operations from touring. Touring is a less im-portant share of earned income for groups more than $5M than for any of the other budget categories.
• Contracted services and performances include income from any services performed under contract to another organization, ranging from performances to fees for services. It does not include touring income. This is least important for the largest organizations, which earn 6.7% of their income from operations from this source, and most important for the smallest organizations, which earn 33.7% from this source. Middle-sized groups de-rive a significant portion of their earned income from contracted services and performances (17.2%–22.6%).
Sources of Income by Budget Size

State of NYC Dance
“There is an opportunity to dig deeper into the data on educational institutions and the educational programs of dancemakers in the CDP.” —Lane Harwell, Presenter, Town Hall
“Children account for more than 10% of the total nonprofit arts audiences in New York City.” —Anne Coates, Presenter, Town Hall, on Alliance for the Arts research
NYC Ticket Sales 58.7% 13.2% 7.9% 13.9% 15.1%
Touring 15.8% 44.6% 28.8% 17.7% 16.9%
Contracted Performances/Services
6.7% 20.8% 17.2% 22.6% 33.7%
Tuition/Workshops 14.1% 19.7% 33.2% 34.3% 23.0%
Miscellaneous 4.7% 1.7% 12.9% 11.5% 11.3%
• Tuition and workshops are an important source of earned income for dancemakers in every budget cat-egory. It is particularly important for those in the $500K–$999K and $100K–$499K ranges, where it accounts for one-third of aggregate earned income. It is also quite important for the smallest organizations, at one-quarter (23%) of their earned income. Tuition and workshops represent a somewhat smaller portion of earned income for dancemakers with budgets of more than $1M.
• Miscellaneous income, including rentals and merchandise sales, constitutes less than 5% of income from operations for the two largest categories of dancemakers with budgets of more than $1M, but is a significant source of income for groups less than $1M, which derive 11.3%–12.9% of their earned income from these sources.
In addition to earned income sources considered here, a very few of the largest dance groups make a signifi-cant portion of their income from investments. This is an important source for these groups, but negligible for the rest of the industry.*
*Investment and interest income is included in the total earned income figures, but not in the analysis of the various components of earned income.
16
Income Earned from Operations

“I was really surprised by the amount of funding that comes from foundations because in all of the com-panies I have worked with over the years funding has been primarily through private individuals.” —Participant, Town Hall
“It struck me how sharply the amount of foundation income in terms of per-centage of a company’s income rises the smaller the company is. Given that very few dollars can make such a big difference to a small company, there is an opportunity for founda-tions and corporations to band together.” —Participant, Town Hall
17
Private Contributions
Private contributions include donations by board members, other individuals, corporations, foundations, fundraising events and other, including in-kind contributions. The share of contributed income supplied by each of these sources varies significantly by budget size.
• Board member contributions are a very important source of private contributions. For the two largest budget ranges, this is the largest source of private contributions, accounting for about one third of this category. For the midrange groups with budgets of $500K–$999K and $100K–$499K, board contributions fall to be-low 10% of total private income. Board contributions constitute a larger share, 20.9% of private contributions to the smallest groups.
• Individual contributions account for between 14.1% and 24.2% of private contributions. In the largest groups, it is notable that individuals are contributing fewer total dollars than board mem-bers.
• Corporate contributions constitute the smallest portion, 1.9% to 7.8% of private contributions for dancemakers in all budget ranges.
• Foundations play a vital role in supporting dance. Foundations are especially important for dancemakers in the $500K–$999K range and the $100K–$499K range, where they account for nearly half of private contributions. Groups in the $500K–$999K range are funded by an average of six foundations; groups in the $100K–$499K range are funded by an average of four. In the $100K-$499K range, private contributions account for almost half (48.5%) of all income, making the concentration of income coming from a few foundations a particularly notable finding.
State of NYC Dance
Jaedon Thomson, photo by CC Photography

State of NYC Dance• Fundraising events are more important for the larger organizations, accounting for 17.4% of private contribu-tions for the largest budget range and decreasing to 4.0% for the smallest.
• Other contributions, including in-kind contributions, are most important, generally speaking, for the smaller or-ganizations. In the smallest budget size, this category accounts for a quarter (24.0%) of all private contributions. This finding is an important indication of the resourcefulness of dancemakers in this budget category.
18
Board 30.9% 31.8% 9.2% 5.4% 20.9%
Individual 24.2% 16.0% 14.1% 23.3% 21.5%
Corporate 7.0% 7.8% 3.6% 4.7% 1.9%
Foundation 15.0% 28.4% 47.9% 48.8% 27.7%
Fundraising Events 17.4% 12.3% 11.0% 6.9% 4.0%
Other (Incl In-kind) 5.5% 3.7% 14.2% 10.9% 24.0%
Sources of Private Contributions by Budget Size
State of NYC Dance
**This graph excludes County funding, which only existed for organizations in the $100K–$499K range, at 2.1% of their total government funding.
“If you’re not at the table, your seat is going to be filled by some other advocacy group and some other issue. We need more money for day care, we need more money for libraries, we need more money for parks.” —Jimmy van Bramer, Chairperson, Cultural Affairs Committee, New York City Council and Speaker, Town Hall*
*Robin Pogrebin, “Groups Advocating for the Arts Feel the Pinch,” The New York Times, August 8, 2011.
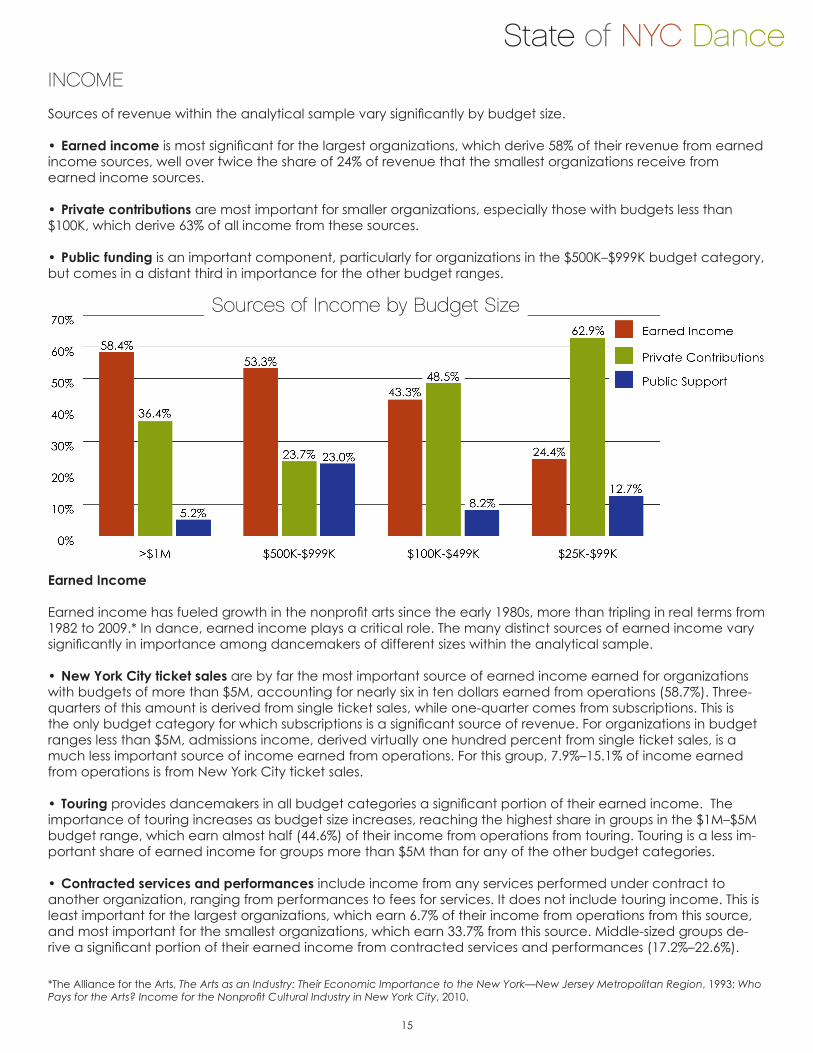
Government Funding
These findings indicate the importance of City, State and Federal funding to New York City dance. Government funding is of particular importance to groups in the $500K–$999K range, where it accounts for nearly a quarter (23.0%) of total income. In the other budget ranges, it accounts for 5.2% to 12.7% of income, as indicated at the beginning of this income section on page 14.
• New York City provides a majority of government funding in every budget category, accounting for 60.8% of government funding for groups with budget of $1M and more, and declining to 51.4% of funding for groups in the $25K–$99K range.
• New York State funding increases as a share of government funding as budget size decreases, rang-ing from 17.0% for the largest groups to 44.1% for the smallest.
18
Government Support by Budget Size
19
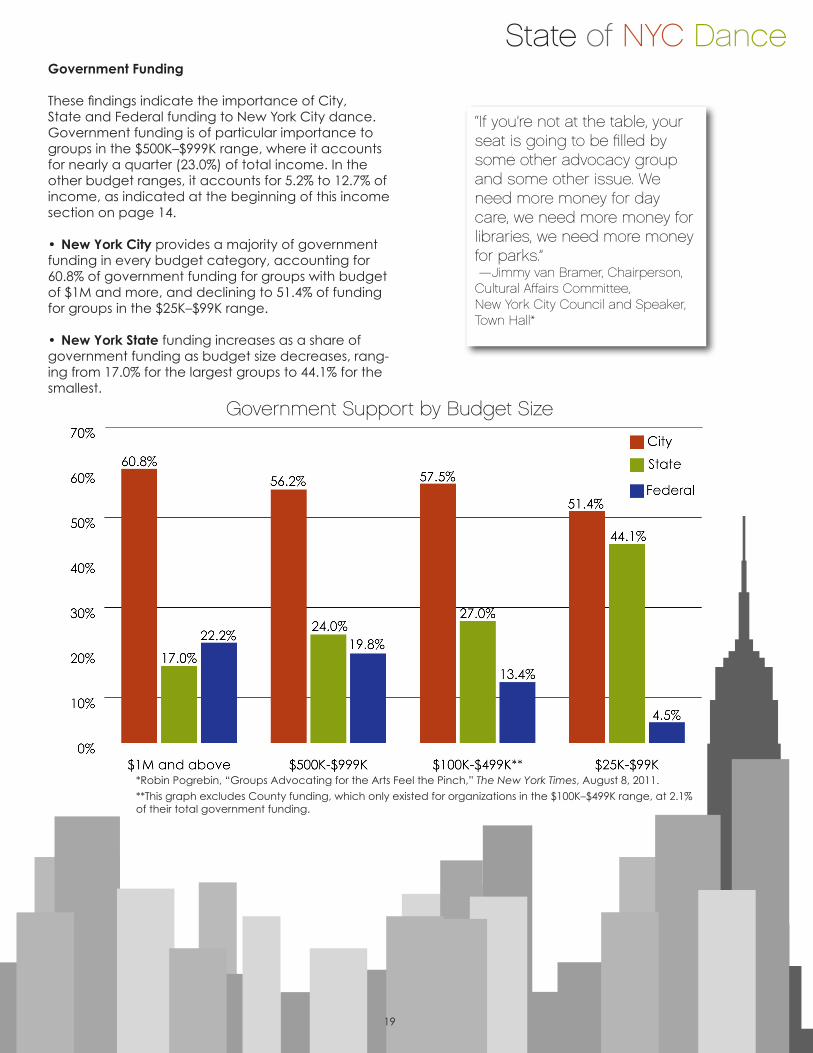
• Programming accounts for the great majority of dancemaker expenditures, more than 70% in all budget ranges—suggesting efficiencies in the industry. This functional category encompasses “any costs the organiza-tion incurs in conducting activities for which the organization was created”* as distinct from fundraising and general and administrative expenditures.
At the same time, the smaller organizations record a greater proportion of expenditures on general and ad-ministrative purposes. It is unclear how much of this difference is due to economies of scale that allow the
General 9.9% 14.9% 20.5% 23.5% 22.4%
Fundraising 7.2% 10.1% 5.0% 4.4% 3.7%
Program 82.9% 75.0% 74.5% 72.1% 73.9%
EXPENDITURES
The analysis of expenditure patterns that follows shows variation by budget size as did the analysis of sources of income. It also shows dance to be mission-driven and labor-intensive across all budget ranges.
Functional Expenditures
State of NYC Dance
20
“I’m really interested in using all this data to create networks of small organizations. Often when I’m working on grants that take administrative hours that we don’t have, I think, wouldn’t it be great if we could get five organizations together to coauthor grants, save time and create something larger for the City of New York.” —Participant, Town Hall
*Source: CDP Section 6, General Instructions
largest organizations to spread administrative costs over a larger overall budget; the fact that smaller organizations rely more heavily on disparate sources of income, which is a strength, but understandably an administrative burden; or simply due to differences in reporting among different-size groups.
Functional Expenditures by Budget Size

State of NYC Dance
21
Expenditure Categories
The CDP expenditure section asks for information on forty-four different categories of expenditure. Some of the largest ones, such as “salaries and fringe benefits,” are analyzed separately here, but many others are lumped into broader categories: for instance, “legal services” and “accounting” are in the “outside professional ser-vices” category developed for this report, while “bank fees” and “office expenses” are in the “administration and finance” category. See the appendix for a complete listing of what CDP expenses are in each category analyzed in this section.
• Labor is the dominant expenditure for all budget ranges. However, the total share spent on labor is twice as great for organizations with budgets of more than $5M (62.2%) as it is for those with budgets from $25K to $99K (31.8%), and worker status varies significantly by budget size.
– Salaries and fringe benefits decrease sharply as a share of total expenditures as budget size decreases. Organizations in the largest budget category spend 59% of their aggregate budgets on salaries and fringe benefits, while those in the smallest budget range spend only 7.5% of their total expenditures on salaries and fringe benefits. – Nonsalaried workers payments increase as a share of total expenditures as budget size decreases, with the
largest budget ranges spending about 3% of expenditures on nonsalaried workers while the smallest spend 24.3% of their budgets on this category.
“The categories you have picked are the basic language for small busi-nesses. Boards want this information, so they can see where they fall and see how to grow.” —Participant, Town Hall
Tiffany Griffin, photo by CC Photography

State of NYC Dance
22
• Outside professional services rise unevenly as a share of expenditures as budget size decreases from 7.7% in the largest category to 18.4% in the smallest. • Facilities and equipment costs account for about 10% of total expenditures for groups with budget of $500K or more, and jump to 16.5% and 13.7% for the smaller organizations.
• Production costs account for a marginally higher share of expenditures for groups in the largest budget range than for their smaller counterparts.
• Travel costs are most significant in the $1M–$5M budget range, consistent with the high proportion of income derived from touring for this group.
• Administration expenditures increase steadily from 5.4% of expenditures for the largest groups to 21.4% for the smallest.
• Fundraising costs are relatively constant, fluctuating between 1.3% and 2.9% of total expenditures.
Salaries & Fringe Benefits
59.0% 52.7% 46.3% 33.2% 7.5%
Nonsalaried Workers 3.2% 3.0% 8.4% 14.4% 24.3%
Outside Professional Services
7.7% 11.1% 9.0% 10.9% 18.4%
Facilities & Equip-ment
10.5% 9.4% 9.9% 16.5% 13.7%
Production 7.0% 4.0% 5.0% 6.0% 5.0%
Travel & Hospitality 5.8% 11.7% 9.3% 7.8% 8.2%
Administration & Finance
5.4% 6.0% 9.5% 9.7% 21.4%
Fundraising Expens-es
1.3% 1.8% 2.9% 2.1% 1.5%
Expenditure Category*
*These categories are aggregated from more granular CDP categories. See the appendix for a complete listing.
Expenditures by Budget Size

State of NYC Dance
23
WORKFORCE
TotalsThe workforce in the dancemaking organizations studied numbers 1,783 full-time equivalents. Counting each full-time, part-time, independent contractor assignment and volunteer yields three and a half times this many jobs.
• Full-time employees account for 35% of workers. Less than half (47%) of these full-time employees are em-ployed as dancers, choreographers or other artists by the companies in the analytical base.
• Part-time employees (measured on a full-time equivalent basis) account for 40% of the workforce—62% of this segment are employed as artists. On average, part-time jobs are one-third of the hours of a full time job.
• Independent contractors (measured on a full-time equivalent basis) account for 14% of the workforce—57% of this group are employed as artists. On average, an independent contractor assignment is 13.9% of the hours of a full-time job—it would take more than seven assignments of this size to accumulate the hours of a full-time job.
• Volunteers (measured on a full-time equivalent basis) comprise 11% of the workforce—9% of them are work-ing as artists. One-quarter of this group are full-time volunteers. For the part-time volunteers, the average amount of time donated is about three and a half hours a week.
Dance Workforce
“Most artists 21–35 are working five jobs and only half of their income comes from the dance world.” —Dance/NYC Junior Committee Participant, Town Hall, on Junior Committee research

State of NYC Dance
24
Workforce by Budget Size
The employment status of the dancemaking workforce varies widely by organizational budget size.
• Full and part-time (fte) employees account for almost nine in ten (88.8%) of workers at organizations with budgets of more than $5M. This share of workers declines significantly to 81.0% for the $1M–$5M organizations, and 75.1% for the $500K–$999K organizations, then falls precipitously to 48.8% of the workers in the $100K–$499K groups and 5.5% of the workers in the $25K–$99K organizations.
The breakdown between full-time employees and part-time employees (measured as full-time equivalents), shows that the largest groups offer 40% to 60% of their workforce a full-time job, but for organizations with bud-gets of $500K–$999K, full-time employment accounts for about a quarter of the workforce (26.1%), falling to 20.0% for groups in the $100K–$499K range and only 2.1% in the $25K–$99K budget category.
Full-and Part-time (fte) as a Percentage of Workforce by Budget Size
Budget Range Full-time Part-time (fte)
> $5M 40.0% 48.8%
$1M-$5M 60.2% 20.8%
$500K-$999K 26.1% 49.0%
$100K-$499K 20.0% 28.8%
$25K-$99K 3.1% 2.3%
• Independent contractors are a small percentage of the work-force for the largest groups, accounting for 4.4% of the workforce on a full-time equivalent basis for groups with budgets of more than $5M. Their share of the workforce grows sharply to 10.7% of workers in the $1M–$5M budget range organizations, 21.5% in organizations with budgets of $500K–$999K, 39.5% in organizations with budgets of $100K–$499K and a solid majority, 73.1% of those working for organizations in the $25K–$100K budget category. In these smallest groups, seven in ten of these independent contractors are working as dancers or other artists.
• Volunteers comprise 6.8% of the largest organizations’ workers. Their share of the workforce vacillates as budget size decreases until it jumps dramatically to 21.5% of the workforce in organizations with budgets of $25K–$99K.

State of NYC Dance
Employees-full and part-time (fte)
88.8% 81.0% 75.1% 48.8% 5.4%
Independent contractors (fte)
4.4% 10.7% 21.5% 39.5% 73.1%
Volunteers-full and part-time (fte)
6.8% 8.3% 3.4% 11.7% 21.5%
“I’m an artist and a director, and I see myself in this [workforce data]—part-time work, volunteerism, independent contracting. The conditions are not unique to dance, to art, to the people in the United States. But labor is a primary issue, and this shows that people in the field suffer these conditions: they don’t have security; they don’t have time. This is an opportunity to critically reflect and to make arguments for something different.”—Participant, Town Hall
25
Worker Status by Budget Size

State of NYC Dance
Meryl Engelke, photo by CC Photography
Making the Case for NYC Dance
This last quote is placed here as a provocation and also to demonstrate the hopefulness and the quest for op-portunity that have surrounded preliminary discussions of these findings.
The analysis of CDP data helps us see the story of New York City dance—who, where, what, how and how much.
In the data, you can see the vitality and the promise of our industry even in a challenged climate. You can see how dance works as an economic engine, and as a contributor to and an ambassador for the City’s creative life. You can see the importance of public funding and the influence, even heroism, of concentrated founda-tion support. You can see similarities between dance and the wider cultural sector.
Particularly when looking at the smallest groups, you can see a strong start-up culture characterized by income diversity, use of in-kind resources and barter economies, and new creation—how alive entrepreneurship is in New York City dance.
Our dancemakers can, we hope, see their stories in the data. But the value of the research is not simply the stories it allows you to see but the stories it allows you to imagine for dance in our City. Where there is challenge, there is opportunity—from industry collaboration to new, high-impact investment.
As a foundation for individual and collective advocacy—a stronger voice for dance in New York City—this re-search has the potential to generate dialogue, creative problem solving and action.
Join us. Be the change you want to see in New York City dance.

APPENDIX - CDP DATA FIELDS
CDP Category State of Dance Category
Section 1 Organization Information
3 Legal name Name
12 County Borough
15 Federal ID Federal ID
16 Organization Type 501 ( C ) 3
17a NISP Discipline Discipline
25 # Board members # Board members
26 Year Founded Year Founded
27 Year Incorporated Year Incorporated
33 Fiscal Year End Date Fiscal Year End Date
Section 3 Revenue
Earned
1 Admissions Ticket Sales (Not on Tour)
2 Ticket Sales Ticket Sales (Not on Tour)
3 Tuitions Tuition/workshop
4 Workshop & Lecture Fees Tuition/workshop
5 Touring Fees Touring
6 Special Events - Non-fundraising Misc
7 Gift Shop/Merchandise Sales Misc
7a Gift Shop/Gallery Sales Null
8 Food Sales/Concession Revenue Misc
8a Parking Concessions Null
9 Membership Dues/Fees Misc
10 Subscriptions - Performance Subscriptions - NYC Ticket Sales
10a Subscriptions - Media Null
11 Contracted Services/Performance Fees Contracted Services/Performance Fees
12 Rental Income Misc
13 Royalties/Rights & Reproductions Null
14 Advertising Revenue Misc
15 Sponsorship Revenue Misc
16 Investments-Realized Gains/Losses Investments & Interest
17 Investments-Unrealized Gains/Losses Investments & Interest
18 Interest & Dividends Investments & Interest
19 Other Earned Revenue Misc
20 Total Earned Revenue Total Earned Revenue
Income from Operations =
Total Earned Revenue - Investments & Interest
State of NYC Dance
27
Support
21 Trustee/Board Contributions Board Member
22 Individual Contributions Individual
23 Corporate Contributions Corporate
24 Foundation Contributions Foundation
Total Private Contributions
25 Government - City New York City
26 Government - County County
27 Government - State New York State
28 Government - Federal Federal
Total Government Funding
28a Tribal Contributions Null
29 Special Events - Fundraising Fundraising Events - Private Contributions
30 Other Contributions Other - Private Contributions
30b Parent Organization Support Null
30c Related Organization Contributions Null
31 In-kind Contributions Other - Private Contributions
32 Net Assets Released from Restrictions Null
33 Total Support (Private and Government Support Not Aggregated)
34 Total Revenue Total Revenue
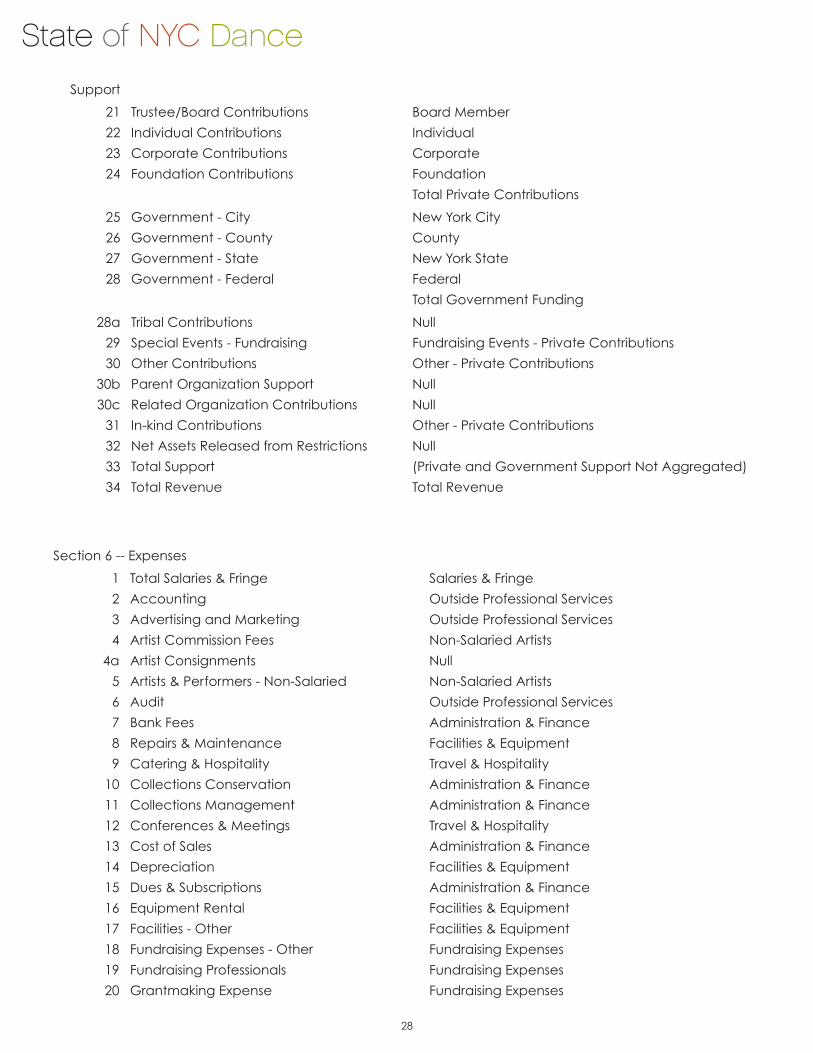
Section 6 -- Expenses
1 Total Salaries & Fringe Salaries & Fringe
2 Accounting Outside Professional Services
3 Advertising and Marketing Outside Professional Services
4 Artist Commission Fees Non-Salaried Artists
4a Artist Consignments Null
5 Artists & Performers - Non-Salaried Non-Salaried Artists
6 Audit Outside Professional Services
7 Bank Fees Administration & Finance
8 Repairs & Maintenance Facilities & Equipment
9 Catering & Hospitality Travel & Hospitality
10 Collections Conservation Administration & Finance
11 Collections Management Administration & Finance
12 Conferences & Meetings Travel & Hospitality
13 Cost of Sales Administration & Finance
14 Depreciation Facilities & Equipment
15 Dues & Subscriptions Administration & Finance
16 Equipment Rental Facilities & Equipment
17 Facilities - Other Facilities & Equipment
18 Fundraising Expenses - Other Fundraising Expenses
19 Fundraising Professionals Fundraising Expenses
20 Grantmaking Expense Fundraising Expenses
State of NYC Dance
28

21 Honoraria Non-Salaried Artists
22 In-Kind Contributions Included in Total, Not Patterns
23 Insurance Administration & Finance
24 Interest Expense Administration & Finance
25 Internet & Website Administration & Finance
26 Investment Fees Administration & Finance
27 Legal Fees Outside Professional Services
28 Lodging & Meals Travel & Hospitality
29 Major Repairs Facilities & Equipment
30 Office Expense - Other Administration & Finance
31 Other Administration & Finance
32 Postage & Shipping Administration & Finance
33 Printing Outside Professional Services
34 Production & Exhibition Costs Production
34a Programs - Other Production
35 Professional Development Outside Professional Services
36 Professional Fees - Other Outside Professional Services
37 Public Relations Outside Professional Services
38 Rent Facilities & Equipment
38a Recording & Broadcast Costs Null
38b Royalties/Rights & Reproductions Non-Salaried Artists
39 Sales Commission Fees Non-Salaried Artists
39a Security Null
40 Supplies - Office & Other Facilities & Equipment
41 Telephone Administration & Finance
42 Touring Travel & Hospitality
43 Travel Travel & Hospitality
44 Utilities Facilities & Equipment
45 Total Expenses - Program Total Program Expenditures
Total Expenses - Fundraising Total Fundraising Expenditures
Total Expenses - General Total General Expenditures
Total Expenses Total Expenditures
46 Change in Net Assets Change in Net Assets
Section 11 -- Non Financial Information
A - Number of Contributors
A1 Individuals Individuals
A2 Board Board
A3 Corporate Corporate
A4 Foundation Foundation
C -- Attendance (number of people)
C1 Total Paid Attendance Total Paid Attendance
State of NYC Dance
29

C2 Total Free Attendance Total Free Attendance
C6 Attendance-Classes/Workshops Attendance - Classes/Workshops
G - Program Activity (number of events)
G2 Public Performanaces - At Home Public Performanaces - At Home
G3 Public Performanaces - Away (On Tour) Public Performanaces - Away (On Tour)
G6 Educational Classes/Workshops - Public Educational Classes/Workshops - Public
G7 Educational Classes/Workshops - Professional Educational Classes/Workshops - Professional
G12 World Premieres World Premieres
G13 National Premieres National Premieres
G14 Local Premieres Local Premieres
G15 Works Commisioned Works Commisioned
G16 Workshops or Readings of New Works Workshops or Readings of New Works
I - Staff and Non-Staff Statistics
I1 Full-time Permanent Employees Full-time Permanent Employees
Full-time Permanent Employees - Artists Full-time Permanent Employees - Artists
I2 Part-time/Seasonal Employees Part-time/Seasonal Employees
Part-time/Seasonal Employees - Artists Part-time/Seasonal Employees - Artists
I3 Part-time/Seasonal Employees - FTEs Part-time/Seasonal Employees - FTEs
Part-time/Seasonal Employees - FTEs - Artists Part-time/Seasonal Employees - FTEs - Artists
I4 Full-time Volunteers Full-time Volunteers
Full-time Volunteers - Artists Full-time Volunteers - Artists
I5 Part-time Volunteers Part-time Volunteers
Part-time Volunteers - Artists Part-time Volunteers - Artists
I6 Part-time Volunteers - FTEs Part-time Volunteers - FTEs
Part-time Volunteers - FTEs - Artists Part-time Volunteers - FTEs - Artists
I7 Independent Contractors Independent Contractors
Independent Contractors - Artists Independent Contractors - Artists
I8 Independent Contractors - FTEs Independent Contractors - FTEs
Independent Contractors - FTEs - Artists Independent Contractors - FTEs - Artists
State of NYC Dance
30