State of NewYork
28
ALAN G. HEVESI STATE COMPTROLLER State of New York FINANCIAL CONDITION REPORT FOR FISCAL YEAR ENDED MARCH 31, 2005 2005
Transcript of State of NewYork
ALAN G. HEVESI STATE COMPTROLLER
State of
NewYorkF INANC IAL CONDI T ION R E PO R T
FOR FISCAL YEAR ENDED MARCH 31, 2005
2005
For a copy of the Comprehensive Annual Financial Report or additional copies of this report contact:
Comptroller’s Office of Public Information
110 State Street, 15th FloorAlbany, New York 12236
(518) 474-4015
e-mail: [email protected]
This report and the Comprehensive Annual Financial Report may also be obtained inAdobe Acrobat format from the Comptroller’s Office web site at www.osc.state.ny.us
To be removed from our mailing list:
In an effort to reduce the costs of printing, if you would like to have your name removed from our mailing listor if your present address has changed, contact the Comptroller’s Office of Public Information at
(518) 474-4015 or at the Office of the State Comptroller, 110 State Street, 15th Floor, Albany, NY 12236
or by e-mail, [email protected]
This report, or any portion thereof, may be reproduced without permission.
2005 COMPTROLLER ’S REPORT ON THE F INANC IAL CONDI T ION
OF NEW YORK STATEFOR FISCAL YEAR ENDED MARCH 31, 2005
OFF ICE OF THE STATE COMPTROLLER • ALAN G. HEVES I
2005 F INANCIAL CONDIT ION REPORT
CONTENTS
Message from the Comptroller 3
Government-Wide Financial Data 4
Fund Financial Data 5
Total Revenues 6
Total Spending 7
Medicaid 8
Education 9
Economic/Demographic Trends 10-12
Taxes: Where New York Stands 13
Debt 14-15
Capital 16
Roads and Bridges 17
Local Governments 18-19
Implications for the Future 20-21
New York’s Public Authorities 22
Appendix 1: State Funds Spending by Major Service Function 23
Appendix 2: Federal Funds Spending by Major Service Function 24
Appendix 3: State Revenues by Major Source 25
2 OFFICE OF THE STATE COMPTROLLER • ALAN G. HEVESI
COMPTROLLER’S 2005REPORT ON THEFINANCIAL CONDITIONOF NEW YORK STATE
This report provides citizens with an overview of thefinancial condition of New York State. It presents selectedfinancial, economic, and demographic information in aneasy-to-understand format.
It also presents basic information on trends in Statereceipts (revenues) and spending, the State’s financial position as measured by Generally Accepted AccountingPrinciples (GAAP), and selected economic and demographictrends affecting the State. It fills an information need not metby the traditional, more detailed financial reports issued bythe Comptroller’s Office, but it is not meant to replace them.Detailed accounting data continues to be provided in reportssuch as the Comprehensive Annual Financial Report.
Financial condition is a broad concept aimed at assessingthe ability of a government to meet future financial andservice obligations. It deals with the State’s ability to deliveracceptable levels of services at acceptable levels of taxation,while achieving budget balance and making required debtservice payments and pension contributions.
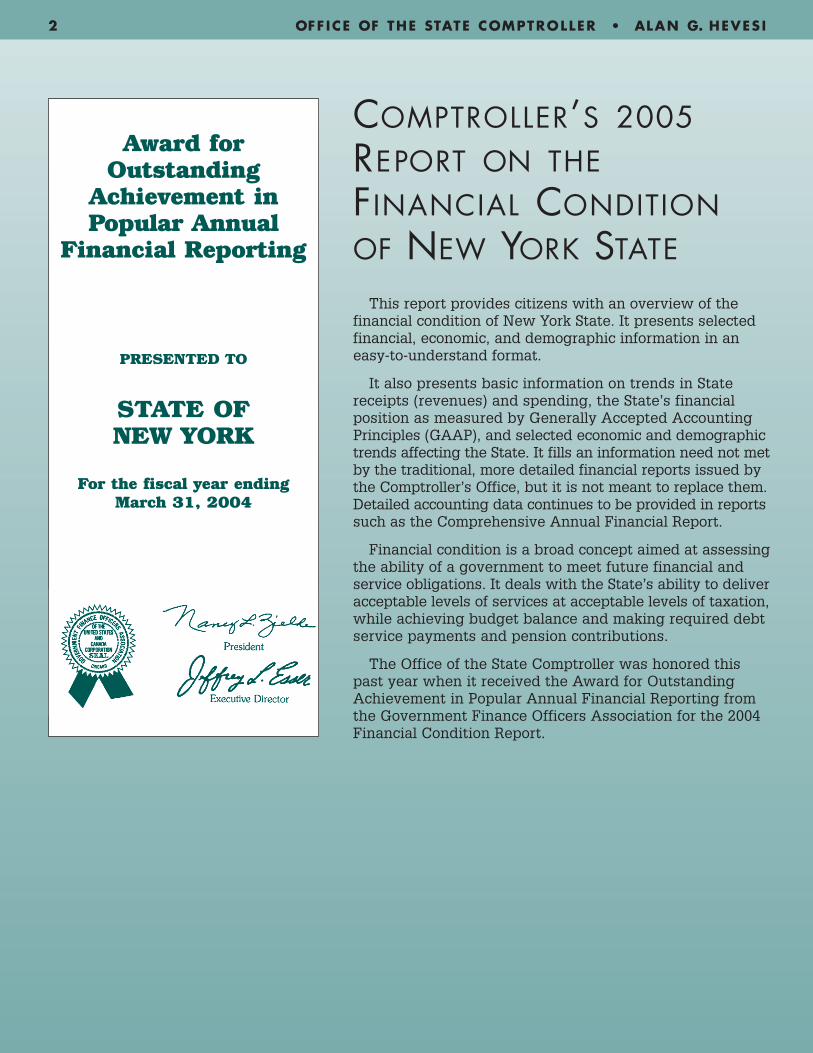
The Office of the State Comptroller was honored thispast year when it received the Award for OutstandingAchievement in Popular Annual Financial Reporting fromthe Government Finance Officers Association for the 2004Financial Condition Report.
Award forOutstanding
Achievement inPopular Annual
Financial Reporting
PRESENTED TO
STATE OF NEW YORK
For the fiscal year endingMarch 31, 2004
MESSAGE FROM THECOMPTROLLER
I am pleased to present the Financial Condition Report forthe State of New York for the fiscal year ending March 31, 2005.
Last fiscal year, the process by which the budget was con-structed improved immeasurably. The budget was passed in atimely fashion, and more legislators were involved in craftingthe final product. The commitment by all parties to cooperateand work together brought New Yorkers their first on-timebudget in a generation.
While an on-time budget sends a positive signal to the ratingagencies and the public that the State’s budget process isimproving, a sound, responsible fiscal policy must be theGovernor’s and Legislature’s top priority. Unfortunately, thereremains a fundamental and persistent deficiency in New York’sbudgeting practices that threatens the State’s fiscal stability inthe future, and that is the State’s over-reliance on debt.
The enacted budget increased New York State’s total outstanding debt by $1.9 billion over last year’s levelfor total debt of approximately $48 billion. By the end of the new five-year capital plan in 2009-10, the Statewill have more than $55 billion in outstanding debt, representing a 52 percent increase from 2000 and a 287percent increase from 1990. By 2009-10, the State will pay nearly $6 billion annually in debt service, reflectinga $1.7 billion or 42 percent increase from 2004-05.
When used correctly, debt is an essential tool for financing public projects. However, when it is used tomask spending growth, delay difficult choices or shift burdens to future generations of taxpayers, it weakensthe State’s fiscal foundation. Acquiring more debt rather than instituting long-term planning for projectsweakens the State’s finances for the future when our infrastructure will be older and in need of greaterrepair and when new technologies may require completely new investments to keep the New York economycompetitive.
Too often, the State has used long-term debt to finance budget deficits and operating costs with no planto ensure that the debt burden created will leave future generations with sufficient borrowing capacity toboth finance their capital needs and repay the debts created by the restructuring. But there are signs thatimprovements are possible.
This year, the Governor and Legislature instituted two borrowing plans. The first one, a $2.9 billion bondact, will be on the ballot and will allow the taxpayers to determine whether they want to incur the debt andwhether the projects are worthwhile. The second project involved a $2.9 billion restructuring of ThruwayAuthority bonds that would have added $460 million of costs to future taxpayers. My office blocked the latterdeal and renegotiated the proposal to provide one that did not increase costs. My office will continue to workto ensure that borrowing is fair, affordable and equitable.
Another positive step in the enacted budget this year is that spending done through the Health CareReform Act, known as HCRA, was put on budget for the first time. This helps improve transparency and willallow taxpayers to see a fuller scope of the State’s obligations.
Clearly there remains more work to be done to improve fiscal accountability, but improvements have beenmade that will benefit current and future taxpayers. It took many years for the State to develop unhealthyfiscal practices, and it will take some time to institute all the reforms needed to put our fiscal house in order.As evident in the accomplishments achieved this past year, the momentum for reform has begun. We mustcontinue to strive for additional reforms and be hopeful that improvements in the State’s financial practiceswill continue into the future.
2005 F INANCIAL CONDIT ION REPORT 3
ALAN G. HEVESISTATE COMPTROLLER
GOVERNMENT-WIDE FINANCIAL DATA
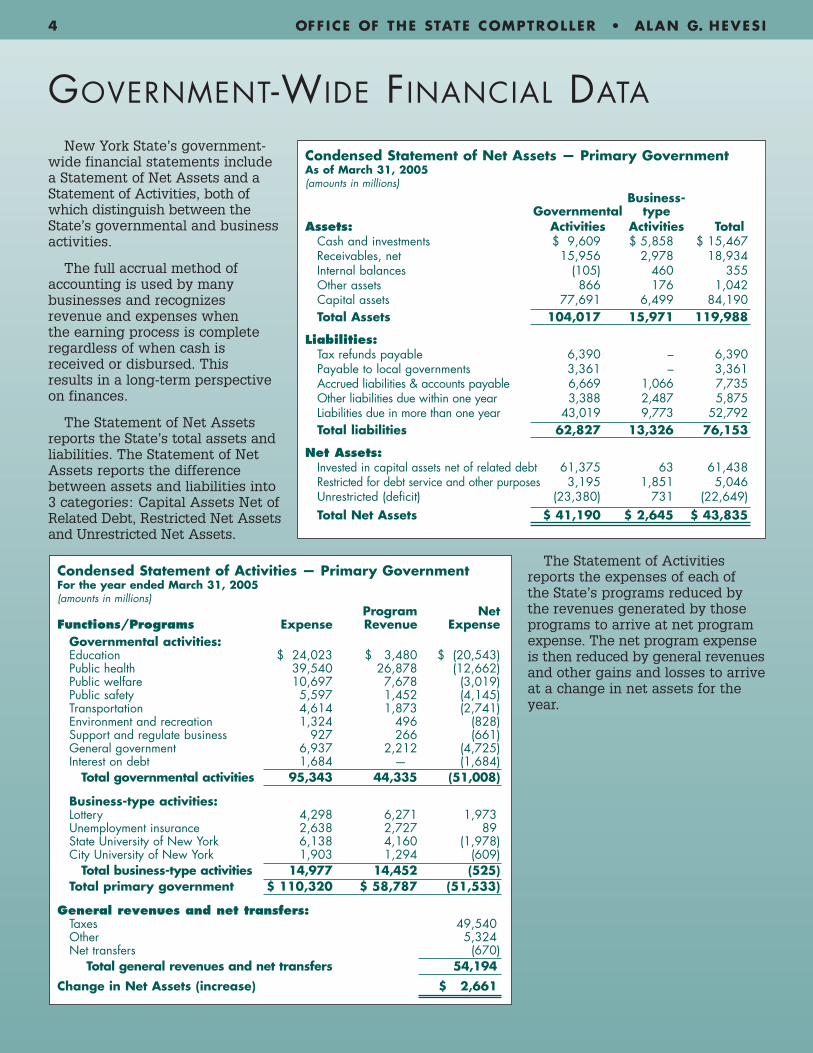
New York State’s government-wide financial statements includea Statement of Net Assets and aStatement of Activities, both ofwhich distinguish between theState’s governmental and businessactivities.
The full accrual method ofaccounting is used by many businesses and recognizes revenue and expenses when the earning process is completeregardless of when cash isreceived or disbursed. This results in a long-term perspectiveon finances.
The Statement of Net Assetsreports the State’s total assets andliabilities. The Statement of NetAssets reports the differencebetween assets and liabilities into3 categories: Capital Assets Net ofRelated Debt, Restricted Net Assetsand Unrestricted Net Assets.
The Statement of Activitiesreports the expenses of each of the State’s programs reduced bythe revenues generated by those programs to arrive at net programexpense. The net program expenseis then reduced by general revenuesand other gains and losses to arriveat a change in net assets for theyear.
4 OFFICE OF THE STATE COMPTROLLER • ALAN G. HEVESI
Condensed Statement of Net Assets — Primary GovernmentAs of March 31, 2005(amounts in millions)
Business-Governmental type
Assets: Activities Activities TotalCash and investments $ 9,609 $ 5,858 $ 15,467 Receivables, net 15,956 2,978 18,934 Internal balances (105) 460 355 Other assets 866 176 1,042 Capital assets 77,691 6,499 84,190 Total Assets 104,017 15,971 119,988
Liabilities:Tax refunds payable 6,390 – 6,390 Payable to local governments 3,361 – 3,361 Accrued liabilities & accounts payable 6,669 1,066 7,735 Other liabilities due within one year 3,388 2,487 5,875 Liabilities due in more than one year 43,019 9,773 52,792 Total liabilities 62,827 13,326 76,153
Net Assets:Invested in capital assets net of related debt 61,375 63 61,438 Restricted for debt service and other purposes 3,195 1,851 5,046 Unrestricted (deficit) (23,380) 731 (22,649)Total Net Assets $ 41,190 $ 2,645 $ 43,835
Condensed Statement of Activities — Primary GovernmentFor the year ended March 31, 2005(amounts in millions)
Program NetFunctions/Programs Expense Revenue Expense
Governmental activities:Education $ 24,023 $ 3,480 $ (20,543)Public health 39,540 26,878 (12,662)Public welfare 10,697 7,678 (3,019)Public safety 5,597 1,452 (4,145)Transportation 4,614 1,873 (2,741)Environment and recreation 1,324 496 (828)Support and regulate business 927 266 (661)General government 6,937 2,212 (4,725)Interest on debt 1,684 — (1,684)
Total governmental activities 95,343 44,335 (51,008)
Business-type activities:Lottery 4,298 6,271 1,973 Unemployment insurance 2,638 2,727 89State University of New York 6,138 4,160 (1,978)City University of New York 1,903 1,294 (609)
Total business-type activities 14,977 14,452 (525)Total primary government $ 110,320 $ 58,787 (51,533)
General revenues and net transfers:Taxes 49,540 Other 5,324 Net transfers (670)
Total general revenues and net transfers 54,194
Change in Net Assets (increase) $ 2,661
FUND FINANCIAL DATA
■ The State also prepares fund financial statements.Funds present sources of funding and spending forparticular purposes. The General Fund is used toreport sources of funds and expenditures that arenot required to be accounted for in another sepa-rate fund. In New York, significant sources offunds that normally would be reported in theGeneral Fund have been pledged or dedicated toother funds for repayment of debt or project fund-ing and are therefore reported in other governmen-tal funds.
■ Fund financial statements provide a short-termview of government finances. Thus, payment offund expenditures with proceeds from long-termborrowing will not have any impact on the fundbalance because the liability to repay the borrow-ing is not reported in the fund.
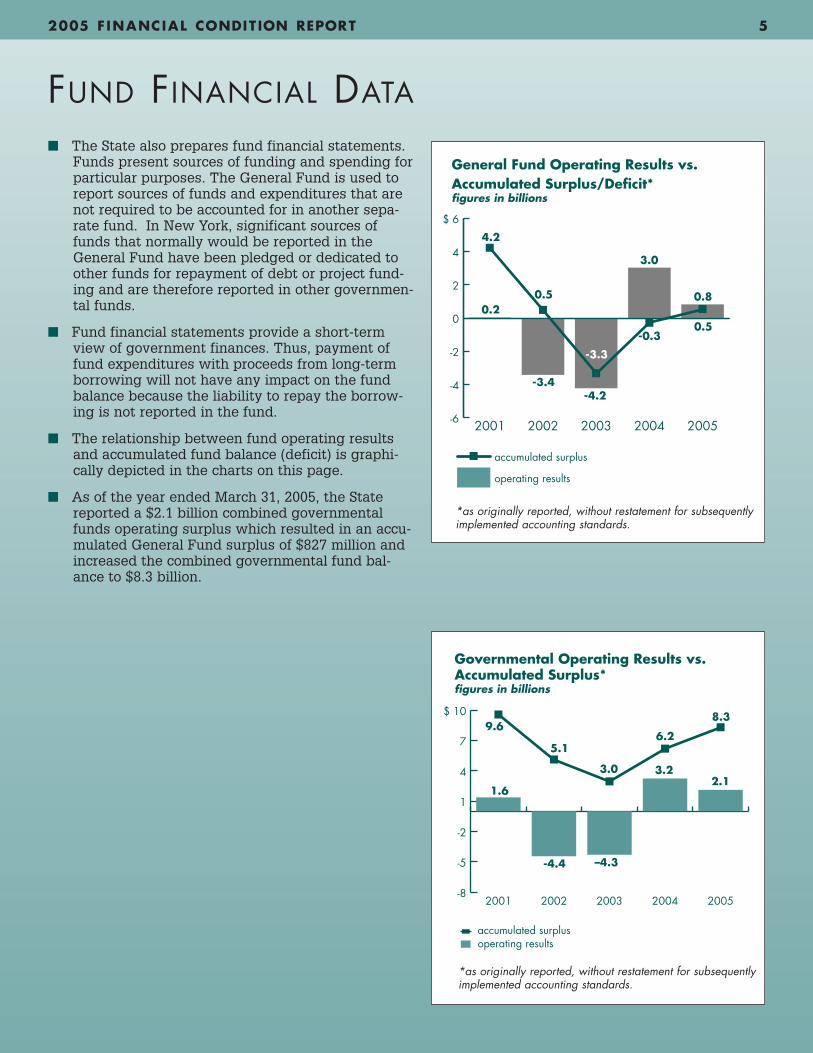
■ The relationship between fund operating resultsand accumulated fund balance (deficit) is graphi-cally depicted in the charts on this page.
■ As of the year ended March 31, 2005, the Statereported a $2.1 billion combined governmentalfunds operating surplus which resulted in an accu-mulated General Fund surplus of $827 million andincreased the combined governmental fund bal-ance to $8.3 billion.
2005 F INANCIAL CONDIT ION REPORT 5
Governmental Operating Results vs.Accumulated Surplus*figures in billions
accumulated surplusoperating results
-8
-5
-2
1
4
7
$ 10
20052004200320022001
2.1
8.3
1.6
9.6
-4.4
5.1
–4.3
3.0 3.2
6.2
operating results
20052004200320022001-6
-4
-2
0
2
4
$ 6
accumulated surplus
General Fund Operating Results vs.Accumulated Surplus/Deficit*figures in billions
4.2
0.5
-4.2
-0.30.5
0.2
-3.4
-3.3
3.0
0.8
*as originally reported, without restatement for subsequentlyimplemented accounting standards.
*as originally reported, without restatement for subsequentlyimplemented accounting standards.

6 OFFICE OF THE STATE COMPTROLLER • ALAN G. HEVESI
TOTAL REVENUES
Revenues are affected by eco-nomic changes and changes in fed-eral and State policies. Tax base isa measure of the State’s ability togenerate revenue. A decreasing taxbase may force spending reductions,additional borrowing, and/orincreased taxes. Appendix 3 con-tains State revenues by majorsource for the past five fiscal years.
■ Revenues have increased $19.5billion (23.9%) since 2001 whilepersonal income has grown at arate of 10.9%.
■ In 2005, total tax revenues of$48.5 billion represented a 8.7%increase over 2001 tax revenues.
■ Revenues from the Federal government increased 40.5% since 2001. Medicaid was responsible for thelargest increase in federal revenues.
■ Personal income tax and con-sumer taxes and fees accountedfor 40.6% of 2005 revenues, andhave increased 9.2% since 2001.
■ During fiscal year 2005, theState experienced a 14.1%increase in personal income tax(PIT) revenues — its largestrevenue source. This followed a1.5% increase in 2004.
0
5
10
15
20
25
$30Other Taxes
Business Taxes
Consumer Taxes and Fees
Personal Income Tax**
20052004200320022001
Tax Revenues by Yearfigures in billions*
* figures rounded to the nearest 1/10th of a billion** includes Refund Reserve Transactions
26.9
10.7
5.8
1.2
27.4
10.5
5.2
1.2
23.7
10.8
5.0
1.2
24.1
12.0
5.0
1.3
28.0
13.0
5.8
1.7
Borrowings
Business Tax
Personal Income Tax
Misc. & Lottery
Federal
Other Taxes
Consumer Taxes/Fees
New York’s 2005 Revenue Sources2.1%
5.7% 12.9%
27.7%
35.8%
1.6%
14.2%
0
20
40
60
80
100
$120
Borrowings
Misc
Federal
Taxes
20052004200320022001
Total State Revenuesfigures in billions
81.7 83.8 88.799.5 101.2
In 2005 PersonalIncome Taxes and
Consumer Taxes andFees were 40.6% of
State Revenue
2005 F INANCIAL CONDIT ION REPORT 7
TOTAL SPENDING
Spending data can be used to evaluate the State’s pro-gram priorities and, compared to revenue data, can beused to measure the State’s ability to support continuingprograms. Appendices 1 and 2 show a history of Statespending by major program for the past five fiscal years.
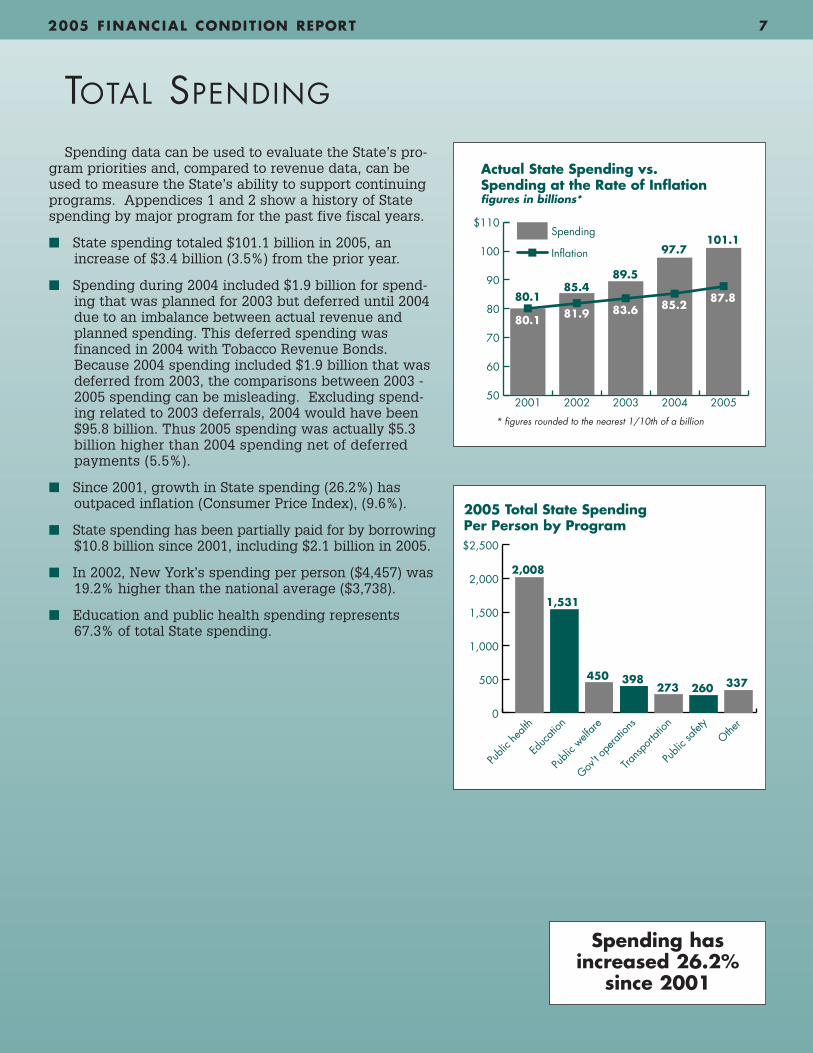
■ State spending totaled $101.1 billion in 2005, anincrease of $3.4 billion (3.5%) from the prior year.
■ Spending during 2004 included $1.9 billion for spend-ing that was planned for 2003 but deferred until 2004due to an imbalance between actual revenue andplanned spending. This deferred spending wasfinanced in 2004 with Tobacco Revenue Bonds.Because 2004 spending included $1.9 billion that wasdeferred from 2003, the comparisons between 2003 -2005 spending can be misleading. Excluding spend-ing related to 2003 deferrals, 2004 would have been$95.8 billion. Thus 2005 spending was actually $5.3billion higher than 2004 spending net of deferredpayments (5.5%).
■ Since 2001, growth in State spending (26.2%) has outpaced inflation (Consumer Price Index), (9.6%).
■ State spending has been partially paid for by borrowing$10.8 billion since 2001, including $2.1 billion in 2005.
■ In 2002, New York’s spending per person ($4,457) was19.2% higher than the national average ($3,738).
■ Education and public health spending represents67.3% of total State spending.
Spending
2005200420032002200150
60
70
80
90
100
$110
Inflation
Actual State Spending vs.Spending at the Rate of Inflationfigures in billions*
80.1
80.1
85.4
81.9
89.5
83.6
97.7
85.2
101.1
87.8
* figures rounded to the nearest 1/10th of a billion
0
500
1,000
1,500
2,000
$2,500
2,008
1,531
450 398273 260 337
Publi
c hea
lth
Publi
c welf
are
Gov't o
perat
ions
Trans
porta
tion
Publi
c safe
ty
Educ
ation
Other
2005 Total State SpendingPer Person by Program
Spending hasincreased 26.2%
since 2001
8 OFFICE OF THE STATE COMPTROLLER • ALAN G. HEVESI
MEDICAID
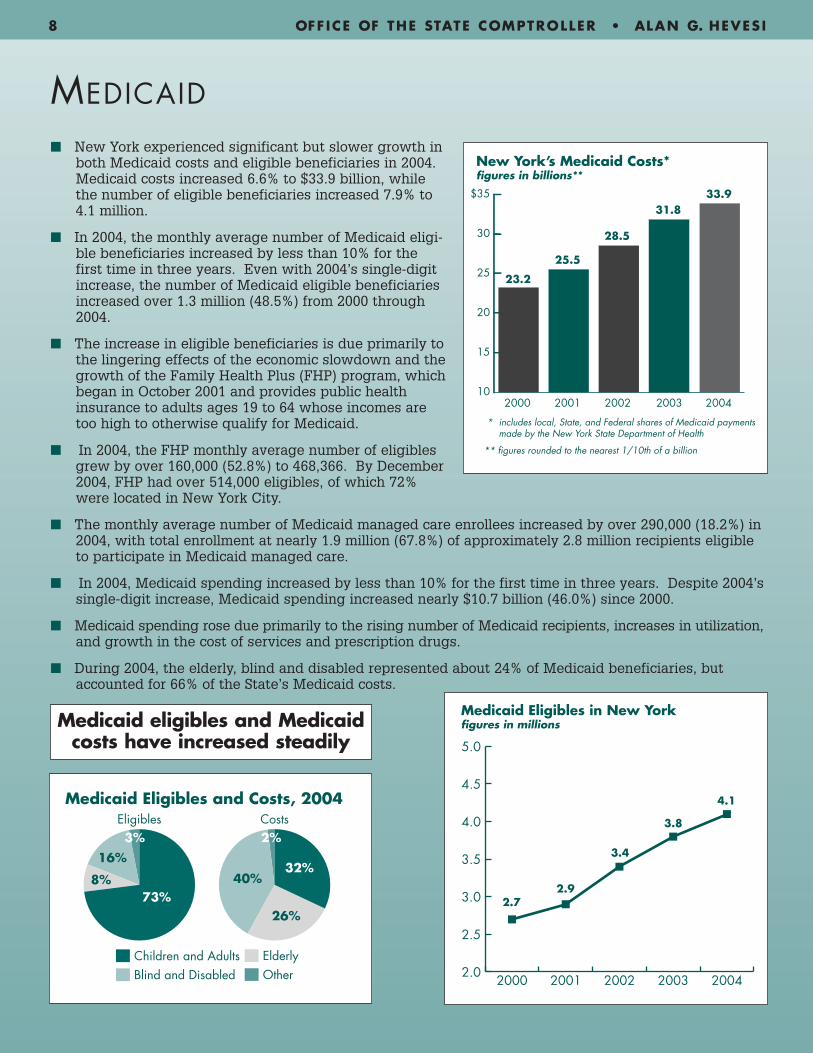
■ New York experienced significant but slower growth inboth Medicaid costs and eligible beneficiaries in 2004.Medicaid costs increased 6.6% to $33.9 billion, whilethe number of eligible beneficiaries increased 7.9% to4.1 million.
■ In 2004, the monthly average number of Medicaid eligi-ble beneficiaries increased by less than 10% for thefirst time in three years. Even with 2004’s single-digitincrease, the number of Medicaid eligible beneficiariesincreased over 1.3 million (48.5%) from 2000 through2004.
■ The increase in eligible beneficiaries is due primarily tothe lingering effects of the economic slowdown and thegrowth of the Family Health Plus (FHP) program, whichbegan in October 2001 and provides public healthinsurance to adults ages 19 to 64 whose incomes aretoo high to otherwise qualify for Medicaid.
■ In 2004, the FHP monthly average number of eligiblesgrew by over 160,000 (52.8%) to 468,366. By December2004, FHP had over 514,000 eligibles, of which 72%were located in New York City.
■ The monthly average number of Medicaid managed care enrollees increased by over 290,000 (18.2%) in2004, with total enrollment at nearly 1.9 million (67.8%) of approximately 2.8 million recipients eligibleto participate in Medicaid managed care.
■ In 2004, Medicaid spending increased by less than 10% for the first time in three years. Despite 2004’ssingle-digit increase, Medicaid spending increased nearly $10.7 billion (46.0%) since 2000.
■ Medicaid spending rose due primarily to the rising number of Medicaid recipients, increases in utilization,and growth in the cost of services and prescription drugs.
■ During 2004, the elderly, blind and disabled represented about 24% of Medicaid beneficiaries, butaccounted for 66% of the State’s Medicaid costs.
2.0
2.5
3.0
3.5
4.0
4.5
5.0
20042003200220012000
Medicaid Eligibles in New Yorkfigures in millions
2.72.9
4.1
3.8
3.4
10
15
20
25
30
$35
2003200220012000 2004
31.8
28.5
33.9
23.2
25.5
New York’s Medicaid Costs*figures in billions**
* includes local, State, and Federal shares of Medicaid payments made by the New York State Department of Health
** figures rounded to the nearest 1/10th of a billion
OtherBlind and DisabledElderlyChildren and Adults
CostsEligiblesMedicaid Eligibles and Costs, 2004
73%8%
16%
3%
32%40%
26%
2%
Medicaid eligibles and Medicaidcosts have increased steadily
2005 F INANCIAL CONDIT ION REPORT 9
EDUCATION
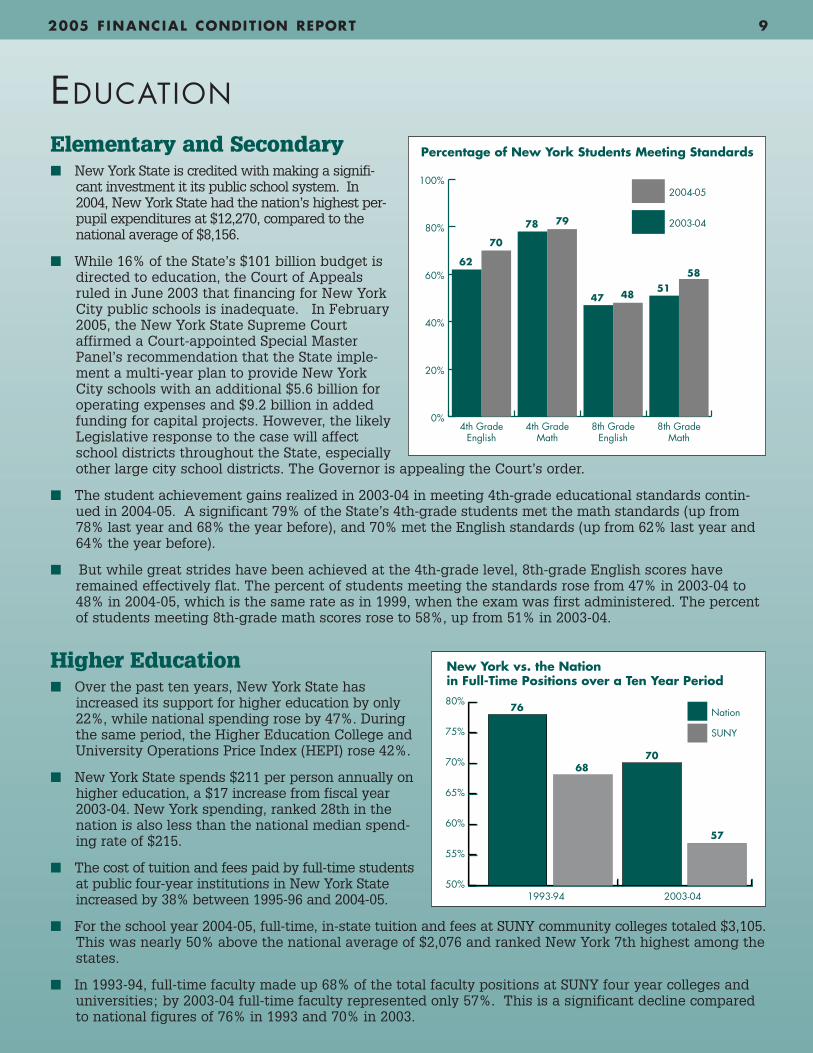
Elementary and Secondary■ New York State is credited with making a signifi-
cant investment it its public school system. In2004, New York State had the nation’s highest per-pupil expenditures at $12,270, compared to thenational average of $8,156.
■ While 16% of the State’s $101 billion budget isdirected to education, the Court of Appealsruled in June 2003 that financing for New YorkCity public schools is inadequate. In February2005, the New York State Supreme Courtaffirmed a Court-appointed Special MasterPanel’s recommendation that the State imple-ment a multi-year plan to provide New YorkCity schools with an additional $5.6 billion foroperating expenses and $9.2 billion in addedfunding for capital projects. However, the likelyLegislative response to the case will affectschool districts throughout the State, especiallyother large city school districts. The Governor is appealing the Court’s order.
■ The student achievement gains realized in 2003-04 in meeting 4th-grade educational standards contin-ued in 2004-05. A significant 79% of the State’s 4th-grade students met the math standards (up from78% last year and 68% the year before), and 70% met the English standards (up from 62% last year and64% the year before).
■ But while great strides have been achieved at the 4th-grade level, 8th-grade English scores haveremained effectively flat. The percent of students meeting the standards rose from 47% in 2003-04 to48% in 2004-05, which is the same rate as in 1999, when the exam was first administered. The percentof students meeting 8th-grade math scores rose to 58%, up from 51% in 2003-04.
Higher Education■ Over the past ten years, New York State has
increased its support for higher education by only22%, while national spending rose by 47%. Duringthe same period, the Higher Education College andUniversity Operations Price Index (HEPI) rose 42%.
■ New York State spends $211 per person annually onhigher education, a $17 increase from fiscal year2003-04. New York spending, ranked 28th in thenation is also less than the national median spend-ing rate of $215.
■ The cost of tuition and fees paid by full-time studentsat public four-year institutions in New York Stateincreased by 38% between 1995-96 and 2004-05.
■ For the school year 2004-05, full-time, in-state tuition and fees at SUNY community colleges totaled $3,105.This was nearly 50% above the national average of $2,076 and ranked New York 7th highest among thestates.
■ In 1993-94, full-time faculty made up 68% of the total faculty positions at SUNY four year colleges anduniversities; by 2003-04 full-time faculty represented only 57%. This is a significant decline comparedto national figures of 76% in 1993 and 70% in 2003.
0%
20%
40%
60%
80%
100%2004-05
2003-04
8th GradeMath
8th GradeEnglish
4th GradeMath
4th GradeEnglish
Percentage of New York Students Meeting Standards
62
78 79
70
47 4851
58
50%
55%
60%
65%
70%
75%
80%76
6870
57
SUNY
Nation
1993-94 2003-04
New York vs. the Nationin Full-Time Positions over a Ten Year Period
ECONOMIC/DEMOGRAPHIC TRENDS
Economic and demographic trends impact funding received from the Federal government and indicatewhether renewed attention is needed in State programs for the elderly, economic development, education,and income assistance.
■ New York State’s population has continued to grow,increasing by 1.3% between 2000 and 2004. Between1980 and 2000, the State’s population increased 8.4%,after having declined during the 1970s. The nation’spopulation, however, has increased at a faster rate,growing by 4.3% between 2000 and 2004 and by 24%during the two previous decades.
■ Over 42% of the State’s population resides in theCity of New York. Between 2000 and 2004, theCity’s population increased by 1.2%. During the1990s, New York City’s population grew by a rapid9.3%, after only modest gains during the 1980s anda significant drop during the 1970s.
■ New York State’s population has become morediverse as gains in minority groups-either throughimmigration or births-have fueled much of the State’spopulation increase during the 1990s and 2000s.Mirroring national trends, the Hispanic and Latinopopulation has experienced very strong growth dur-ing this period, raising its share of the State’s popu-lation to 16.3% in 2003 from 12.3% in 1990.
■ Between 2000 and 2004, 38% of the State’s popula-tion increase occurred in New York City, while thedownstate suburbs and the Hudson Valley account-ed for another 54% of the State’s population increase. By comparison, New York City accounted for 70%of the State’s population increase during the 1990s. When combined with the gains in the suburbs thatsurround the City and the Hudson Valley, the downstate region was responsible for virtually all of theState’s job growth during that decade.
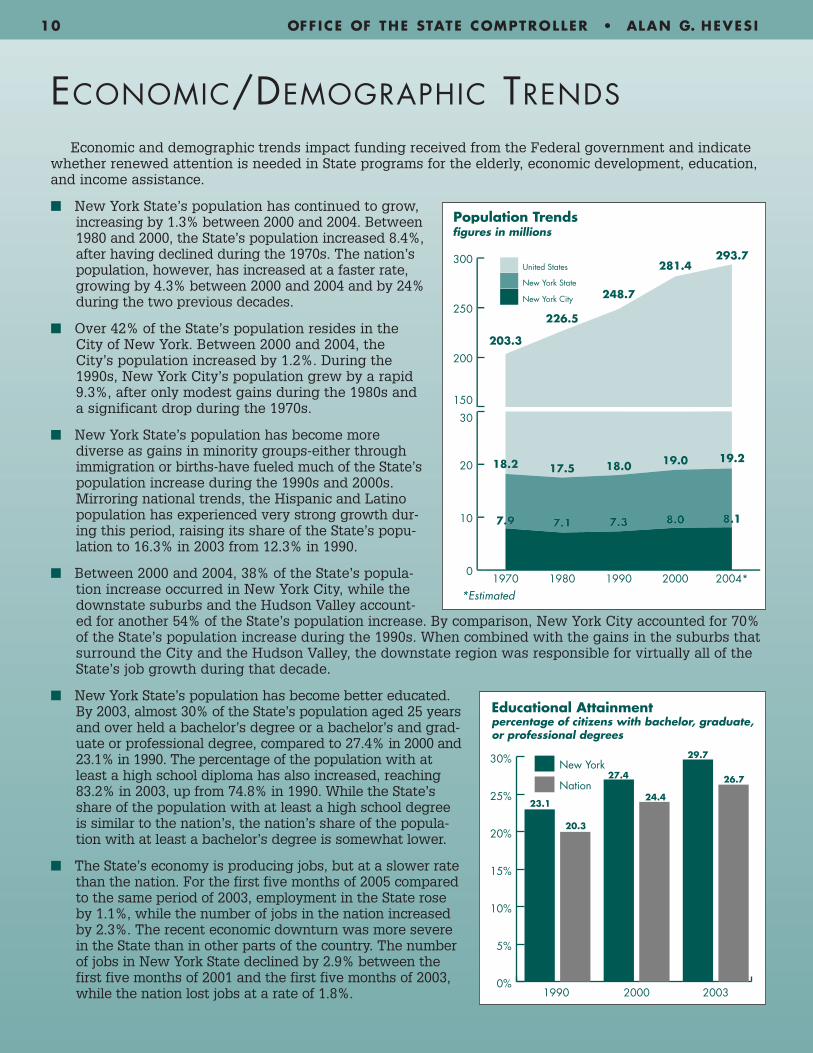
■ New York State’s population has become better educated.By 2003, almost 30% of the State’s population aged 25 yearsand over held a bachelor’s degree or a bachelor’s and grad-uate or professional degree, compared to 27.4% in 2000 and23.1% in 1990. The percentage of the population with atleast a high school diploma has also increased, reaching83.2% in 2003, up from 74.8% in 1990. While the State’sshare of the population with at least a high school degreeis similar to the nation’s, the nation’s share of the popula-tion with at least a bachelor’s degree is somewhat lower.
■ The State’s economy is producing jobs, but at a slower ratethan the nation. For the first five months of 2005 comparedto the same period of 2003, employment in the State roseby 1.1%, while the number of jobs in the nation increasedby 2.3%. The recent economic downturn was more severein the State than in other parts of the country. The numberof jobs in New York State declined by 2.9% between thefirst five months of 2001 and the first five months of 2003,while the nation lost jobs at a rate of 1.8%.
figures in millions
0%
5%
10%
15%
20%
25%
30%
Nation
New York
2000 20031990
Educational Attainmentpercentage of citizens with bachelor, graduate,or professional degrees
23.1
20.3
27.4
24.4
29.7
26.7
10 OFFICE OF THE STATE COMPTROLLER • ALAN G. HEVESI
*Estimated
2005 F INANCIAL CONDIT ION REPORT 11
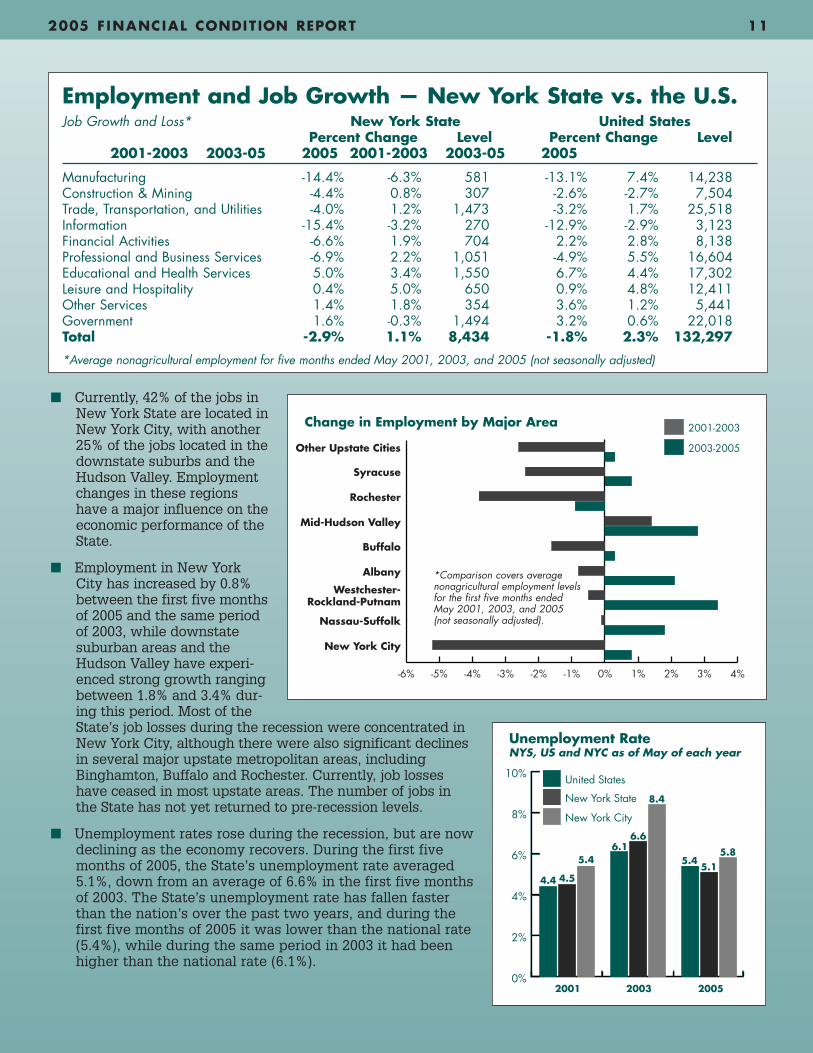
■ Currently, 42% of the jobs inNew York State are located inNew York City, with another25% of the jobs located in thedownstate suburbs and theHudson Valley. Employmentchanges in these regionshave a major influence on theeconomic performance of theState.
■ Employment in New YorkCity has increased by 0.8%between the first five monthsof 2005 and the same periodof 2003, while downstatesuburban areas and theHudson Valley have experi-enced strong growth rangingbetween 1.8% and 3.4% dur-ing this period. Most of theState’s job losses during the recession were concentrated inNew York City, although there were also significant declinesin several major upstate metropolitan areas, includingBinghamton, Buffalo and Rochester. Currently, job losseshave ceased in most upstate areas. The number of jobs inthe State has not yet returned to pre-recession levels.
■ Unemployment rates rose during the recession, but are nowdeclining as the economy recovers. During the first fivemonths of 2005, the State’s unemployment rate averaged5.1%, down from an average of 6.6% in the first five monthsof 2003. The State’s unemployment rate has fallen fasterthan the nation’s over the past two years, and during thefirst five months of 2005 it was lower than the national rate(5.4%), while during the same period in 2003 it had beenhigher than the national rate (6.1%).
Employment and Job Growth — New York State vs. the U.S.Job Growth and Loss* New York State United States
Percent Change Level Percent Change Level2001-2003 2003-05 2005 2001-2003 2003-05 2005
Manufacturing -14.4% -6.3% 581 -13.1% 7.4% 14,238Construction & Mining -4.4% 0.8% 307 -2.6% -2.7% 7,504Trade, Transportation, and Utilities -4.0% 1.2% 1,473 -3.2% 1.7% 25,518Information -15.4% -3.2% 270 -12.9% -2.9% 3,123Financial Activities -6.6% 1.9% 704 2.2% 2.8% 8,138Professional and Business Services -6.9% 2.2% 1,051 -4.9% 5.5% 16,604Educational and Health Services 5.0% 3.4% 1,550 6.7% 4.4% 17,302Leisure and Hospitality 0.4% 5.0% 650 0.9% 4.8% 12,411Other Services 1.4% 1.8% 354 3.6% 1.2% 5,441Government 1.6% -0.3% 1,494 3.2% 0.6% 22,018Total -2.9% 1.1% 8,434 -1.8% 2.3% 132,297
*Average nonagricultural employment for five months ended May 2001, 2003, and 2005 (not seasonally adjusted)
0%
2%
4%
6%
8%
10%
2001 2003 2005
4.4 4.5
5.46.1
6.6
8.4
5.45.1
5.8
New York City
United States
New York State
Unemployment RateNYS, US and NYC as of May of each year
-6% -5% -4% -3% -2% -1% 0% 1% 2% 3% 4%
2001-2003
2003-2005
Change in Employment by Major Area
Other Upstate Cities
Syracuse
Rochester
Mid-Hudson Valley
Buffalo
Albany
Westchester-Rockland-Putnam
Nassau-Suffolk
New York City
*Comparison covers averagenonagricultural employment levelsfor the first five months endedMay 2001, 2003, and 2005(not seasonally adjusted).
12 OFFICE OF THE STATE COMPTROLLER • ALAN G. HEVESI
■ The economic health of both New York State and New York City is tied to the securities industry. Everysecurities industry job added in New York City creates two other new jobs in the City and one job inthe City suburbs. The 1990s bull market lifted employment, incomes, and tax revenues for the State andCity. The bear market that began when prices collapsed in the technology sector, however, causedsecurities industry profits to fall from arecord high of $21 billion in 2000 to $7billion by 2002. Bonuses paid to WallStreet workers fell by 48% between 2000and 2002. These declines, coupled withlower capital gains realizations resultingfrom the falling financial markets,adversely impacted State and City rev-enue collections, especially the personalincome tax.
■ Since the end of 2002, the financial mar-kets have recovered. Securities industryprofits rose to $16.8 billion (the second-highest level on record) in 2003 buteased to $13.7 billion in 2004. Despitethe decline in profits during 2004, bonus-es are estimated to have increased bymore than 50% from 2002 levels, con-tributing to an improvement in revenuecollections.
■ Salaries are highest in the securities industry, which paid an average salary of $217,473 in 2003. In therest of the financial sector the average salary was $59,307, while nonfinancial industries paid an aver-age of $42,092. The securities industry represented only 2.1% of all jobs in the State in 2003, butaccounted for 9.8% of the total compensation paid. The gap between the salaries in the securitiesindustry and the nonfinancial industries has also been growing. Since the early 1990s, salaries in thesecurities industry have increased, from 2.9 times higher than nonfinancial salaries to 5.2 times thosesalaries in 2003. Securities industry employment is even more important in New York City, where 90%of the industry’s jobs in the State are located. During 2003, the securities industry comprised 4.6% of alljobs in the City, but accounted for 17.3% of all wages paid in the City.
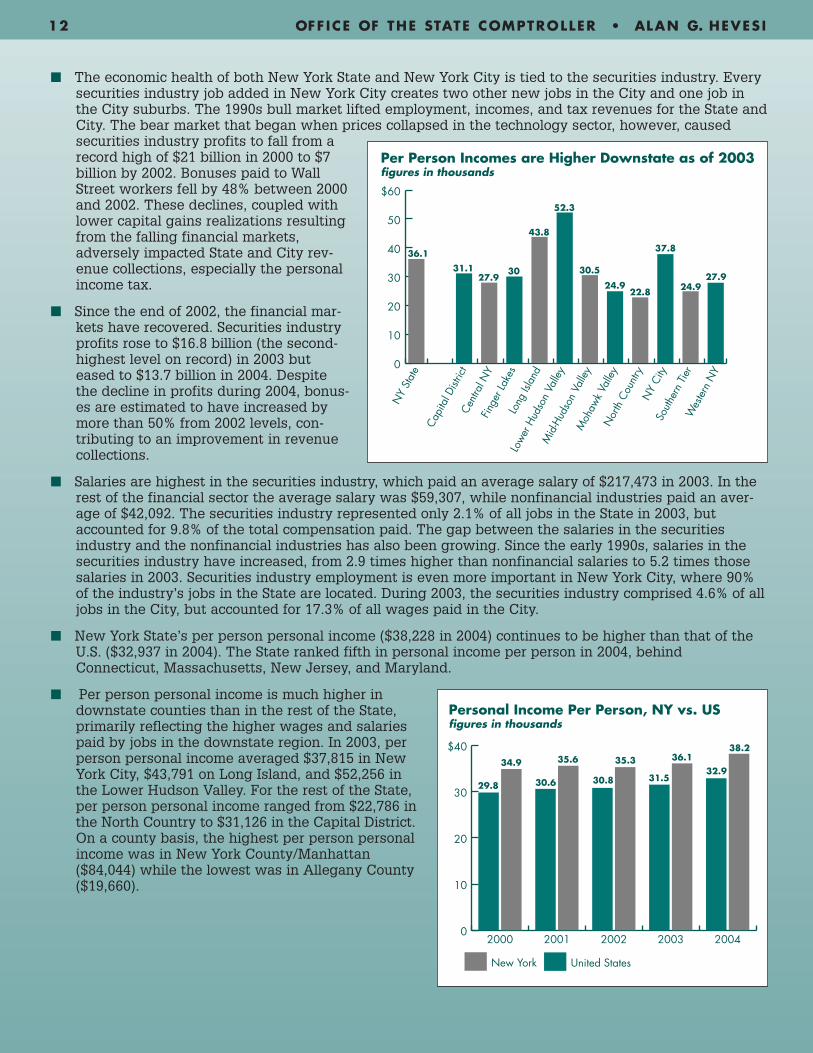
■ New York State’s per person personal income ($38,228 in 2004) continues to be higher than that of theU.S. ($32,937 in 2004). The State ranked fifth in personal income per person in 2004, behindConnecticut, Massachusetts, New Jersey, and Maryland.
■ Per person personal income is much higher indownstate counties than in the rest of the State,primarily reflecting the higher wages and salariespaid by jobs in the downstate region. In 2003, perperson personal income averaged $37,815 in NewYork City, $43,791 on Long Island, and $52,256 inthe Lower Hudson Valley. For the rest of the State,per person personal income ranged from $22,786 inthe North Country to $31,126 in the Capital District.On a county basis, the highest per person personalincome was in New York County/Manhattan($84,044) while the lowest was in Allegany County($19,660).
0
10
20
30
$40
New York United States
20042003200220012000
Personal Income Per Person, NY vs. USfigures in thousands
29.8
34.9
30.6
35.6
30.8
35.3
31.5
36.132.9
38.2
0
10
20
30
40
50
$60
Wes
tern
NY
Sout
hern
Tier
NY
City
Nor
th C
ount
ry
Moh
awk
Valle
y
Mid
-Hud
son
Valle
y
Low
er H
udso
n Va
lley
Long
Isla
nd
Finge
r Lak
es
Cent
ral N
Y
Capi
tal D
istric
t
NY
Stat
e
36.1
31.127.9
30
43.8
52.3
30.5
24.922.8
37.8
24.927.9
Per Person Incomes are Higher Downstate as of 2003figures in thousands
2005 F INANCIAL CONDIT ION REPORT 13
TAXES: WHERE NEW YORK STANDS
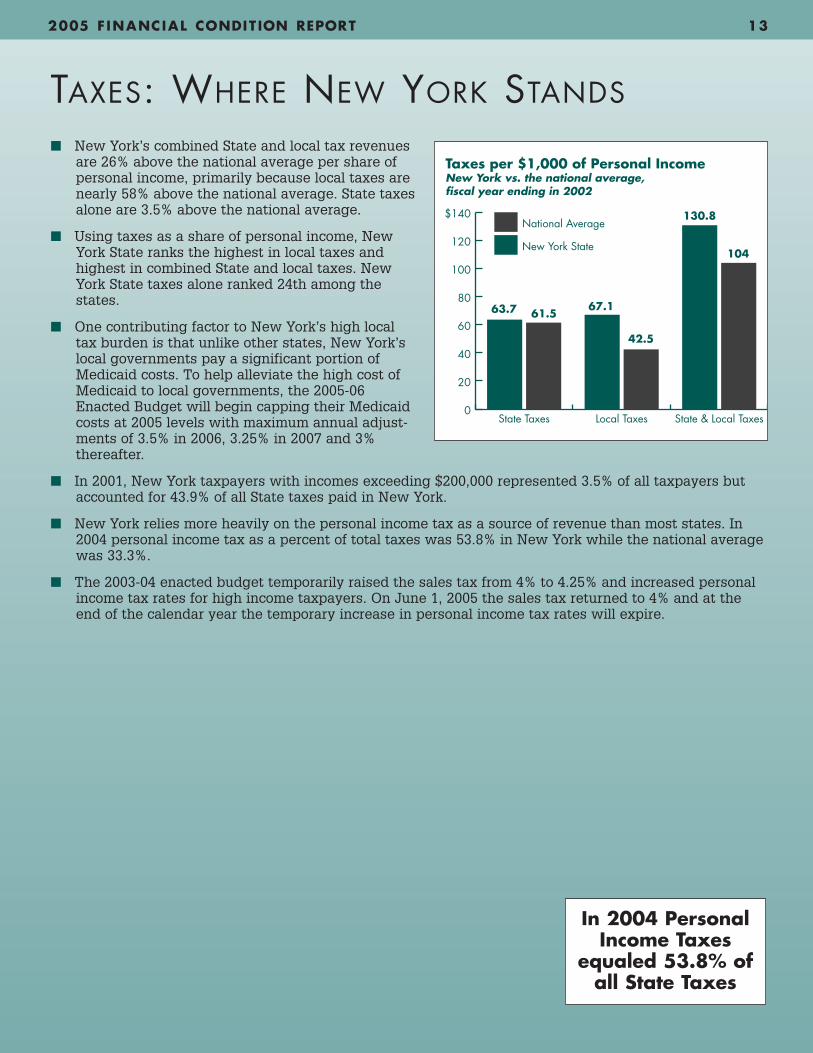
■ New York’s combined State and local tax revenuesare 26% above the national average per share ofpersonal income, primarily because local taxes arenearly 58% above the national average. State taxesalone are 3.5% above the national average.
■ Using taxes as a share of personal income, NewYork State ranks the highest in local taxes andhighest in combined State and local taxes. NewYork State taxes alone ranked 24th among thestates.
■ One contributing factor to New York’s high localtax burden is that unlike other states, New York’slocal governments pay a significant portion ofMedicaid costs. To help alleviate the high cost ofMedicaid to local governments, the 2005-06Enacted Budget will begin capping their Medicaidcosts at 2005 levels with maximum annual adjust-ments of 3.5% in 2006, 3.25% in 2007 and 3%thereafter.
■ In 2001, New York taxpayers with incomes exceeding $200,000 represented 3.5% of all taxpayers butaccounted for 43.9% of all State taxes paid in New York.
■ New York relies more heavily on the personal income tax as a source of revenue than most states. In2004 personal income tax as a percent of total taxes was 53.8% in New York while the national averagewas 33.3%.
■ The 2003-04 enacted budget temporarily raised the sales tax from 4% to 4.25% and increased personalincome tax rates for high income taxpayers. On June 1, 2005 the sales tax returned to 4% and at theend of the calendar year the temporary increase in personal income tax rates will expire.
0
20
40
60
80
100
120
$140National Average
New York State
State & Local TaxesLocal TaxesState Taxes
Taxes per $1,000 of Personal IncomeNew York vs. the national average,fiscal year ending in 2002
63.7 61.567.1
42.5
130.8
104
In 2004 PersonalIncome Taxes
equaled 53.8% ofall State Taxes

14 OFFICE OF THE STATE COMPTROLLER • ALAN G. HEVESI
DEBT
Debt can impact government operations both cur-rently and in the long term. The following discus-sion is limited to debt from borrowing. Existence ofhigh levels of government borrowing may:
• Indicate that the State is unable to support cur-rent programs with current revenues;
• Force future program reductions or additionalborrowing when future resources are needed torepay debt; and
• Limit capacity to finance additional capitalassets and capital grants.
■ There are several different measurements of theState's debt being reported at March 31, 2005:
• Constitutionally recognized (Voter-approved)general obligation debt ($3.7 billion);
• Debt as statutorily defined in 2000 — State-sup-ported ($40.7 billion);
• Debt reported in accordance with full accrualaccounting — Generally Accepted AccountingPrinciples ($47.5 billion); and
• State-funded debt (primary repayment sources arefuture State funds ($48.2 billion)). This category hasbeen defined by the State Comptroller as a signifi-cant measurement because it reflects more directlyon the State's capacity to issue additional debt inthe most comprehensive fashion.
■ The differences between debt reported under theState-funded measurement criteria and debt report-ed under GAAP are: State-funded debt includes$2.6 billion in debt issued in fiscal year 2005 thatwill be repaid from future sales tax revenues of theState but that is not recognized under GAAP; andalso debt reported under GAAP includes bond pre-miums ($991 million), appreciation of certain debtsissued at a discount ($287 million), and vendorfinanced capital lease obligations ($376 million) that is not included in the State-funded criteria.
■ Since 2001, debt recognized under the State Constitution (Voter-approved) has decreased 14%, debt recognized under the Debt Reform Actof 2000 has increased 10%, debt recognized in accordance with GAAP hasincreased 29%, and State-funded debt has increased 30%.
■ In 2004, New York State became the 2nd most indebted state behindCalifornia but still had nearly twice as much debt as the 3rd most indebt-ed state. In 2004, New York State also ranked 5th among all states in debtper person.
■ At March 31, 2005, New York's outstanding debt per person was $2,473which was equal to 6.5% of New Yorkers' personal income.
0
10
20
30
40
$50State-fundedReported Under GAAP
Recognized by Statute
Constitutional Debt (General Obligation)New York’s Debtfigures in billions
20052004200320022001
3%
4%
5%
6%
7%
20052004200320022001
Total State Debt (GAAP Basis)as a percentage of personal income
5.4 5.55.7
6.4 6.5
The State has committed to funding debt service for
$48.2 billion in debt outstanding.

2005 F INANCIAL CONDIT ION REPORT 15
■ The State’s general obligation bond ratings assigned areas follows: A1 by Moody’s Investor Service, AA- by FitchRatings, and AA by Standard & Poor's.
■ Debt service expenditures over the past five years havebeen affected by the use of reserve funds used to paydebt service and deferring debt service during refund-ings. During the past three years the State engaged in aseries of refunding transactions totaling about $16 billionwhich refinanced portions of both the principal due in thecurrent and near terms and interest accrued on certainrefunded debt.
■ The ability of the State to issue new debt relates to howrapidly existing debt is repaid. As existing debt is repaid,borrowing capacity is restored.
■ The graphat the leftillustrates therapidity of therepayment ofNew YorkState's entire debt portfolio based upon bond maturity dates.The graph shows the par amounts of bonds currently out-standing that will be repaid during each of the next five yearperiods.
■ The State's currently proposed Capital Program &Financing Plan relies upon issuing $19.7 billion of new debtand $3.2 billion in additional restructuring debt during thefive years ending March 31, 2010. Thus, the State plans toissue new debt faster than it will retire existing debt.
■ The State has used 53.5% of the debt it issued to financecapital assets it owns, 20.7% to finance budget deficits, and25.2% to finance grants that were once funded on a pay-as-you-go basis.
■ Based upon scheduled repayment dates, the State's accumulated deficit financing will not be fully repaiduntil 2028.
■ The State has relied upon variable rate debt andinterest rate exchange agreements (swaps) to lowerthe cost of borrowing and facilitate restructuring ofits portfolio of debt. At March 31, 2005, the Statehad $6 billion in variable-to-fixed-rate swaps, $850million of fixed-to-variable rate swaps, $2.1 billionin net (un-hedged) variable rate bonds outstanding,and $2.4 in convertible bonds whose interest ratesreset to either a new fixed or a new variable rate atdates ranging from 2005 to 2013.
Only about half of the State's debtwas issued to finance a State
capital asset.
Financed Budgetary Deficits
Provided Budget Relief
Financed Capital Grants to Others
Invested In State Capital Assets
20.7%
25.2%
0.6%
53.5%
State Debt by Major Purpose (GAAP Basis)excluding capital leases
0
3
6
9
12
$15
2031-2035
2026-2030
2021-2025
2016-2020
2011-2015
2006-2010
Rapidity of Repayment of Debtbased upon principal maturitiesfigures in billions
11.412.2
11.0
7.5
2.7
0.8
0
1
2
3
4
$5Budgetary Basis
GAAP Basis
20052004200320022001
Debt Servicefigures in billions
4.44.1
3.74.0
4.34.1 4.1
3.03.4
3.8
Note: Budgetary based debt service does not include $346 millionin debt service on Tobacco Revenue Bonds or Prior Year SchoolAid Claim Bonds included in the 2005 GAAP figure.
16 OFFICE OF THE STATE COMPTROLLER • ALAN G. HEVESI
CAPITAL
A deterioration in capital assets can havea direct impact on the State’s economy andits ability to attract and retain business.Capital assets not only include highwaysand bridges, but also include education,government, health and recreation facilities.
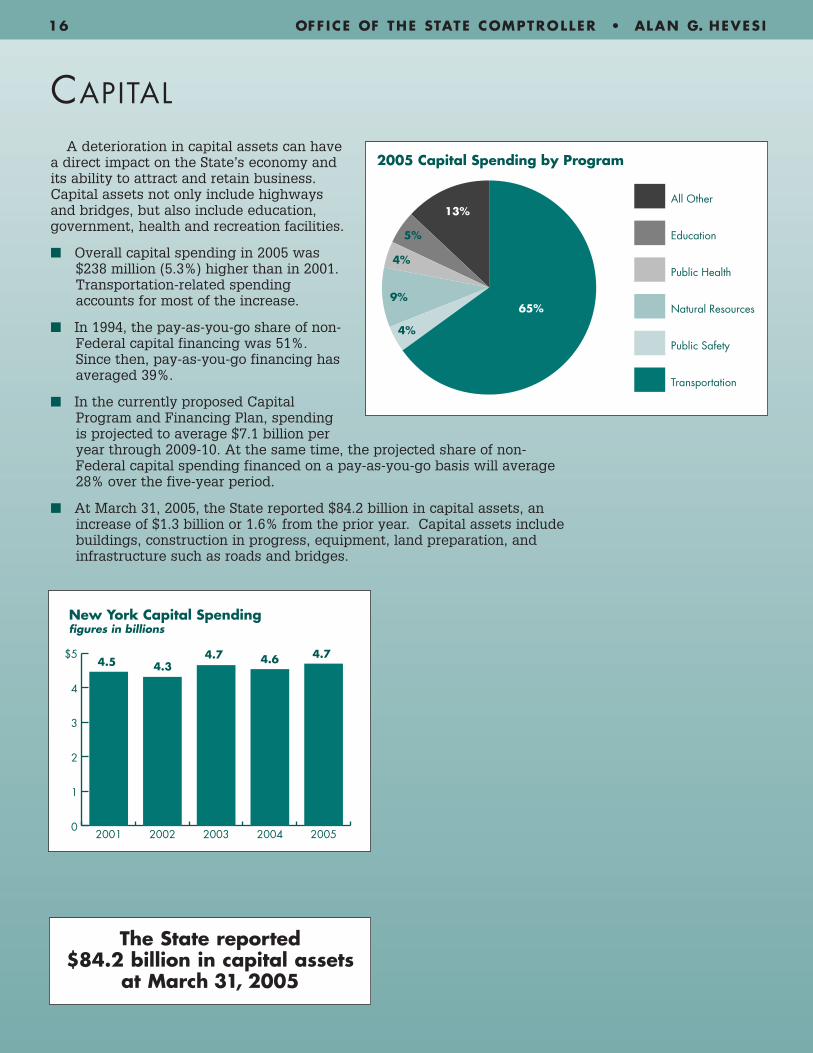
■ Overall capital spending in 2005 was$238 million (5.3%) higher than in 2001.Transportation-related spendingaccounts for most of the increase.
■ In 1994, the pay-as-you-go share of non-Federal capital financing was 51%.Since then, pay-as-you-go financing hasaveraged 39%.
■ In the currently proposed CapitalProgram and Financing Plan, spendingis projected to average $7.1 billion peryear through 2009-10. At the same time, the projected share of non-Federal capital spending financed on a pay-as-you-go basis will average28% over the five-year period.
■ At March 31, 2005, the State reported $84.2 billion in capital assets, anincrease of $1.3 billion or 1.6% from the prior year. Capital assets includebuildings, construction in progress, equipment, land preparation, andinfrastructure such as roads and bridges.
0
1
2
3
4
$5
20052004200320022001
New York Capital Spendingfigures in billions
4.5 4.34.7 4.6 4.7
All Other
Education
Public Health
Natural Resources
Public Safety
Transportation
65%
4%
9%
4%
5%
13%
2005 Capital Spending by Program
The State reported $84.2 billion in capital assets
at March 31, 2005
2005 F INANCIAL CONDIT ION REPORT 17
ROADS AND BRIDGES
Data on the condition of highways and bridges, as provided by the State Department of Transportation,provide insight into the quality of infrastructure which is used daily by residents and businesses.
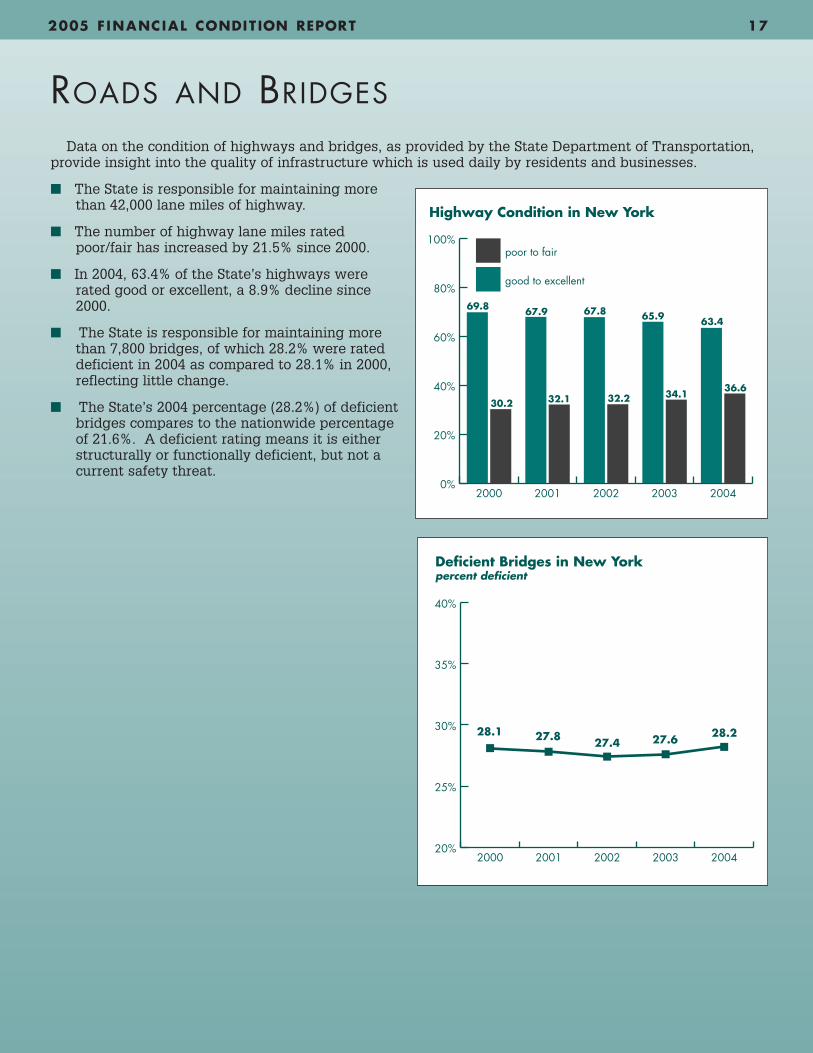
■ The State is responsible for maintaining morethan 42,000 lane miles of highway.
■ The number of highway lane miles ratedpoor/fair has increased by 21.5% since 2000.
■ In 2004, 63.4% of the State’s highways wererated good or excellent, a 8.9% decline since2000.
■ The State is responsible for maintaining morethan 7,800 bridges, of which 28.2% were rateddeficient in 2004 as compared to 28.1% in 2000,reflecting little change.
■ The State’s 2004 percentage (28.2%) of deficientbridges compares to the nationwide percentageof 21.6%. A deficient rating means it is eitherstructurally or functionally deficient, but not acurrent safety threat.
20%
25%
30%
35%
40%
20042003200220012000
Deficient Bridges in New Yorkpercent deficient
28.1 27.8 27.4 27.6 28.2
0%
20%
40%
60%
80%
100%poor to fair
good to excellent
20042003200220012000
Highway Condition in New York
69.8
30.2
67.9 67.8 65.9 63.4
32.1 32.2 34.136.6
18 OFFICE OF THE STATE COMPTROLLER • ALAN G. HEVESI
LOCAL GOVERNMENTS
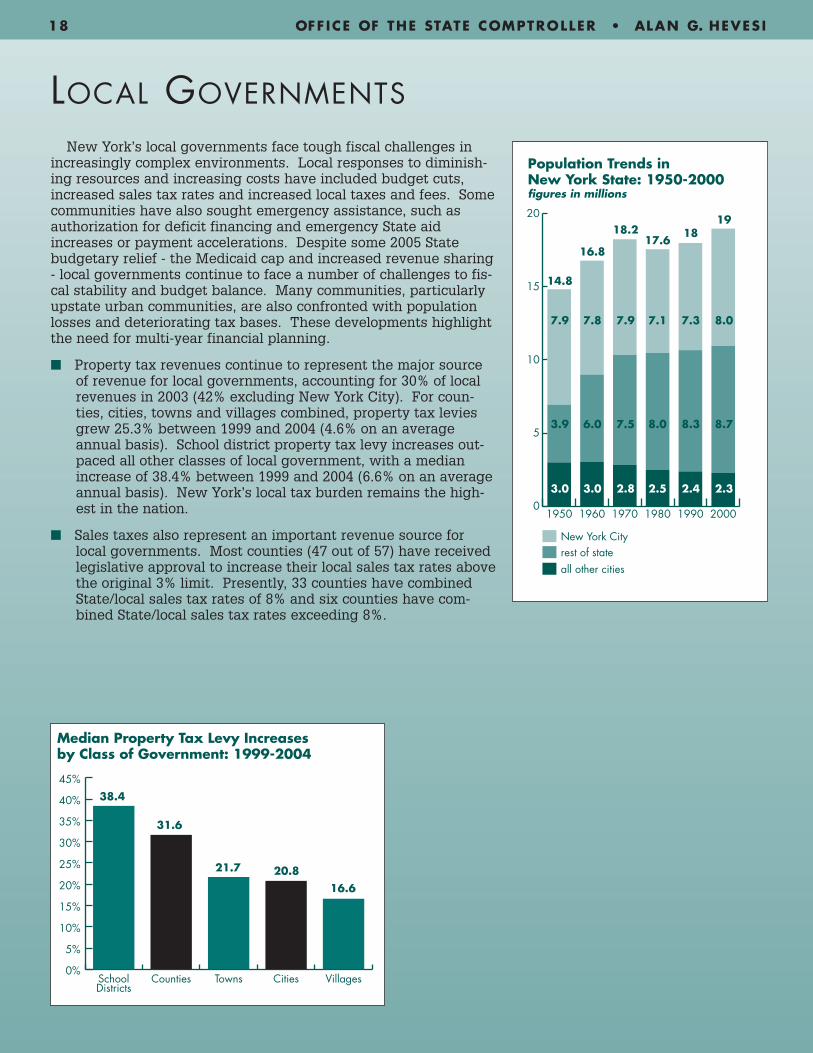
New York’s local governments face tough fiscal challenges inincreasingly complex environments. Local responses to diminish-ing resources and increasing costs have included budget cuts,increased sales tax rates and increased local taxes and fees. Somecommunities have also sought emergency assistance, such asauthorization for deficit financing and emergency State aidincreases or payment accelerations. Despite some 2005 Statebudgetary relief - the Medicaid cap and increased revenue sharing- local governments continue to face a number of challenges to fis-cal stability and budget balance. Many communities, particularlyupstate urban communities, are also confronted with populationlosses and deteriorating tax bases. These developments highlightthe need for multi-year financial planning.
■ Property tax revenues continue to represent the major sourceof revenue for local governments, accounting for 30% of localrevenues in 2003 (42% excluding New York City). For coun-ties, cities, towns and villages combined, property tax leviesgrew 25.3% between 1999 and 2004 (4.6% on an averageannual basis). School district property tax levy increases out-paced all other classes of local government, with a medianincrease of 38.4% between 1999 and 2004 (6.6% on an averageannual basis). New York’s local tax burden remains the high-est in the nation.
■ Sales taxes also represent an important revenue source forlocal governments. Most counties (47 out of 57) have receivedlegislative approval to increase their local sales tax rates abovethe original 3% limit. Presently, 33 counties have combinedState/local sales tax rates of 8% and six counties have com-bined State/local sales tax rates exceeding 8%.
0%
5%
10%
15%
20%
25%
30%
35%
40%
45%
VillagesCitiesTownsCountiesSchoolDistricts
Median Property Tax Levy Increasesby Class of Government: 1999-2004
38.4
31.6
21.7 20.816.6
0
5
10
15
20
New York City rest of stateall other cities
200019901980197019601950
Population Trends inNew York State: 1950-2000figures in millions
3.9
7.9
3.0
6.0
7.8
3.0
7.5
7.9
2.8
8.0
7.1
2.5
8.3
7.3
2.4
8.7
14.8
16.8
18.217.6
1819
8.0
2.3
2005 F INANCIAL CONDIT ION REPORT 19
0%
10%
20%
30%
40%
50%
60%
70%
80%Medicaid as a percent ofproperty tax levy
Medicaid as a percent ofcounty general fund expenditures
20031993
14
40
73
19
Medicaid Expenditures
0
20
40
60
$80
2008-092007-082006-072005-06
RochesterSyracuseBuffalo
General Fund Out-Year Gaps in Large Upstate Citiesfigures in millions
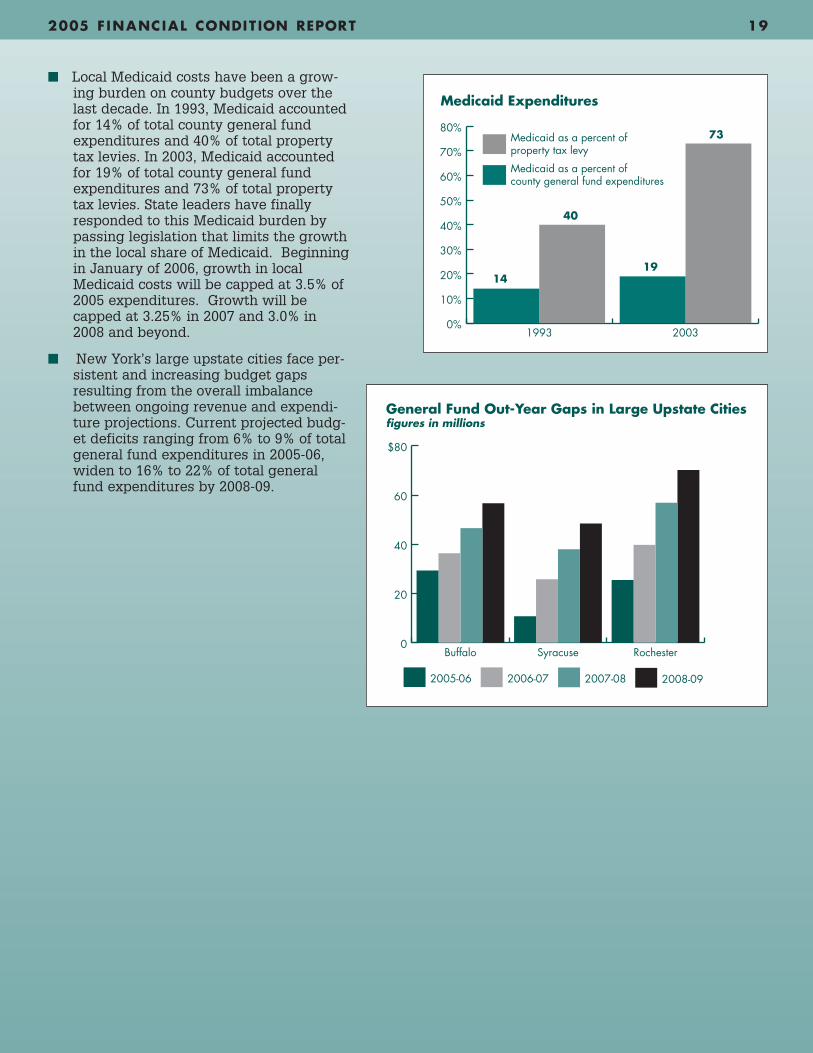
■ Local Medicaid costs have been a grow-ing burden on county budgets over thelast decade. In 1993, Medicaid accountedfor 14% of total county general fundexpenditures and 40% of total propertytax levies. In 2003, Medicaid accountedfor 19% of total county general fundexpenditures and 73% of total propertytax levies. State leaders have finallyresponded to this Medicaid burden bypassing legislation that limits the growthin the local share of Medicaid. Beginningin January of 2006, growth in localMedicaid costs will be capped at 3.5% of2005 expenditures. Growth will becapped at 3.25% in 2007 and 3.0% in2008 and beyond.
■ New York’s large upstate cities face per-sistent and increasing budget gapsresulting from the overall imbalancebetween ongoing revenue and expendi-ture projections. Current projected budg-et deficits ranging from 6% to 9% of totalgeneral fund expenditures in 2005-06,widen to 16% to 22% of total generalfund expenditures by 2008-09.
20 OFFICE OF THE STATE COMPTROLLER • ALAN G. HEVESI
IMPLICATIONS FORTHE FUTURE
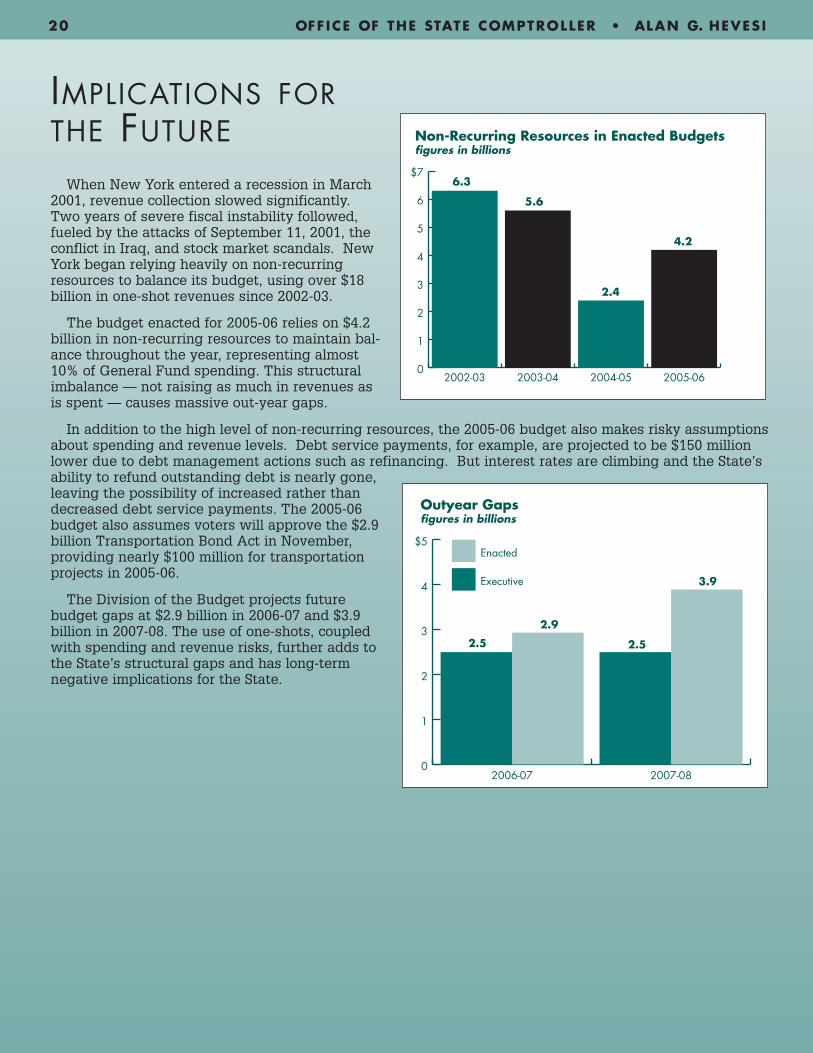
When New York entered a recession in March2001, revenue collection slowed significantly.Two years of severe fiscal instability followed,fueled by the attacks of September 11, 2001, theconflict in Iraq, and stock market scandals. NewYork began relying heavily on non-recurringresources to balance its budget, using over $18billion in one-shot revenues since 2002-03.
The budget enacted for 2005-06 relies on $4.2billion in non-recurring resources to maintain bal-ance throughout the year, representing almost10% of General Fund spending. This structuralimbalance — not raising as much in revenues asis spent — causes massive out-year gaps.
In addition to the high level of non-recurring resources, the 2005-06 budget also makes risky assumptionsabout spending and revenue levels. Debt service payments, for example, are projected to be $150 millionlower due to debt management actions such as refinancing. But interest rates are climbing and the State’sability to refund outstanding debt is nearly gone,leaving the possibility of increased rather thandecreased debt service payments. The 2005-06budget also assumes voters will approve the $2.9billion Transportation Bond Act in November,providing nearly $100 million for transportationprojects in 2005-06.
The Division of the Budget projects futurebudget gaps at $2.9 billion in 2006-07 and $3.9billion in 2007-08. The use of one-shots, coupledwith spending and revenue risks, further adds tothe State’s structural gaps and has long-termnegative implications for the State.
0
1
2
3
4
$5Enacted
Executive
2007-082006-07
Outyear Gapsfigures in billions
3.9
2.5
2.9
2.5
0
1
2
3
4
5
6
$7
2005-062004-052003-042002-03
Non-Recurring Resources in Enacted Budgetsfigures in billions
6.3
5.6
2.4
4.2
2005 F INANCIAL CONDIT ION REPORT 21
0% 10% 20% 30% 40% 50% 60% 70%
Wyoming
South Dakota
Massachusetts
Florida
California
Nation
New York
Illinois
Pennsylvania
Texas
New Jersey
Ohio
Georgia
Rainy Day Funds of States With General Fund Budgets Exceeding $15 Billion: Fiscal Year 2004
0.3
0.8
1.1
1.2
1.2
1.2
1.9
2.8
3.8
4.2
4.7
18.5
63.5
1 Note that Wyoming budgets on a biennial basis.
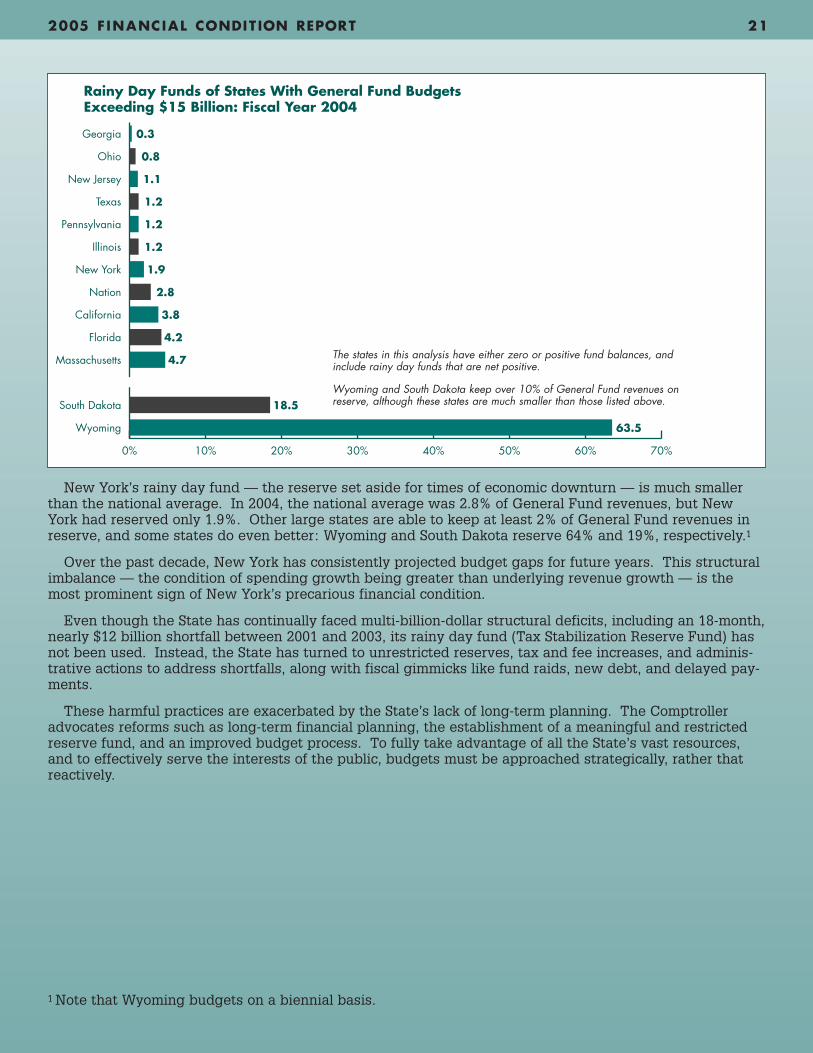
New York’s rainy day fund — the reserve set aside for times of economic downturn — is much smallerthan the national average. In 2004, the national average was 2.8% of General Fund revenues, but NewYork had reserved only 1.9%. Other large states are able to keep at least 2% of General Fund revenues inreserve, and some states do even better: Wyoming and South Dakota reserve 64% and 19%, respectively.1
Over the past decade, New York has consistently projected budget gaps for future years. This structuralimbalance — the condition of spending growth being greater than underlying revenue growth — is themost prominent sign of New York’s precarious financial condition.
Even though the State has continually faced multi-billion-dollar structural deficits, including an 18-month,nearly $12 billion shortfall between 2001 and 2003, its rainy day fund (Tax Stabilization Reserve Fund) hasnot been used. Instead, the State has turned to unrestricted reserves, tax and fee increases, and adminis-trative actions to address shortfalls, along with fiscal gimmicks like fund raids, new debt, and delayed pay-ments.
These harmful practices are exacerbated by the State’s lack of long-term planning. The Comptrolleradvocates reforms such as long-term financial planning, the establishment of a meaningful and restrictedreserve fund, and an improved budget process. To fully take advantage of all the State’s vast resources,and to effectively serve the interests of the public, budgets must be approached strategically, rather thatreactively.
The states in this analysis have either zero or positive fund balances, andinclude rainy day funds that are net positive.
Wyoming and South Dakota keep over 10% of General Fund revenues onreserve, although these states are much smaller than those listed above.
22 OFFICE OF THE STATE COMPTROLLER • ALAN G. HEVESI
NEW YORK’S PUBLIC AUTHORITIES
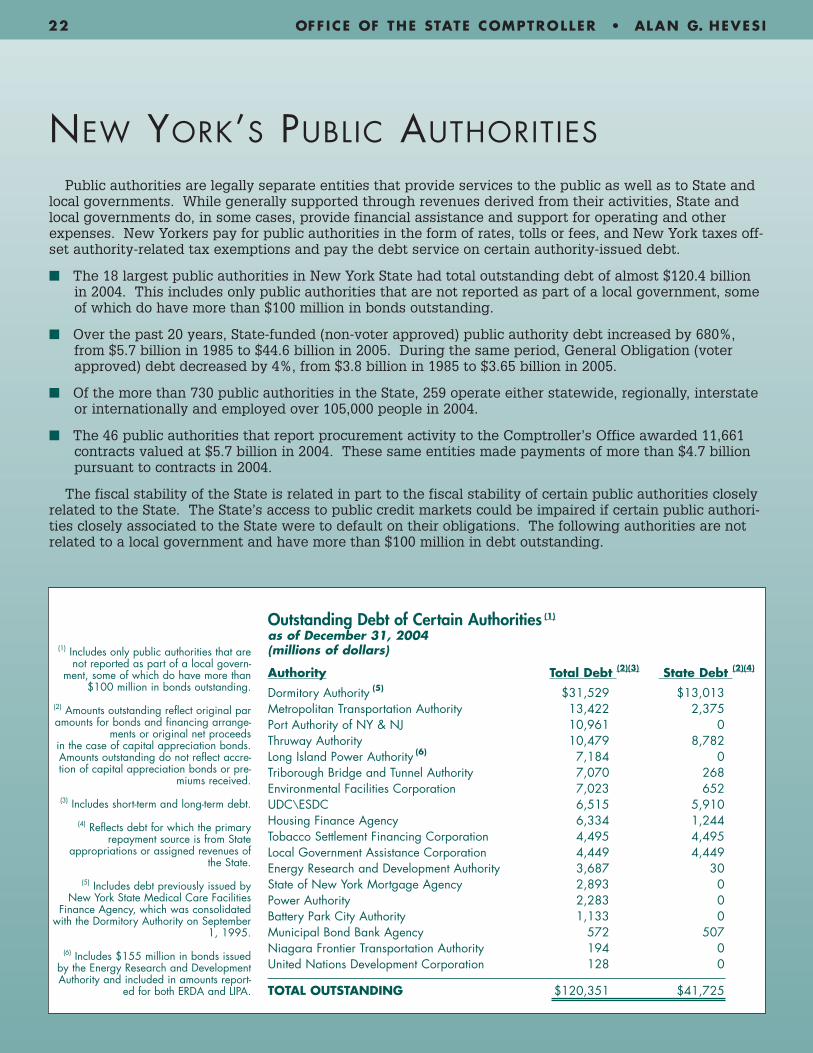
Public authorities are legally separate entities that provide services to the public as well as to State andlocal governments. While generally supported through revenues derived from their activities, State andlocal governments do, in some cases, provide financial assistance and support for operating and otherexpenses. New Yorkers pay for public authorities in the form of rates, tolls or fees, and New York taxes off-set authority-related tax exemptions and pay the debt service on certain authority-issued debt.
■ The 18 largest public authorities in New York State had total outstanding debt of almost $120.4 billionin 2004. This includes only public authorities that are not reported as part of a local government, someof which do have more than $100 million in bonds outstanding.
■ Over the past 20 years, State-funded (non-voter approved) public authority debt increased by 680%,from $5.7 billion in 1985 to $44.6 billion in 2005. During the same period, General Obligation (voterapproved) debt decreased by 4%, from $3.8 billion in 1985 to $3.65 billion in 2005.
■ Of the more than 730 public authorities in the State, 259 operate either statewide, regionally, interstateor internationally and employed over 105,000 people in 2004.
■ The 46 public authorities that report procurement activity to the Comptroller’s Office awarded 11,661contracts valued at $5.7 billion in 2004. These same entities made payments of more than $4.7 billionpursuant to contracts in 2004.
The fiscal stability of the State is related in part to the fiscal stability of certain public authorities closelyrelated to the State. The State’s access to public credit markets could be impaired if certain public authori-ties closely associated to the State were to default on their obligations. The following authorities are notrelated to a local government and have more than $100 million in debt outstanding.
Outstanding Debt of Certain Authorities (1)
as of December 31, 2004(millions of dollars)
Authority Total Debt (2)(3) State Debt (2)(4)
Dormitory Authority (5) $31,529 $13,013 Metropolitan Transportation Authority 13,422 2,375 Port Authority of NY & NJ 10,961 0 Thruway Authority 10,479 8,782 Long Island Power Authority (6) 7,184 0 Triborough Bridge and Tunnel Authority 7,070 268 Environmental Facilities Corporation 7,023 652UDC\ESDC 6,515 5,910Housing Finance Agency 6,334 1,244 Tobacco Settlement Financing Corporation 4,495 4,495 Local Government Assistance Corporation 4,449 4,449 Energy Research and Development Authority 3,687 30 State of New York Mortgage Agency 2,893 0 Power Authority 2,283 0 Battery Park City Authority 1,133 0 Municipal Bond Bank Agency 572 507 Niagara Frontier Transportation Authority 194 0 United Nations Development Corporation 128 0
TOTAL OUTSTANDING $120,351 $41,725
(1) Includes only public authorities that arenot reported as part of a local govern-
ment, some of which do have more than$100 million in bonds outstanding.
(2) Amounts outstanding reflect original paramounts for bonds and financing arrange-
ments or original net proceeds in the case of capital appreciation bonds.Amounts outstanding do not reflect accre-tion of capital appreciation bonds or pre-
miums received.
(3) Includes short-term and long-term debt.
(4) Reflects debt for which the primaryrepayment source is from State
appropriations or assigned revenues ofthe State.
(5) Includes debt previously issued by New York State Medical Care Facilities
Finance Agency, which was consolidatedwith the Dormitory Authority on September
1, 1995.
(6) Includes $155 million in bonds issuedby the Energy Research and DevelopmentAuthority and included in amounts report-
ed for both ERDA and LIPA.
2005 F INANCIAL CONDIT ION REPORT 23
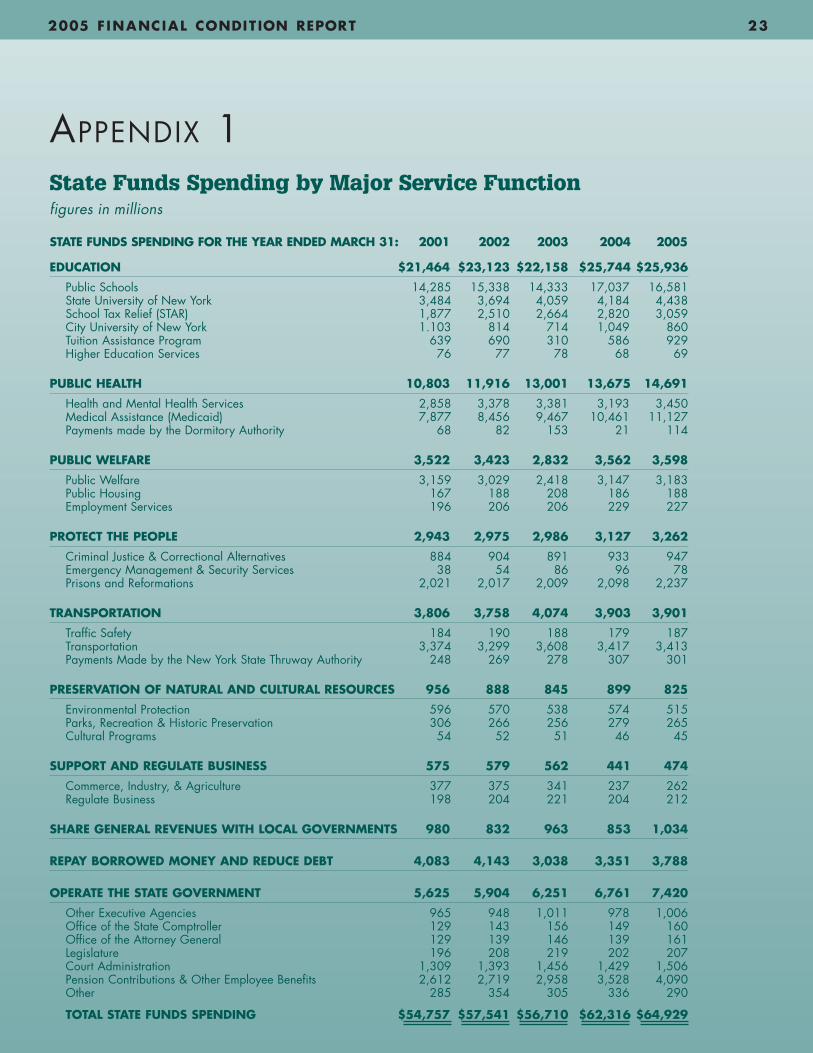
STATE FUNDS SPENDING FOR THE YEAR ENDED MARCH 31: 2001 2002 2003 2004 2005
EDUCATION $21,464 $23,123 $22,158 $25,744 $25,936
Public Schools 14,285 15,338 14,333 17,037 16,581State University of New York 3,484 3,694 4,059 4,184 4,438School Tax Relief (STAR) 1,877 2,510 2,664 2,820 3,059City University of New York 1.103 814 714 1,049 860Tuition Assistance Program 639 690 310 586 929Higher Education Services 76 77 78 68 69
PUBLIC HEALTH 10,803 11,916 13,001 13,675 14,691
Health and Mental Health Services 2,858 3,378 3,381 3,193 3,450Medical Assistance (Medicaid) 7,877 8,456 9,467 10,461 11,127Payments made by the Dormitory Authority 68 82 153 21 114
PUBLIC WELFARE 3,522 3,423 2,832 3,562 3,598
Public Welfare 3,159 3,029 2,418 3,147 3,183Public Housing 167 188 208 186 188Employment Services 196 206 206 229 227
PROTECT THE PEOPLE 2,943 2,975 2,986 3,127 3,262
Criminal Justice & Correctional Alternatives 884 904 891 933 947Emergency Management & Security Services 38 54 86 96 78Prisons and Reformations 2,021 2,017 2,009 2,098 2,237
TRANSPORTATION 3,806 3,758 4,074 3,903 3,901
Traffic Safety 184 190 188 179 187Transportation 3,374 3,299 3,608 3,417 3,413Payments Made by the New York State Thruway Authority 248 269 278 307 301
PRESERVATION OF NATURAL AND CULTURAL RESOURCES 956 888 845 899 825
Environmental Protection 596 570 538 574 515Parks, Recreation & Historic Preservation 306 266 256 279 265Cultural Programs 54 52 51 46 45
SUPPORT AND REGULATE BUSINESS 575 579 562 441 474
Commerce, Industry, & Agriculture 377 375 341 237 262Regulate Business 198 204 221 204 212
SHARE GENERAL REVENUES WITH LOCAL GOVERNMENTS 980 832 963 853 1,034
REPAY BORROWED MONEY AND REDUCE DEBT 4,083 4,143 3,038 3,351 3,788
OPERATE THE STATE GOVERNMENT 5,625 5,904 6,251 6,761 7,420
Other Executive Agencies 965 948 1,011 978 1,006Office of the State Comptroller 129 143 156 149 160Office of the Attorney General 129 139 146 139 161Legislature 196 208 219 202 207Court Administration 1,309 1,393 1,456 1,429 1,506Pension Contributions & Other Employee Benefits 2,612 2,719 2,958 3,528 4,090Other 285 354 305 336 290
TOTAL STATE FUNDS SPENDING $54,757 $57,541 $56,710 $62,316 $64,929
APPENDIX 1State Funds Spending by Major Service Functionfigures in millions
24 OFFICE OF THE STATE COMPTROLLER • ALAN G. HEVESI
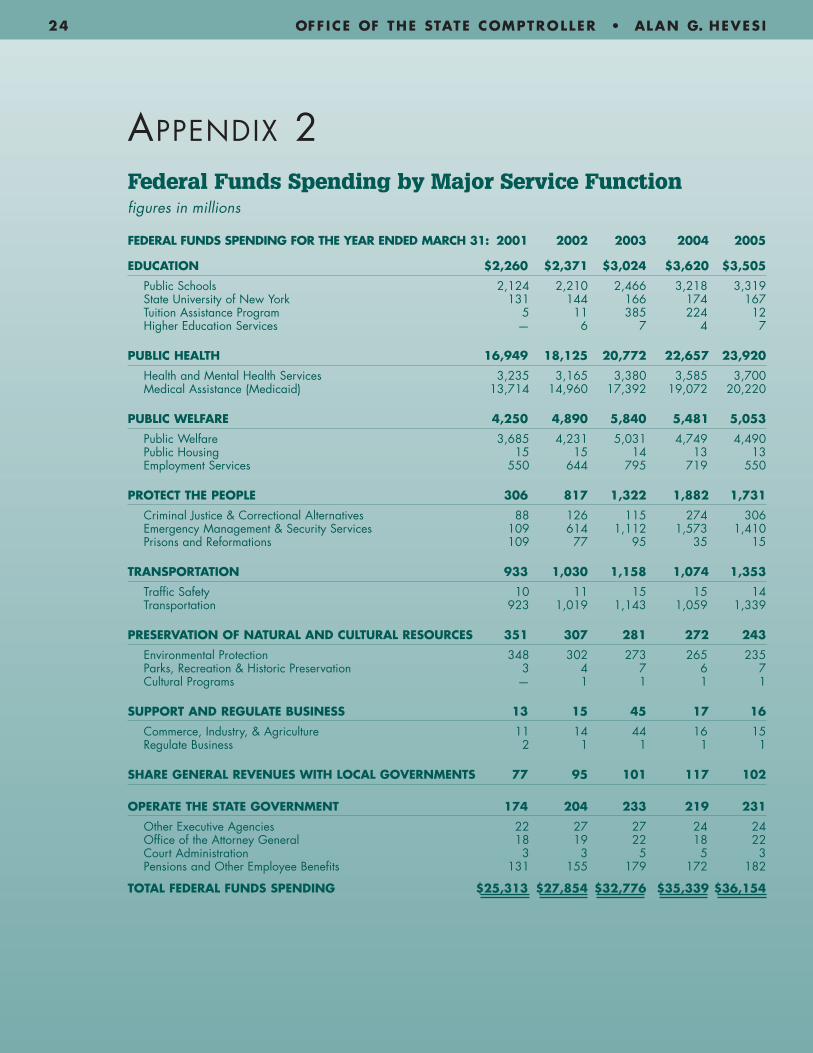
APPENDIX 2Federal Funds Spending by Major Service Functionfigures in millions
FEDERAL FUNDS SPENDING FOR THE YEAR ENDED MARCH 31: 2001 2002 2003 2004 2005
EDUCATION $2,260 $2,371 $3,024 $3,620 $3,505
Public Schools 2,124 2,210 2,466 3,218 3,319State University of New York 131 144 166 174 167Tuition Assistance Program 5 11 385 224 12Higher Education Services — 6 7 4 7
PUBLIC HEALTH 16,949 18,125 20,772 22,657 23,920
Health and Mental Health Services 3,235 3,165 3,380 3,585 3,700Medical Assistance (Medicaid) 13,714 14,960 17,392 19,072 20,220
PUBLIC WELFARE 4,250 4,890 5,840 5,481 5,053
Public Welfare 3,685 4,231 5,031 4,749 4,490Public Housing 15 15 14 13 13Employment Services 550 644 795 719 550
PROTECT THE PEOPLE 306 817 1,322 1,882 1,731
Criminal Justice & Correctional Alternatives 88 126 115 274 306Emergency Management & Security Services 109 614 1,112 1,573 1,410Prisons and Reformations 109 77 95 35 15
TRANSPORTATION 933 1,030 1,158 1,074 1,353
Traffic Safety 10 11 15 15 14Transportation 923 1,019 1,143 1,059 1,339
PRESERVATION OF NATURAL AND CULTURAL RESOURCES 351 307 281 272 243
Environmental Protection 348 302 273 265 235Parks, Recreation & Historic Preservation 3 4 7 6 7Cultural Programs — 1 1 1 1
SUPPORT AND REGULATE BUSINESS 13 15 45 17 16
Commerce, Industry, & Agriculture 11 14 44 16 15Regulate Business 2 1 1 1 1
SHARE GENERAL REVENUES WITH LOCAL GOVERNMENTS 77 95 101 117 102
OPERATE THE STATE GOVERNMENT 174 204 233 219 231
Other Executive Agencies 22 27 27 24 24Office of the Attorney General 18 19 22 18 22Court Administration 3 3 5 5 3Pensions and Other Employee Benefits 131 155 179 172 182
TOTAL FEDERAL FUNDS SPENDING $25,313 $27,854 $32,776 $35,339 $36,154
2005 F INANCIAL CONDIT ION REPORT 25
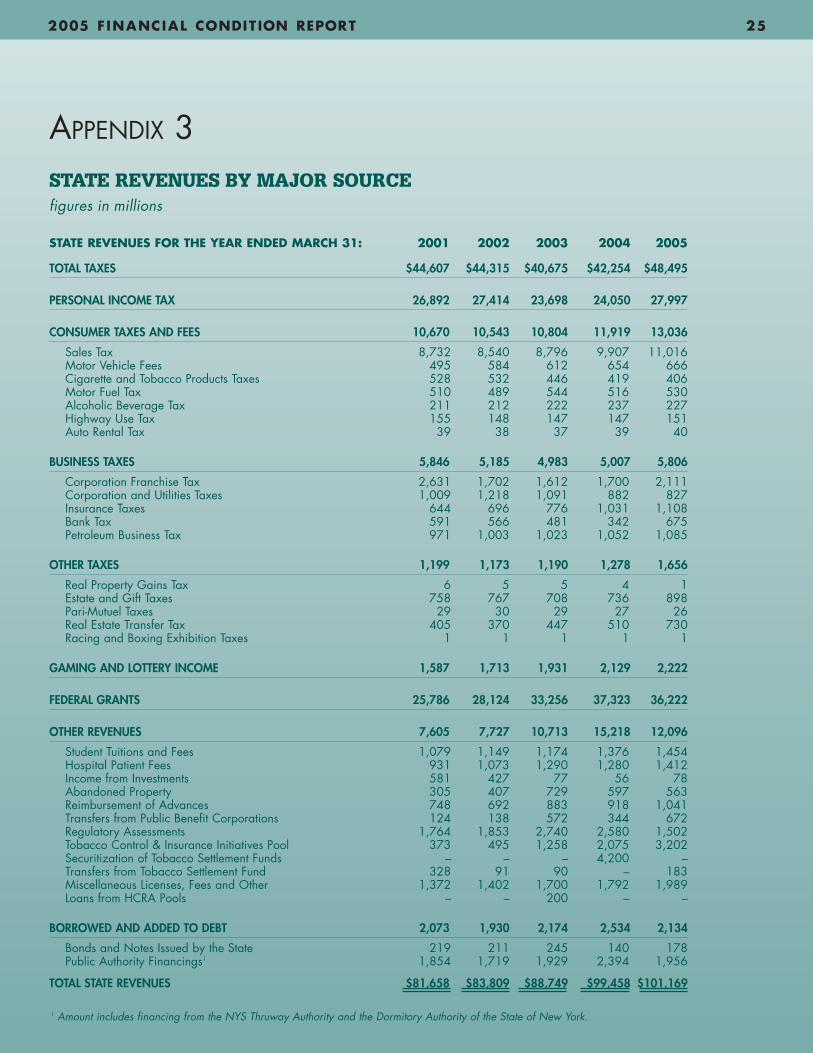
APPENDIX 3STATE REVENUES BY MAJOR SOURCEfigures in millions
STATE REVENUES FOR THE YEAR ENDED MARCH 31: 2001 2002 2003 2004 2005
TOTAL TAXES $44,607 $44,315 $40,675 $42,254 $48,495
PERSONAL INCOME TAX 26,892 27,414 23,698 24,050 27,997
CONSUMER TAXES AND FEES 10,670 10,543 10,804 11,919 13,036
Sales Tax 8,732 8,540 8,796 9,907 11,016Motor Vehicle Fees 495 584 612 654 666Cigarette and Tobacco Products Taxes 528 532 446 419 406Motor Fuel Tax 510 489 544 516 530Alcoholic Beverage Tax 211 212 222 237 227Highway Use Tax 155 148 147 147 151Auto Rental Tax 39 38 37 39 40
BUSINESS TAXES 5,846 5,185 4,983 5,007 5,806
Corporation Franchise Tax 2,631 1,702 1,612 1,700 2,111Corporation and Utilities Taxes 1,009 1,218 1,091 882 827Insurance Taxes 644 696 776 1,031 1,108Bank Tax 591 566 481 342 675Petroleum Business Tax 971 1,003 1,023 1,052 1,085
OTHER TAXES 1,199 1,173 1,190 1,278 1,656
Real Property Gains Tax 6 5 5 4 1Estate and Gift Taxes 758 767 708 736 898Pari-Mutuel Taxes 29 30 29 27 26Real Estate Transfer Tax 405 370 447 510 730Racing and Boxing Exhibition Taxes 1 1 1 1 1
GAMING AND LOTTERY INCOME 1,587 1,713 1,931 2,129 2,222
FEDERAL GRANTS 25,786 28,124 33,256 37,323 36,222
OTHER REVENUES 7,605 7,727 10,713 15,218 12,096
Student Tuitions and Fees 1,079 1,149 1,174 1,376 1,454Hospital Patient Fees 931 1,073 1,290 1,280 1,412Income from Investments 581 427 77 56 78Abandoned Property 305 407 729 597 563Reimbursement of Advances 748 692 883 918 1,041Transfers from Public Benefit Corporations 124 138 572 344 672Regulatory Assessments 1,764 1,853 2,740 2,580 1,502Tobacco Control & Insurance Initiatives Pool 373 495 1,258 2,075 3,202Securitization of Tobacco Settlement Funds – – – 4,200 –Transfers from Tobacco Settlement Fund 328 91 90 – 183Miscellaneous Licenses, Fees and Other 1,372 1,402 1,700 1,792 1,989Loans from HCRA Pools – – 200 – –
BORROWED AND ADDED TO DEBT 2,073 1,930 2,174 2,534 2,134
Bonds and Notes Issued by the State 219 211 245 140 178Public Authority Financings1 1,854 1,719 1,929 2,394 1,956
TOTAL STATE REVENUES $81,658 $83,809 $88,749 $99,458 $101,169
1 Amount includes financing from the NYS Thruway Authority and the Dormitory Authority of the State of New York.
CP r i n t e d o n R e c y c l e d Pa p e r
Data SourcesCampaign for Fiscal Equity
Grapevine Study, Illinois State University
Moody’s Investors Service
New York State Association of Counties
New York Stock Exchange
NYS Division of the Budget
NYS Department of Labor
NYS Department of Health
NYS Department of Taxation and Finance
NYS Department of Transportation
NYS Education Department
Office of the State Comptroller
State Ranking 2005 — A Statistical View of the 50 United States
The Fiscal Survey of States: June 2004, National Association of State Budget Officers
U.S. Commerce Department — Bureau of the Censusand Bureau of Economic Analysis
U.S. Department of Labor — Bureau of Labor Statistics
Comptroller’s Office of Public Information
110 State Street, 15th FloorAlbany, New York 12236
(518) 474-4015
www.osc.state.ny.us
e-mail:[email protected]
2005 COMPTROLLER ’S REPORT ON THE F INANC IAL CONDI T ION OF NEW YORK STATE